fisheries and oceans 2001-2004 corporate services business ... · march 02, 2001 fisheries and...
TRANSCRIPT
March 02, 2001
FISHERIES AND OCEANS
2001-2004 CORPORATE SERVICES BUSINESS PLAN
2
TABLE OF CONTENTS
Page PART A: MANDATED PROGRAMS
A1. Key Challenges................................................................................................ 3 A2. Mandate Objectives ......................................................................................... 4 A3. Program Delivery ............................................................................................ 5
Table I: Operational Priorities ..................................................................... 6 Table II: Ongoing Operations ....................................................................... 9 Table III: Resource Allocation to Programs .............................................. 10 PART B: MOVING FORWARD – IMPLEMENTATION
OF THE STRATEGIC PLAN
B1. Strategic Initiatives and Key Results ............................................................ 11 B2. New Ways of Doing Business ....................................................................... 15
Table I: Summary of Potential Opportunities .......................................... 15 Table II: Details of Approved High Category Projects ........................... 16 PART C: RESOURCE INFORMATION SUMMARY
C1. Planning Year 2001-02 ...................................................................................17 C2. Planning Year 2002-03 .................................................................................. 18 C3. Planning Year 2003-04 .................................................................................. 20 C4. ADM Sign-off of Sector Allocations ............................................................ 21
3
PART A: MANDATED PROGRAMS A1. Key Challenges Corporate Services continually strives to provide the highest level of supporting services to departmental clients who directly deliver DFO’s mandated programs and objectives. It is also responsible for implementing, in DFO, certain government-wide initiatives, including the Universal Classification Standard, Government On-Line, the Financial Information Strategy and Modern Comptrollership, and it leads the administration, in DFO, of certain government-wide programs, including the Sustainable Development Strategy and the Access to Information Act and the Privacy Act. Additionally, Corporate Services makes a direct contribution to the achievement of strategic management objectives in DFO, as these are set out in the departmental Strategic Plan. As is the case generally in government, Corporate Services faces continuing pressure to improve performance while containing costs. In addition, the aging work force and plentiful employment opportunities in the private sector create significant challenges in meeting the Department’s human resource requirements. In this environment, flexibility, tolerance for change, risk-taking, and acceptance of accountability are critical to success. To meet its responsibilities, Corporate Services will continue to rely on its highly competent organizational team. This team is dedicated to developing creative and simplified solutions to strategic and operational problems, and to providing value-added, client-focused services. The success of the team is grounded in shared values of professionalism, accountability, and an appreciation for the needs and contribution of individual team members. These are the values expressed in the Corporate Services Vision.
4
In addition, Corporate Services has begun the implementation of a performance measurement system to evaluate the efficiency and effectiveness of its services, and its organizational wellness. In terms of effectiveness, level of client satisfaction is considered a critical performance measure, and, in developing this Business Plan, the results of a Headquarters client satisfaction survey were integrated into the planning process. Finally, Corporate Services will continue to monitor the experiences of the broader public sector and the private sector in common services administration, as well as the results of academic research in the field, to remain apprised of current developments and lessons learned. Drawing on these resources, Corporate Services will ensure that DFO has in place the real property, technological tools, human resources organizational structures and financial and other management systems required to support the effective and efficient delivery of its core programs and services. A2. Mandate Objectives Corporate Services does not have direct responsibility for delivery of DFO’s mandate objectives. Rather, Corporate Services contributes to the realization of the Department’s mandate by maintaining infrastructure and providing common services required to support the delivery of departmental programs, nationally and regionally. Service areas comprise Finance and Administration, Human Resources, Information Management and Technology, Real Property, Environmental Co-ordination, Access to information and Privacy, and Strategic Issues. [Note: Organizationally, Corporate Services includes Small Craft Harbours (SCH). SCH is unlike the remainder of Corporate Services, however, in that it serves external clients, in its role of ensuring the availability and maintenance of fishing harbours. Consequently, SCH has its own Business Plan.]
5
A3. Program Delivery: Activities, Key Results and Resources for Ongoing
Operations and Operational Priorities Overview Administrative pressures in government today demand that organizations deploy their available resources in a way that achieves maximum performance with those resources. Thus, organizations like Corporate Services, who provide common services, must ensure that their processes are streamlined, their organizational structures provide the most appropriate interface with their clients, their systems provide complete and timely business information, and their staff are equipped with all the skills, particularly the professional skills, needed to support the larger organization. The operational priorities of Corporate Services for 2001-2004 reflect its plans to address these issues. Summary The table on the following pages summarizes Corporate Services’ planned program delivery activities for 2001-2004. Both ongoing operations and operational priorities are listed, along with the expected key results for each priority and each ongoing operation. NOTE: Funding for the Great Lakes Dredging Program is not included in the following table. Funding requirement is $1.5M , for 2001-2002 only. The appropriate category for this expenditure has not been decided. One possibility is to put it in the Operational Priority category, because it is a one-time expense.
6
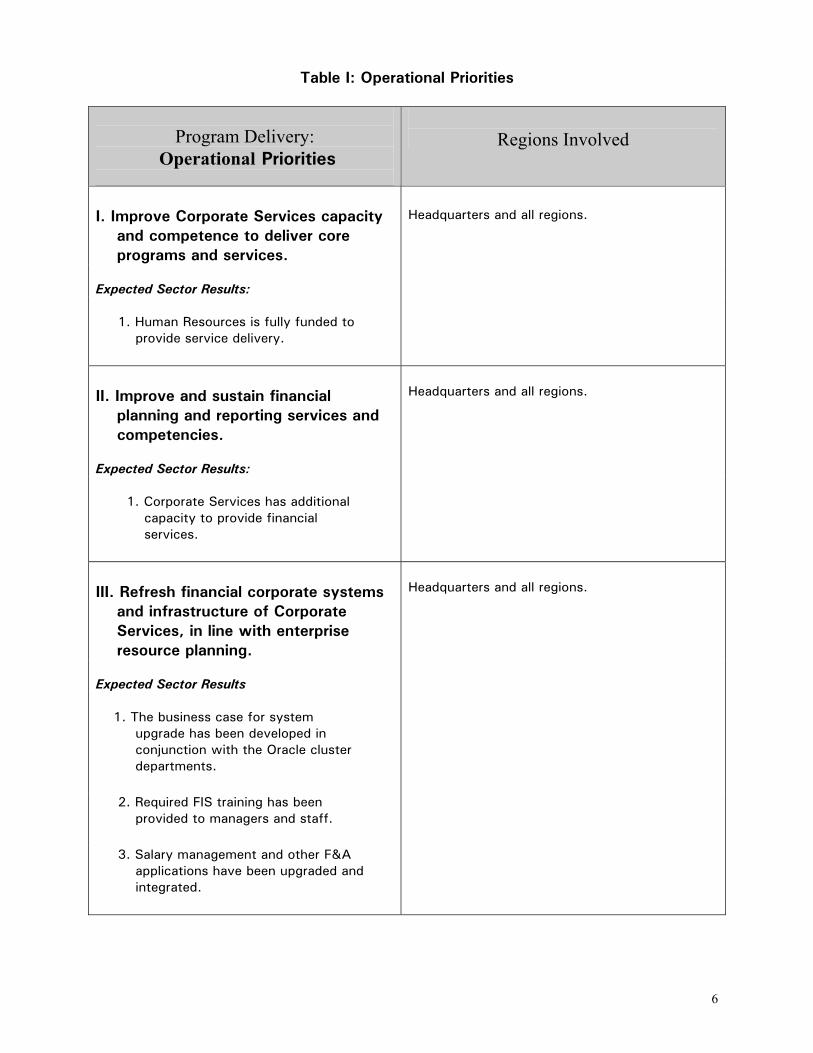
Table I: Operational Priorities
Program Delivery:
Operational Priorities
Regions Involved
I. Improve Corporate Services capacity and competence to deliver core programs and services.
Headquarters and all regions.
Expected Sector Results:
1. Human Resources is fully funded to provide service delivery.
II. Improve and sustain financial planning and reporting services and competencies.
Headquarters and all regions.
Expected Sector Results:
1. Corporate Services has additional capacity to provide financial services.
III. Refresh financial corporate systems and infrastructure of Corporate Services, in line with enterprise resource planning.
Headquarters and all regions.
Expected Sector Results
1. The business case for system upgrade has been developed in conjunction with the Oracle cluster departments.
2. Required FIS training has been provided to managers and staff.
3. Salary management and other F&A applications have been upgraded and integrated.
7
Program Delivery: Operational Priorities
Regions Involved
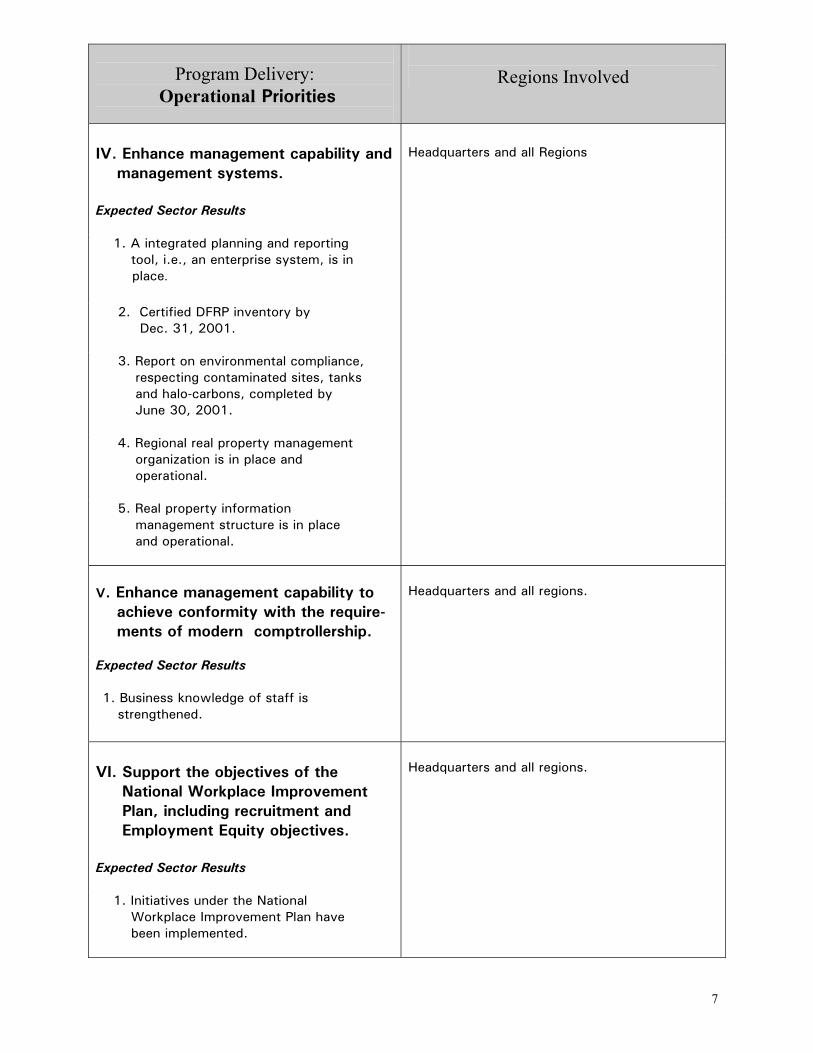
IV. Enhance management capability and management systems.
Headquarters and all Regions
Expected Sector Results
1. A integrated planning and reporting tool, i.e., an enterprise system, is in place.
2. Certified DFRP inventory by Dec. 31, 2001.
3. Report on environmental compliance, respecting contaminated sites, tanks and halo-carbons, completed by June 30, 2001.
4. Regional real property management organization is in place and operational.
5. Real property information management structure is in place and operational.
V. Enhance management capability to achieve conformity with the require- ments of modern comptrollership.
Headquarters and all regions.
Expected Sector Results 1. Business knowledge of staff is strengthened.
VI. Support the objectives of the National Workplace Improvement Plan, including recruitment and Employment Equity objectives.
Headquarters and all regions.
Expected Sector Results
1. Initiatives under the National Workplace Improvement Plan have been implemented.
8
Program Delivery: Operational Priorities
Regions Involved
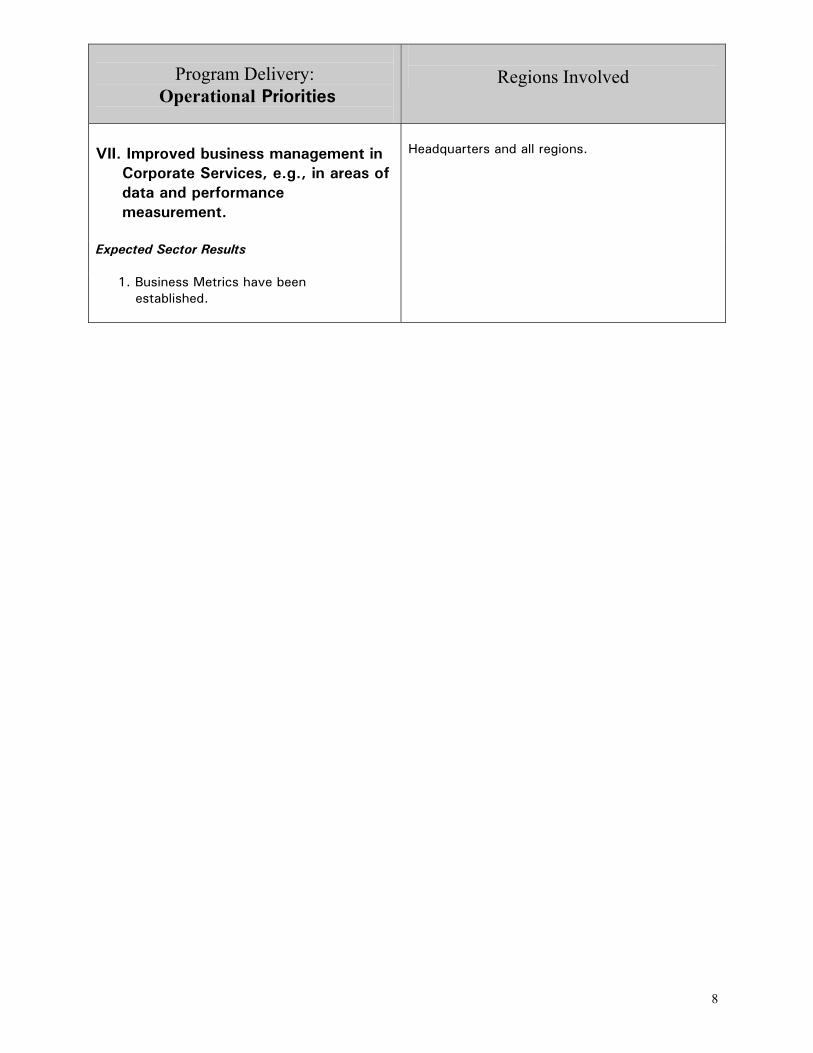
VII. Improved business management in Corporate Services, e.g., in areas of data and performance measurement.
Headquarters and all regions.
Expected Sector Results
1. Business Metrics have been established.
9
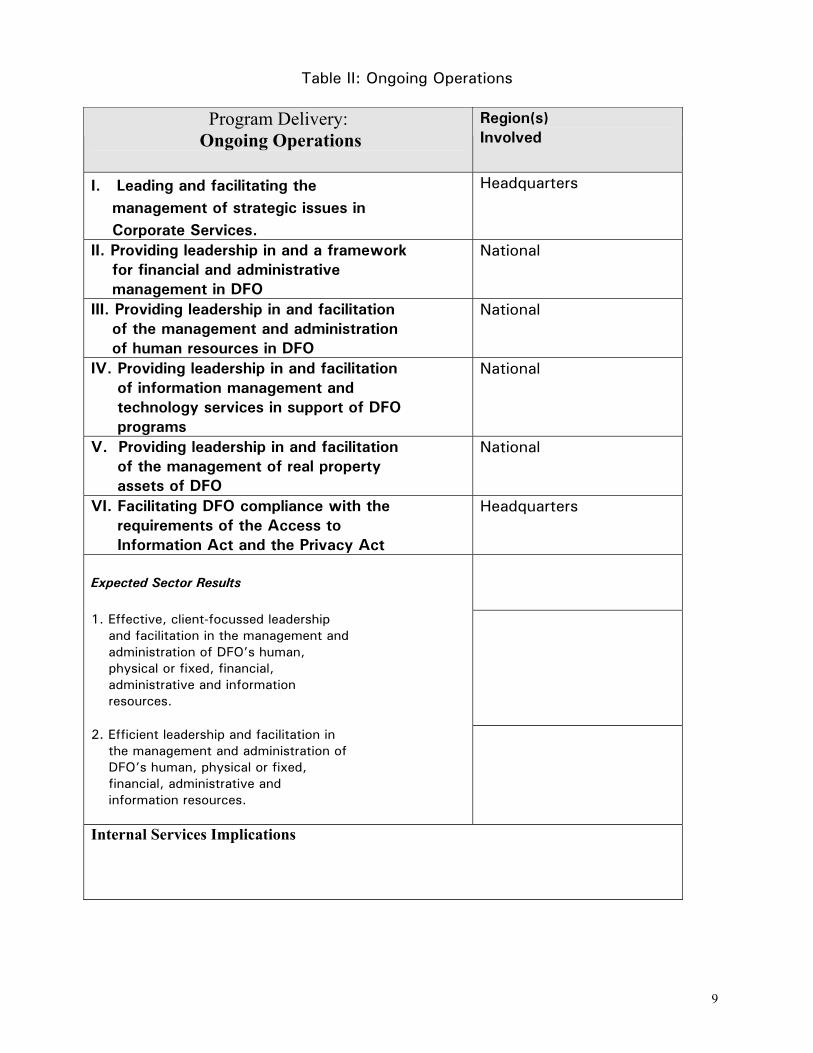
Table II: Ongoing Operations
Program Delivery: Ongoing Operations
Region(s) Involved
I. Leading and facilitating the management of strategic issues in Corporate Services.
Headquarters
II. Providing leadership in and a framework for financial and administrative management in DFO
National
III. Providing leadership in and facilitation of the management and administration of human resources in DFO
National
IV. Providing leadership in and facilitation of information management and technology services in support of DFO programs
National
V. Providing leadership in and facilitation of the management of real property assets of DFO
National
VI. Facilitating DFO compliance with the requirements of the Access to Information Act and the Privacy Act
Headquarters
Expected Sector Results
1. Effective, client-focussed leadership and facilitation in the management and administration of DFO’s human, physical or fixed, financial, administrative and information resources.
2. Efficient leadership and facilitation in the management and administration of DFO’s human, physical or fixed, financial, administrative and information resources.
Internal Services Implications
10
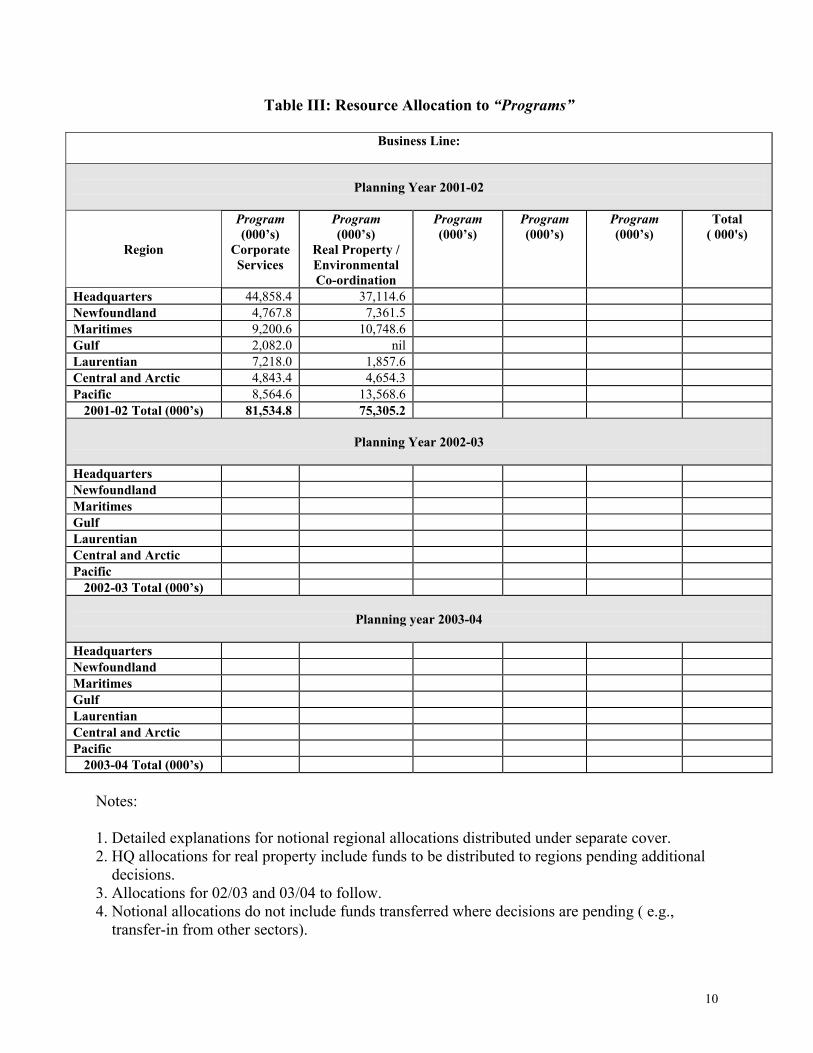
Table III: Resource Allocation to “Programs”
Business Line:
Planning Year 2001-02
Region
Program (000’s)
CorporateServices
Program (000’s)
Real Property / Environmental Co-ordination
Program (000’s)
Program (000’s)
Program (000’s)
Total ( 000's)
Headquarters 44,858.4 37,114.6 Newfoundland 4,767.8 7,361.5 Maritimes 9,200.6 10,748.6 Gulf 2,082.0 nil Laurentian 7,218.0 1,857.6 Central and Arctic 4,843.4 4,654.3 Pacific 8,564.6 13,568.6
2001-02 Total (000’s) 81,534.8 75,305.2
Planning Year 2002-03
Headquarters Newfoundland Maritimes Gulf Laurentian Central and Arctic Pacific
2002-03 Total (000’s)
Planning year 2003-04
Headquarters Newfoundland Maritimes Gulf Laurentian Central and Arctic Pacific
2003-04 Total (000’s) Notes: 1. Detailed explanations for notional regional allocations distributed under separate cover. 2. HQ allocations for real property include funds to be distributed to regions pending additional decisions. 3. Allocations for 02/03 and 03/04 to follow. 4. Notional allocations do not include funds transferred where decisions are pending ( e.g., transfer-in from other sectors).
11
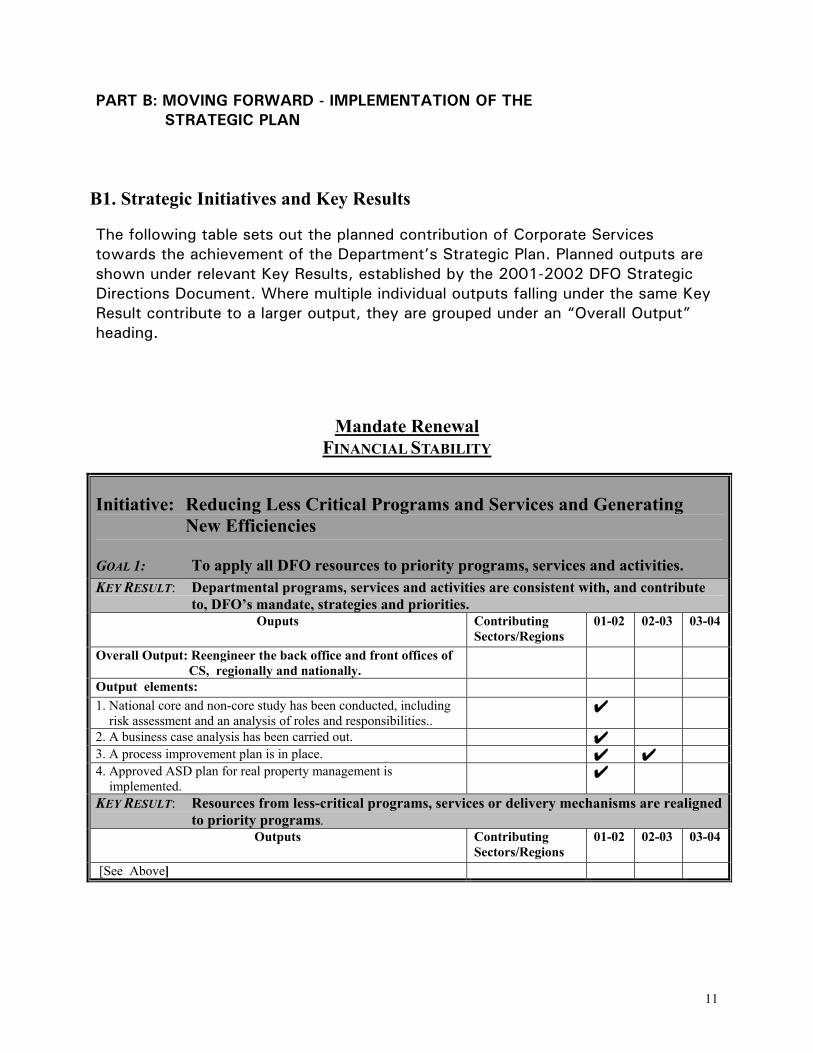
PART B: MOVING FORWARD - IMPLEMENTATION OF THE STRATEGIC PLAN
B1. Strategic Initiatives and Key Results
The following table sets out the planned contribution of Corporate Services towards the achievement of the Department’s Strategic Plan. Planned outputs are shown under relevant Key Results, established by the 2001-2002 DFO Strategic Directions Document. Where multiple individual outputs falling under the same Key Result contribute to a larger output, they are grouped under an “Overall Output” heading.
Mandate Renewal FINANCIAL STABILITY
Initiative: Reducing Less Critical Programs and Services and Generating New Efficiencies
GOAL 1: To apply all DFO resources to priority programs, services and activities. KEY RESULT: Departmental programs, services and activities are consistent with, and contribute
to, DFO’s mandate, strategies and priorities. Ouputs Contributing
Sectors/Regions 01-02
02-03
03-04
Overall Output: Reengineer the back office and front offices of CS, regionally and nationally.
Output elements: 1. National core and non-core study has been conducted, including risk assessment and an analysis of roles and responsibilities..
✔
2. A business case analysis has been carried out. ✔ 3. A process improvement plan is in place. ✔ ✔ 4. Approved ASD plan for real property management is implemented.
✔
KEY RESULT: Resources from less-critical programs, services or delivery mechanisms are realigned to priority programs.
Outputs Contributing Sectors/Regions
01-02
02-03 03-04
[See Above]
12
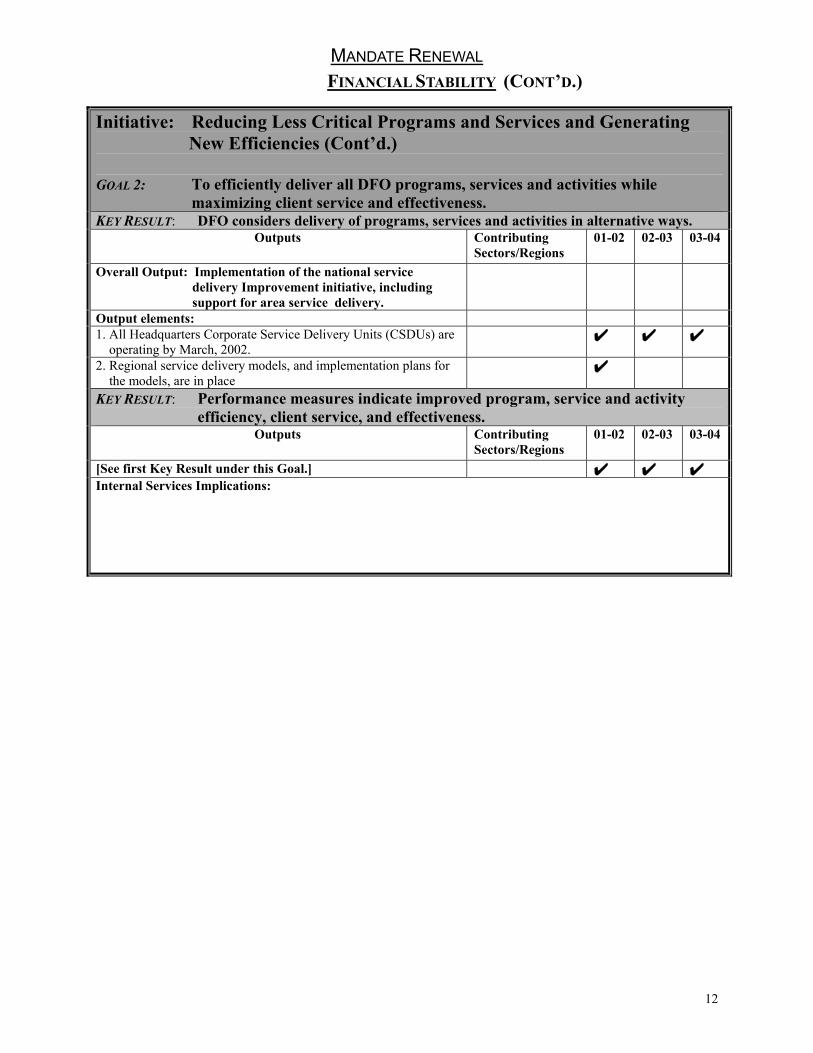
MANDATE RENEWAL FINANCIAL STABILITY (CONT’D.)
Initiative: Reducing Less Critical Programs and Services and Generating New Efficiencies (Cont’d.) GOAL 2: To efficiently deliver all DFO programs, services and activities while maximizing client service and effectiveness. KEY RESULT: DFO considers delivery of programs, services and activities in alternative ways.
Outputs Contributing Sectors/Regions
01-02
02-03
03-04
Overall Output: Implementation of the national service delivery Improvement initiative, including support for area service delivery.
Output elements: 1. All Headquarters Corporate Service Delivery Units (CSDUs) are operating by March, 2002.
✔ ✔ ✔
2. Regional service delivery models, and implementation plans for the models, are in place
✔
KEY RESULT: Performance measures indicate improved program, service and activity efficiency, client service, and effectiveness.
Outputs Contributing Sectors/Regions
01-02
02-03
03-04
[See first Key Result under this Goal.] ✔ ✔ ✔ Internal Services Implications:
13
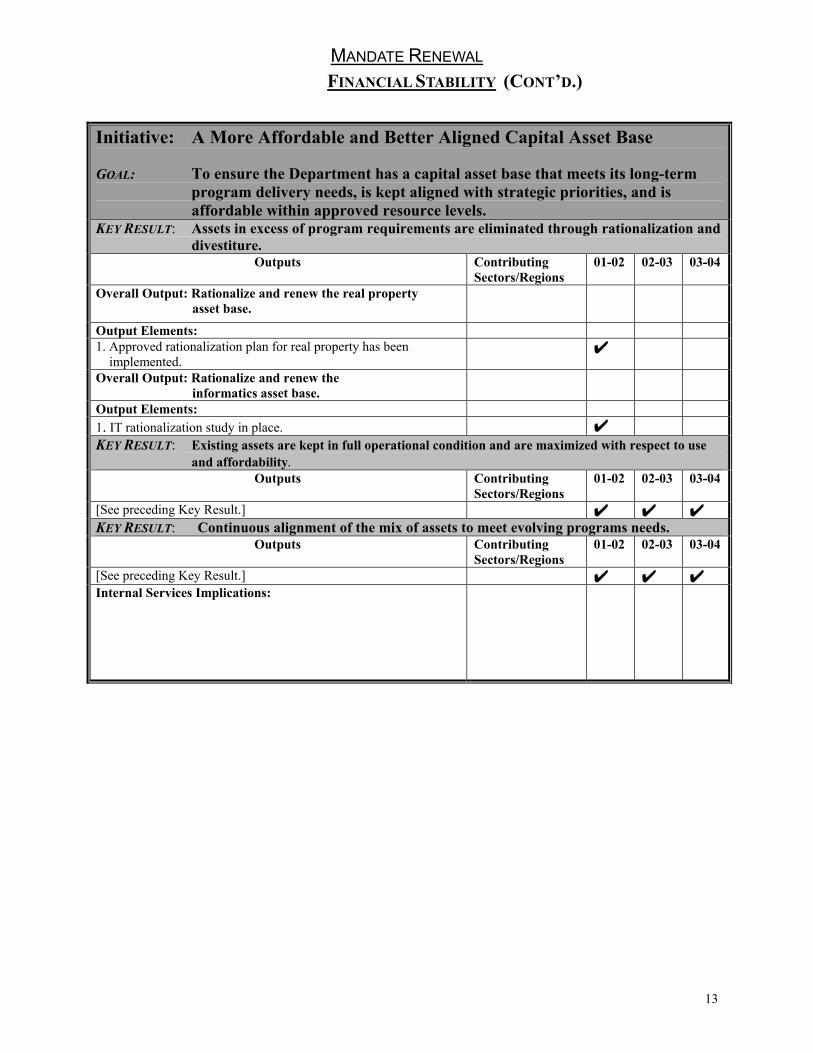
MANDATE RENEWAL FINANCIAL STABILITY (CONT’D.)
Initiative: A More Affordable and Better Aligned Capital Asset Base GOAL: To ensure the Department has a capital asset base that meets its long-term program delivery needs, is kept aligned with strategic priorities, and is affordable within approved resource levels. KEY RESULT: Assets in excess of program requirements are eliminated through rationalization and
divestiture. Outputs Contributing
Sectors/Regions 01-02
02-03
03-04
Overall Output: Rationalize and renew the real property asset base.
Output Elements: 1. Approved rationalization plan for real property has been implemented.
✔
Overall Output: Rationalize and renew the informatics asset base.
Output Elements: 1. IT rationalization study in place. ✔ KEY RESULT: Existing assets are kept in full operational condition and are maximized with respect to use
and affordability. Outputs Contributing
Sectors/Regions 01-02
02-03
03-04
[See preceding Key Result.] ✔ ✔ ✔ KEY RESULT: Continuous alignment of the mix of assets to meet evolving programs needs.
Outputs Contributing Sectors/Regions
01-02
02-03
03-04
[See preceding Key Result.] ✔ ✔ ✔ Internal Services Implications:
14
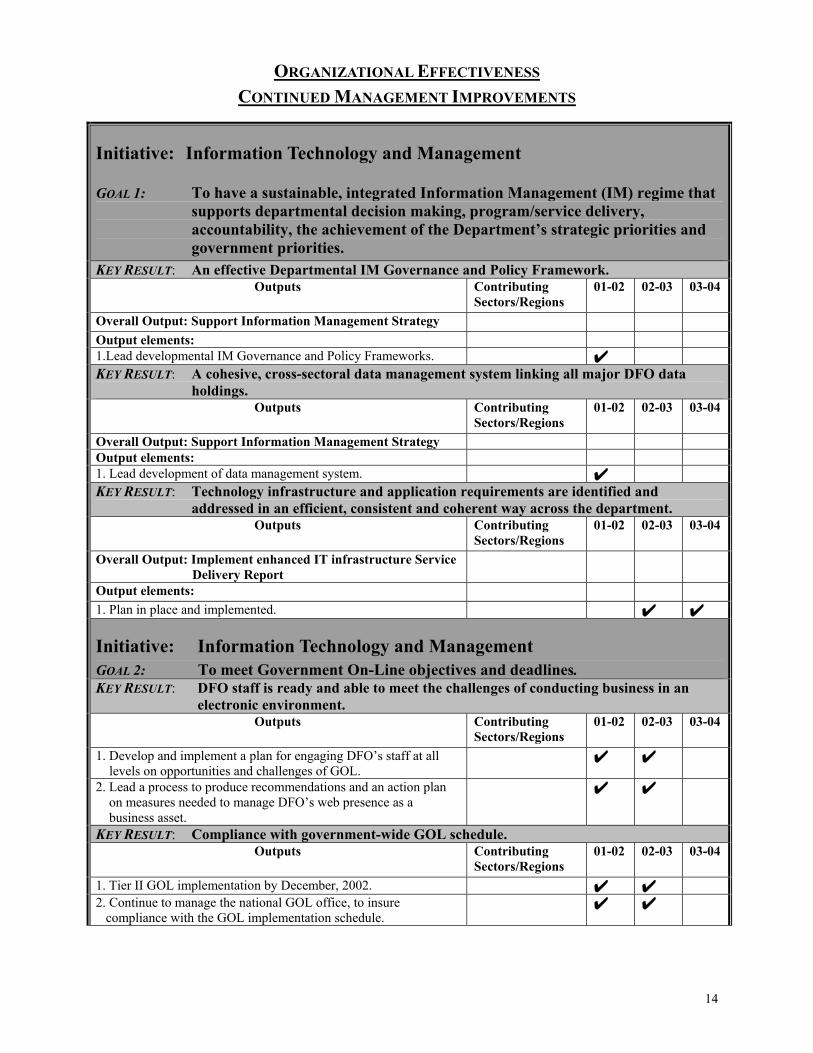
ORGANIZATIONAL EFFECTIVENESS CONTINUED MANAGEMENT IMPROVEMENTS
Initiative: Information Technology and Management
GOAL 1: To have a sustainable, integrated Information Management (IM) regime that supports departmental decision making, program/service delivery, accountability, the achievement of the Department’s strategic priorities and government priorities.
KEY RESULT: An effective Departmental IM Governance and Policy Framework. Outputs Contributing
Sectors/Regions 01-02
02-03
03-04
Overall Output: Support Information Management Strategy Output elements: 1.Lead developmental IM Governance and Policy Frameworks. ✔ KEY RESULT: A cohesive, cross-sectoral data management system linking all major DFO data
holdings. Outputs Contributing
Sectors/Regions 01-02
02-03
03-04
Overall Output: Support Information Management Strategy Output elements: 1. Lead development of data management system. ✔ KEY RESULT: Technology infrastructure and application requirements are identified and
addressed in an efficient, consistent and coherent way across the department. Outputs Contributing
Sectors/Regions 01-02
02-03
03-04
Overall Output: Implement enhanced IT infrastructure Service Delivery Report
Output elements: 1. Plan in place and implemented. ✔ ✔
Initiative: Information Technology and Management GOAL 2: To meet Government On-Line objectives and deadlines. KEY RESULT: DFO staff is ready and able to meet the challenges of conducting business in an
electronic environment. Outputs Contributing
Sectors/Regions 01-02
02-03
03-04
1. Develop and implement a plan for engaging DFO’s staff at all levels on opportunities and challenges of GOL.
✔ ✔
2. Lead a process to produce recommendations and an action plan on measures needed to manage DFO’s web presence as a business asset.
✔ ✔
KEY RESULT: Compliance with government-wide GOL schedule. Outputs Contributing
Sectors/Regions 01-02
02-03
03-04
1. Tier II GOL implementation by December, 2002. ✔ ✔ 2. Continue to manage the national GOL office, to insure compliance with the GOL implementation schedule.
✔ ✔

15
Internal Services Implications:
16
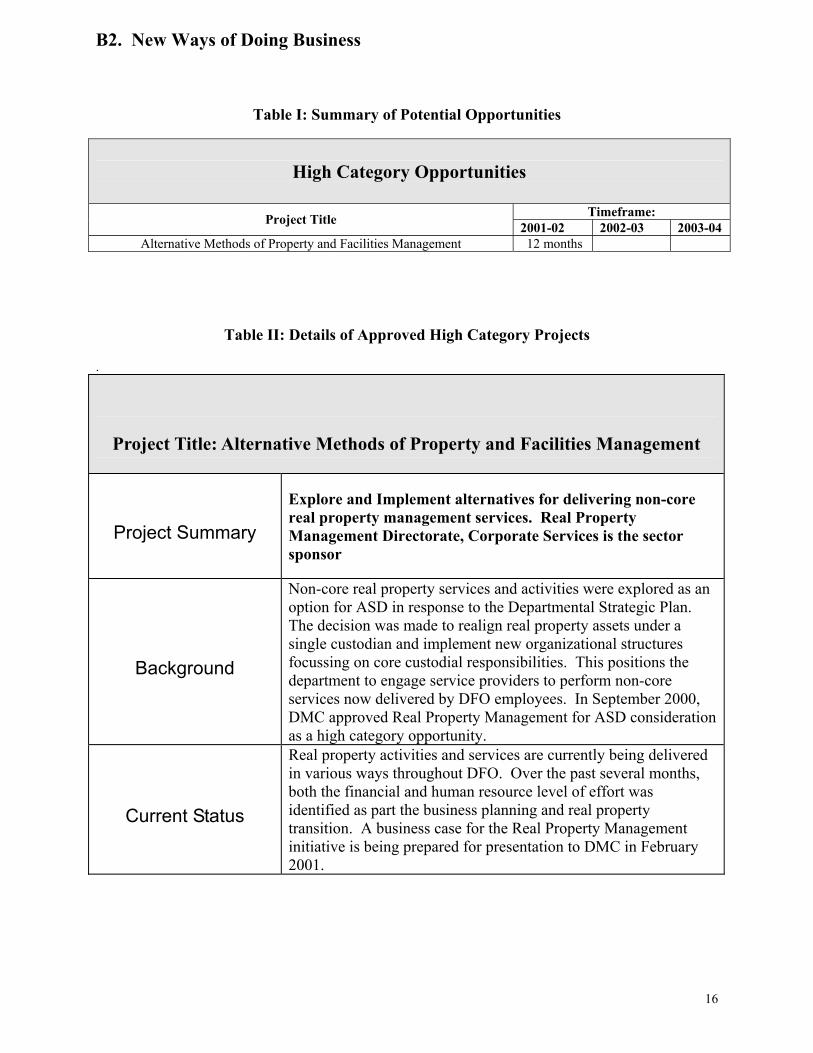
B2. New Ways of Doing Business
Table I: Summary of Potential Opportunities
High Category Opportunities
Timeframe: Project Title 2001-02 2002-03 2003-04 Alternative Methods of Property and Facilities Management 12 months
Table II: Details of Approved High Category Projects .
Project Title: Alternative Methods of Property and Facilities Management
Project Summary
Explore and Implement alternatives for delivering non-core real property management services. Real Property Management Directorate, Corporate Services is the sector sponsor
Background
Non-core real property services and activities were explored as an option for ASD in response to the Departmental Strategic Plan. The decision was made to realign real property assets under a single custodian and implement new organizational structures focussing on core custodial responsibilities. This positions the department to engage service providers to perform non-core services now delivered by DFO employees. In September 2000, DMC approved Real Property Management for ASD consideration as a high category opportunity.
Current Status
Real property activities and services are currently being delivered in various ways throughout DFO. Over the past several months, both the financial and human resource level of effort was identified as part the business planning and real property transition. A business case for the Real Property Management initiative is being prepared for presentation to DMC in February 2001.
17
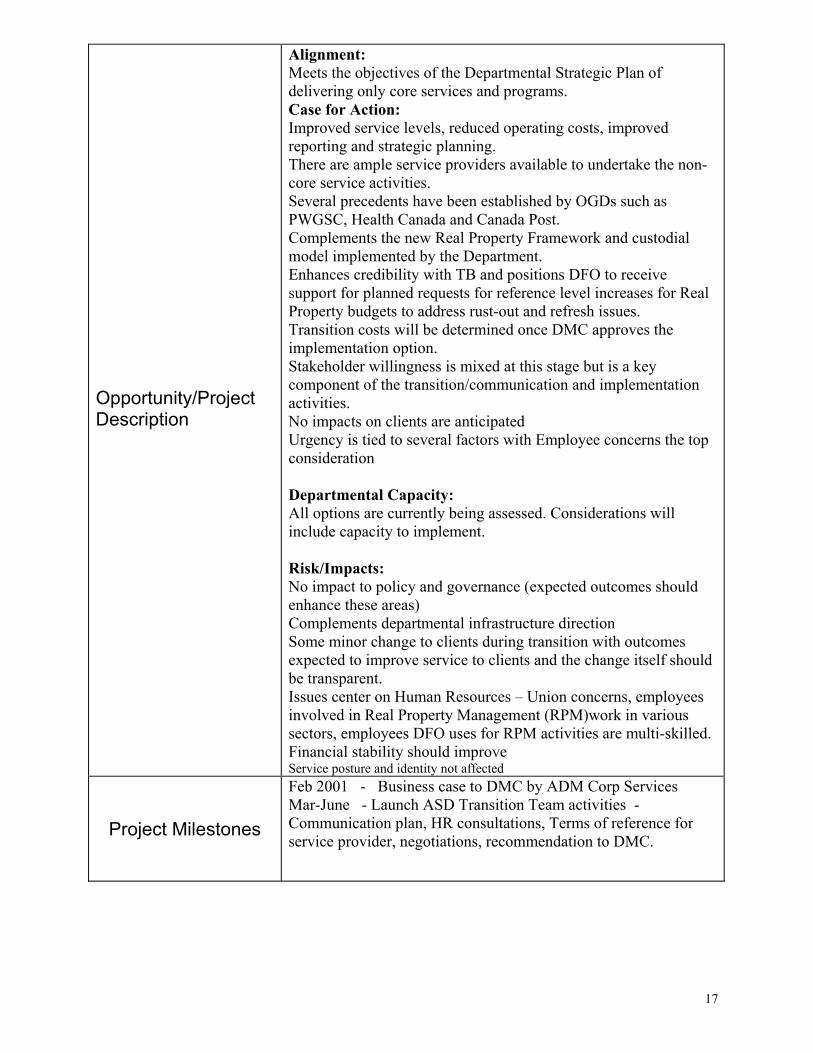
Opportunity/Project Description
Alignment: Meets the objectives of the Departmental Strategic Plan of delivering only core services and programs. Case for Action: Improved service levels, reduced operating costs, improved reporting and strategic planning. There are ample service providers available to undertake the non-core service activities. Several precedents have been established by OGDs such as PWGSC, Health Canada and Canada Post. Complements the new Real Property Framework and custodial model implemented by the Department. Enhances credibility with TB and positions DFO to receive support for planned requests for reference level increases for Real Property budgets to address rust-out and refresh issues. Transition costs will be determined once DMC approves the implementation option. Stakeholder willingness is mixed at this stage but is a key component of the transition/communication and implementation activities. No impacts on clients are anticipated Urgency is tied to several factors with Employee concerns the top consideration Departmental Capacity: All options are currently being assessed. Considerations will include capacity to implement. Risk/Impacts: No impact to policy and governance (expected outcomes should enhance these areas) Complements departmental infrastructure direction Some minor change to clients during transition with outcomes expected to improve service to clients and the change itself should be transparent. Issues center on Human Resources – Union concerns, employees involved in Real Property Management (RPM)work in various sectors, employees DFO uses for RPM activities are multi-skilled. Financial stability should improve Service posture and identity not affected
Project Milestones
Feb 2001 - Business case to DMC by ADM Corp Services Mar-June - Launch ASD Transition Team activities - Communication plan, HR consultations, Terms of reference for service provider, negotiations, recommendation to DMC.
18
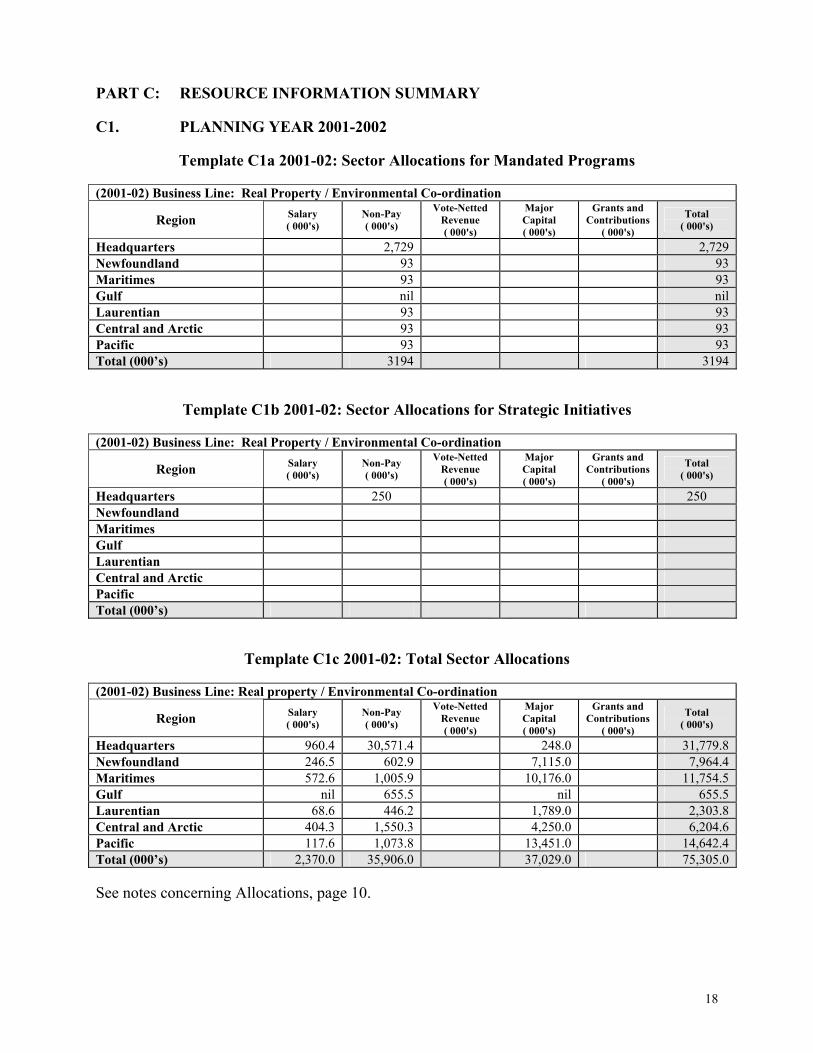
PART C: RESOURCE INFORMATION SUMMARY C1. PLANNING YEAR 2001-2002
Template C1a 2001-02: Sector Allocations for Mandated Programs (2001-02) Business Line: Real Property / Environmental Co-ordination
Region Salary ( 000's)
Non-Pay ( 000's)
Vote-Netted Revenue ( 000's)
Major Capital ( 000's)
Grants and Contributions
( 000's)
Total ( 000's)
Headquarters 2,729 2,729 Newfoundland 93 93 Maritimes 93 93 Gulf nil nil Laurentian 93 93 Central and Arctic 93 93 Pacific 93 93 Total (000’s) 3194 3194
Template C1b 2001-02: Sector Allocations for Strategic Initiatives (2001-02) Business Line: Real Property / Environmental Co-ordination
Region Salary ( 000's)
Non-Pay ( 000's)
Vote-Netted Revenue ( 000's)
Major Capital ( 000's)
Grants and Contributions
( 000's)
Total ( 000's)
Headquarters 250 250 Newfoundland Maritimes Gulf Laurentian Central and Arctic Pacific Total (000’s)
Template C1c 2001-02: Total Sector Allocations (2001-02) Business Line: Real property / Environmental Co-ordination
Region Salary ( 000's)
Non-Pay ( 000's)
Vote-Netted Revenue ( 000's)
Major Capital ( 000's)
Grants and Contributions
( 000's)
Total ( 000's)
Headquarters 960.4 30,571.4 248.0 31,779.8 Newfoundland 246.5 602.9 7,115.0 7,964.4 Maritimes 572.6 1,005.9 10,176.0 11,754.5 Gulf nil 655.5 nil 655.5 Laurentian 68.6 446.2 1,789.0 2,303.8 Central and Arctic 404.3 1,550.3 4,250.0 6,204.6 Pacific 117.6 1,073.8 13,451.0 14,642.4 Total (000’s) 2,370.0 35,906.0 37,029.0 75,305.0 See notes concerning Allocations, page 10.
19
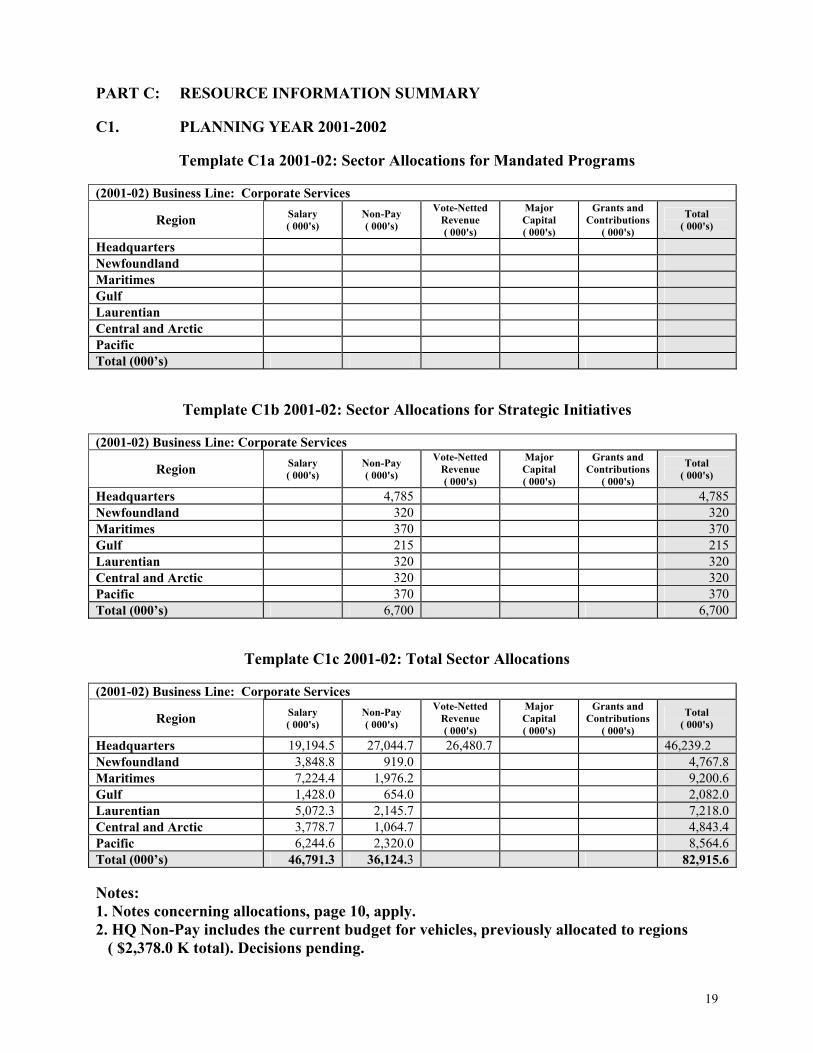
PART C: RESOURCE INFORMATION SUMMARY C1. PLANNING YEAR 2001-2002
Template C1a 2001-02: Sector Allocations for Mandated Programs (2001-02) Business Line: Corporate Services
Region Salary ( 000's)
Non-Pay ( 000's)
Vote-Netted Revenue ( 000's)
Major Capital ( 000's)
Grants and Contributions
( 000's)
Total ( 000's)
Headquarters Newfoundland Maritimes Gulf Laurentian Central and Arctic Pacific Total (000’s)
Template C1b 2001-02: Sector Allocations for Strategic Initiatives (2001-02) Business Line: Corporate Services
Region Salary ( 000's)
Non-Pay ( 000's)
Vote-Netted Revenue ( 000's)
Major Capital ( 000's)
Grants and Contributions
( 000's)
Total ( 000's)
Headquarters 4,785 4,785 Newfoundland 320 320 Maritimes 370 370 Gulf 215 215 Laurentian 320 320 Central and Arctic 320 320 Pacific 370 370 Total (000’s) 6,700 6,700
Template C1c 2001-02: Total Sector Allocations (2001-02) Business Line: Corporate Services
Region Salary ( 000's)
Non-Pay ( 000's)
Vote-Netted Revenue ( 000's)
Major Capital ( 000's)
Grants and Contributions
( 000's)
Total ( 000's)
Headquarters 19,194.5 27,044.7 26,480.7 46,239.2 Newfoundland 3,848.8 919.0 4,767.8 Maritimes 7,224.4 1,976.2 9,200.6 Gulf 1,428.0 654.0 2,082.0 Laurentian 5,072.3 2,145.7 7,218.0 Central and Arctic 3,778.7 1,064.7 4,843.4 Pacific 6,244.6 2,320.0 8,564.6 Total (000’s) 46,791.3 36,124.3 82,915.6 Notes: 1. Notes concerning allocations, page 10, apply. 2. HQ Non-Pay includes the current budget for vehicles, previously allocated to regions ( $2,378.0 K total). Decisions pending.

20
C2. PLANNING YEAR 2002-2003
Template C2a 2002-03: Sector Allocations for Mandated Programs (2002-03) Business Line:
Region Salary ( 000's)
Non-Pay ( 000's)
Vote-Netted Revenue ( 000's)
Major Capital ( 000's)
Grants and Contributions
( 000's)
Total ( 000's)
Headquarters Newfoundland Maritimes Gulf Laurentian Central and Arctic Pacific Total (000’s)
Template C2b 2002-03: Sector Allocations for Strategic Initiatives (2002-03) Business Line:
Region Salary ( 000's)
Non-Pay ( 000's)
Vote-Netted Revenue ( 000's)
Major Capital ( 000's)
Grants and Contributions
( 000's)
Total ( 000's)
Headquarters Newfoundland Maritimes Gulf Laurentian Central and Arctic Pacific Total (000’s)
Template C2c 2002-03: Total Sector Allocations (2002-03) Business Line:
Region Salary ( 000's)
Non-Pay ( 000's)
Vote-Netted Revenue ( 000's)
Major Capital ( 000's)
Grants and Contributions
( 000's)
Total ( 000's)
Headquarters Newfoundland Maritimes Gulf Laurentian Central and Arctic Pacific Total (000’s)
21
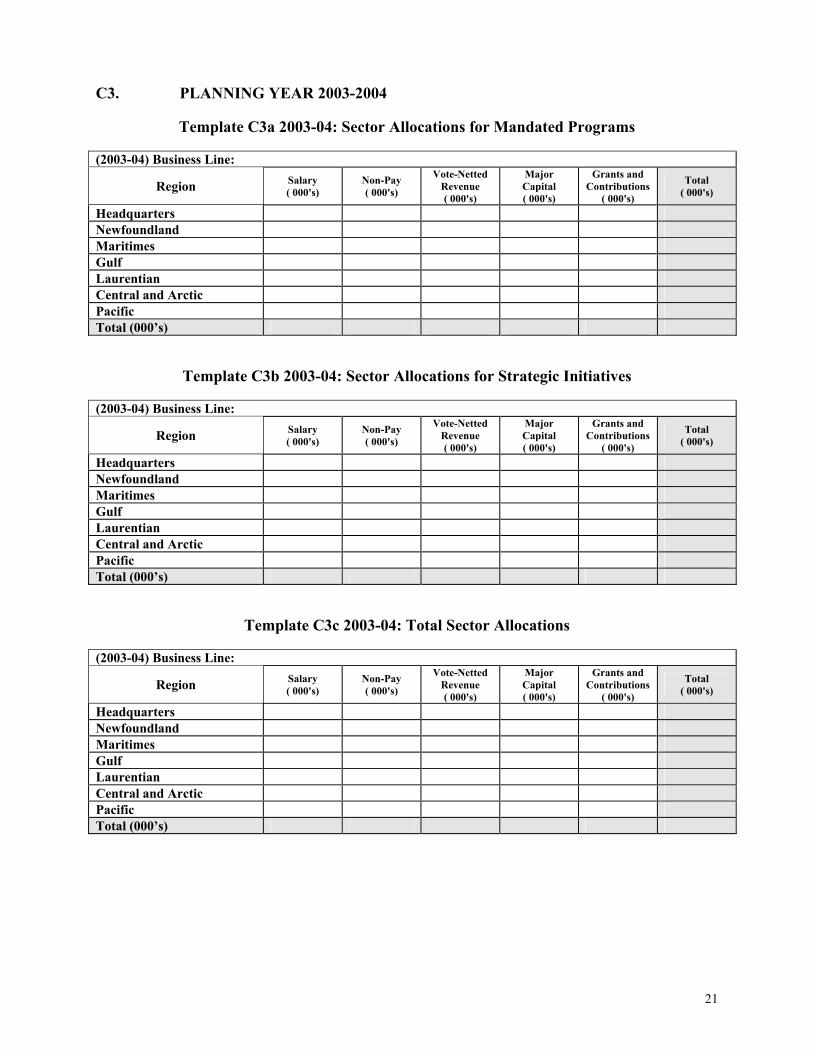
C3. PLANNING YEAR 2003-2004
Template C3a 2003-04: Sector Allocations for Mandated Programs (2003-04) Business Line:
Region Salary ( 000's)
Non-Pay ( 000's)
Vote-Netted Revenue ( 000's)
Major Capital ( 000's)
Grants and Contributions
( 000's)
Total ( 000's)
Headquarters Newfoundland Maritimes Gulf Laurentian Central and Arctic Pacific Total (000’s)
Template C3b 2003-04: Sector Allocations for Strategic Initiatives (2003-04) Business Line:
Region Salary ( 000's)
Non-Pay ( 000's)
Vote-Netted Revenue ( 000's)
Major Capital ( 000's)
Grants and Contributions
( 000's)
Total ( 000's)
Headquarters Newfoundland Maritimes Gulf Laurentian Central and Arctic Pacific Total (000’s)
Template C3c 2003-04: Total Sector Allocations (2003-04) Business Line:
Region Salary ( 000's)
Non-Pay ( 000's)
Vote-Netted Revenue ( 000's)
Major Capital ( 000's)
Grants and Contributions
( 000's)
Total ( 000's)
Headquarters Newfoundland Maritimes Gulf Laurentian Central and Arctic Pacific Total (000’s)

22
C4. Sector Head Sign-off of Sector Allocations (Name)
Date