waste minimization assessment centers - infohouse
TRANSCRIPT

WASTE MINIMIZATION ASSESSMENT CENTERS
by: F. William Kirsch and Gwen P. booby
Industrial Technology and Energy Management UNIVERSITY CITY SCIENCE CENTER
3624 Market Street Philadelphia, PA 191 04
(21 5) 387-2255
ABSTRACT
In 1988, University City Science Center (Philadelphia, Pennsylvania) began a pilot project to assist small and medium-size manufacturers who want to minimize their formation of hazardous waste but who lack the in-house expertise to do so. Under agreement with the Risk Reduction Engineering Laboratory of the U.S. Environmental Protection Agency, the Science Center's Industrial Technology and Energy Management (ITEM) division established two waste minimization assessment centers (WMACs) at Colorado State University in Fort Collins and at the University of Tennessee in Knoxville. During the second program period of the project, a third WMAC established at the University of Louisville (Kentucky) has begun to conduct assessments.
Each WMAC is staffed by engineering faculty and students who have considerable direct experience with process operations in manufacturing plants and who also have the knowledge and skil ls needed to minimize hazardous waste generation. The waste minimization assessments are conducted at no ou t -o f - pocket cost to the client. Several site-visits are required for each client served. The WMAC staff locate the sources of hazardous waste in each plant and identify the current disposal or treatment methods and their associated costs. They then identify and analyze a variety of ways to reduce or eliminate the waste. Specific measures to achieve that goal are recommended and the essential supporting technological and economic information is developed. Finally, a confidential report which details the WMAC's findings and recommendations including cost savings, implementation costs, and payback times is prepared for eacn client manufacturer
This presentation will discuss results from the first period of this project
This paper has been reviewed in accordance with the U.S. Environmental Protection Agency's peer and administrative review policies and approved for presentation and publication
68

WASTE MINIMIZATION ASSESSMENT CENTERS
INTRODUCTION
The amount of hazardous waste generated by industrial plants has become an increasingly costly problem for manufacturers and an additional stress on the environment. One solution to the problem sf hazardous waste is to reduce or eliminate the
University City Science Center (Philadelphia, Pennsylvania) has begun a pilot project to assist small and medium-size manufacturers who want to minimize their formation of hazardous waste but who lack the in-house expertise to do so. Under agreement with the Risk Reduction Engineering Laboratory of the U.S. Environmental Protection Agency, the Science Center's Industrial Technology and Energy Management (ITEM) division initially established two waste minimization assessment centers (WMACs) at Colorado State University in Fort Collins and at the University of Tennessee in Knoxville. Each WMAC IS staffed by engineering faculty and students who have considerable direct experience with process operations in manufacturing plants and who also have the knowledge and skills needed to minimize hazardous waste generation. During late 1989, a third WMAC at the University of Louisville was established.
During the initial period of this pilot project, each of the two WMACs conducted six assessments for small and medium-size manufacturers at no out-of-pocket cost to the client. Each client had to meet the fellowing criteria:
Standard Industrial Classification Code 20-39 *
* Gross annual sal of not more than $50 million
D ore than 500 employees
of in-house expertise in waste minimization 0
The potential benefits of the pilot project include minimization of the amount of waste generated by manufacturers, reduced waste treatment: and disposal costs for participating plants, valuable experience far graduate and undergraduate students who participate in the program, and acleaner environment without more regulations and higher costs for manufacturers.
All told, the measures recommended by the two WMACs in these 12 plants accounted for an identified cost saving of $1.28 million/year. This paper describes how the cost savings were found and identifies the specific measures designed to reduce waste formation and emissions from two of these plants. However, equally detailed accounts ot the other ten plants could also be prepared.
METHODOLOGY OF ASSESSMENTS
The waste minimization assessments require several site-visits to each client served In general. the WMACs follow the procedures outlined in the Waste Minimization Opportunitv Assessment Iwlanual, July 198s The WMAC staff locate the sources of hazardous waste in each plant and identify the current disposal cr treatment methods and their associated costs, They then identify and analyze a variefy of ways to reduce or eliminate the waste. Specific measures to achieve th.at goal are recommended and the essential supporting technological and economic information is developed. Finally, a confidential report which details the WMAC's findings and recommendations including cost savings, implementation costs, and payback times is prepared for each client manufacturer.
69
PLANT No. 1 (SIC 2851)
RESULTS
This plant produces paints, coatings, stains. and surface-treating products at an overall rate o f about 1.1 million gallons/year for regional distribution on a schedule of 2080 hours/year for 52 weeks. I ts operations primarily involve blending and mixing of raw materials, followed by product testing and packaging and by cleaning of vessels and lines. Color separation in t each lot must meet a variety of other customer specifications.
Plant Operations
product is obviously important,
Individual lots of water-based and solvent-based paints are mixed in a variety of tanks from 200 to 1000 gallons’ capacity. ingredients for this initial step include (for water-based) water, latex, resins, extenders, and dispersed pigments. For solvent-based paints the materials are generally similar in type, but obviously solvent replaces water and latex, and the other new ingredients include plasticizers, tints, and thinners.
After batches are made up they are transferred to so-called let-down tanks, where additional water (or solvent), resins, preservatives, anti-foaming agents, thinners, and bactericides are added. Tesling o f batches encompasses at least color, viscosity, and gloss, and those lots which meet specificakions are filtered and charged to cans for labeling, packaging, and shipping.
Waste Generation and Existina Waste Manaaernent Practices
The principal waste streams are the result of equipment cleaning, especially from water-based paints. For example, rinsing the let-down tanks ordinarily requires about 35 gallons of rinse water, but that value increases to 53 gallons if light paint is to be blended after a dark predecessor. The hazardous nature of water rinses is due to mercury from the bactericide in the paint.
In some instances, rinse water from the mixing tanks is held in 500-gallon tanks and used in the let- down tanks (instead of fresh water) to formulate future batches of water-based paint. The rinses are separated according to the color intensity o f paint in the tanks from which they were derived. For example. rinses from white paint formulation amount to about 70% of the total, and they are invariably used again.
Waste rinses not used again are piped to holding and flocculation tanks, to which aium is added to lower the pH, in which some solid is precipitated by adding flocculant, and from which supernatant liquid is removed for re-use in other paint formulations.
Tanks used for solvent-based paints are rinsed with’mineral spirits at a rate of about 5 gallons/400- gallon tank. These washings are sent off-site for recovery, followed by recycling or sale as fuel.
In addition to re-use of rinse water and recovery of solvent, this plant has adopted the following measures to reduce waste generation:
Cleaning equipment before the paint dries and hardens.
e Eliminating hazardous materials, except for mercury in the bactericide added to ouldoor water-based paint
Avoiding hazardous container waste by purchasing the bactericide in water-soluble b a 9 s which dissolve during paint formulation.
* Scheduling batch formulations so that light ones precede dark ones and thereby reduce the total volume of rinses.
70

. Reducing the inventory of raw materials to avoid degradation and spoilage and lo assure high-quality product that can be sold, rather than low-quality paint which adds to the burden of waste disposal.
W Using bag filters to collect dust.
Waste Minimization Boportunities
Table 1 summarizes the principal sources of waste, their amounts. the management method applied, and the associated costs.
Table 2 offers a brief description of each recommended WMO (Waste Minimization Opportunity) and of current plant practice, together with savings and cost data. Considered individually, the three WMOs recommended could save over $22,00O/year, which represents about 25% of current waste management costs. Each has a simple payback time less than one year.
71

TABLE 1. SUMMARY OF WASTE GENERATED (SIC 2851)
WASTE TREATMENT WASTE DISPOSAL
C o s t Amount c o s t Amount - WASTE STREAM
HAZARDOUS L I Q U I D WASTE
A. W a t e r - b a s e d Waste:
Equ i pment c l ear1 i ng by w a t e r w a s h i n g
8 . S o l v e n t - b a s e d Waste:
Equ ipmen t c l e a n i n g by s o l v e n t w a s h i n g
TOTALS
26 .700 g a l $3.740 ( ~ g w a t e r and p a i n t )
26 .700 g a l $3,740
26.700 g a l $48 ,040 o f f - s i t e
27,200 g a l $37,080 ( m i n e r a l s p i r i t s 1 o f f - s i t e
53,900 g a l $ 8 5 , 1 2 0
72

TABLE 2 . SUMMARY OF W A S T E M l N I M i Z A T l O N O P P O R T U N l T i E S RECOMMENDED (SIC 2851)
WMO No. P r e s e n t P r a c t i c e P r o p o s e d A c t i o n C o s t S a v i n g s
1 W a t e r r i n s e s remove p a i n t I n s t a l l a p i p e - c l e a n i n g s y s t e m E s t i m a t e d w a s t e r e d u c t i o n = 1,780 g a l l y r f r o m tanks and p i p e s c o n s i s t i n g o f 3 d i f f e r e n t - s i z e d E s t i m a t e d c o s t s e d u c t i o n = S ~ ~ ~ l l O / y r
foam p l u g s o r - p i g s * Lo b e s e n t E s t i m a t e d i m p l e m e n t a t i o n c o s t = $1,600 t h r o u g h o u t t h e p i p e s by S i m p l e payback = 2 months c o m p r e s s e d a i r . P a i n t I S t h u s f o r c e d f r o m t h e l i n e s and t o t h e c a n n i n g l i n e f i l t e r . The u s e o f w a t e r a n d amount o f w a s t e a r e i o w e r . ( T h i s WMO i s a p p l i c a b l e t o n o n - w h i t e p a i n t s . )
2
3
A b o u t 15 g a l s o l v e n t p e r b a t c h o f p a i n t i s drummed a n d s e n t o f f - s i t e f o r d i s p o s a l .
A b a c t e r i c i d e c o n t a i n i n g m e r c u r y i s b e i n g u s e d i n w a t e r - b a s e d p a i n t s .
Use a s o l v e n t r e c o v e r y s y s t e m b a s e d u p o n d i s t i l l a t i o n a n d s h i p t h e small amount o f r e m a i n i n g s o l i d t o a h a z a r d o u s w a s t e d i s p o s a l s i t e .
E l i m i n a t e t h e b a c t e r i c i d e f r o m w a t e r - b a s e d i n t e r i o r p a i n t s and s u b s t i t u t e an o r g a n i c m a t e r i a l . ( T h i s WMO i s a p p l i c a b l e t o n o n - w h i t e p a i n t s . ) T h e r e I S no c o s t d i f f e r e n c e b e t w e e n t h e s e add1 t i v e s .
E s t i m a t e d w a s t e r e d u c t i o n =
E s t i m a t e d c o s t r e d u c t i o n P
E s t i m a t e d i m p l e m e n t a t i o n c o s t = S i m p l e p a y b a c k =
E s t i m a t e d w a s t e s e d u c t i o n - E s t i m a t e d c o s t s e d u c t i o n P
E s t i m a t e d i m p l e m e n t a t i o n c o s t = S i m p l e p a y b a c k =
3.300 g a l / y r
$4,950 11 months
$ 5 a 4 2 0 / y r
3 . 1 0 0 g a l / y r 5 5 . 5 8 0 / y r n o n e i mmed i a t e

PLANT No. 2 (SIC 3443)
This plant manufactures aluminum brazed oil coolers for use in heavy equipment. It produces approximately 59,290 units each year.
Manufacfurinq Operations
The raw materials used in the production of the oil coolers include aluminum in sheet and coil form, aluminum castings and extrusions, tubes, fittings, brackets, caution labels, and plastic plugs.
The following steps are involved in production:
e Shearing, punching, and forming operations to fabricate the oil cooler tanks, headers, air fins, sides, and oil turbulator fins.
Degreasing of oil cooler tanks, headers, sides, fittings, and brackets. The solvent Chlorothene (95% 1, l , l - trichloroethane) is used in an open-air, steam-heated vapor degreaser. The unit is equipped with a refrigeration unit which condenses Chlorothene vapor and minimizes evaporative losses to surrounding plant air.
. Recycling of spent Chlorothene to the degreasing operation using an on-site still. Chlorothene is continuously circulated between the degreaser and a steam-heated solvent recovery still. Still bottoms containing spent Chlorothene, water, and oil are shipped o f f - site as hazardous waste.
0 Assembly of oil coolers.
* Brazing of assembled oil coolers to join the internal and external coil fin surfaces for enhanced heat transfer. The oil coolers are first preheated in a gas-fired oven at 1020° F for
tes. They are then dipped into an electrically-heated molten salt bath containing a chloride-based compound, lithium chloride, and aluminum fluoride for 1 112 minutes
at 1128O F and dipped in a water quench tank. Sludge from the salt bath and quench tanks is disposed in the outdoor on-site sand filter bed. Solids remaining in the filter are landfilled on company property; water is fed to the settling pond and eventually discharged lo a river
* Cleaning of oil coolers to remove all residual salt, expose copper cells (which could cause corrosion failure), and condition metal surface prior to painting. The following steps are
* submersion in a 2% nitric acid bath (1-2 hour residence time) 0 cold water rinse
dipping in NaOH caustic soda etching solution hot water (1 02'F) rinse cold water rinse dipping in a 50% nitric acid bath 2 cold water rinses dipping in a chromic acid wash 2 de-ionized water rinses drying in a natural gas-fired oven
atment of hazardous spent process solutions andcontaminated rinse water streams The ids are treated in a neutralization tank with lime for pH control and flocculant to e n h a r c e
removal of suspended solids. The solution leaving the tank I S pumped to a clarifier L%hich removes solids and allows filtered water to flow to the settling pond. A solids-rich stream i s pumped to a sludge-thickener settling tank for secondary sedimentation. Supernate from the settling lank is transferred to the sand fitter beds for final water removal before on-site landfilling of solids.

Treatment of effluent from the chromic acid and de-ionized rinse water washes. These hazardous waste streams contain chromium in hexavalent form. The streams are treated to obtain a sludge containing less toxic trivalent chromium compounds. Several chemical agents are added to the waste to produce relatively insotublecompounds which ate recovered on the sandfiiter beds and disposed in the landfill. The liquid is pumped to the settllng pond and is eventually released to the siwer.
Painting of si1 coolers. The coolers are dipped in a paint-filled tank, allowed to drip after immersion, and transferred to a spray booth for additional spray painting. Paint is collected on floor coverings (plastic sheet or cardboard) and in spray booth filters and disposed of daily in barrels whish are sent to an off-site landfill.
Existins Waste Manaaement Practices
The plant has taken the following steps in managing its hazardous wastes.
0 The plant owns and operates a landfill for its private use.
Chromium reduction from hexavalent to trivalent form is performed in-house.
A refrigeration unit and a solvent recovery still have been added to the degreasing unit to
The plant constantly monitors its waste-stream effluents and has installed its own hazardous
Water-based paints are currently used,
The plant has a designated professional staff person based at corporate headquarters who
e
. minimize evaporative loss and liquid waste.
0
waste treatment facility
E
0
periodically visits satellite plant locations to provide assistance in both hazardous waste monitoring and management techniques.
Waste Minimization Opportunities
The waste currently generated by the plant, the source of the waste, the quantity of the waste, and the annual treatment and disposal costs are given in Table 3.
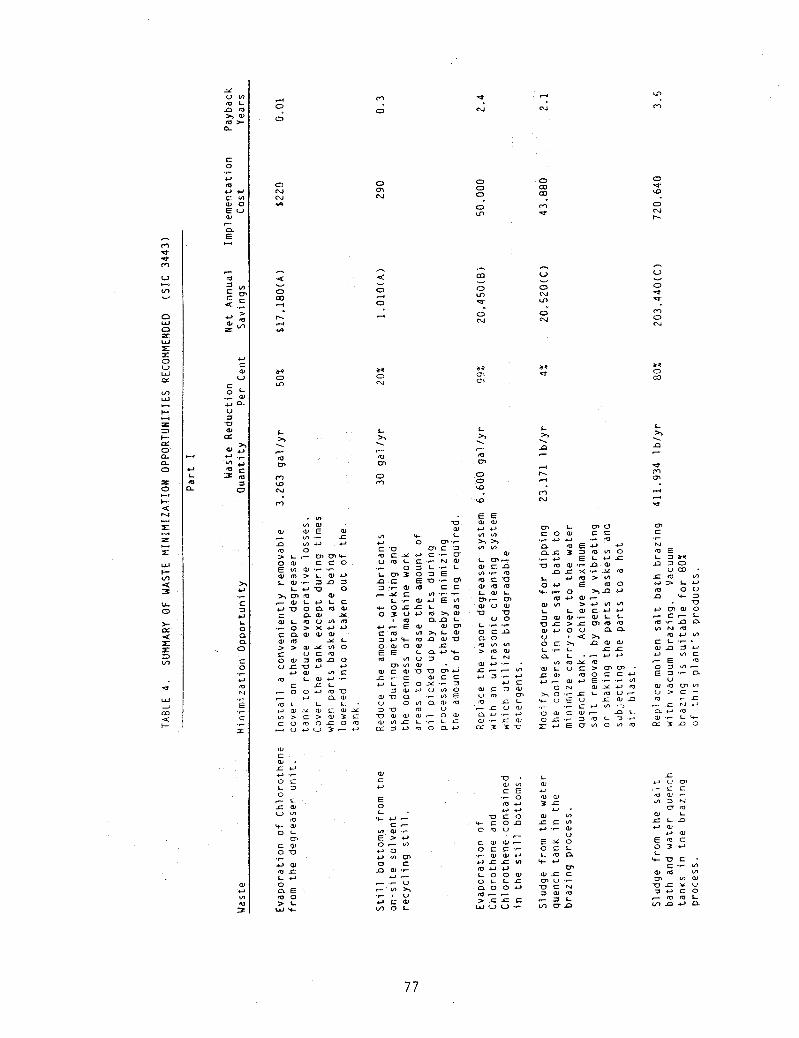
Table 4 shows the opportunities lor waste minirnimatisn that the WMAC recommended for the plant The waste in question, the minimization opportunity, the possible waste reduction and associated savings. and the implementation cost along with the payback time are given.
DISCUSSION OF RESULTS
The two plants described have annual waste management costs of $ 1 88,370 and the WMACs were able to recommend to them a ser ies of cost-saving measures which add up to $359.980 per year The savings tolat exceeds the aggregate waste management cost because, in one of the two plants. the measures recommended save more than the cost of waste treatment, disposal, and recycling.
For example, in plant No 2 , only a $ 1 3,485 waste management cost is presently associated wl!h paint- contaminated f i l ters and cardboard and plastic sheets but elimination of the painting i s estimated to save almost $60.000 per year. Typically, savings in raw materials costs of 25 to 80% can be achieved by the recommendations offered. It is not hard 10 see how this kind of savings can add up to more than the costs of waste management in some plants.
The cost-saving approach taken with these results is generally conservative, because the WMOs address only the avoidance of raw materials costs and the reduction of present and future costs associated
75

TABLE 3 . SUMMARY OF WASTE GENERATED (SIC 3443)
Annua l Waste Management C o s t
W a s t e - G e n e r a t e d S o u r c e o f Was te O u a n t i t y G e n e r a t e d
S t i l l b o t t o m s c o n t a i n i n g s p e n t , c o n t a m i n a t s d C h l o r o t h e n e ( 9 5 % - 1 . 1 . 1 - t r i c h l o r o e t h a n e ) . w a t e r . and o i l .
E v a p o r a t i o n o f C h l o r o t h e n e .
S1 u d g e c o n t a i n i n g compounds d e r i v e d f r o m t h e s a l t b a t h c o n s t i t u e n t s . i m p u r i t i e s f r o m t h e b a t h s , and c o n t a m i n a n t s o n t h e p r o d u c t s ’ s u r f a c e s .
S l u d g e c o n t a i n i n g v a r i o u s s o l i d s f r o m t h e t r e a t m e n t o f t h e s p e n t c l e a n i n g s o l u t i o n s .
S l u d g e c o n t a i n i n g v a r i o u s compounds f r o m t h e c h r o m i u m r e d u c t i o n p r o c e s s .
P a i n t - c o n t a m i n a t e d f i 1 t e r z a n d c a r d b o a r d and p l a 5 t , i c s h e e t s .
O n - s i t e s o l v e n t r e c y c l i n g s t i l l a s s o c i a t e d w i t h t h e d e g r e a s i n g o p e r a t i on.
D e g r e a s i n g o p e r a t i o n .
150 g a l l y r
6 ,525 g a l l y r
S a l t b a t h t a n k a n d w a t e r q u e n c h t a n k i n 514 .917 1 b / y r t h e b r a z i n g p r o c e s s . The s l u d g e i s c o l l e c t e d o n t h e sand f i l t e r b e d s .
T r e a t m e n t p r o c e s s f o r s p e n t s o l u t i o n s l.171.060 l b / y r f r o m t h e c l e a n i n g o f t h e b r a z e d p r o d u c t . The s l u d g e i s C o l l e c t e d o n t h e s a n d f i l t e r b e d s .
Chromium r e d u c t i o n p r o c e s s . The s l u d g e 88.943 l b l y r i s c o l l e c t e d on t h e sand f i l t e r b e d s .
P a i n t i n g o f p r o d u c t . 9.812 l b l y r
84.650
Q ( a l
28,500
36.375
16.500
13.485
( a ) C u r r e n t l y t h e r e a r e 110 w a s t e management. c o s t s a s s o c i a t e d w i t h t h e e v a p o r a t i o n o f C h l o r o t h e n e .
m N
LD
m d 0
Q
0 N N e
- < 0 Y
m ,--I
r-. .-.I .A
M 0 Ln
L h \ - m m m u3 N
m
W c
N 0
0 .rp u3
0 N h
A
V
0 d Q
m 0 N
u
a* 0 m
L h . n - w m m 4 .-(
Q
m e .r
0 m m m -5
- V
0 N m 0 c\1
v
0
-J m
&a 0 N
b h . P
m cn 0 m
m e.I
E E w w u u ' n u l
h h v ) ' n
W
. V l
' n w W E w V l r c
n # u Q m 0 5 L - mmLc o w C C O E +A w 'C .C
w m > L w U L w v - 3Ll 3
L U W 0 h m m a,
, W L U L C o w o n m w c n w Y w 6 m u v ) m
. , - Q > X U U e n w w a w m Y L > > W Y v ) O c u c m o w z m n o u c u u - u w Y l C m L W O -
c . c L - 0 o u m u m L L L . o w x w c W Y v ) > C > W 3 K ~ 0 m O . c O m C . u o v 3 - - e ,
- Q n w
0, L m u r a w C C
L m.- w ~n v) .- m m c n w m m L W L 0-8- m w u w T 7 - a u o L .r .C
o c n n o m u ) - > m w
L N W U V - . c?-- v) u 2 . - u
u c W C 2 W u m D m 1 I L 7 . 8 u w n o .- u a ! r . c w lx 3 x u
W C w -
c b . J u r o s L 3 0 ,-L r w UVl
L e w O L
m C W o u o w m c L U 0 B E m o , L W ' c
m
.r
.c u u m w v )
C E ...- 0 m u u e
u c o 't c o n - emu c w w - 0 c C-- .C w w u u c r VI m u u L O O W O L L f a o o o m - . - >.Is c w v v v -
u w E m . c
77

TABLE 4. SUMMARY OF WASTE MINIMIZATION OPPORTUNITIES RECOMMENDED (SIC 3443)
P a r t 11
Waste Reduct ion Net Annual Imp lemen ta t i on Payback - c o s t Years P e r Cent Savings Ouant i t y W a s t e M i n i m i z a t i o n O p p o r t u n i t y
Reduce p a i n t l o s s by i n s t a l l i n g a l o w - p r e s s u r e a i r - j e t system ove r t h e p a i n t d i p p i n g area t o b low excess p a i n t downward i n t o t a n k . I n s t a l l an I R p a i n t - d r y i n g lamp t o p r e v e n t d r i p p i n g when c o o l e r s a r e moved t o t h e spray b o o t h a rea
2,180 l b / y r 22% 4.350 ( D ) 2.490 0 . 6 P a i n t - c o n t a m i n a t e d cardboar'd and p l a s t i c shee ts .
36% 11.200 ( 0 ) 13.200 1 . 2 P a i n t - c o n t a m i n a t e d f i l t e r s and ca rdboard and p l a s t i c shee ts .
I n s t a l l an e l e c t r o s t a t i c spray p a i n t system f o r a p p l i c a t i o n o f t h e o i l c o o l e r second c o a t o f p a l n t i n o r d e r t o reduce ove rsp ray 1 o s s .
3.513 l b / y r
4.906 l b / y r 50% 59,720 (D) 0 .5 28,440 D i s c o n t i n u e t h e p r a c t i c e o f p a i n t i n g o i l c o o l e r s wh ich w i l l be r e - p a i n t e d by t h e customer.
P a i n t - c o n t a m i n a t e d f i l t e r s and ca rdboard and p l a s t i c shee ts .
( A ) I n c l u d e s c o s t sav ings a t t r i b u t e d t o t h e avo ided purchase o f Ch lo ro thene . ( B ) T o t a l sav ings have been reduced by t h e c o s t o f d e t e r g e n t s r e q u i r e d . ( C f I n c l u d e s c o s t sav ings a t t r i b u t e d t o t h e avoided purchase o f s a l t b a t h c o n s t i t u e n t s . (D) I n c l u d e s c o s t sav ings a t t r i b u t e d t o t h e avo ided purchase o f p a i n t s u p p l i e s .

with waste treatment and disposal. Not claimed are the savings related to: possible changes in emission standards, any liability incurred from waste management practices, and co'sts arising from employee health and safety problems. It should also be noted that each WMO identified is treated as an isolated individual measure and no consideration has been given to effects occurring because of interactions among WMOs.
The WMAC program is continuing to serve eligible manufacturers, and future results are expected to allow mare generalizations about the amounts and types sf industrial waste materials encountered in the nation's plants.
I! seems reasonable to conclude from recent WMAC program experience that small and medium- size manufacturers:
0 Have recognized many of their waste generation problems and have undertaken a variety of
Are receptive toward practical quality assistance, offered in their plank objectively a n d
actions to address them.
e
competently, that can help them to choose cost-effective waste minimization opportunities over and above what lhey have been able to achieve on their own.
Acknowledqment
The authors wish to express their appreciafion to EPA's Rrsk Reduction Engineering Laboratory for support of the Waste Minimization Assessment Centers and the opportunity to prepare this paper They also want to acknowledge the waste minimization assessments performed and reports prepared by Qr. Richard J. Jendrucko and Ms. Phylissa S. Miller at the University of Tennessee and by Dr. Harry W. Edwards, Dr. 6. Byron Winn, Mr. John R. BIeem and Mr. Michael Kostrzewa at Colorado State University. Their work provided the data upon which this paper is based.
79