wastewater as a water resource design, and …
TRANSCRIPT
The Pennsylvania State University
The Graduate School
College of Agricultural Sciences
WASTEWATER AS A WATER RESOURCE
DESIGN, AND OPERATION OF AN INTEGRATED BIOFILTER
WASTEWATER TREATMENT AND REUSE SYSTEM
A Dissertation in Horticulture
by
Robert D. Cameron
© 2011 Robert D. Cameron
Submitted in Partial Fulfillment
of the Requirements
for the Degree of
Doctor of Philosophy
August 2012

The dissertation of Robert D. Cameron was reviewed and approved* by the following:
Robert D. Berghage
Associate Professor of Horticulture
Dissertation Adviser
Chair of Committee
E.Jay Holcomb
Professor Emeritus of Floriculture
Dan Thomas Stearns
Styer Professor of Horticultural Botany
Allan Gunnar Sonsteby
Senior Research Associate
Richard Marini
Department Head Plant Science
*Signatures are on file in the Graduate School.
ii

ABSTRACT
The modern method of managing wastewater requires removal from the source as
quickly as possible to a centralized treatment system before discharging to a
receiving body of water. Although this method is in large part responsible for the
near elimination of the major outbreaks of water borne diseases in developed
nations, the approach is unsustainable due to infrastructure costs and its
ineffectiveness to eliminate many organic compounds. An alternative approach
is to regard wastewaters as a resource.
An effective and cost efficient decentralized management system was designed to
convert wastewater into a water resource. Constructed wetlands, living wall, and
living columns were integrated into a single system with a footprint less than 15
square feet. Designated an integrated biofilter (IBF); the system treated up to 50
gallons of gray water or black water in a batch process. Analyses for 26
parameters demonstrated the IBF capable of decreasing levels of pollutants such
as organics (BOD) and surfactants by 99% in 24 hours and meeting applicable
discharge limits. Existing decentralized management systems such as constructed
wetlands require significantly longer detention times to attain similar rates of
attenuation.
Continuous flow of wastewater through the IBF was compared to intermittent
flow to compare rates of pollutant attenuation. Cycling the wastewater through
the IBF for four 1 hour intervals was as effective in removing pollutants as
continuous flow.
Components of the IBF were also evaluated to determine contribution of each.
Results demonstrated the effectiveness of the entire system was superior to the
attenuation achieved by the sum of the individual components. Green roof
biofilters were also evaluated for effectiveness in reducing pollutants in gray
water. Potential exists to integrate green roofs with IBFs.
The IBF was also evaluated to determine the potential to manage wastewater as a
water resource. Energy studies were conducted using replicate buildings at
iii

the Pennsylvania State University’s Center for Green Roof Research. IBFs were
positioned on the south wall of two buildings. Impacts to the south wall
temperature profile and the buildings’ energy use for air conditioning were
evaluated, while gray water was cycled through the IBFs. Decreases of south
wall exterior mean temperatures up to 68% and internal south wall temperatures
up to 28% were observed. Energy usage for cooling decreased by 16%. IBFs
also affected the timing of peak temperatures. Cycling of gray water through a
green roof was also studied for the impact on building temperature and energy
usage. Although temperature reductions were observed, no significant reduction
in energy use was found when compared to a green roof without gray water
application.
Treated gray water was applied to a traditional, asphalt shingle roof to evaluate
potential to reduce building envelope temperatures and resulting energy use for
cooling. Results demonstrated a 52% reduction to the temperature outside the
ceiling insulation and reduction of energy use by 11% compared to a control
building. Temperature reductions were superior to those achieved with green
roofs.
The potential to incorporate IBFs into residences as functional architecture was
evaluated. Applications included living showers and living window wells.
Food crops such as herbs and tomatoes were cultivated in IBFs with gray water.
No adverse impacts on growth were observed.
The IBF wastewater management system was demonstrated to be effective at
attenuating pollutants and utilizing wastewater as a valuable resource. Avoiding
disposal costs associated with centralized waste water treatment plants, while
obtaining savings from reduced energy expenses, make wastewater management
with an IBF a viable alternative.
iv

Table of Contents
LIST OF FIGURES……………………………………………………..……………………………………………………………… ix
LIST OF TABLES……………………………………………………….……………………………………………………………….xii
LIST OF ABBREVIATIONS…………..…………………………….….……………………………………………………….….xiv
ACKNOWLEDGEMENTS……………….………………………………………………………………………………………....xv
Chapter
1. INTRODUCTION ........................................................................................................................... 1
2. LITERATURE REVIEW .................................................................................................................. 2
2.1 Development of Wastewater Treatment Technologies ........................................................ 2
2.1.1 Historical Perspective .................................................................................................... 2
2.1.2 Centralized Treatment versus Decentralized Treatment ….……………………………………….3
2.1.3 Combined Sewer Systems …..…………….………………………………………………………………………4
2.1.4 Limitation of Centralized Treatment Systems…………………………………………………………….5
2.1.5 Return to Decentralized Treatment System……………………………………………………………….6
2.2 Biofilters for Pollutant Attenuation
2.2.1 Constructed Wetlands ………………………………………………………….………………………………….7
2.2.2 Green Roofs………………………………………………..…………………………………………………………..8
2.2.3 Living Walls………………………………………………..……………………………………………………………9
2.3 Summary of Wastewater Management………………………………….....…………………………………..10
3. DEVELOPMENT OF AN ALTERNATIVE DECENTRALIZED TREATMENT SYSTEM …………………….11
3.1 Integrated Biofilter: Converting Wastewater to a Water Resource………..……………………..11
3.2 Materials and Methods………………………………………………………………………………………………….13
3.3 Results and Discussion……………………………………………………………………………………………………15
3.4 Conclusion……………………………………………………………………………………………………………………..22

4. FURTHER ATTENUATION OF WASTEWATER CONSTITUENTS….……..……..24
4.1 Overview of Additional Gray Water Studies..……………………………………………24
4.2 Variability of Gray water……….………………………………………………………..25
4.3 Methodology of Additional Gray Water Studies…….………………………………….25
4.3.1 IBF without Plants……………………………..…………………………………..25
4.3.2 Planted IBFs……………………………….…… ………………………………...27
4.3.3 Intermittent versus Continuous……………………....…………………………….28
4.3.4 Constructed Wetlands…………………………….……………………………......29
4.3.5 Green Roofs……………………………………………………………………......29
4.3.6 Shower……………………………………………………………………………..31
4.4 Results and Discussion……………………………………………………………………….…………………………32
4.4.1 Impact to Pollutant Parameters..………………………………………………….……………….……..32
4.4.1.1 BOD………………………………………………………………………………………………………32
4.4.1.2 Surfactants……………………………………………………………………………………………34
4.4.1.3 Nitrogen……………………………………………………………………..………………………..36
4.4.1.4 Boron…………………………………………………………………………………………………….39
4.4.1.5 Fecal Coliform……………………………………………………………………..………………..41
4.4.1.6 Phosphorus……………………………………………………………………………………………42
4.4.1.7 Metals……………………………………………………………………………………………………44
4.5 Summary of Results….………………………………………………………………………..…………………………47

5. WASTEWATER AS A WATER RESOURCE: ENERGY
5.1 Overview……………..…………………….……………………………………………..49
5.2 Methodology……………………..……………………………………………………….50
5.2.1 Solar Impact on Wall Orientation………………………….……………………......50
5.2.2 Mechanism of Heat Transmission in Buildings……………………………………..52
5.2.3 Test Site Layout and Building Design Specifications……….………………………53
5.2.4 Energy Measurements ………………………………………..…………………….60
5.2.5 Energy Use Comparisons………………………………………..…………………..62
5.3 Evaluation of IBF on Buildings’ South Walls vs. No IBF…………………..…………...62
5.3.1 Evaporation Observations…………………………………………………………..72
5.4 Evaluation of IBF Performance under Constant and Intermittent Flow Regimens………73
5.5 Mean Roof Temperatures of Living Roofs versus Non-Living Roofs...………………….77
5.6 Living Roof with Gray Water Application………………...……………………………...82
5.7 Flooded Non-Living Roof ……...………………………………………………................84
5.8 Summary of Energy Studies ………...………………………………………………….....90
6. SUMMARY AND CONCLUSIONS…………………………………………………………………………………….92
6.1 Accomplishments of the Research…………………………………………………………..……………………92
6.2 Implications of the Results: Societal Impacts……………………………………………………..………..93
6.2.1 Avoided Costs………………………………………………………………………………………………………..93
6.2.1.1 Wastewater Treatment…………………………………………………………………..……..93
6.2.1.2 Energy Use Reduction…………………………………………………………………………….94
6.2.2 Urban Heat Island Effect and Peak Power………………………………………..…………………..95

6.2.3 Role of Evapo-Transpiration in Creating Net Zero Discharge………………………………..96
6.2.4 Agricultural Applications……………………………………….……………………………….…………….97
6.2.4.1 Urban Gardening: Cultivating Crops in IBS Using Graywater……….………..97
6.2.4.2 Health Considerations…………………………………………………………………………..97
6.2.4.3 Applications for Education Progams…………………….………………………………..98
6.2.5 Disaster Relief…………………………………………………………………..……………..……………………98
6.3 Limitations and Future Research……………………………………….……………………………..…………..99
REFERENCES CITED ……………………….……………………………………………………..………………………………..100
APPENDIX A Wastewater Analysis Reports From PSU Ag. Analytical Laboratory……………….109
APPENDIX B Meteorological Data At Center For Green Roof Research………………………………111
APPENDIX C Additional Data For Impact Of IBF On Wall Temp. For Period 8/1-8/12………….115
APPENDIX D Analysis of Makeup Water…………………………………………………………………………….117
APPENDIX E INCORPORATING BIOFILTERS IN RESIDENTIAL APPLICATION………………...118
E.1 Innovative and Cost Effective Biofilters for Small Scale Residential Applications…….118
E.1.1 Urban Agriculture Applications………………….……………………….…..........119
E.1.1.1 Roof top Garden Maintenance…………………………………………...122
E.1.2 Unique Niches: Window Well IBF…………………………………………………………………………127
E.1.3 Converting Wastewater into a Water Resource: Interior IBFs.…………………………..…128
E.2 Summary……………………………………………………………………………………………………………………..130
APPENDIX F Reducing Building Temperature with Living Wall Wastewater Treatment….…131
APPENDIX G Statistical Analysis of Wastewater Data ………………………………………………………..145

LIST OF FIGURES
Figure Page
3.0 1 Washing Machine with Graywater Discharge Pipe to Integrated Biofilter 15
3.02 Integrated Biofilter on South Side of Test Building 16
3.03 IBFs- Columns Exposed(left side), Columns Wrapped in Wood Fiber Mat(right side) 16
3.04 BOD Levels Of Graywater : Pretreatment Versus Post Three Day Treatment 19
3.05 Constructing an integrated biofilter at Math/Science Academy, La. 21
4.01 Redesigned Living Wall Grid 26
4.02 Planted IBF 26
4.03 Water Samples: Post treatment (left) vs. Pretreatment (right) 28
4.04 Roof Gray Water Distribution System 30
4.05 Gray water discharge through grid 30
4.06 Interim holding tank for Graywater 31
4.07 Holding tank at IBF2 31
4.08 Residential Water Use Indoor/Outdoor 48
5.01 Building layout at the Russell E. Larson Agricultural Research Facilities 50
5.02 Annual Solar Variation for State College, PA 51
5.03 Comparison of a Test Building's External Wall Temperatures 52
5.04 Building Heat Transfer Processes 53
5.05 Green roof Profile Schematic for Study Facilities 54
5.06 Plan view of building layout and schematic cross-section 55
5.07 Air conditioner location 56
5.08 Profile of green roof with thermistor placement layers 57
5.09 Measurement system schematic for data collection 58
5.10 Wall cross-section 59
ix

5.11 Plan view layout of thermistor locations on green roofs 60
5.12 Test Site at Russell E. Larson Depicting Two of the Buildings with IBF 63
5.13 Ambient Temperatures for July 1-7 at Test Site 64
5.14 South Wall Temperatures of Buildings without IBF for July 1-7 64
5.15 Daily Solar Radiation at Test Site From July 1-7 65
5.16 Temperatures of Internal Building with no AC, External South Wall, and Roof Surface 66
5.17 Temperatures of Internal Building with AC, External South Wall, and Roof Surface 66
5.18 Mean South Wall Exterior Temps. of Bldgs. with IBF vs. Bldgs with no IBF 68
5.19 Mean South Wall Internal Temps. of Bldgs. with IBF vs. Bldgs, with no IBF 68
5.20 Mean South Wall External Temperatures of Bldgs. with IBFs vs. Bldgs. with no IBFs 70
5.21 Mean South Wall Internal Temperatures of Bldgs. with IBFs vs. Bldgs. with no IBFs 71
5.22 Impact of IBF and Flow Regimen on Mean South Wall External Temperatures 8/30-9/3 74
5.23 Impact of IBF and Flow Regimen on Mean South Wall External Temperatures 9/6-15 74
5.24 Impact of IBF and Flow Regimen on Mean South Wall Internal Temperatures 8/30-9/3 75
5.25 Impact of IBF and Flow Regimen on Mean South Wall External Temperatures 75
5.26 Impact of IBF and Flow Regimen on Mean South Wall External Temperatures 9/7-8 76
5.27 Mean Outside Roof Temperatures of Green Roofs vs. Asphalt Shingled Roofs for July 79
5.28 Mean Inside Roof Temperatures of Green Roofs vs. Asphalt Shingled Roofs for July 80
5.29 Temperatures within Green Roof Layers 8/2-8/4 80
5.30 Temperature Variation within Asphalt Shingled Roof Profile 81
5.31 Gray Water Distribution System on Test Building with Green Roof 82
5.32 Mean Roof Surface Temperatures of Green Roofs with/without Water Application 83
5.33 Mean Roof Inside Temperatures of Green Roof with/without Water Application 84
x

5.34 Mean Surface Temperatures of Green Roofs vs. Asphalt Shingled Roof 85
5.35 Mean Roof Inside Temperatures of Green Roofs vs. Asphalt Shingled Roof 85
5.36 Treated Wastewater Application System on Asphalt Shingled Roof 86
5.37 Mean Roof Surface Temps of Green Roofs vs. Wet Asphalt Shingled Roof 9/20-26 87
5.38 Mean Inside Roof Temps of Green Roofs vs. Wet Asphalt Shingled Roof 9/21-25 88
5.39 Impact of Water Application to Inside and Surface Temps. of Asphalt Shingled Roof 88
5.40 Energy Use of Building with Roof Water Application vs. No Water - September 20-27 89
xi

LIST OF TABLES
Table Page
3.01 Characterization Of Pretreatment Graywater 18
4.01 Additional Gray Water Studies 24
4.02 Impact Of Treatment On BOD Levels (mg/L) 32
4.03 Impact Of Treatment On Surfactants Levels (mg/L) 35
4.04 Impact Of Treatment On Fertilizer-N Levels (mg/L) 37
4.05 Impact Of Treatment On Nitrate-Nitrogen Levels (mg/L) 37
4.06 Impact Of Treatment On Boron Levels (mg/L) 40
4.07 Impact Of Treatment On Phosphorus Levels (mg/L) 43
4.08 Impact of Treatment on Magnesium Levels (mg/L) 44
4.09 Impact of Treatment on Manganese Levels (mg/L) 45
4.10 Impact Of Treatment on Copper Levels (mg/L) 45
4.11 Impact of Treatment on Zinc Levels (mg/L) 46
xii

5.01 Basic Geographic Data for State College, PA 50
5.02 Mean Maximum Monthly Exterior South Wall Temp. with IBF vs. No IBF 67
5.03 Mean Maximum Monthly Interior South Wall Temp. with IBF vs. No IBF 69
5.04 Mean Water Loss Observed During IBF Treatment Studies 72
5.05 Building Energy Use For September 20-26 89
xiii

LIST OF ABBREVIATIONS
BOD Biological (biochemical) Oxygen Demand
Btu British thermal unit
CSS Combined Sewer System
CSO Combined Sewer Overflow
CWM Centralized Wastewater Management
DWM Decentralized Wastewater Management
ET Evapotranspiration
FWS Free Water Surface
HRT Hydraulic Retention Time
IBF Integrated Biofilter
kWh kilowatt hour
OSB Oriented Strand Board
PVC Polyvinyl Chloride
SSS Separate Sewer System
SF Subsurface Flow
USEPA United States Environmental Protection Agency
xiv

ACKNOWLEDGMENTS
Pursuing a doctorate in the sciences is an arduous task at any age. But, for someone
“along in years” the pursuit presents some unique challenges. Consequently, there are
many people to acknowledge for their role in helping to overcome these challenges and
make this goal a reality.
Certainly, one’s family is critical to the success of such an endeavor. I am fortunate to
have a wife who possesses all of the innate traits needed to endure the sacrifices that this
process requires. Perhaps as important, Debra has been an unflagging cheerleader with
her encouragement and support. Similarly, my children, Brian, Madison, and Baylie,
have been supportive despite relocation to a new town and schools. Brian, not only
tolerated having his Dad at the same University while he pursued his degrees, but seemed
to relish having me on campus, even if only to beat me at racquetball. Just a few months
short of my completing the writing of this dissertation, both of my parents died. I am
who I am, primarily because of them. I am forever grateful to them and my family.
In doing research, we stand on the shoulders of all of the scientists who have come
before! I so appreciate and admire the tireless efforts, the mental acuteness, and the
insatiable curiosity that has progressed human civilization. To that end, I single out the
present members of my committee, Robert Berghage, Jay Holcomb, Allan Sonsteby, and
Dan Stearns, as well as former members Roger Koide, and Jason Kaye, for their unselfish
support in the face of hectic and demanding schedules. Also, my deepest appreciation to
Robert Berghage and the late David Beattie for having the foresight to develop the Center
for Green Roof Research and who never hesitated, ridiculed, or questioned my dream to
obtain my doctorate this late in life.
It is fitting to acknowledge the fire and resulting personal economic disaster that took
everything material, providing a clean slate for me to undertake this goal…. at the time it
seemed such a catastrophe, but indeed, the sweetest lemonade can be made from the
most sour of lemons.
Finally, to any who should read this work…….
Remember, you’re never too old to pursue your dreams!
xv

EPIGRAPH
"If your knees aren't green by the end of the day, you ought to seriously re-examine your life."
— Bill Watterson, "Calvin and Hobbes"

INTRODUCTION
Our planet’s surface is nearly 75% covered with water. However, less than 1% of all
water is available for human consumption (http//earthobservatory.nasa.gov/).
Extensive droughts, desertification, salt water intrusion, and the contamination of potable
water further threaten this limited resource. The World Health Organization estimates
that1.1 billion people lack access to clean water supplies, and 2.4 billion lack access to
basic sanitation. Water shortages now plague almost every country in North Africa and
the Middle East (WHO/UNICEF 2010). Currently, many areas of the USA are in
drought. Global warming is likely to subject many additional areas to drought.
There are significant health impacts of water shortages. Water-borne diseases account for
roughly 80% of infections in the developing world. (Estimation for 2002, by the
WHO/UNICEF JMP, 2004))
We must reduce the use of potable water for non-drinking purposes, recycle water, and
reconsider wastewater as an unused resource. However, programs and associated
technologies devised during the 20th
century for managing human excretory wastes and
related water resources have focused on the philosophy of eliminating materials from the
source as expeditiously as possible. This approach has been applied to human wastes as
well as storm water and has resulted in large transmission systems, typically associated
with a centralized treatment unit. Although this approach has solved the major
outbreaks of water borne diseases such as cholera in developed nations, it is
unsustainable. Further, it is not a model that should be adopted by developing nations.
Alternatively, utilizing wastewater as a resource offers the potential of benefits ranging
from decreased groundwater extraction to reduced energy costs.
A brief look at how modern civilizations came to have these large centralized systems is
prudent to understanding how and why an alternative system is needed.
1

2.0 Literature Review
2.1Development of wastewater treatment technologies
2.1.1 Historical Perspective
Examples abound of ancient communities’ attempts at removing sanitary waste from
buildings. A trough system using water to carry wastes from a building to a nearby
stream was excavated from a site in Scotland dating back to 8,000BC. The Minoans,
Babylonians, Aztecs, Romans, in short, most ancient civilizations had systems to remove
sanitary wastes. These systems ranged from cesspools to conveyances taking the wastes
to nearby bodies of water. After the fall of the Roman Empire, these approaches seemed
to decline with most European cities in the Middle Ages resorting to open ditches into
which home dwellers threw their wastes. Eventually these open ditches were covered,
forming sewers. Further refinement led to the use of pit toilets (outdoor privies) with
privy vaults and cesspools (Armstrong 1976, Rosenberg 1962).
Especially in Europe and Asia, these “wastes” were applied to farmland as fertilizer
(Burian et al 2000).
In the 19th
century, sanitary removal methods were based on the miasmic theory of
disease etiology. This theory proposed that invisible noxious gas from decomposing
organic materials was the source of certain diseases. This led to the practices of
removing sanitary wastes within 2 to 3 days, street cleaning, and ventilation of buildings.
The latter practice still evident today in the high ceilings of buildings from the Victorian
period, especially schools and other public buildings (Armstrong 1976).
In 1849, Dr. John Snow of England proposed an alternative theory, contagion, which he
espoused in a pamphlet: On the Mode of Communica of Cholera. It was not well
received. His epidemiological study of the 1854 London cholera outbreak provided
statistical evidence to support the theory. Microbiological discoveries by Pasteur and
Koch, combined with Snow’s work began to change how sanitary wastes were managed
(Burian 2000, Rosenberg 1962).
2

2.1.2 Centralized Treatment Versus Decentralized Treatment
During the early 19th
century, less than 5% of all Americans lived in urban areas (cities
with a population larger than 8,000). (US Bureau of Census) However, by 1880, nearly
a fourth of Americans lived in urban areas. Continued industrialization and
mechanization of agriculture further promoted this trend. These changing population
trends forced communities to reevaluate the use of pit toilets (Burian 2000, Armstrong
1976).
The explosion of populations in urban areas, contributed to the contamination of drinking
water supplies, requiring that water be piped in from outside sources. The resulting
public works projects made large supplies of water available and centralized water
carriage sewer system feasible (Burian 2000).
This initiated a great debate which continues (in a modern version) today: centralized
water carriage sewer systems versus decentralized privy/cesspool systems. Proponents of
a centralized system argued the capital and maintenance costs would be lower than the
annual costs from collection and cleaning of decentralized privy vault-cesspool systems.
There would be a decrease in morbidity and mortality from infectious disease. Finally,
cleaner cities would attract more people and industries. However, opponents argued that:
the nutrient value of human waste on agricultural lands would be lost. Other adverse
effects offered included an increased danger of contamination of the subsoil by leakage
from lengthy conveyances, pollution of the receiving waterways with threats to drinking
water supplies and shellfish, and the generation of disease-bearing sewer gas. Finally, it
was argued that the extensive infrastructure required by centralized systems would
necessitate a heavy tax burden on current and future generations (Burian 2000, Tarr et al
1984).
The economic justification for the centralized system and the convenience to the public
of eliminating work by the homeowner led to the adoption of a centralized system
(Burian 2000). By the conclusion of the 19th
century, most of the basic engineering
techniques for modern wastewater collection were developed. Consequently, most US
cities had some form of a sewer system.
3

2.1.3 Combined Sewer Systems
The US population increased 400% from 1850 to 1920 with 51% living in urban areas.
(M.V.Melosi 1980) The number of cities with populations greater than 50,000 grew from
392 to 2,722. Sewer systems were removing the wastes away from homes, but the
receiving streams were becoming open sewers. Dilution had been the solution. In 1892
only 27 American cities had any type of wastewater treatment. These were rudimentary
treatments and consisted of land application and chemical precipitation. But, another
problem with the existing systems became evident. Most had been built as combined
sewers to handle both sanitary wastes and storm water. Typically, the systems were
designed so that storm water flow would periodically flush the piping. Some engineers
and public health officials had argued for two systems. Of the 27 wastewater treatment
systems in the USA in 1892, only one was associated with a separate sewer due to the
rationale that stormwater would dilute and clean the systems of sanitary wastes (Tarr
1984).
One of the most influential wastewater treatment developments was the activated sludge
process to treat large quantities of wastewater. By the middle of the 20th
century,
improved cost-effective treatment technologies and stricter regulatory requirements, led
to wider implementation of wastewater treatment. This reinvigorated the combined
sewer dispute, since effective wastewater treatment needed a more consistent and
manageable wastewater flow. This could best be accomplished with separate systems
(SSS) for storm water and sanitary wastewater. By the end of the 1930s, SSSs were
becoming the system of choice in new developments and even existing systems were
being modified to function as separate or partially separate systems.
Waste water management issues in a post war era, propelled the federal government to
enact the Water Pollution Control Act of 1948. Subsequent amendments to the Act led
to a uniform set of water-quality standards and a major change to the fundamental goal of
water pollution control (i.e. protecting public health) with the addition of preserving the
aesthetics of water resources and protecting aquatic life (Burian 2000).
Despite the enactment of water pollution control legislation, water quality in the US was
continuing to deteriorate in the late 1960s. Rachel Carson’s Silent Spring, the advent of
Earth Day, and dramatic incidents like the burning of the Cuyahoga River propelled the
federal government to pass the 1972 Water Pollution Control Act.
The 1972 Act set an ambitious goal of eliminating all water pollution by 1985 and
authorized expenditures of $24.6 billion in research and construction grants (Armstrong
1976). Limits were also established for industrial and agricultural polluters. The
unprecedented level of federal funding for new or upgrading centralized wastewater
systems eliminated any impetus to seek more cost effective treatments including
decentralized methods (Burian 2000).
4

2.1.4 Limitations of Centralized Treatment Systems
During the 20th
century, migration of the US population continued to change the methods
of urban wastewater management (Tarr et al 1980). The automobile and associated
improved roadways allowed people to commute longer distances creating suburban areas,
which forced the extension of municipal services designed for high-density urban centers
out into low-density suburban areas. In addition, mixed urban development was replaced
with industrial parks, suburban neighborhoods, and commercial districts. These
specialized developments were often miles apart from one another with no attempts to
integrate infrastructures. This urban sprawl pattern of development necessitated an
adjustment to wastewater management methods that had been developed for a different
set of criteria (Jackson and Myers 2002). These treatment systems were further strained
by the proliferation of organic chemicals resulting from post-World War II industries.
Industrial discharges had not been considered in the development of the traditional
wastewater treatment technologies. The post-war years also witnessed an economic and
population boom. The increase in the standard of living increased the consumption of
water and the production of wastewater. Accompanying this was an increase in new
plumbing fixtures for the masses: including showers, dishwashers, clothes washing
machines, and food-waste disposal units. Just as the commode (water closet) increased
the volume of wastewater in the 19th
century, so to the new fixtures increased the volume
of wastewater discharged to sewer systems and changed the chemical and physical
composition of wastewater.
Industrialization, suburbanization, economic expansion, and increased water usage
altered wastewater characteristics which necessitated a change in wastewater
technologies. However, the centralized sewer system, traditional methods of wastewater
treatment and management did not significantly change in response. Suburbanization
with its lower-density population made the use of decentralized septic systems more
economically feasible. Decentralized septic systems were attractive to governing entities
because they eliminated capital expenditures for sewer systems and had fewer operation
and maintenance costs compared to treatment facilities. Also, governing bodies were
able to shift responsibility for managing wastes to developers and factory owners (Burian
2002).
In hindsight, many of the issues raised by the opponents of a centralized system have
come to fruition. In particular, the cost to operate, maintain, and upgrade the centralized
systems have become unsustainable. The EPA estimates that 3% of our nation’s energy
consumption (equivalent to approximately 56 billion kilowatt hours (kWh)), at a cost of
approximately $4 billion, is used for drinking water and wastewater services.
5

In 2002, the U.S. EPA released the Clean Water and Drinking Water Gap Analysis
Report which stated if investment in water and wastewater infrastructure does not
increase to address anticipated needs, the funding gap over the next 20 years could grow
to $122 billion for waste water treatment capital costs and $102 billion for drinking water
capital costs (epa.gov/waterinfrastructure/infrastructuregap.html).
Now in the 21st century, federal funding for centralized treatment plants has slowed to a
trickle. Yet, the aging centralized treatment systems require a massive influx of dollars to
upgrade.
Once again changing conditions mandate that we, in the US, and elsewhere, reevaluate
our methods of managing wastewater and storm water. These changing conditions are
the result of:
1. unsustainable costs to maintain existing centralized treatment systems and
necessary upgrades.
2. the realization that existing treatment technologies fail to adequately treat
wastewater to address pharmaceuticals, hormones, and other common organics.
3. high energy input required to transport and treat wastewater.
4. recognition of wastewater as a resource not a waste.
5. changes to historic weather patterns which are increasing storm water volume,
with associated increases in flooding, erosion, and adverse water
quality(CCSP,2008).
6. changing population and housing practices.
2.1.5 Return to Decentralized Treatment Systems
Unlike in the early 20th
century when the choice was between centralized collection
versus private cesspools or privies, today there are effective alternative decentralized
systems (Burian 2002). The increase in alternatives is in large part due to the reduction of
federal grant money for the large centralized systems and the aging infrastructures. Also,
the 1977 amendments to the Clean Water Act required communities look at alternatives
and provided monetary incentives (USEPA 1977). The lower population density of many
suburban developments has further contributed to an escalation in decentralized systems.
Past deterrents to decentralized systems included arduous regulatory hurdles and a
skeptical public who feared adverse life style impacts. However, significant
improvements in these technologies have enabled seamless integration and broad
adoption. Approximately, 25% of the US population, (primarily in rural and suburban
areas) now utilizes decentralized systems. Benefits of current DWM (decentralized
wastewater management) systems over traditional centralized systems include reduced
expenditures and environmental impacts (Burian 2002).
6

The move to DWM systems is an important step toward treating wastewater as a water
resource. However, as with the centralized systems, most DWM systems merely convert
pollutants in water to solid waste and air emissions while expending energy. It is
imperative that wastewater be recognized as a water resource.
Currently wastewater reuse generally occurs after treatment at a central system and is
done more as a means of polishing (refining) the treated effluent as in irrigating golf
courses. The development of local and on-site wastewater reuse technologies will further
encourage the use of DWM technologies.
DWM, coupled with wastewater reuse, has the potential to be a highly cost-effective
wastewater management method.
2.2 Biofilters for Pollutant Attenuation
2.2.1 Constructed Wetlands
Natural wetlands have long been recognized for their ability to act as biological filters
(biofilters) to remove contaminants, resulting in a functional comparison to kidneys.
Biofilters are simply defined, as any biological system which utilizes living organisms to
filter a media containing contaminants. In modern times, man-made wetlands have been
evaluated as potential wastewater treatment technologies since the early 1950s in
Germany (DeBusk 1999). Constructed wetlands and variations such as John Todd’s
Living Machine have been developed as DWM . During the past four decades,
constructed wetlands have been deployed in a wide array of applications including
domestic and industrial wastewaters, acid mine drainage, and agricultural runoff.
Consequently, a large body of research studies ranging from the specific microbes
responsible for a pollutant attenuation, to design modifications to enhance performance
has developed. (Wolverton and Harrison 1973, Wolverton and McDonald 1980, DeBusk
1999, Jung et al 2009) The widespread use of constructed wetlands as a viable onsite
wastewater treatment technology has fostered the development of regulatory guidelines
(EPA 2002).
Three main types of constructed wetlands are used: free water surface (FWS) where the
surface of the water is exposed to the atmosphere, subsurface flow (SF) where the water
level is maintained below the media surface, and hybrids which combine both. For most
applications, subsurface flow is the preferred. These biofilters, which mimic natural
processes to cleanse water, are effective, inexpensive, and have few moving parts.
7

In addition, SF lack odors, mosquitoes and other insect vectors, and minimizes public
exposure (EPA 2002). However, the large footprint required for constructed wetlands,
make them impractical for most residential applications. Wetlands attenuate pollutants
through a multitude of chemical, physical, and biological processes (DeBusk 1999).
Although SF wetlands can efficiently remove BOD5, suspended solids, and nitrogen,
removal of phosphorus is more limited (EPA 2002, Lai and Lam 2009). Other
constituents such as fecal and total coliforms are diminished, but frequently not
eliminated (Gersberg et al 1989, EPA2002). Although constructed wetlands are an
effective and sustainable technology, these applications typically treat wastewater as a
waste, not a resource. Needed is a decentralized wastewater management system that can
convert wastewater into a water resource, have residential as well as industrial
applications, and accomplish all of this with a minimal footprint and maintenance
requirements. Other biofilters such as living walls and green roofs have had limited
applications or research investigations for attenuating wastewater.
2.2.2 Green Roofs
The modern green roof (also referred to as living or eco roofs) was developed in
Germany where these biofilters continue to have widespread application. Green roofs are
categorized based on the depth of the media as intensive (greater than 12 inches), semi-
intensive (6 to 12 inches), and extensive (less than 6 inches). In the US, the main
application is for the detention and elimination of rainwater using extensive roofs.
Although studies have evaluated the potential for green roofs to contribute or ameliorate
contaminants in storm water runoff (Berghage et al 2007, Retzlaff et al 2008), no
published research has quantified the potential for attenuating pollutants from wastewater
for reuse as a resource.
The Center for Green Roof Research at Penn State University collected and analyzed
samples from test plots during 2005-06 and reported a significant reduction in the
observed nutrient loading rate for nitrate (Berghage et al 2007). Similar results were also
obtained from research by Dr. Bill Hunt et al (2004) at the Water Resources Research
Institute, N. C. State University. However, several factors including the atmospheric
concentrations relative to media concentrations of nitrogen affect the presence and
concentration of nitrogen in runoff. Studies conducted by Dr. Manfred Kohler and Dr.
Marco Schmidt (2004) at the Technical University of Berlin add longer term data on
green roof water quality performance.
8
Their work showed that green roofs retain and bind contaminants from atmospheric
deposition or rain, but nutrients can leach out of the substrate as well. However, the
leaching of nutrients can be reduced over time as shown by experiments over four years.
These studies indicate that, with the appropriate choice of substrate, mature green roofs
can be designed to reduce total pollutant discharges.
According to Glass and Johnson, production of certain nutrients (esp. phosphorus) can be
expected from a young green roof; however the concentrations of nutrients should
generally fall below the E.P.A.’s promulgated freshwater chronic concentration standards
and concentrations currently found in runoff from local streets and possibly normal roofs.
Nitrogen concentrations measured in the ASLA (American Society of
LandscapeArchitecture) green roof runoff were similar to the values detected in the
rainwater indicating that, when combined with the measured volume reduction, a
significant overall reduction of nitrogen in storm water runoff from a green roof can be
expected. Heavy metals can also be produced by green roofs however they too should
largely fall below the allowable limits and below street concentrations.
Berghage et al (2008) further evaluated the nutrient content of media from over 30 green
roofs in the US in order to develop ranges for proper nutrient levels without contributing
to adverse runoff water quality. Researchers at North Carolina State University
concluded that optimal media can be established for green roofs that balance the needs
for plant growth with water quality and quantity control and that green roof media with
less compost component would have decreased levels of phosphorus and nitrogen in
runoff. Studies yielded mixed results relative to the temporal impact to nitrogen and
phosphorus leaching (Hunt et al 2006).
Mankiewicz et al proposed the use of gray water for thermal regulation and the
enhancement of biological diversity on green roofs (Mankiewicz 2007). However, the
role of green roofs as a biofilter has primarily focused on the ability to detain storm water
and not attenuate wastewater.
2.2.3 Living Walls
Although vines have covered building facades for millennia, vertical biofilters, known as
living walls, are recent innovations. Consequently, the terminology for classifying the
many types of living walls is continuing to evolve. Vine trellis systems, planted
retaining walls, and interior planted membrane covered walls, all are considered living
walls. As one might expect with such a recent development, the body of research is scant
with a focus on the ability of green roofs to minimize solar radiation impacts to building
facades and interior conditioned spaces. Quantification of the ability of living walls to
attenuate wastewater pollutants has been largely overlooked.
9

2.3 Summary of Wastewater Management
A review of the literature indicates that mankind has taken a circuitous route in the
attempt to manage wastewater from the early use of decentralized natural systems which
utilized the wastes as a resource to centralized systems in the 20th
century. Now the
exorbitant costs of upgrading and maintaining centralized systems have returned
wastewater management to a focus on decentralized systems and a renewed interest in
managing wastewater as a resource. The proliferation of constructed wetlands in the late
20th
century has offered a sustainable alternative to more energy intensive technologies.
The advent of biofilters such as green roofs and living walls to create functional, living
architectural features to manage storm water and reduce building energy needs offer the
potential for additional applications of treating wastewater as a water resource. Chong-
Bang Zhang et al (2010) found that increasing the diversity of plants in constructed
wetlands increased the biological performance due to increased diversity of associated
microorganisms. The benefits from the integration of biofilters to manage wastewater
as a resource has not been researched, yet offers the potential for enhanced performance
from the increased diversity of microhabitats while converting a waste into a resource.
Optimally, a decentralized wastewater treatment system should possess the following
attributes:
• Compact with a small footprint
• Low Energy
• Modular to adjust to various flow applications
• Inexpensive to Construct
• Comprised of Readily Available Materials
• Low Maintenance
• Effective Attenuation of Pollutants
• Minimal HRT (hydraulic retention time)
• Converts Wastewater into a Water Resource
• Easily integrated into building architecture
This research explores the feasibility of developing and testing an integrated biofilter
that demonstrates these optimal characteristics.
10

3. DEVELOPMENT OF AN ALTERNATIVE DECENTRAL TREATMENT
SYSTEM
3.1 Integrated Biofilter: Converting Wastewater to a Water Resource
The following was presented at the Seventh Annual Greening Rooftops for
Sustainable Communities Conference:
Session 3.2: Greywater Treatment, Heat Flux and
Stormwater Management-Toward System Optimization
INTEGRATED BIOFILTERS:
Converting wastewater to a water resource.
Robert D. Cameron, Robert D. Berghage
Pennsylvania State University
University Park, PA.
Abstract
Globally, humans face extensive droughts, desertification, salt water intrusion, and the
contamination of potable waters. These threats to our water resources necessitate that we
reduce the use of potable water for non- drinking purposes, recycle water, and reconsider
wastewater as an unused resource.
We have designed an integrated biofilter that is constructed of inexpensive and locally available
materials to utilize waste water (both gray and black) as a resource as well as removing
contaminants to allow these waters to be reused.
In preliminary tests, the system has demonstrated the ability to remove contaminants at an
accelerated rate and efficiency compared to traditional treatments or non-integrated biofilters.
11

Introduction
A biofilter, simply defined, is any system that utilizes living organisms to filter a media containing
contaminants. Constructed wetlands, living walls, and green roofs can all be used as biofilters.
Advantages of biofilters are low cost, low energy, few moving parts, adaptability, and minimal
maintenance requirements.
In modern times, constructed wetlands have been utilized for treating wastewaters since the
1950s. Pioneering efforts of researchers such as B.C. Wolverton with NASA (Wolverton and
Harrison 1973, Wolverton and McDonald 1976) and the adoption of the practice by groups like
the TVA and Tenneco Inc. greatly increased the use of constructed wetlands in the late 1970s.
In the ensuing decades, constructed wetlands have been deployed to attenuate diverse
wastewaters from industrial, municipal, agricultural, and domestic sources. Wetlands utilize
chemical, physical, and biological processes to remove contaminants from wastewater (DeBusk
1999). The greater the diversity of micro-habitats found in an ecosystem such as a wetland, the
broader and more efficient the range of treatments that are realized (Chapin et al 2002). Two
basic types of constructed wetlands are recognized, free water surface and subsurface flow
(Reed 2002).
Extensive green roofs are in many respects similar to a subsurface flow constructed wetland
with the exception of the continuous presence of water. The xeric nature of the extensive green
roof environment dictates the replacement of hydrophilic plants with plants like sedums that
can withstand variable periods without rain (Snodgrass & Snodgrass 2006). Irrigated roofs and
deeper media offer the ability to expand the palate of acceptable plants. Most studies of green
roofs’ role as biofilters have focused on the ability to remove pollutants from stormwater runoff
(Berghage et al 2007). Alternatively, some studies have evaluated the potential for greenroofs
to be a source of pollutants to storm water runoff (Vansetters et al 2007, Retzlaff et al 2008).
Living walls literally turn biofilters on their side. The modern version of living walls and their role
as a biofilter is a relatively recent phenomenon both in the US and abroad. However, numerous
examples abound of this technology being incorporated in both interior and exterior designs.
Integrating a constructed wetland, a living wall, and green roof into a single system offers the
potential of optimizing habitat diversity and thereby increasing the efficiency and range of
pollutants that can be attenuated. The purpose of this project was to design and construct an
integrated biofilter to attenuate gray water pollutants.
12

3.2 Materials and Methods
An integrated biofilter was constructed at the Penn State Center for Green Roof Research at
Rocksprings, Pa. The system included a constructed wetland, a living wall, and a green roof
integrated to minimize footprint of the system while optimizing the ability to treat wastewater.
Constructed wetlands:
A rectangular plastic basin measuring 36inches wide X 59inches long X 12 inches high (91.44cm
X 149.86cm. X 30.48cm) was filled with 1 inch (2.54cm) of sharp sand followed with 11 inches
(27.94cm) of limestone. An initial system used 3inches (7.62cm) to 5 inches (12.7cm) diameter
limestone (stone while subsequent systems used crush (2B) limestone. Hydrophilic plants
including Calocasia species, papyrus (Cyperus papyrus), horsetail reed (Equisetum hyemale), and
Canna were planted in the stone media. Water levels were kept below the rock surface to
create a subsurface flow wetland. An inverted, 1 gallon (3.785 liters) plastic pot was used to
provide housing for a small, electric submersible pump.
Living Wall:
For this study a living wall consisting of three components was constructed. Two plastic
corrugated culvert pipes, seven feet (2.14meters) in length and 1 foot (0.3048 meters) in
diameter were wrapped in excelsior mat(erosion control fabric) and placed upright, 3 feet
(0.914 meters) apart , and resting on the bottom of the constructed wetlands basin. One to
three inch (2.54cm to 7.62cm) diameter holes were drilled at random locations around the
cylinders. The cylinders were filled with alternating layers of materials including Norlite ¾
lightweight aggregate (Norlite, New York), composted cow manure, peat moss, tire crumb (Pa.
Recycling Markets Center), potting soil (Sunshine #4, Sun Gro Horticulture), and crushed (2B)
limestone. A two inch (5.08cm) PVC pipe was placed horizontally between the two cylinders,
three inches (7.62cm) below the top of each cylinder, providing a support for the third
component. This latter component is a living wall consisting of subsequent layers of excelsior,
plastic coated garden fence (1inchX 3inch grid), excelsior, wetted peat moss, and composted
cow manure. The wall was created by layering the materials in the order given and then folding
the components in half and securing the layers to one another using plastic zip ties. This unit,
nearly 12 feet in length was then placed over the PVC cross bar resulting in two six feet lengths
extending from near the top of the cylinders to the constructed wetlands. The two sides were
secured to one another using zip ties creating a thickness of approximately 6 inches (15.24cm).
One half inch (1.27cm) tubing was connected to the pump and run to a perforated PVC header
along the length of the two living tubes and living wall to provide distribution of the water.
Plants, including tomato (Solanum lycopersicum), peppers (Capsicum varieties), rosemary
(Rosemarinus officinalis), Sedum species, spider plants (Chlorophytum comosum), geraniums
(Pelargonium varieties), pothos (Epipremnum aureum), several members of fern family, basil
(Ocimum basilicum), and Dendrobium orchids were planted throughout the wall and columns.
13

Green Roof
An existing green roof at the Center for Green Roof Research was utilized. The roof is an
extensive roof, planted with Sedum spurium, and measures approximately 4ft. by 6 ft. (1.219m X
1.829m). The water distribution system was constructed to provide water to the roof with
resulting runoff flowing to the wall system or alternatively from the roof to a PVC collection
tank. In addition, water could be routed to flow only between the wall and constructed
wetlands.
Graywater Studies
The study used a Maytag washing machine (Fig.3.01) that discharged approximately 44.91
gallons (170 liters) of water from a large load wash as a source of graywater. Prior to running
the initial washes, the external and drum areas of the washing machine were scrubbed using a
dilute solution of Clorox bleach.
Tide liquid soap detergent was added to subsequent laundry washes as per the container’s
directions. Batches of soiled clothing were washed using the small load (90liters/23.775gals. of
wastewater) and large load cycles (170 liters of wastewater). A two inch (5.08 cm) PVC pipe was
run from the washing machine discharge hose to the integrated biofilter (Photo 1).
Blackwater Studies
Five gallon (18.927 liters) buckets containing approximately four gallons (15.142 liters) of
“green” cow manure were filled to the bucket top with potable water, stirred, and rested for 24
hours in a greenhouse with a temperature ranging from 65 degrees F to 80 degrees F (18.33
Celsius to 26.67 Celsius). Ten liters (2.64 gals.) of the manure water were decanted from the
bucket and spiked with 100 grams (3.527oz.) of 15-17-5 fertilizer. Ninety liters (23.78 gals.) of
potable water was added to the ten liter solution to provide the “blackwater” for the study.
Chemical Analyses
Analyses of data were provided by Pennsylvania State University Agricultural Analytical Services
Laboratory and Fairway Laboratories. Samples of the graywater were collected in sterile
containers provided by the respective laboratory prior to discharge to the biofilter for a range of
analyses. After three days of treatment samples were again collected and analyzed.
Blackwater samples were collected for analyses prior to the initiation of treatment and again
after two days of treatment using sterile containers provided by each respective laboratory.
14
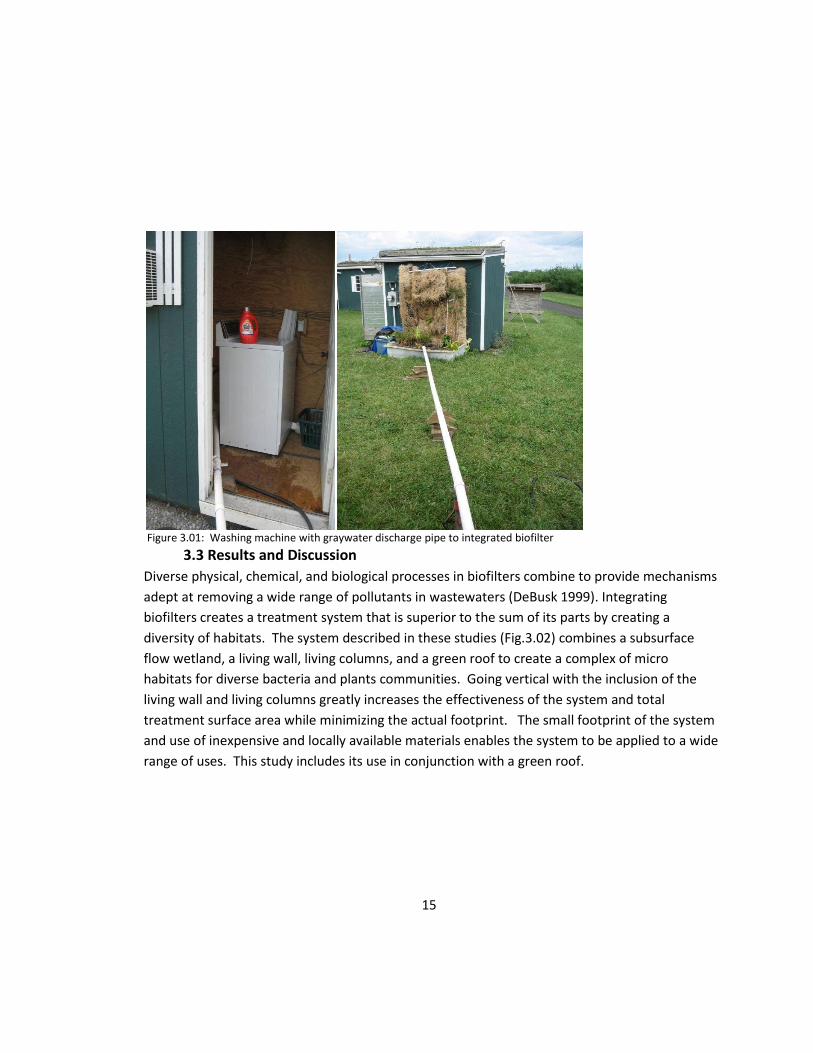
Figure 3.01: Washing machine with graywater discharge pipe to integrated biofilter
3.3 Results and Discussion
Diverse physical, chemical, and biological processes in biofilters combine to provide mechanisms
adept at removing a wide range of pollutants in wastewaters (DeBusk 1999). Integrating
biofilters creates a treatment system that is superior to the sum of its parts by creating a
diversity of habitats. The system described in these studies (Fig.3.02) combines a subsurface
flow wetland, a living wall, living columns, and a green roof to create a complex of micro
habitats for diverse bacteria and plants communities. Going vertical with the inclusion of the
living wall and living columns greatly increases the effectiveness of the system and total
treatment surface area while minimizing the actual footprint. The small footprint of the system
and use of inexpensive and locally available materials enables the system to be applied to a wide
range of uses. This study includes its use in conjunction with a green roof.
15

Figure 3.02: Integrated Biofilter On South Side of Test Building
Figure 3.03: Integrated biofilters- columns exposed(left side), columns wrapped in wood fiber mat(right side)
The living column (Fig.3.03) offers a novel addition to the concept of a living wall. The design
enables materials to be added in layers to promote adsorption of specific pollutants. This is a
16

common concept of chemistry and utilized widely to separate materials. The various substrates
can affect the movement of specific wastewater components through physical, chemical, and
biological mechanisms. For example, a layer of iron scraps or clay particles can be added to
provide an ion exchange sink for phosphorus. Similarly, a layer of organic materials can be
added to foster the removal of organics. Plant roots and associated microbes in the substrates
can uptake some of these components (Jackson & Myers 2002). By periodically harvesting the
plant mass, elements such as phosphorus can be removed from the system to prevent
accumulation.
Analyses of gray water samples collected from different test runs prior to treatment indicated
little difference in parameter values despite different batches of soiled clothing being washed.
Results of the gray water analyses for twenty-seven parameters are contained in Table 1. The
value of these parameters could vary if other sources of gray water were used such as showers,
dish washers, or washing machines laundering cloth diapers. In considering the use of this water
for plants, only one of the parameter levels raises concerns. Boron levels of 4.02 mg/l and 3.33
mg/l were detected in the non- treated gray water. The upper level of boron recommended by
Penn State’s Agricultural Analytical Services Laboratory for irrigation waters is 1mg/l. Although
boron is a necessary micro-nutrient for plants, at elevated levels it can be toxic. Boron can
accumulate in soils. This could be a limiting factor with some gray water systems if there is no
mechanism provided for the removal of boron.
Initial levels of BOD in the gray water samples were 702mg/l and 683 mg/l. Traditional methods
of wastewater treatment typically seek to reduce BOD levels to 30 mg/l when discharging at a
point source. Total suspended solids are also typically permitted to discharge at concentrations
of 30 mg/l or less. Wastewater samples in this study had very low levels of suspended solids,
and, consequently, samples were analyzed for total dissolved solids. After three days of
pumping the gray water from the constructed wetlands to the header system which distributed
water through the living columns and wall, the water sample collected from the basin had a BOD
of 58mg/l. This would represent a 92% reduction from the initial level of 702mg/l (Figure 3.04).
However, in actuality the reduction in BOD was even greater and approached 98% since the
volume of water over three days had reduced through evapotranspiration from 170 liters to
less than 65 liters. Consequently, doing a mass balance approach comparing total milligrams of
BOD initially versus the total milligrams of BOD remaining after three days of treatment better
depicts the amount of reduction. Several factors must be considered when determining the
length of detention time for a biofilter, including pollutant concentration in the wastewater,
amount of reduction in pollutant levels needed, and flow rate or volume of the wastewater.
Typical detention times range from 5 to 14 days. The integrated system in this study with a
footprint of less than 15 square feet was able to achieve nearly 98% reduction of the total
milligrams of the BOD in three days.
17
TABLE 3.01 Characterization of Pretreatment Graywater
Analysis Run 1 Run 2
Ph 7.8 7.4
total alkalinity 284.7 265.8 mg/l
Bicarbonates 347.4 348.7 mg/l
Carbonates 0 0 mg/l
Hardness 357 308.9 mg/l
Conductivity 0.71 0.67 mmhos/cm
total dissolved solids 454.2 429.6 mg/l
Nitrate-Nitrogen 5.44 6.29 mg/l
Ammonium-Nitrogen 1.63 <1.00 mg/l
Phosphorus 0.19 0.12 mg/l
Potassium 6.96 3.19 mg/l
Calcium 96.27 83.07 mg/l
Magnesium 28.31 24.63 mg/l
Iron <0.20 <0.20 mg/l
Manganese <0.01 <0.01 mg/l
Zinc 0.14 0.13 mg/l
Copper 0.12 0.15 mg/l
Boron 3.33 4.02 mg/l
Molybdenum <0.003 <0.003 mg/l
Sulfur 42.4 41.1 mg/l
Chloride 18.7 14 mg/l
Sodium 27.41 23.61 mg/l
Total Coliforms 1203 >2420 mpn/100ml
E.coli None Detect None detected
BOD 702 683 mg/l
18
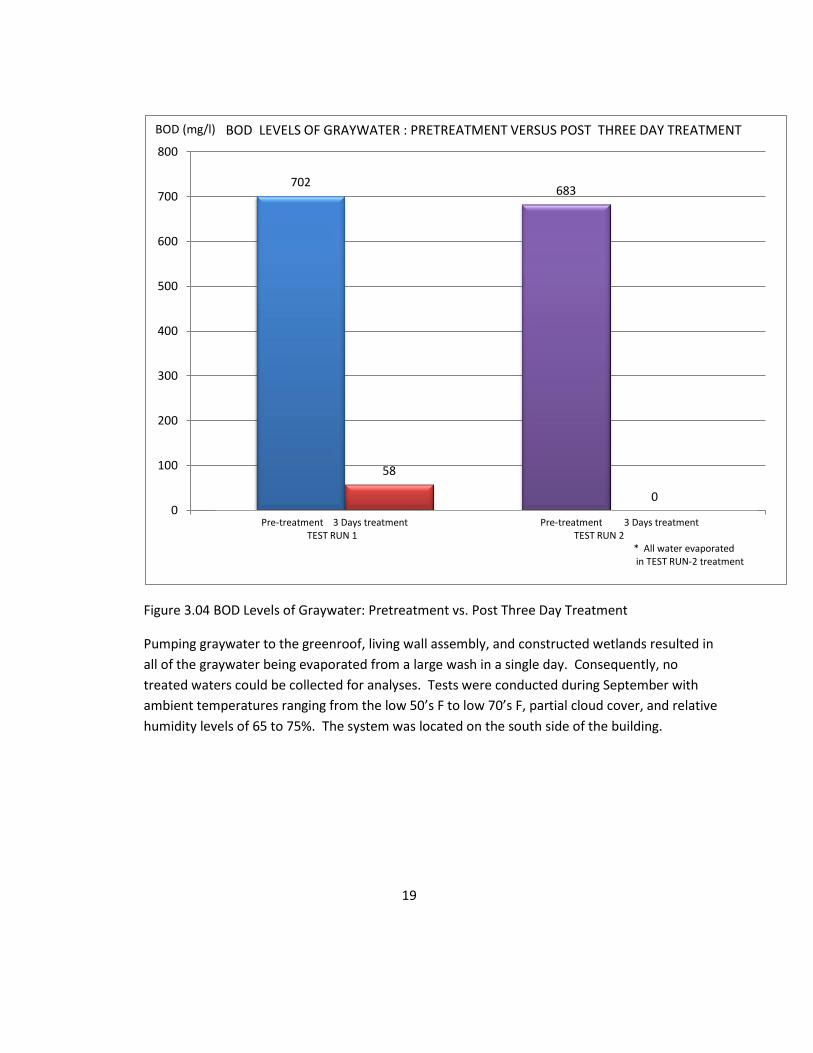
Figure 3.04 BOD Levels of Graywater: Pretreatment vs. Post Three Day Treatment
Pumping graywater to the greenroof, living wall assembly, and constructed wetlands resulted in
all of the graywater being evaporated from a large wash in a single day. Consequently, no
treated waters could be collected for analyses. Tests were conducted during September with
ambient temperatures ranging from the low 50’s F to low 70’s F, partial cloud cover, and relative
humidity levels of 65 to 75%. The system was located on the south side of the building.
19
702
58
683
0 0
100
200
300
400
500
600
700
800
1
BOD (mg/l)
Pre-treatment 3 Days treatment Pre-treatment 3 Days treatment TEST RUN 1 TEST RUN 2 * All water evaporated in TEST RUN-2 treatment
BOD LEVELS OF GRAYWATER : PRETREATMENT VERSUS POST THREE DAY TREATMENT

The loss of water through evapotranspiration represents both a dilemma and potential benefit.
Permitting authorities may require a zero discharge when receiving streams are deemed
incapable of accepting treated wastewaters, or receiving streams are non-existent. Combining
an integrated biofilter with a green roof can provide additional storm water runoff control,
treatment, and elimination. Evaporation can provide cooling to a building’s external shell and
reduce the need for air conditioning. Alternatively, if the goal is to optimize the amount of
reclaimed water, then the system can be modified by using a wastewater distribution header
that minimizes spray and acts similar to a soaker hose. In addition, the system can be sited on a
cooler side of a building away from prevailing winds.
The loss of water during several test runs impacted the ability to collect samples for analyses.
Additional tests are underway in a controlled (greenhouse) environment during the winter with
an integrated biofilter modified to minimize evapotranspiration. In a preliminary test
nitrate+nitrite nitrogen levels were reduced from 24.0mg/l to 1.9 mg/l in three days (a 92%
reduction).
The systems tested were all recently constructed and therefore, not at their optimal treatment
capacity. Once plant roots have colonized all surfaces of the integrated biofilters with the
associated microbe communities, then the system should operate at an optimum range
dependent upon seasonal factors and whether the system is indoors or outdoors.
This integrated biofilter not only provides a low cost and sustainable method of treating
wastewater but also a simple and easily constructed system for schools to incorporate
sustainable technologies into their curricula. The integrated biofilter used in these studies has
been the subject of several workshops for high school students from Pennsylvania, Maryland,
and Louisiana (Fig.3.05). Students participated in the construction of the system, which typically
takes two to four hours to complete and utilizes materials which are readily available locally and
can be found as scraps or at recycle centers.
20

Figure 3.05 Constructing an integrated biofilter at Math/Science Academy, La.
Plants for the system can be grown by students and/or obtained from homeowner seeking to
thin their perennial beds. The system can be constructed for a maximum of $300 or much less if
recycled materials are used. Teachers can utilize the system to explore a range of topics
including micro-habitats, plant succession, wastewater treatment, building energy needs, food
crops, stormwater management, and pollinators.
Based on the analytical characterization of the gray water used in this study, there were no
chemical components that would be deleterious to incorporating the production of fruits, herbs,
and vegetables. Although no E.coli were detected in the gray water, the ubiquitous coliforms
were present as would be expected. Additional studies determining the potential for fecal
coliforms to be present in graywater are prudent. Biofilters have been demonstrated to remove
fecal coliforms (Gersberg et al 1989).
21

3.4 Conclusion
Biofilters of living walls, living columns, constructed wetlands, and green roofs can be
integrated into one system to effectively treat gray water and black water. In our studies
a significant portion of the wastewater was lost to evapotranspiration. This can be
beneficial in reducing the temperature of buildings and associated air conditioning loads
as well as meeting zero discharge limits for wastewater. Integrating biofilters can also
optimize storm water runoff performance of green roofs as well as provide additional
treatment for improved water quality.
The system is inexpensive with a minimal footprint, which is suitable for schools to
construct and use with sustainable technologies curricula.
Future studies will focus on further quantification and optimization of water quality
improvement, fate of boron, characterization of coliforms, and amount of reduction in air
conditioning load.
22

References
Berghage, R.D., Beattie, A. Jarett, T. and O’Connor. 2007. Greenroof runoff water quality. In
Proceeding of Greening rooftops for sustainable communities, Minneapolis, MN.
Chapin, FS, Matson, PA, Mooney, HA 2002, Principles of Terrestrial Ecosystem Ecology, Springer
Science+Business Media, New York
DeBusk, William F. Wastewater Treatment Wetlands: Contaminant Removal Processes; 1999,
SL155, Soil & Water Science Department, Florida Coop. Extension Service, Institute of Food and
Agricultural Sciences. U. of Fla.
Gersberg, RM, Gearheart, RA, Ives, M 1989, Constructed Wetlands for Wastewater Treatment:
Municipal, Industrial, and Agricultural. Lewis Publishers, Chelsea, Michigan
Jackson,L.M. and J.E. Myers; 2002, Evaluation of Subsurface Flow Wetlands vs. Free-water
Surface Wetlands treating NPR-3 Produced Water-Year No. 2
Retzlaff,W., Ebbs,S, Alsup,S, Morgan,s, Woods,E, Jost,V, and Luckett,K, 2008, What is That
Running Off Of My Green Roof? Sixth Annual Greening Rooftops for Sustainable Communities
Conference.
Reed, S 2002, Onsite Wastewater Treatment Systems Manual, EPA/625/R-00/008, Office of
Water Office of Research and Development, USEPA
Snodgrass, EC & Snodgrass, LL 2006, Green Roof Plants A Resource and Planting Guide, Timber
Press, Portland, Oregon
Wolverton, BC, & Harrison, D.D. 1973. Aquatic Plants for removal of mevinphos from the
aquatic environment, J. MS Acad. Sci. 19:84-88
Wolverton, BC, & McDonald, RC, 1980, Vascular Plants for Water Pollution Control and
Renewable Sources of Energy, Proceedings: Bio-Energy ’80 World Congress and Exposition, NAS
1.15:87554, NASA-TM-87554
Van Setters T., Rocha L, and MacMillan G, 2007 Evaluation of the runoff quantity and quality
performance of an extensive green roof in Toronto, Ontario. In: Proc. Greening Rooftops for
Sustainable Communities, Minneapolis, MN.
23

4. FURTHER ATTENUATION OF WASTEWATER CONSTITUENTS
4.1 Overview of Additional Gray Water Studies
Chapter 3 provided information regarding the design and construction of the IBF and
preliminary tests to investigate the effectiveness to remove pollutants from wastewater.
This chapter details additional studies to delineate the effectiveness of the IBF. Specific
questions posed were:
1. Can an IBF attenuate priority pollutants in graywater to meet EPA
wastewater discharge limits?
2. Is the hydraulic retention time (HRT) to achieve this attenuation reduced
compared to that required by constructed wetlands?
The IBF used in the studies described in Chapter 3 was deployed again, after the addition
of annual plants to augment the perennial plants that survived the winter. A replicate of
the IBF was constructed in order to conduct concurrent gray water studies. This second
IBF was tested prior to planting to assess the role of plants in attenuating specific
pollutants in gray water. In addition to tests with the IBFs, gray waters from a clothes
washer were also discharged separately to extensive green roofs and constructed
wetlands. Also, treatment efficiency for an intermittent discharge of gray water to an
IBF compared to continuous flow was evaluated. Gray water from a residential shower
was treated with an IBF and pollutant constituents evaluated. Table 4.01 categorizes these
tests by the source of gray water, length of test, and type of biofilter evaluated. Analyses
were conducted by the Pennsylvania State University’s Agricultural Analytical
Laboratory and Fairway Laboratories in Altoona, Pa. Study Name Gray Water Source Length of Test (days) Type Biofilter
IBF Washing Machine 7 Planted IBF
IBF Washing Machine 7 Planted IBF
IBF Washing Machine 2 Planted IBF
IBF Washing Machine 1 Planted IBF
IBF Washing Machine 1 Planted IBF
IBF Washing Machine 1 Planted IBF
IBF Washing Machine 1 Planted IBF
IBF Control Washing Machine 1 IBF without Plants/Media
IBF Control Washing Machine 1 IBF without Plants/Media
IBF without Plants Washing Machine 2 Unplanted IBF
Intermittent Flow Washing Machine 4 Planted IBF
Intermittent Flow Washing Machine 2 Planted IBF
Green Roof Washing Machine 7 Extensive Green Roof
Green Roof Washing Machine 7 Extensive Green Roof
Residential Shower Shower 1 Planted IBF
Residential Shower Shower 1 Planted IBF
Residential Shower Shower 1 Planted IBF
Wetland Washing Machine 2 Subsurface Wetland
Wetland Washing Machine 2 Subsurface Wetland
Table 4.01 Additional Gray Water Studies 24

4.2 Variability of Gray Water
Not all graywaters are created equally. Constituents of residential gray waters can vary
significantly depending on appliance source (i.e. washing machine, shower, dish washer).
Detergents used in clothes washing machines have constituents which are absent or at
minimal levels in gray water from a shower. These constituents include: bluing agents,
surfactants, and enzymes. Alternatively, in Pennsylvania, phosphates are banned from
inclusion in detergent for washing machines, but are allowable in other products such as
shampoo for hair detergent. Of particular note is the variability of fecal coliform
concentrations which were not detected in samples of gray water from the studies’
multiple washing machine runs, but which were detected in all of the shower samples.
4.3 Methodology of Additional Gray Water Studies
4.3.1 IBF without Plants
A duplicate IBF was constructed to conduct replicate gray water studies and is noted as
IBF2. The living wall component of the IBF was redesigned. IBF1 and IBF2 were both
fitted with this new design. The previous living wall (described in Chapter 3) was
replaced with a 3ft.x 5ft. grid comprised of 3inch PVC pipe (Fig.4.01). Five horizontal
pipes connected the two, five feet vertical pipes. Holes, 1/8inch diameter, were drilled at
three inch intervals along the bottom of each horizontal pipe for drainage and circulation
of water. Holes, 4 inches in diameter, were drilled at intervals on the exterior face of the
piping for holding plants. A total of 16 planting holes were made. Small diameter
limestone (2B) was placed in the bottom of each horizontal pipe and the two vertical
pipes. The grid was installed between two living columns in a constructed wetlands basin
(constructed as per previous design described in chapter 4). A green roof drainage mat
(Enkadrain, [email protected]) was placed over the face of the grid. The unit
was placed on the south side of a test building at the Pennsylvania State University’s
Center for Green Roof Research. The existing IBF, designated IBF1, was located on the
south side of a replicate test building at the Center. After construction, but before the
addition of plants, water from a potable well, was used to fill the constructed wetlands
portion of IBF2. The water remained in the basin for 10 days in order to develop a
biofilm. Three times during the 10 days, the basin water was pumped to the top of the 5
ft. living wall/living columns assemblage, where it trickled via gravity to the basin. In
advance of conducting the gray water study, the water in IBF2 was drained. The water
was tea colored (due to presence of tannins) and had a slight, putrid odor with an oily
sheen. The latter may possibly be due to biological activity of microorganisms.
25
Prior to planting, gray water totaling 50 gallons, derived from two loads of wash using a
Maytag washing machine (described in Chapter 3), was discharged to the filter for a two
day study. Samples of gray water collected prior to treatment and at 24 and 48 hours
were analyzed for a range of pollutants. Tables 4.02 through 4.11 detail the results of
these analyses. Appendix A contains the complete list of parameters measured for each
test and the respective result. Impact on specific gray water pollutants of this and the
additional studies are discussed in Section 4.5.
Fig. 4.01 Redesigned Living Wall Grid Fig.4.02 Planted IBF
After 24 hours, the water level in IBF1 basin remained the same and consequently no
makeup water was necessary. This is contrary to the observed loss of water from
evapotranspiration (ET) that occurs in a planted IBF.
26

4.3.2 Planted IBFs
At the conclusion of the IBF Without Plants study, IBF1 was planted with an assortment
of perennials and annuals that included: eggplant (Solanum melongena), tomatoes
(Solanum lycopersicum), peppers (Capsicum annuum), rosemary (Rosemarinus
officinalis), Sedum species, oregano (Origanum vulgare), celosia (Celosia cristata),
zinnia (Zinnia x hybrida), Colocasia esculenta, Typha latifolia, geraniums (Pelargonium
varieties), Papyrus sp., basil (Ocimum basilicum), Hemerocallis sp., and Salvia sps.
The living wall component of IBF2 was replaced with the new design described above.
Although several of the perennials from the previous year’s studies survived, the annuals
required replacement. Additional plants were added as in IBF1 (Fig. 4.02).
Gray water was discharged to both IBF units to evaluate attenuation of pollutants. The
study was conducted for seven days. IBF2 was observed to have less evapotranspiration.
The IBF2 pump was observed to have debris partially clogging the intake which reduced
the normal 2.5 gallon/minute flow. Also, IBF2 had all newly installed plants and
consequently less developed root systems than some of the plants in IBF1. Either or both
of these may have contributed to the difference in evapotranspiration. Despite the
difference in rates of evapotranspiration, the effectiveness of each unit to attenuate gray
water pollutants was comparable. A specific study to evaluate the comparative
effectiveness of the two test IBF units was conducted as follows. A composite batch of
gray water was derived from three separate washes. The gray water was thoroughly
mixed and distributed in equal quantities to IBF1, IBF2, and a control IBF. The control
IBF consisted of all of the same components, but minus plants and media. After
completion of this test run, a replicate study using the three IBFs simultaneously was
conducted following the same procedure. BOD and surfactant concentrations were
measured in the composite gray water batch and 24 hours post treatment from each of the
three IBF units during each run. The mean BOD for the two composites was 528 mg/L.
The mean BOD (mg/L) 24 hrs. post treatment for the IBF1, IBF2, and control IBF were
respectively 20.5, 23.5, and 207. Mean concentrations for surfactant were as follows:
composite pre-treatment 63.4, IBF1 <0.65, IBF2 <0.67, and control IBF 68.4.
Statistical analysis of this data is contained in Appendix G.
27

Samples of gray water from all of the studies were varying shades of blue. Post
treatment, the water was tea colored due to presence of tannins and removal of the
detergent colorants (Fig.4.03)
Fig.4.03 Water Samples: Post treatment (left)
Vs. Pretreatment (right)
4.3.3 Intermittent versus Continuous
Most wastewater treatment systems utilize a continuous flow of water. However, natural
systems, especially wetlands, are often subject to alternating cycles of wet/dry.
Maintaining a continuous flow in an artificial system requires additional energy input to
pump wastewater. Two studies were conducted to evaluate the effectiveness of cycling
wastewater intermittently through the IBF.
The initial study was conducted for 4 days using IBF1. After draining any residual water
in IBF1, 30 gallons of gray water from a washing machine was discharged to the basin.
Prior to discharge to the basin, the wastewater from the initial wash and subsequent rinse
cycles were mixed in an interim holding tank, sampled, and then discharged to the basin.
28

(Pretreatment wastewater for all subsequent studies were mixed and sampled in the same
manner.) The basin pump was connected to a timer programmed to activate the pump for
1 hour at 8am, 11am, 2pm, and 5pm. A total of 20 gallons of makeup water was needed
over 48 hours to maintain the same volume of water in the basin.
A second intermittent study of IBF1 was conducted in concert with a continuous flow
study of IBF2. Two gray water discharges each totaling 32 gallons were added to each
basin respectively in the manner described above. It was noted that the wastewater
sample from the first wash was not as brightly colored blue as with previous gray water
samples, despite using the same detergent. The pump for IBF1 was again operated for 1
hour intervals at 8am, 11am, 2pm, and 5pm. The pump for IBF2 was operated
continuously. After 24 hours, fourteen gallons of makeup water were added to IBF1 and
twenty-one gallons to IBF2.
4.3.4 Constructed Wetlands
A study of the subsurface constructed wetlands component of each IBF was conducted to
evaluate the contribution to pollutant attenuation. As with previous studies, each basin
was drained of any existing water. Wastewater from a load of wash was discharged to
the mixing tank and subsequently to the basin. A total of 32.5 gallons was discharged to
each basin. After 24 hours, no makeup water was needed for IBF2, while 0.5 gallon was
added to IBF1. Three gallons of makeup water was added to each unit on the second and
final day of the study.
4.3.5 Green Roofs
Extensive green roofs consisting of 4 inches of expanded shale media on two buildings at
the Center for Green Roof Research were evaluated for ability to attenuate pollutants in
gray water. A detailed description of the green roofs’ design is presented in chapter 5.
A grid consisting of ½ inch PVC was constructed to distribute gray water uniformly
across the surface of each roof (Figs.4.05 and 4.06) The grid covered approximately 67%
of the roof and was placed at the top of the sloped roof and extended two thirds down the
slope. Each roof was previously fitted with a tank designed to collect storm water runoff
and connected via a gutter system. The initial study was conducted on the roof of
Building 2. Fifty five gallons of wastewater from two wash loads was pumped from an
29
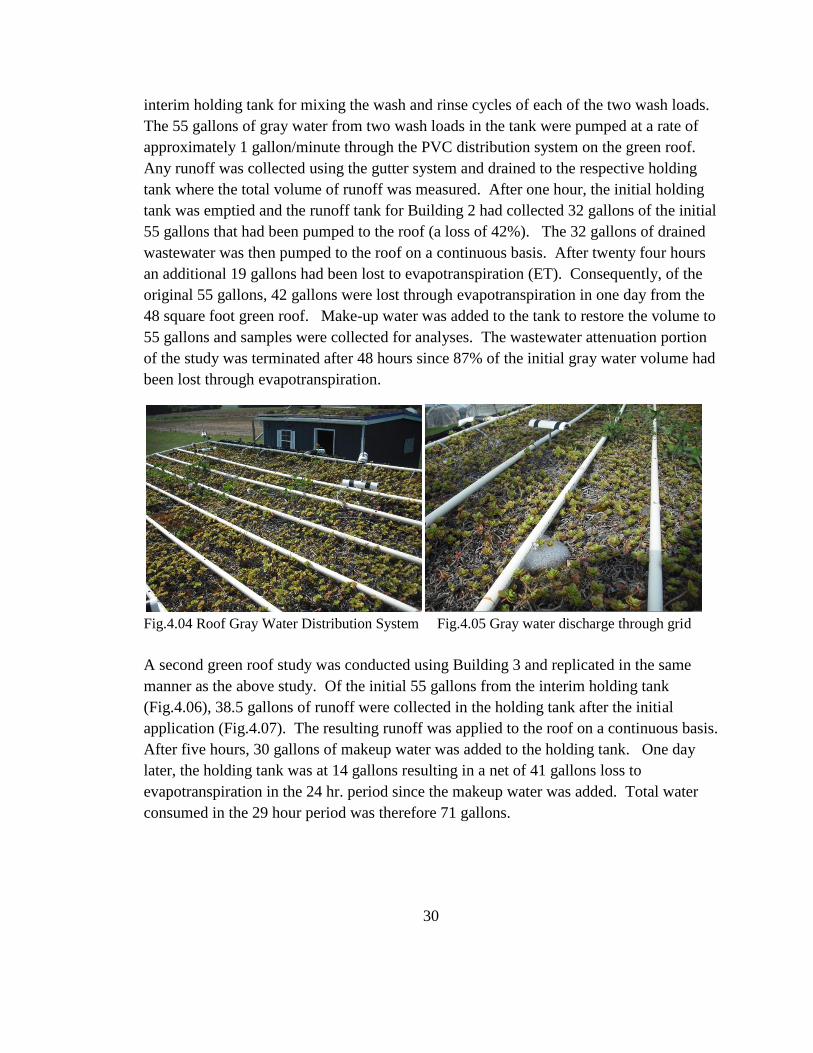
interim holding tank for mixing the wash and rinse cycles of each of the two wash loads.
The 55 gallons of gray water from two wash loads in the tank were pumped at a rate of
approximately 1 gallon/minute through the PVC distribution system on the green roof.
Any runoff was collected using the gutter system and drained to the respective holding
tank where the total volume of runoff was measured. After one hour, the initial holding
tank was emptied and the runoff tank for Building 2 had collected 32 gallons of the initial
55 gallons that had been pumped to the roof (a loss of 42%). The 32 gallons of drained
wastewater was then pumped to the roof on a continuous basis. After twenty four hours
an additional 19 gallons had been lost to evapotranspiration (ET). Consequently, of the
original 55 gallons, 42 gallons were lost through evapotranspiration in one day from the
48 square foot green roof. Make-up water was added to the tank to restore the volume to
55 gallons and samples were collected for analyses. The wastewater attenuation portion
of the study was terminated after 48 hours since 87% of the initial gray water volume had
been lost through evapotranspiration.
Fig.4.04 Roof Gray Water Distribution System Fig.4.05 Gray water discharge through grid
A second green roof study was conducted using Building 3 and replicated in the same
manner as the above study. Of the initial 55 gallons from the interim holding tank
(Fig.4.06), 38.5 gallons of runoff were collected in the holding tank after the initial
application (Fig.4.07). The resulting runoff was applied to the roof on a continuous basis.
After five hours, 30 gallons of makeup water was added to the holding tank. One day
later, the holding tank was at 14 gallons resulting in a net of 41 gallons loss to
evapotranspiration in the 24 hr. period since the makeup water was added. Total water
consumed in the 29 hour period was therefore 71 gallons.
30

ET rates are important when the volume of treated effluent discharges must be minimized
due to regulatory restrictions on reuse. ET also plays a role in reducing ambient
temperatures. Additional data regarding the latter are presented in Section 5.3.1.
Fig. 4.06 Interim Holding Tank for Graywater Fig.4.07 Holding tank at IBF2
4.3.6 Shower
A third IBF, designated IBF3, was constructed at a residence to collect gray water solely
derived from a shower. Three individuals took their standard shower using their routine
cleansing products. The shower head provided 1.25 gallons/minute flow. Volumes of
gray water discharges from the three showers were: 7 gallons, 6 gallons, and 14.5 gallons.
Unlike the blue discharge water from the washing machine runs, the shower water was
31

dull gray with more suds. Like the washing machine water, the shower discharge was
fragrant. Due to the smaller volume of water, which was anticipated to be loss to
evapotranspiration in less than 48 hours, the study was only conducted for one day. The
principal focus of this study was to assess BOD attenuation and the presence of fecal
coliforms in shower wastewater which had not been found in the washing machine
discharge. Two additional shower runs following the same procedures were conducted.
4.4 Results and Discussion
The gray waters associated with the various studies described above, were analyzed for
twenty -six chemical and physical parameters. Specific impacts to BOD, surfactants,
fertilizer-nitrogen, boron, phosphorus, and metals are presented below. Results for the
additional parameters are listed in Appendix A. Attenuation of pollutants with
intermittent flow was achieved at levels equal or superior to that obtained from
continuous flow (Tables 4.02 through 4.12).
4.4.1 Impact to Pollutant Parameters
4.4.1.1 BOD
The analysis for BOD (biological or biochemical oxygen demand) is widely used for
determining the organic quality of water. Despite its widespread use, the technique has
many issues that can affect the ultimate test result. Consequently, BOD is best used to
compare relative changes in concentrations. Pristine rivers typically have BOD levels of
1mg/l while moderately polluted rivers would range from 2 to 8 mg/l. Untreated sewage
in the US typically has BOD between 200 and 300 mg/l. Tertiary treated sewage
discharge routinely would have a BOD of less than 20 mg/l. The mean BOD
concentration for twenty washing machine gray water pretreatment samples was 269mg/l
with a range from 93.5mg/l to 685mg/l. Three composite shower samples representing 9
individual showers had a mean BOD concentration of 301 and a range of
Table 4.02 lists the BOD levels for the treated versus untreated gray waters associated
with the pollutant attenuation studies.
Study Name N Mean BOD [ ] of
Untreated
Mean BOD [ ]
Post 24 hrs.
Meets EPA
NPDES
Standard (30ppm)
IBF 11 390 15 Yes
IBF Intermittent Flow 2 179 5 Yes
IBF without plants 1 685 31 No
IBF Control 2 528 207 No
IBF Wetland 2 110 32 No
Green Roof 2 149 3 Yes
Shower 3 301 <5.11 Yes
Table 4.02 Impact of Treatment on BOD (mg/l) Per Study
32

The smallest reduction in BOD levels was observed for the control studies. For the
controls, gray water was circulated through the same components comprising the living
wall, living column, and constructed wetlands without the presence of plants or media.
The observed reduction in BOD can be attributed to the oxidation of pollutants from the
pumping of wastewater to the header with subsequent cascade to the basin. Oxidation by
the introduction of air into a wastewater is an effective abiotic method to reduce BOD
levels. Although wetlands are very effective at reducing the organic contaminants of
water, hydraulic retention time (HRT) is critical. Typically, constructed wetlands require
several days of HRT in order to achieve optimum treatment.
BOD reductions of wastewater to levels below 30 mg/l in 24 hours indicate a very
effective technique. The IBF without Plants reduced BOD to a level near compliance.
Previous research has found that unplanted wetlands are less effective at removing BOD
than planted wetlands (Stecher et al 2001). However, chemical, physical, and biological
processes that would take place in an IBF (even one without plants) would be capable of
eliminating organics in the wastewater at a highly effective rate.
All three of the IBFs had comparable effectiveness at reducing BOD levels below the
NPDES standard of 30mg/l with 24 hr. attenuation rates of 96% or greater. These
studies further demonstrate the effectiveness of integrating biofilters as found in the
initial studies discussed in chapter 3. Further, when contrasted with the Wetland studies,
the results underscore the benefits of combining vertical biofilters with subsurface flow
wetlands.
Perhaps most interesting are the results obtained by the Intermittent Flow and Green Roof
Studies. Circulating wastewater through the IBF for only 4 hours/day versus the 24
hours/day resulted in rates of BOD reduction that still achieved national standards. The
decrease in pump operation produced more than an 83% reduction in the daily energy
used to circulate the wastewater through the system. Consequently, sustainable methods
such as solar could be used to provide the minimal amount of energy needed to
intermittently circulate the water.
Due to the type of media used with the green roofs (expanded shale with less than 10%
by weight of compost) it was anticipated BOD reductions would be minimal. However,
the high rates of evapotranspiration, nearly 1 gallon/ square foot of green roof/ day,
eliminated the volume of wastewater. Make up water subsequently applied to the roof
did not result in “flushing” of organics to increase the BOD. Consequently, attenuation
of the organic content of the wastewater may be attributed to biological activity of
microbes associated with the media and plant roots.
33

4.4.1.2 Surfactants
Modern detergent formulations for washing machines contain a multitude of chemical
compounds. However, three components, known as builders, surfactants, and bleaches,
account for nearly 75% by weight of the detergent. Builders are water softeners, to
enable the detergent to function in water high in calcium, and include sodium carbonates,
complexation agents, and zeolites. Surfactants (the word derived from surface active
agents) reduce the surface tension of water. Alkylbenzenesulfonate is typically used as a
surfactant. Bleaches are oxidizers such as sodium perborate or sodium hypochlorite.
Also bleach activators are included such as tetraacetylethylenediamine. The remaining
25% of detergents is comprised of minor additives such as enzymes (proteases, lipases,
and amylases), foam modifiers, corrosion inhibitors, dye transfer inhibitors,
antiredposition agent ( carboxymethyl cellulose), optical brighteners, fabric softeners,
perfumes (ex. cyclohexyl salicylate), and colorants ( Smulders et al 2007).
The specific formulation of a detergent, such as the Tide liquid detergent used in these
studies, is proprietary. The label lists biodegradable surfactants (anionic and nonionic),
and enzymes. Attempts to obtain more specific information from Procter and Gamble
were unsuccessful.
Surfactants have the potential to cause significant environmental harm to aquatic
environments where they may form a surface film which reduces the transfer of
atmospheric oxygen to the water. In addition, some surfactants may be toxic to aquatic
organisms or interfere with the function of fish gills. However, not all surfactants pose
the same level of risk to the environment. Cationic surfactants appear to be more toxic
than anionic. Warne and Schifko (1999) evaluated the toxicity of 39 laundry components
using a Ceriodaphnia bioassay. On a molarity basis the most toxic group of compounds
was the surfactants, followed by the brighteners. During wastewater treatment aerobic
processes, surfactants can be partially degraded with the by-products readily absorbed to
suspended solids. By-products can include monyl and octyl phenols which are estrogen
mimickers and may pose significant risks to the environment (Scott and Jones 2000).
Due to the specific listing of surfactants in the detergent, the potential adverse impact to
the environment, and the availability of analytical methods, surfactants were chosen as
one of the parameters to monitor during the various studies. Three EPA approved
methods for surfactants exist and are known as methylene blue active substances
(MBAS) determination. An MBAS assay is a colorimetric method that uses methylene
blue to detect the presence of anionic substances. In these studies, Fairways Laboratory
used Standard Methods 5540c .
34
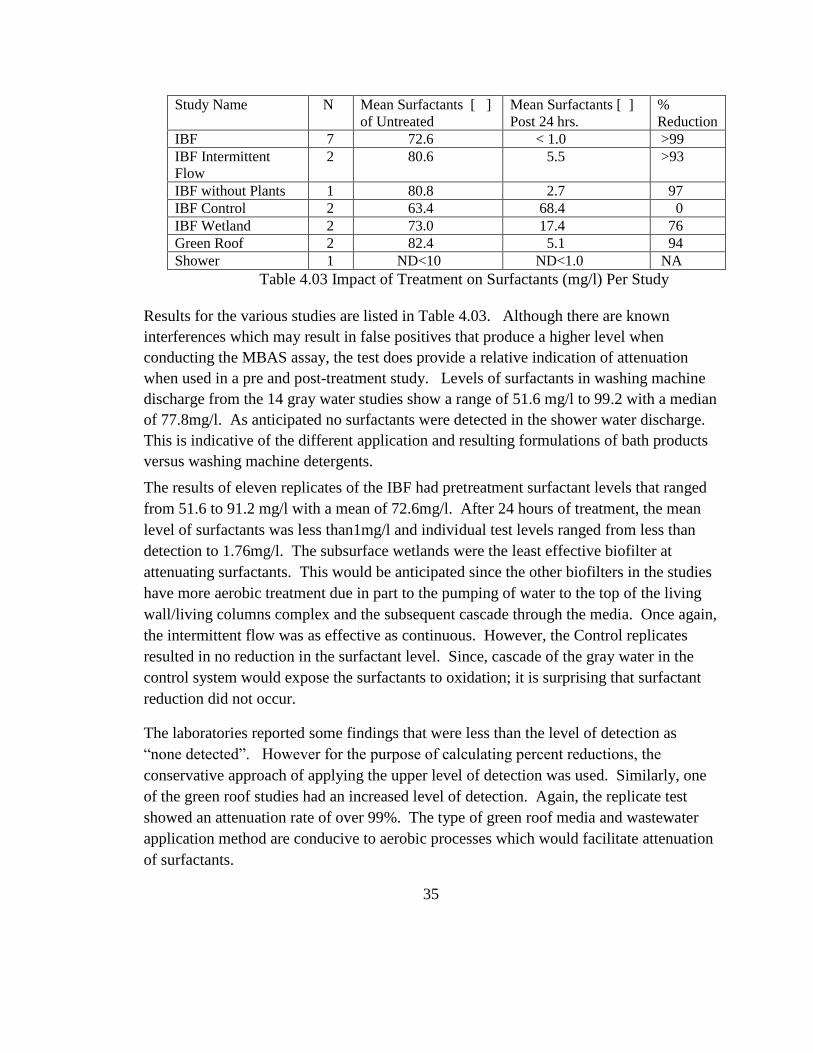
Study Name N Mean Surfactants [ ]
of Untreated
Mean Surfactants [ ]
Post 24 hrs.
%
Reduction
IBF 7 72.6 < 1.0 >99
IBF Intermittent
Flow
2 80.6 5.5 >93
IBF without Plants 1 80.8 2.7 97
IBF Control 2 63.4 68.4 0
IBF Wetland 2 73.0 17.4 76
Green Roof 2 82.4 5.1 94
Shower 1 ND<10 ND<1.0 NA
Table 4.03 Impact of Treatment on Surfactants (mg/l) Per Study
Results for the various studies are listed in Table 4.03. Although there are known
interferences which may result in false positives that produce a higher level when
conducting the MBAS assay, the test does provide a relative indication of attenuation
when used in a pre and post-treatment study. Levels of surfactants in washing machine
discharge from the 14 gray water studies show a range of 51.6 mg/l to 99.2 with a median
of 77.8mg/l. As anticipated no surfactants were detected in the shower water discharge.
This is indicative of the different application and resulting formulations of bath products
versus washing machine detergents.
The results of eleven replicates of the IBF had pretreatment surfactant levels that ranged
from 51.6 to 91.2 mg/l with a mean of 72.6mg/l. After 24 hours of treatment, the mean
level of surfactants was less than1mg/l and individual test levels ranged from less than
detection to 1.76mg/l. The subsurface wetlands were the least effective biofilter at
attenuating surfactants. This would be anticipated since the other biofilters in the studies
have more aerobic treatment due in part to the pumping of water to the top of the living
wall/living columns complex and the subsequent cascade through the media. Once again,
the intermittent flow was as effective as continuous. However, the Control replicates
resulted in no reduction in the surfactant level. Since, cascade of the gray water in the
control system would expose the surfactants to oxidation; it is surprising that surfactant
reduction did not occur.
The laboratories reported some findings that were less than the level of detection as
“none detected”. However for the purpose of calculating percent reductions, the
conservative approach of applying the upper level of detection was used. Similarly, one
of the green roof studies had an increased level of detection. Again, the replicate test
showed an attenuation rate of over 99%. The type of green roof media and wastewater
application method are conducive to aerobic processes which would facilitate attenuation
of surfactants.
35

4.4.1.3 Nitrogen
The effectiveness of biofilters to assimilate forms of nitrogen has been the subject of
much research. Microbial communities in wetlands play a dominant role in the removal
of inorganic nitrogen (nitrate and ammonium) (DeBusk 1999). In a process known as
denitrification, Pseudomonas spp. transform nitrate into nitrogen gas which is
subsequently returned to the atmosphere. Removal of ammonium in wetlands can occur
as a result of the sequential processes of nitrification and denitrification. The microbial
organisms’ (Nitrosomonas and Nitrobacter spp.) transformation of ammonium to nitrate
known as nitrification is an aerobic process and takes place in the oxygen rich zones.
The roots of hydrophytic plants provide microscopic zones of aeration. The nitrate can
then undergo denitrification in the anaerobic zones. Recently, a new microbial process
(anaerobic ammonium oxidation: ANAMMOX) has been found underscoring the
diversity of these processes and responsible microbes.(Shuhui et al 2009) In addition to
the role of microbes in biofilters, plants use nitrate as their primary source of nitrogen.
Depending on the receiving water body, treated domestic wastewater can contain as
much as 30 mg/l of nitrate-N and the EPA drinking water standard is 10 mg/l.
Tables 4.04 and 4.05 compare the pre and post- treatment levels of fertilizer-N (Nitrate-N
plus ammonium-N), and Nitrate-N. Fertilizer-N recognizes that plants can utilize both
nitrate-N and ammonium-N. The acceptable range of fertilizer nitrogen for most crops is
50 to 150 mg/l (PSU Ag Analytical Lab.). The 74% reduction attained in 24 hours by
the unplanted IBF underscores the role of microbes as described above. Also, the higher
attenuation rates observed in both of the constructed wetlands demonstrates the
importance of anaerobic and aerobic zones as well as the role of plants to optimize
attenuation. Intermittent flow to the IBF provided superior attenuation compared to
continuous flow.
As noted previously, operation of a planted IBF produces higher rates of evaporation
compared to an unplanted system or the subsurface constructed wetlands component.
Consequently, additional makeup water is required for the planted IBF. The makeup
water (source- the onsite well) contained 5.72 mg/L of nitrate-N (Appendix E). The
decrease in nitrogen levels despite the daily addition of makeup water indicates the
systems are consuming nitrogen effectively at levels greater than the calculated rates.
Berghage et al (2008) found that green roofs could serve to reduce the nitrogen content of
rainfall on an annual basis compared to non-living roofs. Gregoire and Clausen (2011)
obtained similar results for ammonia nitrogen, but found elevated levels of phosphate
compounds and copper. The nutrient status of a living roof (whether it is in a
36

“starved” state for nutrients versus one of excess) plays a role in the ability of a roof to
uptake nitrogen nutrients. The results of the green roof studies here demonstrate that
reduction took place, but at levels significantly less than those associated with the other
biofilter studies. This could be attributed to several factors: the high volume of water
flow in the test, the minimal presence of anaerobic zones, and the nutrient condition of
the roofs. The addition of 55 gallons of water per hour over a 24 hour period is
equivalent to nearly 2 inches of rainfall every hour for a day. Considering this volume of
water, it is surprising that the roofs were able to uptake this amount of nitrogen.
Study Name
N
Fertilizer-N [ ]
of Untreated
Fertilizer-N [ ]
Post 24 hrs.
IBF without Plants 1 6.62 1.71
Continuous Flow 3 6.07 2.17
Intermittent Flow 2 8.27 1.61
Green Roofs 2 7.59 5.30
Constructed Wetlands 2 8.70 1.50
Shower 3 28.56 7.09
Table 4.04 Impact of Treatment on Fertilizer-N (mg/l) Per Study
Study Name
N
Nitrate-N [ ]
of Untreated
Nitrate-N [ ]
Post 24 hrs.
IBF without Plants 1 5.62 0.71
Continuous Flow 3 5.07 1.18
Intermittent Flow 2 6.92 0.61
Green Roofs 2 6.03 4.31
Constructed Wetlands 2 7.70 <0.50
Shower 3 26.29 6.09
Table 4.05 Impact of Treatment on Nitrate-Nitrogen (mg/l) Per Study
37

The nitrate-N concentration of all of the post-treatment gray water samples were at levels
less than the EPA drinking water standard of 10 mg/l. At a pH lower than approximately
8.5, ammonia nitrogen exists almost exclusively in the ionized form (ammonium, NH4+).
When the pH is high, ammonia (NH3) volatilization can result in significant removal of
nitrogen (DeBusk 1999). At 7.3 the pH for the untreated shower graywater was the
lowest of all of the untreated gray water samples in the 11 studies. The source of water
for the shower was the public water system for State College, Pa. whereas the water used
for the washing machine studies utilized well water at a Penn State University’s Rock
Springs Agricultural Center. The source of both water supplies is ground water in an
area of extensive limestone formations. Although ammonium-N is present in elevated
levels in wastewaters associated with human or livestock excrement, its presence in gray
waters derived from a washing machine or shower is negligible. Fertilizer-N (table 4.04)
minus nitrate-N (table 4.05) equals ammonium-N.
38

4.4.1.4 Boron
Boron is a naturally-occurring element that is widespread in nature at relatively low
concentrations (Woods, 1994). Although boron concentrations in rocks and soils are
typically less than 10 mg/L, concentrations as high as 100 mg/L have been reported in
shale and some soils of regions of the US (esp. in the southwest). Concentrations
reported in sea water range from 0.5-9.6 mg/L, with an average of 4.6 mg/L and fresh
water concentrations typically ranging from <0.01-1.5 mg/L. The concentration of boron
in the well water which was used for the washing machine gray water studies was 0.27
mg/l. Boron naturally occurs as a compound ( always found chemically bound to
oxygen), usually as alkali or alkaline earth borates, or as boric acid. The most important
source of exposure for human populations is ingestion of boron from food (primarily
fruits and vegetables) (USEPA 2004). Boron is an essential micronutrient for plants, in
which it primarily regulates carbohydrate metabolism. It is also essential for protein
synthesis, seed and cell wall formation, and the germination of pollen grains. However,
elevated levels of boron are toxic to plants. Certain crops are more sensitive to boron
toxicity. Penn State’s Agricultural Laboratory cautions boron toxicity may occur if
irrigation water exceeds 0.5 to 1.0 mg/L, particularly with long-term slow-growing crops.
High levels of calcium may increase the boron tolerance of plants.
The Federal Government does not regulate boron in drinking water and, public drinking
water systems are not required to monitor for this contaminant. As levels of boron in
drinking water increase above the One-Day and Ten-Day Health Advisory (3.0 mg/L)
and the Longer Term Health Advisory (2.0 mg/L) for children, the risk for the potential
effect on the testes of young males increases when consumed for the duration indicated
by the advisory.
As the level of boron in drinking water increases above the Longer Term Health
Advisory and Lifetime Health Advisory for adults (5 mg/L), the risk for the potential
effect on the fetuses of pregnant women and the testes of males increases (Butterwick et
al 1989, USEPA 2008). Some boron compounds have been found to have antibacterial
properties for selected enteric microbes (Bailey et al 1980).
The source of the boron in the gray water from the washing machine is postulated to be
from the bleach component of the detergents which contain oxidizers such as sodium
perborate. Concentrations of boron detected in the pre-treatment versus post treatment
gray waters are presented in Table 4.06.
39

Study Name
N
Boron [ ]
Untreated
Boron [ ]
Post 24 hrs.
IBF without Plants 1 0.59 0.60*
IBF Continuous Flow 3 1.64 0.40
IBF Intermittent Flow 2 1.58 0.29
Green Roofs 2 1.55 0.14
Constructed Wetlands 2 1.41 0.68
IBF (Shower) 3 0.04 < 0.04
Table 4.06 Impact of Treatment on Boron (mg/l) Per Study (*post 48hrs)
Analyses of pretreatment levels for boron in washing machine gray water indicate there is
a potential for adverse impacts on crops. However, due to the lack of oxidizers in shower
personal care products, the level of boron detected was very low. The green roofs were
particularly adept at removing boron from the wastewater. In addition to uptake by
plants, the boron compounds may have been adsorbed by the media.
Based on the levels of boron detected in the gray water, long term use of biofilters to treat
gray water could result in accumulation of levels toxic to plants. However, periodically
harvesting plants would provide a mechanism for removal of boron from the biofilter.
40

4.4.1.5 Fecal Coliform
Fecal coliform bacteria are specific to the intestinal tracts of warm-blooded animals,
including humans, and consequently are a good indicator to determine if water has been
subject to fecal contamination. The presence of fecal coliform in a sample does not mean
pathogenic organisms are present, only that the potential exists.
A survey of the microbial quality of recycled household gray water by Casanova et al
(2001) found that fecal coliforms in gray water were affected by time of year, presence of
children in the household, use of kitchen sink water, and use of in-ground storage for
untreated gray water. These factors were found to have minimal impact on the levels of
E. coli in the gray water. Kitchen sinks appear to be the largest source of fecal coliforms
in gray water. Washing of meat and poultry in the sink may also introduce pathogenic
organisms into the gray water supply. Rose et al tracked the persistence of enteric
pathogens in gray water generated from a diverse group of families various gray water
sources. The study concluded that there may be some risk associated with reuse of gray
water when enteric pathogens are removed during showering.
Use of sand filtration to treat gray water was shown to be insufficient to reduce the
microbial population (Chaillou et al 2011). Additionally, the study evaluated the
effectiveness of three chlorinated products with calcium hypochlorite less effective. The
presence of organic matter offered the potential for chlorine to react inducing by-products
such as chloramines.
At hydraulic residence times of 3 to 6 days, constructed wetlands are as effective, and in
most cases, more effective at removing disease causing bacteria and viruses than
conventional treatment systems (Gersberg et al 1989). As discussed in chapter 3,
previous studies using IBFs resulted in 100% reduction in fecal coliforms from black
water in less than three days. No fecal coliforms were detected in washing machine gray
water samples. However, 10 CFU/ 100ml were detected in the pretreatment shower gray
water. After 24 hours of treatment with an IBF, the level was reduced 50% to 5
CFU/100ml.
The diverse microbial communities that colonize biofilters appear particularly adept at
eliminating fecal coliforms. Integration of biofilters optimizes attenuation of fecal
coliforms presumably by optimizing microbial diversity.
41

4.4.1.6 Phosphorus
Although phosphorus is essential to plant growth, elevated levels in storm water runoff
and wastewater discharges to water bodies have created significant water quality
problems including algal blooms and hypoxia. Wastewater levels of phosphorus
discharged to surface waters should be less than 1mg/l. However, Class I streams and
other high quality receiving water bodies can have discharge requirements as low as
0.025mg/l. The well water used in the gray water washing machine studies had <0.03
mg/l of phosphorus.
Historically, detergents in the US contained elevated levels of phosphates. However,
environmental degradation necessitated a reformulation. Today, state statutes limit
phosphate content for certain types of detergents in certain regions. In Pennsylvania, the
Water and Sewage Phosphate Detergent Act of 1989 and amended in 1992 (PA ST 35
P.S. §§ 722.1 - 722.3) affects "all counties partially or wholly within the Susquehanna
River Watershed or in the Lake Erie Watershed." This Act prohibits the manufacture, sale
or distribution of any cleaning agents containing any phosphate, except contained
incidentally during manufacture. Some exemptions apply, such as cleaning agents used
in dairy, beverage and food processing equipment, in hospitals and health care facilities,
in agricultural production, by industries for metal cleaning, in biological and chemical
research facilities, and those used in the household for cleaning windows, sinks, counters,
stoves, tubs and other food preparation surfaces and plumbing fixtures. Dishwashing
detergents are allowed to be up to 8.7% phosphorus by weight. In Pennsylvania, Tide
containers must identify that no phosphates are contained in the detergent (Knud-Hansen
1994). The removal of phosphates from detergent formulations is evident in the low
levels detected in the gray water samples from the 11 studies presented in table 4.07.
Note that the concentration of phosphorus in the shower gray water is higher and
reflective of the exception for associated personal care products.
Biofilters such as wetlands are particularly adept at removing phosphates from
wastewater (Drizo et al 1997, Guan et al 2009). In wetlands, phosphates can bind with
clays, iron, and aluminum oxides through chemisorptions (DeBusk 1999). However,
since the level of phosphates in gray water from washing machines is not significant, the
constructed wetlands component of the IBF was constructed with materials that do not
preferentially remove phosphates. For wastewater streams where phosphates pose an
42

issue, modifications of the IBF can be made to enhance its ability to remove them. Note
that in the studies where the pretreatment concentrations of phosphorus were elevated
(1.49mg/l and above), the biofilters substantially reduced the levels. However, it should
also be noted that the post-treatment levels of most of the studies resulted in increased
levels of phosphorus. Undoubtedly, this is due to extraction of phosphorus from the
media used in the various biofilters when levels in the gray water were at lower
concentrations.
Study Name
N
Phosphorus [ ]
Untreated
Phosphorus [ ]
Post 24 hrs.
IBF without Plants 1 0.46 1.53
IBF: Continuous Flow 3 0.96 0.91
IBF: Intermittent Flow 2 0.06 0.45
Green Roofs 2 0.07 0.06
Constructed Wetlands 2 0.06 0.71
IBF (Shower) 3 1.78 0.69
Table 4.07 Impact of Treatment on Phosphorus (mg/l)
43

4.4.1.7 Metals
Modern society would not be possible without metals. Indeed, human health requires
adequate levels of essential metals such as zinc. Additional metals such as manganese
are under consideration as necessary for proper human biological function. So too plants
require metals. Magnesium is an essential secondary macronutrient and copper, iron,
manganese, and zinc are all necessary micronutrients. However, man’s use of metals
often results in concentrations to levels that pose chronic and acute risks to humans,
plants, and other life. Typically, residential wastewaters do not contain levels of metals
that pose risks to humans.
As a result of physical, chemical, and biological processes, constructed wetlands are an
effective sink for metals. Processes include sedimentation, adsorption, complexation,
metabolic uptake by plants and microbes, and microbial-mediated reactions including
oxidation and reduction (Dunabin and Bowmer 1992, Mungur et al 1998, Mungur et al
2000).
Gray water samples from washing machine discharge and a shower were analyzed for six
metals (copper, iron, manganese, magnesium, molybdenum, and zinc). Tables 4.08
through 4.11 present results of 13 studies for attenuation of four of these metals in gray
waters. Data for iron and molybdenum are contained in Appendix A.
Study Name
N
Mg [ ]
Untreated
Mg [ ]
Post 24hrs.
IBF without Plants 1 27.01 19.50
IBF: Continuous Flow 3 27.18 24.56
IBF: Intermittent Flow 2 26.02 29.11
Green Roofs 2 26.98 25.41
Constructed Wetlands 2 28.46 32.72
IBF: Shower 3 21.38 23.38
Table 4.08 Impact of Treatment on Magnesium (mg/l)
Of the six metals evaluated only copper has an EPA primary drinking water standard
(1.3mg/l). Non-enforceable secondary drinking water standards have been developed for
copper (1.0 mg/l), manganese (0.05 mg/l), and zinc (5 mg/l) (USEPA, Drinking Water
Standards).
44

The availability of metals is directly related to the pH of the medium. As indicated
previously, the lowest pH of the gray waters in the eleven studies was 7.3 with the
remainder between 7.3 and 8.0. This alkaline pH inhibits the dissolution of metals in
water. Also, metals can interact. For example, elevated levels of iron can impact the
availability of zinc.
Study Name
N
Mn [ ]
Untreated
Mn [ ]
Post 24 hrs.
IBF without Plants 1 0.10 <0.01
IBF: Continuous Flow 3 <0.05 <0.01
IBF: Intermittent Flow 2 <0.02 <0.02
Green Roofs 2 <0.02 <0.01
Constructed Wetlands 2 <0.01 0.29
IBF: Shower 3 <0.01 <0.01
Table 4.09 Impact of Treatment on Manganese Levels (mg/L)
Study Name
N
Cu [ ]
Untreated
Cu [ ]
Post 24hrs.
IBF without Plants 1 0.02 0.02
IBF: Continuous Flow 3 0.03 0.02
IBF: Intermittent Flow 2 0.04 0.01
Green Roof s 2 0.04 <0.01
Constructed Wetlands 2 0.02 0.02
IBF: Shower 3 <0.02 0.02
Table 4.10 Impact of Treatment on Copper (mg/l) Per Study
Analysis of the well water used in the gray water washing machine studies found the
following concentrations (mg/l): 30.27 for Mg, 0.04 for Mn, 0.01 for Cu, and 0.05 for Zn.
45

Study Name
N
Zinc [ ]
Untreated
Zinc [ ]
Post 24hrs.
IBF without Plants 1 0.03 0.09
IBF Continuous 3 0.10 0.07
IBF Intermittent 2 0.13 0.06
Green Roof s 2 0.09 0.02
Constructed Wetlands 2 0.08 0.08
IBF: Shower 3 <0.02 <0.03
Table 4.11 Impact of Treatment on Zinc Levels (mg/l)
Levels of metals in the gray water samples indicate no concentrations of concern.
Although several samples (pre and post- treatment) indicated elevated levels for
manganese, these levels are reflective of the background levels found in the well water.
Of the six metals evaluated, copper and zinc have the greatest potential to cause adverse
impacts to organisms when concentrations are elevated. Gray water pretreatment levels
for copper were well below the drinking water standard as was the level for zinc relative
to the secondary standard. It is interesting to note that the green roofs were the most
effective biofilter in the various studies at removing copper and zinc. Given the high
volume of the gray water application during the green roof studies (equivalent to nearly
2 inches per hour of rainfall continuously for 1 day), it is most likely that an ion
exchange reaction occurred with the media enabling the metals to be extracted.
Although the metal concentrations in the gray water were at de minimis levels, over time
continuous application of large water volumes to a closed system (i.e. treatment systems
with no water discharge or plant harvesting) may result in accumulation to significant
levels. However, the IBF provides options to address metals should levels pose a concern
such as with some industrial wastewaters. The living column component could have the
contents modified to enhance its ability to provide ion exchange and then planted with
hyper-accumulators for subsequent harvesting, composting, and pyrolysis.
46

4.5 Summary of Results
Integrating biofilters that include constructed wetlands, living walls, living columns, and
green roofs, provides synergistic benefits which decrease the foot print of the treatment
system, and reduce detention times. The studies detailed here using an IBF demonstrate
the ability to reduce in less than 24 hours many gray water contaminants including: BOD,
surfactants, nitrogen, and fecal coliforms to levels below applicable standards.
The research demonstrates that an IBF can attenuate a priority pollutant in graywater to
meet EPA wastewater discharge limits. Further this attenuation was accomplished with a
HRT of 24 hours. This is less than the time required for a subsurface constructed
wetlands to obtain the same attenuation rate.
Components of the IBF were analyzed to determine each contribution to pollutant
attenuation. The tests indicate the whole is greater than the sum of its components.
Creating a wide range of microhabitats may further diversify microbial communities.
Despite the equivalent of 2 inches/ hour of gray water flow, green roofs were able to
attenuate specific pollutants such as metals and surfactants. Aerobic and chemisorption
processes probably were the attenuation methods.
Comparison of continuous flows of gray water through an IBF versus intermittent flow
found no significant difference in rate of pollutant attenuation. Consequently, less energy
was used to operate an IBF without sacrificing effectiveness.
Results of studies conducted in Chapters 3 and 4 demonstrate that the IBF possesses the
following characteristics of an optimum decentralized treatment plant.
• Compact with a small footprint+
• Low Energy +
• Modular to adjust to various flow applications +
• Inexpensive to Construct +
• Comprised of Readily Available Materials +
• Low Maintenance +
• Effective Attenuation of Pollutants
• Minimal HRT
Meyer et al (1999) estimates that more than 50% of residential water use is for irrigation
of a homeowner’s landscape (Fig.4.08). The IBF has demonstrated the ability to
transform gray water into a clean resource. This water could be used to offset the use of
potable water for water landscapes. As such it would not only avoid the costs of
transportation and treatment in a central treatment system or inundation of on lot septic
tanks, but also offset the cost and use of potable water. Chapter 5 will explore additional
opportunities to utilize the treated gray water to lower the temperature of building
envelopes with resulting decreases in energy needed to cool living spaces.
47

Figure 4.08 Residential Water Use Indoor/Outdoor
48

5. WASTEWATER AS A WATER RESOURCE: ENERGY
5.1 Overview
Chapters 3 and 4 detailed the ability of IBFs to demonstrate the characteristics of an
optimal decentralized wastewater system. Specifically, IBFs were shown to exhibit 8 of
the 10 criteria.
• Compact with a small footprint+
• Low Energy +
• Modular to adjust to various flow applications +
• Inexpensive to Construct +
• Comprised of Readily Available Materials +
• Low Maintenance +
• Effective Attenuation of Pollutants +
• Minimal HRT +
• Converts Wastewater into a Water Resource
• Easily integrated into building architecture
In many regions of the USA, more than 50% of residential potable water use is for
landscaping (www.epa.gov/watersense/pubs/outdoor.html). Increasingly, treated
wastewater from centralized treatment plants,(especially in areas such as California,
Texas, and Florida) is used for watering landscapes. On site treatment of residential
wastewater could replace the use of potable water for landscapes. As discussed in
Chapters 3 and 4, the IBF produces a treated wastewater of sufficient quality to be readily
used for irrigation. This practice in itself, demonstrates the potential of utilizing an IBF
to convert wastewater into a water resource. This chapter explores another opportunity
and will present studies evaluating the potential of incorporating IBFs as functional
architecture to reduce the energy needs of associated buildings during the treatment and
subsequent application of gray water. Obtaining net energy benefits from gray water
would demonstrate another potential use of wastewater as a water resource.
Consequently, specific questions posed were:
Would the installation of an IBF on the exterior south wall of a building
significantly reduce the mean maximum temperature of the exterior wall surface?
Would a reduction in the mean maximum temperature of the exterior wall surface
create a corresponding significant reduction in the temperature of the internal
wall?
Would treated gray water applied to a roof significantly reduce the mean
maximum temperature of the roof surface?
Would a reduction in the mean maximum temperature of the roof surface result in
a corresponding significant reduction in the internal roof temperature?
Can a significant reduction in internal wall or roof temperature decrease demand
for cooling resulting in a measurable reduction in energy use?
49

5.2 Methodology
The described research was limited to six 4.65-m2 (48-ft
2) buildings, three with green
roofs and three without green roofs, located at the Russell E. Larson Research Center of
the Pennsylvania State University near Rock Springs, located approximately 9 miles from
State College, Pa. (Fig.5.01). Two of the six buildings were each fitted with an IBF
(described in chapts.3 and 4) which was located against the south facing wall.
Figure 5.01 Building layout at experimental field site located at the Russell E. Larson
Agricultural Research Facilities
The integration of an IBF on the south wall of a building was evaluated for its ability to
reduce the external and internal building temperatures. In addition, impacts of the treated
gray water from the IBF to reduce the temperature of a traditional asphalt shingle roof
and an extensive green roof were evaluated.
5.2.1 Solar Impact on Wall Orientation
Basic geographic information for State College, Pa. is presented in Table 5.01.
Latitude: +40.79333 (40°47'35.988"N)
Longitude: -77.86028 (77°51'37.008"W)
Time zone: UTC-5 hours
Local time: 11:53:35
Country: Pennsylvania, United States
Altitude: ~350 m
www.gaisma.com/en/location/state-college-pennsylvania.html
Table 5.01 Basic Geographic Data for State College, PA
50

At latitude 40047’35.988” N, State College experiences an annual solar path variation of
47 degrees, due to the earth’s tilt. Consequently, the sun’s maximum angle of elevation
above the horizon on June 21 is 72.5 degrees (Fig.5.02). This variation impacts the solar
gain on a building’s exterior depending on its orientation, with the north wall receiving
the least amount versus the greatest impact on the south wall. Examination of external
wall temperatures for buildings at the test site confirmed that the south exposure
consistently had the greatest temperature gain (Fig.5.03).
www.gaisma.com/en/location/state-college-pennsylvania.html
Figure 5.02 Annual Solar Variations for State College, PA
Consequently, IBFs (constructed per Chapts.3 and 4) were situated on the South wall of
buildings 2 and 3. Both buildings have extensive living roofs.
51
Sun path
Today
June 21
December 21
Annual variation
Equinox (March and
September)
Sunrise/sunset
Sunrise
Sunset
Time
00-02
03-05
06-08
09-11
12-14
15-17
18-20
21-23

Figure 5.03 Comparison of A Test Building’s External Wall Temperatures
Specific meteorological conditions pertaining to ambient temperature, relative humidity,
solar radiation, and rainfall at the Center for Green Roof Research for the study period
are included in Appendix B.
5.2.2 Mechanism of Heat Transfer in Buildings
Heat transfer in buildings is primarily accomplished via three processes: conduction,
convection, and radiation (fig.5.04). Direction of movement is a function of the change
in temperature (∆T) where heat energy moves from areas of high energy to low energy.
Consequently, during the summer months heat energy migrates into buildings where
conditioned spaces have less heat energy than the exterior. Conversely, heat energy will
migrate out of buildings during the winter from heated indoor spaces to cold exteriors.
Convection is one of the principal processes by which heat energy escapes buildings
during winter. With the absence of windows in the test buildings, conduction is the
principal process by which exterior heat energy enters during the summer months.
52
0
10
20
30
40
50
60
70
80
Tem
pe
ratu
re (
◦C)
September 1 through September 3
South Wall West Wall East Wall North Wall

Figure 5.04 Building Heat Transfer Processes
5.2.3 Test Site Layout and Building Design Specifications
The six buildings used in these studies are part of the Center for Green Roof Research
established by Drs. David Beattie and Robert Berghage in 2000 to promote greenroof
research, education, and technology transfer. As such the buildings have been used to
conduct a wide range of research projects which have provided important findings to
advance the understanding of extensive green roofs (Berghage et al, 2007,DeNardo et
al,2005,Jarrett et al,2006,Jarrett et al,2004).
53
blocktheheat.com

An overview of these buildings’ design and the associated temperature monitoring
system is repeated here. Specifics of the test site layout, building design specifications,
and associated figures detailing these designs have been excerpted from Julie DeNardo’s
master thesis (Pennsylvania State University, 2003) and verified.
The components of the green roof (the waterproof membrane, drainage layer, growth
medium, and plants) were identical for each green roof (fig.5.05). At the time of
installation, the growth medium was a mix of 12.5% sphagnum peat moss, 12.5% coir
(coconut fiber), 15% perlite, and 60% hydrolite with a saturated density of 4.90 kg/m3
(3.67 lbs./in.-ft2) and a uniform depth of 89 mm (3.5 in.). Currently, Sedum spurium
accounts for 99+% of the vegetation and the roofs are more than 95% vegetated. The
profile for the study green roofs is shown in Figure 5.05.
Figure 5.05 Greenroof profile schematic for study facilities (Note: the PEPP layer was subsequently removed)
The six wood frame buildings measure 1.8- x 2.6- x 2.6-m (6- x 8- x 8-ft). The buildings,
sited to allow for consistent exposure to the sun and weather elements, were arranged in a
2 x 3 grid spaced 6 m (20 ft.) apart (Figure 5.06). This separation helped to reduce the
influence of one building on another (due to blocking of wind, rain, snow, and especially
sun), and ensured that the indoor and outdoor environments of each building were
independent. Each building was also constructed with an individual water collection
system. Green roofs were installed on half of the buildings in an alternating pattern
(Figure 5.06). The buildings were oriented with the bottom edge of the roof slope (1/12)
on the south side of the buildings to optimize solar exposure. Each building was
constructed with only one opening, a door located on the north side. Each building was
constructed with identical insulation levels and air conditioning systems. The 3 kW
(10,200 Btu/h) window air conditioning unit was located in the north wall of each
building (Figure 5.07). A WatchDog weather station was installed on the north-west
corner of an onsite building to collect ambient temperature, solar radiation, relative
humidity, cumulative rainfall, wind speed and wind direction
54
Source:Denardo
Sedum
PEPP
Growth Medium
Drainage Layer
Waterproof Membrane

Figure 5.06 Plan view of building layout and schematic cross-section
(shaded buildings have green roofs installed; not to scale; Source: DeNardo)
The insulation in the walls and roof of each building was 89 mm (3.5 in.) of fiberglass
batting insulation with a thermal resistance (R) of 2.3 m2-K/WS (13 ft
2-h-F/Btu). Sheets
of 6.35 mm (¼ in.) oriented strand board (OSB) sheathing were placed on the interior of
the insulation. The building floor insulation was also fiberglass batting insulation with an
R-value of 2.3 m2-K/WS (13 ft
2-h-°F/Btu) installed below the 6.35 mm (¼ in.) OSB floor
surface.
55
Green roof
(typical)
1 2
3 4
5 6
N
Section A-A
2.4m
1
12
A
A
6m
6m
6 m
Control roof
(typical)
1.8m
2.6m
1.8m

Figure 5.07 Air Conditioner Location (Source:DeNardo)
The construction of the green roofs was as follows. A treated lumber framework was
constructed around the edge of the green roofs to contain the components. A 13 mm
(½ in.) gap was maintained along the south facing edge of the roof, between the roof
surface and the treated lumber frame, to allow for the free passage of stormwater runoff
from the roof to the gutter. Each component was layered on the roof beginning with the
waterproof membrane, followed by a drainage layer, the growth medium, and finally the
sedum. Figure 5.08 shows a schematic of these layers.
56
Air conditioning
unit
N

Figure 5.08 Profile of green roof with thermistor placement layers (Note: the PEPP layer
subsequently removed, the thermistor changed to monitor surface of media; Revised from
DeNardo)
The temperature measurement system required a sensor that collected the desired data,
some intermediate components that translated the signal, and a computer that recorded
and stored the information collected (Figure 5.09). Temperature sensors were placed
directly at interfaces between the layers of components of the building walls, roof, and
floor. The placement of the thermistors in the various layers of the green roofs is shown
in Figure 5.08. These levels are labeled 1 through 7. With the subsequent removal of the
original PEPP layer, the corresponding thermistor was used to monitor the surface of the
media. Power meters were used to determine the amount of energy used by the building
over time.
57
Thermistors
PEPP
Growth Medium
Drainage Layer
Waterproof Membrane
Fiberglass Insulation
6.35-mm (¼-in.) OSB 1
2
3
4
5
6
7

The thermal system utilized thermistors for temperature data collection located at the
various interfaces of wall, roof, and floor layers. The placement of these sensors was
identical in each building except that several additional thermistors were placed in the
layers of the green roofs. All the thermistors were connected to the multiplexer located in
each building and then to a Campbell datalogger located in a seventh (support) building.
The datalogger signal was sent to a computer where all collected values were recorded.
For the control buildings (traditional asphalt shingled roofs) thermistors were placed as
follows. Two Omega thermistors, model #44006 ( 0.2C), were located at the
approximate center of each wall surface area. One of these thermistors was located on
the interior of the outside wall adjacent to the insulation. The other was located on the
exterior of the OSB adjacent to the insulation (Figure 5.10). Two thermistors were
placed on the floor of each building, one directly below the floor surface and the other
below the floor insulation layer. Two sensors were placed in the roof similar to the
construction in the walls. One sensor was located on the bottom side of the insulation
and the other was placed directly above the insulation. In all cases where more than one
thermistor was located in a particular building component (as in the walls and roof) the
thermistors were arranged in-line with one another.
58
Computer
Building
Figure 5.09 Measurement system schematic for data collection
Multiplexer
Datalogger

Figure 5.10 Wall cross-section
The thermistor locations for the green roofed buildings were identical to the control
buildings for the four walls and floor. Additional thermistors were required within the
components of the green roof. Thermistors were placed below the drainage layer and
also between the drainage layer and the growth medium at locations a, b, c, and d for
each building (Figure 5.11). These locations are vertical levels 3 and 4 in Figure 5.6.
The additional thermistors on the green roofs at levels 5, 6, and 7 were suspended inside
small lengths of PVC pipe, halved lengthwise, to reduce the effect of direct solar
radiation on the thermistors. Level 5 was located directly at the top surface of the media.
The thermistors at Level 6 were approximately 102 mm (4 in) above the top surface of
the media and suspended in the plant canopy. The thermistors at level 7 were
approximately 203 mm (8 in) above the top surface of the media, above the expected full
height of the sedum.
59
insulation
6.35-mm (¼-in.) OSB Exterior wall
thermistors

Figure 5.11 Plan view layout of thermistor locations on green roofs
5.2.4 Energy Measurements
A 3-kW (10,200-Btu/h) air conditioner was installed in each building to maintain a
maximum indoor temperature of 21 ˚C (69.8 ˚F ). Only the air conditioners were
utilized during these studies (i.e.no auxiliary heating). Standard power meters ( 2.5%
readability error) were installed on each building, and the energy consumption required to
maintain the indoor temperature was collected manually during the study. Three
portable P4460 Kill A Watt EZ Power Meters from P3 International Corporation were
initially used to provide additional, more sensitive readings of energy use. This duplicate
tracking system allowed for verification of specific readings. The portable Kill A Watt
Meters were moved to monitor energy use of specific buildings in a particular study. The
Kill-A-Watt meters, which provides a digital readout of kW to the one hundredths, is
accurate to 0.5% according to the manufacturer’s manual (P3 International Corporation,
132 Nassau St., NY, NY). Potential operating errors with some of the utility meters
combined with the inability of these meters to measure energy usage less than 1 kW hr.
necessitated the subsequent purchase of two additional Kill A Watt meters.
60
a
b c
d
2.4 m
(8ft)
1.8 m
(6 ft)
0.61 m
(2 ft)
0.61 m (2 ft) 0.61 m (2 ft)
0.61 m
(2 ft)

Two dataloggers were programmed to record temperature data. Programming for the
temperature and energy measurements included the hourly collection of data over the
course of the study. A Campbell 23X datalogger was used for the temperature data
collection. The datalogger recorded the change in voltage in the thermistors relating to
the temperature of the thermistors. A sequence of mathematical operations changed these
voltage readings to temperature in degrees Celsius. This operation was done once every
30 seconds and every 10 minutes the measurements were averaged. These average
values were recorded and stored for each thermistor location in each building. Site
specific meteorological parameters were also monitored and the data collected using the
same system.
Data collection systems were calibrated before the instrumentation was taken from the
lab to the field site. Examination of the output of each instrument individually and also
when connected in series verified that each instrument was performing correctly. The
thermistors were attached to a digital multimeter to check the resistance at given
temperatures. The computer output for the datalogger was checked against the initial
multimeter reading for the thermistors to ensure that the values were the same.
The data collection equipment was arranged as follows for the site. One multiplexer was
located in each building to obtain the signal from the thermistors. A datalogger was
placed in a support building to collect the signals from the multiplexers. A computer
downloaded the data recorded by the dataloggers at specified intervals dependent upon
the program. The energy consumption of each building due to cooling loads was
collected at least daily for the duration of each study. The standard power meters
measured the energy consumed to maintain the constant indoor temperature and were
backed up by the portable Kill-A-Watt Meters. The 3000-W air conditioners used in
these buildings were oversized for the space of the buildings, but were the smallest units
available (DeNardo 2005).
61

5.2.5 Energy Use Comparisons
In order to determine if wastewater can serve as a resource to lower building envelope
temperature, several questions were posed:
Would the installation of an IBF on the exterior south wall of a building
significantly reduce the mean maximum temperature of the exterior wall surface?
Would a reduction in the mean maximum temperature of the exterior wall surface
create a corresponding significant reduction in the temperature of the internal
wall?
Would treated gray water applied to a roof significantly reduce the mean
maximum temperature of the roof surface?
Would a reduction in the mean maximum temperature of the roof surface result in
a corresponding significant reduction in the internal roof temperature?
Can a significant reduction in internal wall or roof temperature decrease demand
for cooling resulting in a measurable reduction in energy use?
5.3 Evaluation of IBF on Buildings’ South Walls versus No IBF
The modern application of biofilters on vertical surfaces is a relatively recent innovation.
Unlike constructed wetlands and green roofs, investigations of these bio-filters have been
few. Most efforts have focused on creation of vertical systems producing a wide
variation of applications from vine systems supported by trellis to concrete retention
walls formed to allow plant growth. The living wall component of the IBF developed
for this research is more analogous to turning an extensive green roof 90 degrees on its
side. Although the living wall component does include the use of media, Sedums and
similar drought tolerant plants have been replaced with a wide spectrum of plants with
increased leaf surface area that optimize evapotranspiration (ET). Utilizing IBF systems
on two test buildings, as described in Chapters 3 and 4 and depicted in Fig.5.12, these
studies investigated the ability to reduce the mean maximum external and internal south
wall temperatures.
62

Fig.5.12 Test Site at Russell E. Larson depicting 2 of the Buildings with IBF
The difference in internal temperature versus external temperature (∆T) determines the
direction that energy will travel as heat energy migrates to the area of lower temperature.
Consequently, heat moves into an air conditioned building during hot, summer days and
out of heated buildings during cold, winter nights. Energy gain on a building’s envelope
from solar radiation (watts/m2) can increase the external temperature considerably above
the ambient temperatures. Peak ambient daily temperatures for the first week of
July,2010, from 10am to 6pm at the test site ranged from 23°C to 37°C (Fig. 5.13) with a
mean of 31°C while mean peak south wall daily temperatures for three control buildings
ranged from 47oC to 59
oC (Fig.5.14) with a weekly mean of 54°C . Although ambient
temperatures are important in determining the direction of energy flow in a building
envelope, solar radiation plays a critical role in the actual temperature that an exposed
building façade attains. Exposed building wall peak temperatures can far exceed peak
ambient temperatures due to direct solar radiation.
63

Daily solar radiation at the test side for the period July 1 through 7 is depicted in figure
5.15. Using a conversion of 1kW per 0.2931 Btu/hr., the 800 watts/sq. meter of solar
radiation observed during July would equate to 136Btu/hr. /sq. meter of energy delivered
to some part of the building envelope depending in part on the specific surface orientation
and angle of the sun’s elevation.
Fig. 5.13 Ambient Temperature for July 1-7 at Test Site
Fig. 5.14 South Wall Temperatures of Building without IBF for July 1-7
64

Fig. 5.15 Daily Solar Radiation at Test Site for July 1- 7
The angle of the sun affects the amount of radiation that a particular part of a building
can receive. As discussed previously, at the latitude of the test building site, the sun’s
angle varies 47 degrees annually. Figures 5.16 and 5.17 show the comparative daily
temperatures from all four walls of a test building for July and September respectively.
Note that as the sun’s angle decreases from July to September the south wall receives
more energy compared to the roof and consequently peak temperatures of the south wall
are greater than the roof. However, with shorter days, the impact of solar radiation on
building envelope temperatures is decreased with resulting decreases in peak
temperatures. Also, without the artificial control of air conditioning, the maximum
internal temperature is delayed compared to the maximum external temperatures
(Fig.5.16). This is a function of not only the ∆T, but also the R-value of intervening
materials.
65
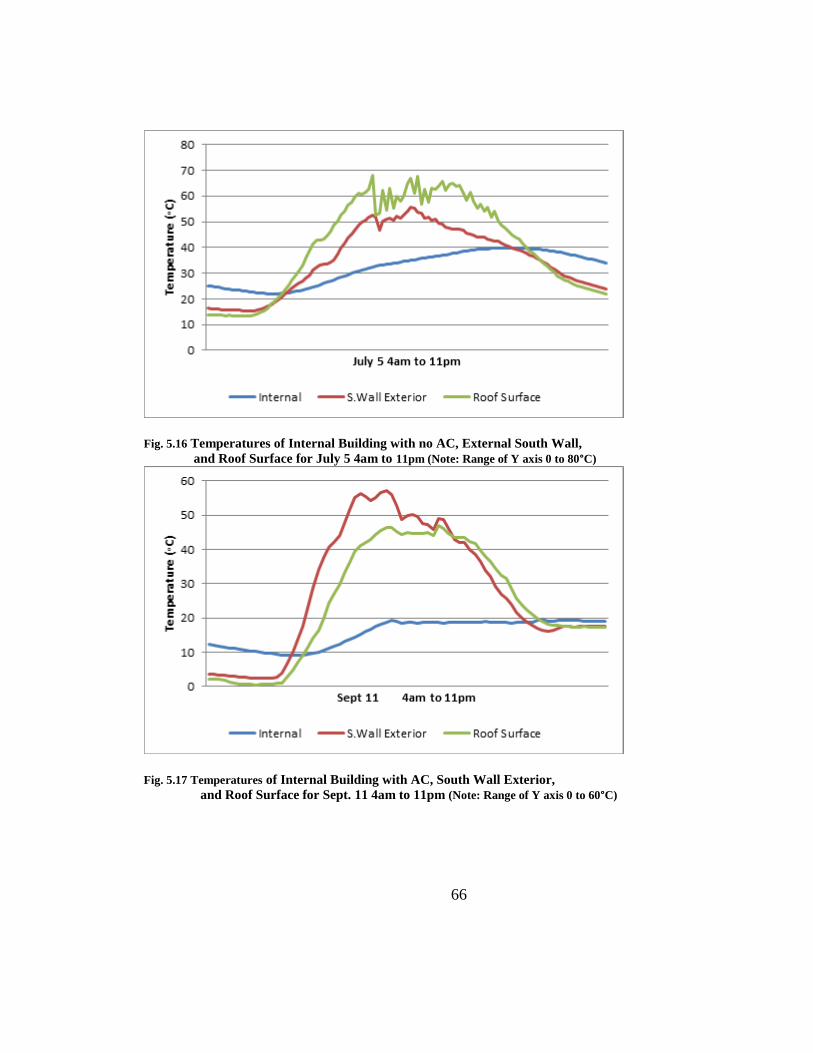
Fig. 5.16 Temperatures of Internal Building with no AC, External South Wall,
and Roof Surface for July 5 4am to 11pm (Note: Range of Y axis 0 to 80°C)
Fig. 5.17 Temperatures of Internal Building with AC, South Wall Exterior,
and Roof Surface for Sept. 11 4am to 11pm (Note: Range of Y axis 0 to 60°C)
66

The impact of the IBFs installed on the south walls of two buildings were evaluated to
determine if building envelope temperatures were reduced compared to three control
buildings with no IBFs. The July temperature mean for buildings with IBF (30o C)
during the time interval of 10am to 6pm were significantly lower (p<0.05) than the
average temperature mean for control buildings with no IBF (42°C). Similarly,
comparison of mean temperatures from 10am to 6pm for the month of August of the
exterior south wall for the control buildings with no IBFs (41o C) to buildings with IBF
on the South wall (25oC) indicate a significant difference(p<0.05). September
temperature mean for buildings with IBF (21oC) during the time interval of 10am to 6pm
were significantly lower (p<0.05) than buildings with no IBF (36oC). This difference
represents a 29% decrease in mean temperatures during the month of July, a 39%
decrease for August, and a 42% decrease for September. These results are summarized in
Table 5.02.
Month Mean Max. Exterior Temperature
of South Walls with No IBF (°C)
Mean Max. Exterior Temperature
of South Walls with IBF (°C)
July 42 30
August 41 25
September 36 21
Table 5.02 Mean Maximum Monthly Exterior Temperature of South Wall with No IBF
versus South Wall with IBF
Analysis of exterior south wall temperature means for July (10am to 6pm) were evaluated
for individual buildings within a group (i.e. control buildings or buildings with IBF). The
mean temperature of building 2 with IBF (30o C) was not significantly different (p<0.05)
from building 3 with IBF (30oC). Similarly, the mean temperature comparison of the
south wall exterior of building 4 (42oC) and building 5 (42
oC) was not significantly
different (p<0.05). Analysis of exterior south wall temperature means for August (10am
to 6pm) were evaluated for individual buildings. The mean temperature of building 2
with IBF (26o C) was not significantly different (p<0.05) from building 3 with
IBF
(25oC). Similarly, the mean temperatures of the south wall exterior of building 4 (41
oC),
building 5 (41oC), and building 6 (41
oC) were not significantly different (p<0.05).
Buildings with an IBF had a mean exterior south wall maximum temperature of 360C
compared to 670C for buildings with no IBF. Figure 5.18 illustrates the impact of an IBF
on the external south wall mean temperature of buildings with IBF compared to buildings
with no IBF. The results are analogous to that seen with green roofs in damping the
temperature fluctuations peak maximum and minimum temperatures (Sec. 5.5).
67

Fig. 5.18 Mean South Wall Exterior Temperatures of Buildings with IBF vs. Buildings with No IBF
Fig. 5.19 Mean South Wall Internal Temperatures of Building with IBF vs. Building with no IBF
A similar, though reduced, impact on internal temperature was also observed (Fig. 5.19).
Figures 5.20 and 5.21 provide a better depiction of the impact to the external and internal
temperatures by selecting a shorter period of time (4 days) compared to the month of data
presented in the previous figures.
68

Modification of external surface temperatures cannot be simply extrapolated to decreased
internal building temperatures. As determined by Liu, the associated R-values of the
intervening materials impact the amount, if any, of temperature reductions.
A means comparison of internal south wall temperatures during the month of August for
Buildings with IBF (19oC) versus buildings with no IBF (21
o C) show a significant
(p<0.05) decrease in temperature between 10am and 6pm. Similarly, a comparison of
internal temperature during the month of July for building 2 with IBF (26oC) versus
buildings with no IBF (30oC) demonstrate a significant (p<0.05) decrease in temperature.
The elevated internal temperatures in July are due to the absence of air conditioning
which was turned on in each building on July 26. A means comparison of September
maximum internal wall temperatures for buildings with IBF (18oC) versus buildings with
no IBF (21oC) exhibits a significant (p<0.05) decrease in temperature. Results are
summarized in table 5.03. The 10% to 14% reduction in inside wall temperature can
reduce energy demand for cooling. For the period July 26 through August 12, a
building with an IBF used 16% less energy to cool the building than did a building with
no IBF. During the subsequent year for the period July 20 through August 26, the mean
energy reduction for two buildings with IBF compared to three buildings with no IBF
was 15%.
Month Mean Max. Interior Temperature
of South Wall with No IBF (°C)
Mean Max. Interior Temperature
of South Wall with IBF (°C)
July 30* 26*
August 21 19
September 21 18
Table 5.03 Mean Maximum Interior Temperature of a South Wall with No IBF versus a
South Wall with IBF (* Building Air Conditioners were turned on July 25 at 4:30pm)
For the period, September 6 through September 15, the air conditioner for a building with
an IBF used 17% less energy than a building with no IBF (12.79kWh versus 15.39kWh).
According to the Kill A Watt meters, the buildings’ air conditioners consumed 12.79
kWh versus 15.39 kWh. The traditional dial utility meter on each building indicated 12
kWh and 15kWh of energy were used respectively resulting in a 20% reduction. A
lightning strike to the Center on August 6 damaged some of the infrastructure and
possibly impacted several of the utility meters. Also the Kill A Watt meters provide
more sensitive kWh readings than the traditional dial utility meters. Consequently, for
studies such as these where daily energy consumption and the comparative differences
are low, dial utility meters may be problematic.
69

During the course of the energy studies over two summers, energy use was periodically
monitored using both the dial utility meters and Kill A Watt meters. Sporadic problems
were noted with some of the dial meters including low readings and intervals when one
of the dial meters would stop for a period of hours before resuming operation.
Discussions with local utility meter readers indicated such issues were not uncommon
and part of the rationale for replacing dial meters with digital meters.
Fig. 5.20 Mean South Wall External Temperature of Buildings with IBFs vs. Buildings with No IBFs
70
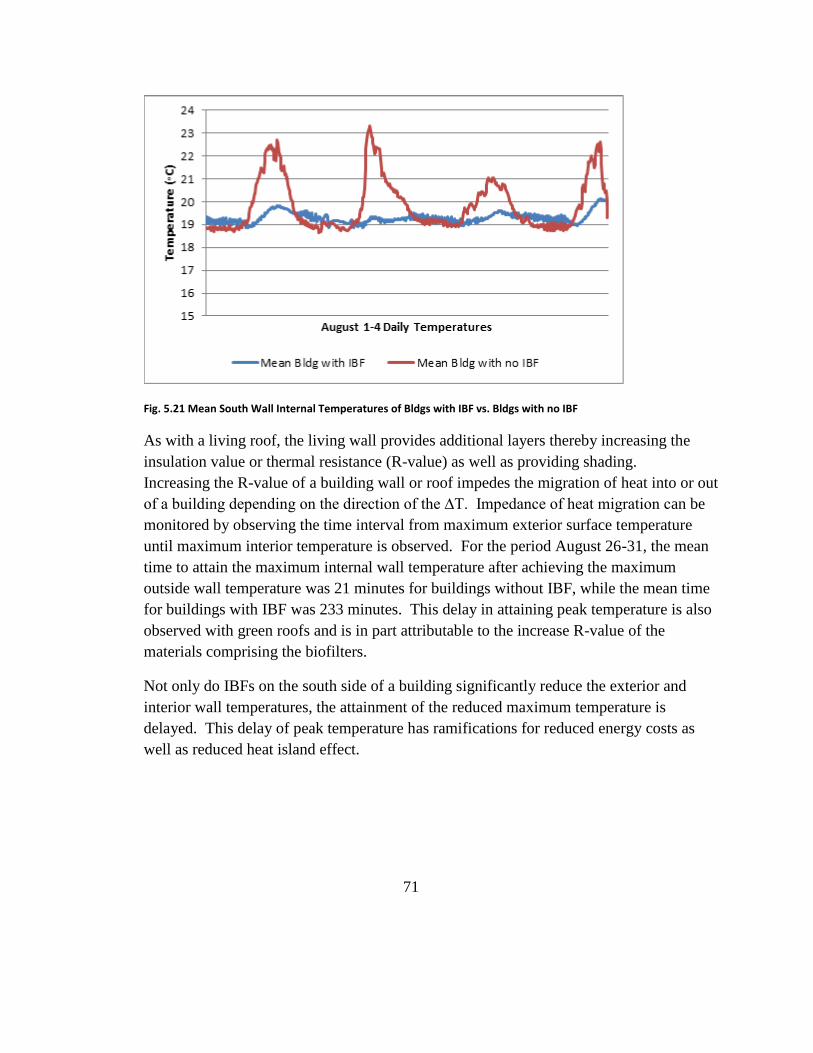
Fig. 5.21 Mean South Wall Internal Temperatures of Bldgs with IBF vs. Bldgs with no IBF
As with a living roof, the living wall provides additional layers thereby increasing the
insulation value or thermal resistance (R-value) as well as providing shading.
Increasing the R-value of a building wall or roof impedes the migration of heat into or out
of a building depending on the direction of the ∆T. Impedance of heat migration can be
monitored by observing the time interval from maximum exterior surface temperature
until maximum interior temperature is observed. For the period August 26-31, the mean
time to attain the maximum internal wall temperature after achieving the maximum
outside wall temperature was 21 minutes for buildings without IBF, while the mean time
for buildings with IBF was 233 minutes. This delay in attaining peak temperature is also
observed with green roofs and is in part attributable to the increase R-value of the
materials comprising the biofilters.
Not only do IBFs on the south side of a building significantly reduce the exterior and
interior wall temperatures, the attainment of the reduced maximum temperature is
delayed. This delay of peak temperature has ramifications for reduced energy costs as
well as reduced heat island effect.
71

5.3.1 Evaporation Observations
The impact of evaporation (evapotranspiration) on global energy partitioning has been
compared to the daily detonation of atomic bombs in terms of the quantity of energy
affected. The evaporation of 6 mm of water over a one hectare field (2.5 acres) is the
energy equivalent of 15 tons of dynamite (Mankiewicz et al 2007). The rate of
evapotranspiration (ET) from biofilters such as the IBFs or a green roof is affected by
several meteorological factors including the ambient air temperature, moisture content,
and wind velocity. Seasonal and biological factors such as plant morphology also
impact ET rates.
While conducting studies of pollutant attenuation and building envelope impact of IBFs,
water loss was monitored. These observations were not intended to detail ET rates of
biofilters. Rather, the data was collected to provide an indication of the range of water
loss occurring during these studies and subsequent implications for zero discharge
systems. Table 5.04 provides an overview of the associated water loss which occurred
during studies conducted over two growing seasons.
Study N Mean Water Loss (gallons/sq.ft./day)
IBF Continuous Flow 21 0.78
IBF Intermittent Flow 8 0.67
Gray water to Green Roof 14 0.32
Gray water to Standard Roof 6 0.27
Table 5.04 Mean Water Loss Observed During Studies
The specific amount of energy (Btu) absorbed during the evaporation of water is
impacted by the initial temperature of the water. However, the difference is minimal
over the range of temperatures of the gray water in these studies (18 to 21o C).
Consequently, a value of 8,700Btu to evaporate 1 gallon of water is used to evaluate the
potential impact of the IBFs. Based on the mean water loss rates, an IBF with continuous
flow and a footprint of 15 sq. ft. absorbed 104,400Btu per day (the equivalent of nearly 9
tons of air conditioning). At a water loss of 0.27 gals. /sq. ft. /day, the shingled roof (48
sq. ft.) with gray water application absorbed 112,752 Btu per day (the equivalent of over
9 tons of air conditioning). The observed water loss for the respective type of study is
as expected. Continuous flow with the increased exposure to air and bio-filter surface
should have a greater water loss than intermittent flow. The presence of plants with
large leaf areas such as Canna sp. should provide the IBFs with a greater ET than an
extensive green roof planted with Sedum sp. Water cascading over a living wall is more
exposed to solar radiation than water percolating through media on a green roof. Water
loss from a shingled roof has no ET component. However, due to the many factors that
can affect the rate of water loss, these studies should not be compared to one another.
Rather, the data is provided here as an indication of the relative impact of water loss on
temperature reductions. The specific contribution of evaporation to the observed surface
temperature reductions from the IBF was not evaluated.
72

5.4 Evaluation of IBFs with Differing Flow Regimens
Studies discussed in Chapter 4 found that intermittent flow of gray water through an IBF
(four times daily, each of 1 hr. duration) was as effective at attenuating pollutants in gray
water as a continuous flow. Would intermittent flow be equally effective at reducing
mean maximum surface temperatures as continuous flows?
Studies were concurrently conducted to determine if intermittent flow could significantly
reduce internal and external temperatures compared to buildings with no IBF.
Two studies of intermittent flow were conducted for the periods August 30 to September
3 and September 6 to September 15. Figures 5.22 -5.26 illustrate the impact of
intermittent flow on the building’s south wall internal and external temperatures. The
width and variability of individual external temperature peaks demonstrate the impact of
intermittent flow which created cooling with subsequent heating until the next cycle of
flow (Figure 5.23). The mean outside temperature of the south wall for a building with
IBF intermittent flow (20oC) was significantly greater (p<0.05) than the mean outside
temperature of the south wall for a building with IBF continuous flow (18oC). Figure
5.24 depict the decrease in exterior surface temperature by both IBF continuous flow and
IBF intermittent relative to the mean of control buildings with no IBF.
There is a decrease in interior temperatures by both flows relative to the mean south wall
temperature of the three control buildings. However, the amount of the decrease is
reduced from that observed with the exterior wall temperature and consequently both
flow regimens produce a similar response. Again, this is the same result which has been
observed with studies of green roofs. The mean maximum interior south wall
temperature of a building with IBF intermittent flow (19o C) was not significantly
different (p<0.05) from the mean maximum interior temperature of a building with IBF
continuous flow (19oC). However, these mean maximum internal temperatures were less
than the comparable temperatures for two control buildings which each had mean
temperatures of 200C. These internal reductions are especially important considering the
buildings are air conditioned which minimizes the temperature disparity between the IBF
wall and the control wall at the cost of additional energy. This energy penalty will be
discussed in a later section. However, these results show both intermittent and
continuous flows create similar reductions in the internal wall temperature and superior
reductions compared to the control buildings.
73

Fig.5.22 Impact of IBF and Flow Regimen on Mean Exterior South Wall temperatures 8/30-9/3
Fig. 5.23 Impact of IBF and Flow Regimen on Exterior South Wall Temperature 9/6-15
74

Fig. 5.24 Impact of IBF and Flow Regimen on Mean Interior South Wall Temperature
Fig.5.25 Impact of IBF and Flow Regimen on Mean Interior South Wall Temperatures
No significant difference (p<0.05) was found between the mean interior temperature of a
building with IBF intermittent flow (19oC) compared to the mean interior temperature of
a building with IBF continuous flow (19oC) for the period September 6 to 15 from 10am
to 6pm. Although the mean temperature is not significantly different between
75

continuous and intermittent flow, there is an increase in temperature peaks and valleys for
intermittent flow as depicted in figure 5.26. This increased variability can be attributed to
the cooling and subsequent heating resulting from the periodic flow.
Figure 5.26 Impact of IBF and Flow Regimen on Mean South Wall Exterior Temperatures
76

5.5 Impact on Roof Temperatures of Living Roof versus Non-Living Roof
A green roof potentially provides temperature mediation at both the interior and exterior
roof surfaces by complex heat and mass transfer processes resulting in a damping of
temperature fluctuations (Liu 2004). The basic concept is that by providing additional
layers on top of the roof, the insulation value or thermal resistance (R-value) will
increase. Also, accelerated evapotranspiration occurring at the plant layer, will provide a
cooling effect on the roof area. The use of vegetation further reduces the radiation
absorbed by the roof surface, thereby reducing the roof surface temperature. Modeling
by Del Bario (1998) in France demonstrated that green roofs do not “cool” buildings, but
do provide additional thermal resistance which reduces heat transfer through the roof.
The mathematical model created by Del Bario accounted for several levels of foliage
type, growth medium density, thickness, and water content, temperatures and wind
speeds. Del Bario concludes that the “soil” thermal diffusivity increased with apparent
density of growth medium and decreased with soil moisture content. Del Bario also
stated that the main thermal function of the plant canopy was to provide shade, thus
reducing the radiation in the summer (Del Bario, 1998).
Niachou (2001) experimentally compared the air and surface temperatures above and
below the roofs of selected buildings with and without green roofs. Only indoor and
outdoor surface temperatures were monitored over the summer months from June 30 to
August 17. It was observed that the non-insulated building with a green roof required
37 – 48% less cooling energy in the summer months; for moderately insulated buildings
the cooling energy savings were between 4 and 7%; for a well-insulated building the
differences were even smaller (2% or less). Overall the energy consumption was less for
all buildings with green roofs (Niachou, 2001).
A Greek study by Antonopoulos and Koronaki (2000) demonstrated that peak energy
loads were reduced by reinforcing the component of the building envelope with the
highest thermal capacitance (the energy stored within the building per degree temperature
difference). The installation of a green roof can impact the building envelope by
affecting the thermal capacitance and time constant of the roof element of this building
envelope. In Turin, Italy, a study evaluated the annual thermal performance of a green
roof. This study found the measured R-value (2.2-2.8ft h oF/Btu) differed from the R-
value calculated from the summation of values attributed to each of the component
layers. Difficulties with calculating R-values of green roofs are in part due to the non-
static nature of biological systems. Plant materials change thermal performance
seasonally and with various meteorological conditions. The thermal resistance of a
77

green roof increases in summer because evapotranspiration takes place as plants “mine”
the media for moisture. The Turin study assessed the evapotranspiration from dry and
wet green roofs finding that 12% to 25% of the incoming heat flux was absorbed
respectively (Lazzarin et al 2005). Further, the total heat flux reduction of a dry green
roof was 60% in contrast to an outgoing flux for wet conditions.
Velasco et al (2007) developed a green roof thermal model that can be used in building
energy simulation programs. Lightweight trays to simulate extensive green roofs were
used to evaluate the potential to improve the thermal performance of green roofs due to
the associated insulation properties. Studies were conducted in a state-of-the-art
environmental chamber where conditions could be tightly controlled. The calculated R-
value of the modular green roof system (5 ft2
h oF/ Btu) was higher than previously
reported for extensive green roof field data. Investigators suggested the expanded
polystyrene and enclosed air cavities played a larger role in affecting R-value than the
growing media or plants in the system. A subsequent study by Velasco et al (2009)
contrasted green roofs with brown roofs and determined that plants were able to produce
almost constant latent heat fluxes versus daily fluctuations associated with the brown
roofs. Bell and Spolek used a special purpose wind tunnel to simulate exposure of
extensive green roof trays to widely varying temperature. Their study also evaluated
different media thicknesses, soil moisture, and plant types. Under steady state conditions
the mean R-value for all of the tests was 2.1 h ft2 oF/Btu, however, R-values had a wide
range from 0.8 to 8.7 h ft2 oF/Btu. Their study found that vegetated roofs had
significantly higher R-values than bare soil of comparable conditions and hotter air
temperature increases a green roof’s effective R-value. However, increasing soil
moisture beyond that necessary to meet transpiration requirements of plants reduced
effective R-values.
Experiments by DeNardo et al utilizing the 6 test buildings at the Center for Green Roof
Research determined the range of air conditioning savings from the extensive green roofs
of 5 to 10% per cooling season. The lower energy savings than found by other
researchers was attributed to the small roof area and low air conditioning demand. The
thermal analysis of the field site buildings by DeNardo yielded two main results. First,
the temperatures at several layers within the roofs are statistically different, with the
green roofed buildings maintaining lower temperatures, compared to control roofs, at the
roof surface in the summer months. Second, the green roof system maintained a
statistically smaller daily fluctuation in temperature at the roof surface level.
78

Overall, various research studies have found a range in the reduction of heat flux and
resulting decrease in cooling demand with living roofs to be 5% to 75%.
Figures 5.27 and 5.28 depict what has now become the well verified ability of green roofs
to dampen temperature fluctuations on the exterior as well as interior of buildings versus
non-green counterparts resulting in a decrease in energy demand for cooling.
The mean outside temperature for the month of July during the period 10am to 6pm for
the buildings with green roofs (25oC) was significantly (p<0.05) lower than the mean
temperature for buildings with standard, asphalt shingle roofs (50oC). This data supports
the findings of DeNardo et al for the same buildings.
Figure 5.27 Mean Outside Roof Temperatures of Green Roofs vs. Asphalt Shingled Roofs for July
79

Figure 5.28 Mean Inside Roof Temperatures of Green Roofs vs. Asphalt Shingled Roofs for July
Further, Fig. 5.29 illustrates the increased dampening of temperature fluctuations by
subsequent layers of a living roof progressing from the media to the inside of the
building. This impact was detailed by the study of DeNardo. In contrast figure 5.30
depicts the impact of solar radiation on temperature of a non-green roof building. Note
the difference between the maximum and minimum temperatures
Figure 5.29 Temperature Variations Between Green Roof Layers
80
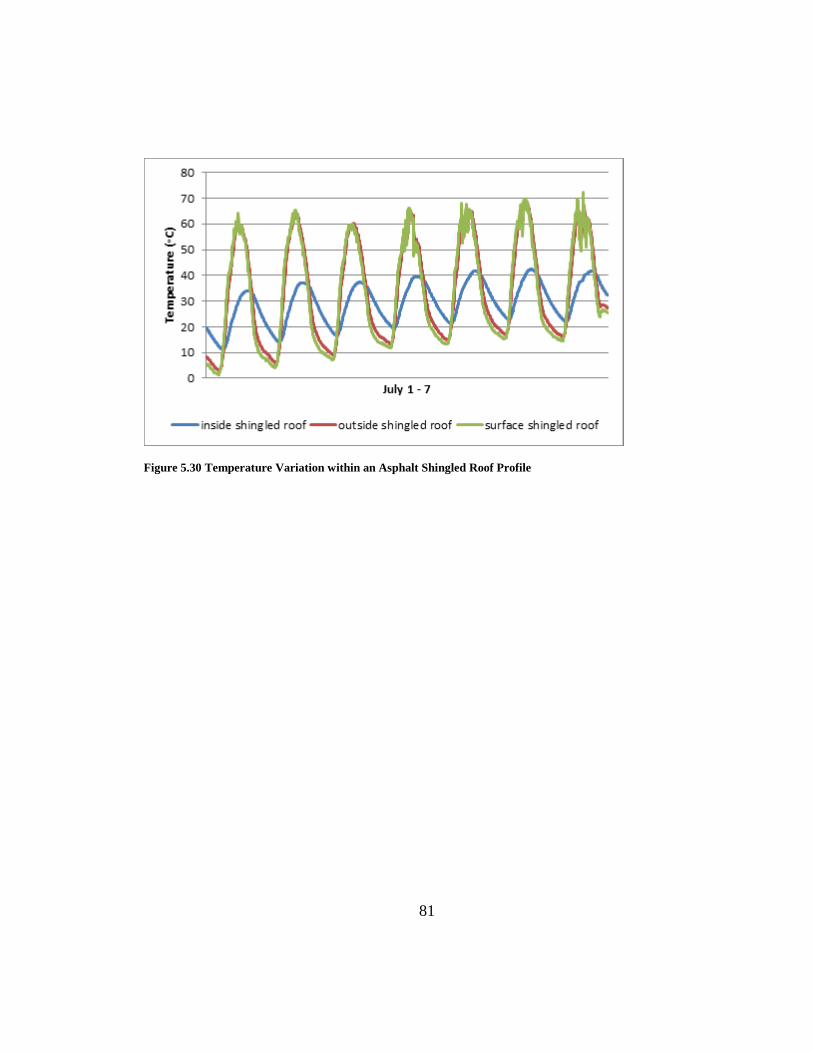
Figure 5.30 Temperature Variation within an Asphalt Shingled Roof Profile
81

5.6 Living Roof with Graywater Application
The growing body of research has demonstrated the ability of living roofs to reduce
temperature fluctuations with subsequent decreases in energy demand for cooling. This
study investigated the potential role of gray water addition to enhance the effectiveness of
green roofs. As depicted in Fig. 5.31, gray water was applied using a PVC pipe
distribution system on the green roofs of test buildings (methodology described in
Chapter 4).
Figure 5.31 Gray Water Distribution System on Test Building with Green Roof
Addition of gray water reduced the peak surface temperature of a green roof versus a
green roof without the addition of moisture (Fig. 5.32). Rainfall events occurred on three
days during the test (August 4, 5, and 6 with rain totals in inches of 0.50, 0.01, and 0.21
respectively). During the two weeks prior to the test, there were 5 measurable rainfall
events totaling 0.49 inches. Although figure 5.32 indicates a measurable reduction in
temperature with the addition of gray
82

water, the difference is negligible. The mean surface temperature of a green roof
building with no water application (27oC) was not significantly (p<0.05) different from a
green roof building with water application (27oC). Consequently, inside roof
temperatures of these buildings were not significantly different (Fig. 5.33). As discussed
above, Bell and Spolek found increasing soil moisture beyond that necessary to meet
transpiration requirements of plants reduced effective R-values. With the addition of
0.72 inches of rainfall during the test and 0.49 inches during the two weeks prior, the
Sedums on the control roof had sufficient moisture. Although, this study did not find
that excess soil moisture reduced thermal resistance, the benefit compared to the control
roof was negligible.
Although central Pennsylvania can have periods during the summer months of zero
rainfall, typically these periods are brief and last only a few days. This study suggests
the potential for gray water to enhance performance of green roofs would be optimal in
hot areas with longer periods of zero rainfall.
Figure 5.32 Mean Roof Surface Temperature of Green Roof with no water application vs. Green Roof with
treated gray water application
83

Figure 5.33 Inside Roof Temperatures of a Green Roof with Treated Gray Water Application vs. a Green Roof with no Water Application
5.7 Flooded Non-Living Roof
In arid regions, a common practice is to wet flat roofs by spraying or flooding with water
to promote evaporative cooling. In the 1960s, scientific investigations of roof ponds
were initiated by Harold Hay with subsequent studies on full scale applications in the US
(Hay 1978, Marlatt 1983). A flooded roof receives direct and scattered solar radiation
with intensities that vary with time and meteorological conditions ( Brdlik and
Mezhevnikov, 1965 ). A portion of the direct and scattered radiation is reflected from
the surface, another is absorbed by the water, and a third passes through the layer of
water and reaches the surface of the roof.
Would treated wastewater applied to an asphalt shingle roof reduce the mean maximum
surface temperature to levels comparable to the mean maximum temperature associated
with a green roof?
84

Figure 5.34 Mean Surface Temperature of Green Roofs vs. Asphalt Shingled Roof
Figure 5.35 Mean Inside Roof Temperature of Greenroofs vs. Asphalt Shingled Roof
Figure 5.34 presents a comparison of the mean roof surface temperature for three green
roofs versus a building which has an asphalt shingle roof without water application.
Figure 5.35 depicts a comparison of the inside roof temperatures.
85
0
5
10
15
20
25
30
35
40
45
Tem
pe
ratu
re (
°C)
July 1-7
green roofs asphalt shingled roof

.
Fig. 5.36 Treated Wastewater Application on Asphalt Shingled Roof
A submersible pump in a 55 gallon holding tank connected to a gutter system was used to
circulate water at a rate of 2.5 gallons per minute across the surface of the roof. The
level in the tank was tracked daily and makeup water added to compensate for
evaporation. Treated wastewater was applied continuously to wet the roof of a building
with an asphalt shingled roof at the Center for Green Roof Research to investigate the
effect on maximum surface temperatures and potential to reduce demand for air
conditioning (Fig.5.36).
Figure 5.37 compares the mean external roof temperature of buildings with green roofs to
a building with an asphalt shingled roof with treated wastewater application.
The mean surface temperature of green roof buildings (30oC) was significantly (p<0.05)
greater than the mean surface temperature of an asphalt shingled building (22oC) during
application of treated wastewater for the period September 20 to 26 from 10am to 6pm.
Note the increase in the asphalt shingled building’s temperature on day 3 (September 22)
86
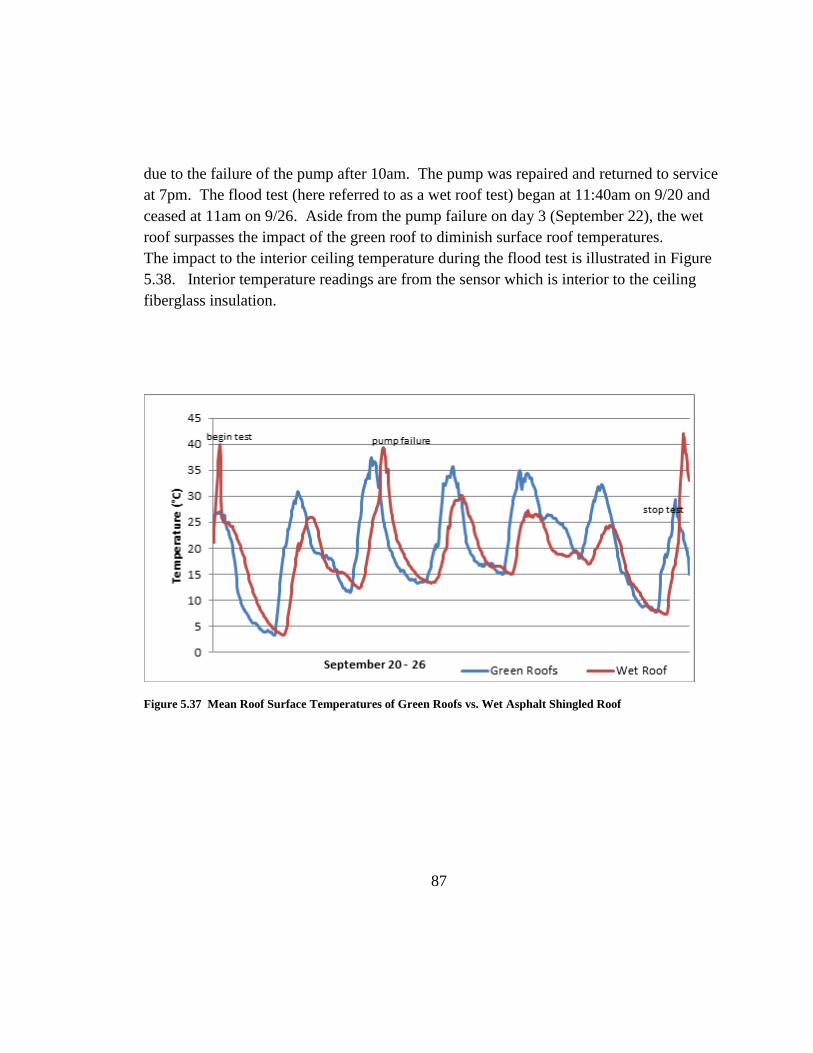
due to the failure of the pump after 10am. The pump was repaired and returned to service
at 7pm. The flood test (here referred to as a wet roof test) began at 11:40am on 9/20 and
ceased at 11am on 9/26. Aside from the pump failure on day 3 (September 22), the wet
roof surpasses the impact of the green roof to diminish surface roof temperatures.
The impact to the interior ceiling temperature during the flood test is illustrated in Figure
5.38. Interior temperature readings are from the sensor which is interior to the ceiling
fiberglass insulation.
Figure 5.37 Mean Roof Surface Temperatures of Green Roofs vs. Wet Asphalt Shingled Roof
87

Figure 5.38 Mean Inside Temperatures of Green Roofs vs. Wet Asphalt Shingled Roof
Figure 5.39 details the impact to temperature of the roof surface and inside roof locations
prior, during, and after application of water to the roof. Two additional days prior to the
application of water were added to the graph for the purpose of comparison. Note the
quick restoration of the elevated roof temperature for the asphalt shingled roof on 9/26
when application of treated wastewater is discontinued.
Figure 5.39 Impact of Water Application to Inside and Surface Temperatures of Asphalt Shingled Roof
88
Begin Flood Test End Flood Test

Figure 5.40 Energy Use of Building with Roof Water Application vs. No Water For Sept. 20-27
Examination of the energy use, for the period September 20 through 26 shows that
wetting of a shingled roof results in significant energy savings compared to a shingled
roof without water (Figure 5.40). Also of note is how quickly the energy use of each
building equalizes when the water application to one of the building ceases on September
26. When the data for the period during which the pump was not functioning is removed
for the three buildings, the flooded roof has an 11% reduction in energy use compared to
the control building with a traditional asphalt shingle roof. Reviewing the utility meter
data would suggest that a flooded roof is superior to a non-flooded roof for reducing
energy, but inferior to a green roof. The utility meter data further indicates that an IBF
on the south wall of a building with a green roof is superior in reducing energy use to a
building with only a green roof (up to 18%). However, there are indications that the
utility meters for buildings 2, 4, and 6 were not functioning correctly during the study.
Since the only use of power in each building is for the air conditioner, a Kill A Watt
meter can also be used to measure the amount of electricity used. Although slight, these
readings do differ from the utility meter readings. The wet roof still saves more energy
than the control roof. However, the green roof performs slightly worse than the Control
roof. Removing the data for the time period from when the pump failed from each of
the buildings’ energy usage, results in an even more decided benefit from the wet roof.
Also it should be noted that the temperature of the water sprayed on the roof, began at 550
F and within 3 hours the contents of the 55 gallon holding tank was at 850 F. This
collected heat energy could be used to supplement a hot water heater providing additional
energy savings.
89
0
0.5
1
1.5
2
2.5
3
3.5
Dai
ly E
ne
rgy
Use
(kW
h)
9/20-21 9/21-22 9/22-23 9/23-24 9/24-25 9/26-27
roof-no water roof-with water
Test Initiated Water Applied
Test Concluded No Water Applied

5.8 Summary of Energy Studies
Treated gray water, applied to various building facades, was demonstrated to reduce the
corresponding surface temperatures resulting in reduced energy demand for interior air
conditioning. Studies included the continuous or intermittent circulation of gray water
through an IBF positioned on the south wall of a building, gray water circulated to a
green roof, and gray water applied to an asphalt shingled roof.
IBF studies indicated significant temperature reductions to building facades for both
intermittent and continuous gray water flow. Mean exterior temperature reductions of
29% for the month of July, 39% for the month of August, and 42% for the month of
September were observed. Reductions of inside wall temperatures amounted to 13%,
10%, and 14% respectively. The median reduction in maximum internal south wall
temperatures of buildings with an IBF were 54% for intermittent flow and 56% for
continuous flow compared to maximum internal south wall temperatures for control
buildings with no IBF.
The decrease in internal south wall temperatures from the effect of an IBF consequently
decreases the demand for air conditioning resulting in less energy consumed. Energy
use data collected for more than a month (July 20-August 26) showed mean reductions of
15% when the IBF buildings were compared to buildings with no IBF. These significant
decreases in energy use may vary if an IBF were used with a different building
configuration. The south wall of the buildings in these studies account for 21% of the
total exposed surface area of each building. By comparison, the east and west sides each
account for 17% of the total, and the roof 18%. Also, the R-value of a building’s facade
impacts the heat flux to the interior conditioned spaces.
Peak temperatures observed on the exterior of the control building’s south wall coincided
with peak temperatures on the interior of the south wall typically within the 15 minute
span during which the data was collected. Buildings with an IBF and continuous
wastewater flow, demonstrate a significant time lag in recording the internal daily
maximum temperature versus the external maximum temperature. This phenomenon has
been observed with green roofs as well. The intermittent flow produced more variable
results, possibly due to the heating or cooling of the pooled water during non-flow
periods. This effect has possible ramifications for reducing energy use during peak use.
90

Although the application of gray water to a green roof showed a decrease in internal
temperatures, the impacts were negligible. Periodic rainfalls during the study period
provided sufficient moisture for green roof plants and the corresponding
evapotranspiration. The results do suggest that at times of extended dry periods or in
more arid regions, application of gray water would have a more significant impact on
reducing internal temperatures.
Applying gray water to a traditional roof offers the prospect of an inexpensive method to
significantly decrease a building’s energy demand for air conditioning. Reduction of roof
surface temperatures by 27% resulted from the application of treated gray water to an
asphalt shingled roof compared to the mean surface temperature of three green roofs.
Studies showed decreases of up to 11% in energy usage compared to a non-green roof
control building. There are many factors which can impact the actual energy reductions
realized, including meteorological factors, and building design. In total, the studies
demonstrate that wastewater applied to buildings’ exterior surfaces can provide energy
benefits. Combining an IBF on the south wall of a building to treat gray water with
subsequent spray application to a traditional roof could provide an inexpensive method to
obtain significant reduction in cooling demand.
An IBF and associated treated gray water were shown to have a significant effect on
decreasing both external and internal building façade temperatures. Temporal delays in
achieving the reduced peak temperatures suggest favorable implications for urban heat
island and peak power issues. Reductions in energy usage for air conditioning result from
the temperature reductions. Consequently, the IBF can convert wastewater into a water
resource. Contained in the appendices is a paper that details opportunities to incorporate
the IBF into a building’s architecture. Also contained in the appendices is a paper which
presents the major findings of this chapter and which will be presented at the 10th
Annual
Conference of Green Roofs for Healthy Cities and published in the proceedings.
91

6. SUMMARY AND CONCLUSIONS
6.1 Accomplishments of the research
An effective and inexpensive decentralized wastewater management system has been designed,
constructed, and operated. Further, this system comprised of integrated biofilters (IBF) has been
demonstrated to attenuate a wide range of pollutants in both black water and gray water. The
IBF accomplishes this with significantly less detention time and a much smaller footprint than
traditional methods. Constructed from materials that are plentiful worldwide, the IBF can serve
as an effective decentralized treatment system. The dissimilarities of graywater based on source
was also determined with surfactants and boron levels particularly elevated with washing
machine discharge while phosphates and fecal coliforms were present in shower waters.
The research has also demonstrated that an IBF can serve as functional architecture to convert
wastewater into a water resource at the site of generation. Studies determined that an IBF
positioned on the south wall of a building can reduce the internal energy demand for electricity
up to 18 %. Treating the water first with the IBF and then applying to a standard roof can
further reduce the temperature external to the ceiling insulation by 52% thereby decreasing
internal energy demand by 11%.
Unlike most traditional wastewater treatment systems, the IBF can intermittently circulate
wastewater with equal pollutant attenuation effects. Also, the research found that intermittent
circulation does not significantly alter the effectiveness of reducing internal energy demand.
This finding is especially important to applications in remote areas where reliable power is
lacking. A miniature water wheel operated by an individual operating a stationary bicycle a few
hours a day would be sufficient to attenuate pollutants.
The living column was an innovative design that enables the IBF to be custom designed to
attenuate specific pollutants. In some respects it is similar to column chromatography, with the
ability to extract materials in a wastewater stream based on physical/chemical properties (i.e.
cation exchange). This has the potential for application in treating specific industrial wastewater
discharges.
The individual components of the IBF (constructed wetlands, living wall, and living column)
were evaluated to determine the contribution of each in attenuating pollutants. In addition, the
effectiveness of an IBF without plants was also studied. The result indicates that the
effectiveness of the whole is greater than the sum of its parts. This is attributed to the variety of
microclimates that the various components provide and the corresponding diversity of microbial
communities.
92

In addition to the energy reduction benefit, the IBF’s wastewater management also served as a
resource in supplying nutrients for agricultural and landscaping crops.
Integration of biofilters into actual residential applications were developed, constructed, and
tested (Appendix E). Studies demonstrated that IBFs could provide effective and inexpensive,
functional and aesthetic architecture. A living window well that integrated a living wall with
constructed wetlands provided functional emergency basement egress combined with a use for
dehumidifier water discharge, building energy recoup, and a mini-greenhouse for home
occupants use. With no additional heat input, the living window well maintained a winter
temperature at or above 40 degrees Fahrenheit despite ambient temperatures in the single digits.
6.2 Implications of the results: Societal Impacts
The IBF has potential applications for one of the world’s most pressing issues: lack of
wastewater treatment that threatens potable water supplies and causes public health risks and
environmental degradation. Additionally, IBFs can enhance building energy use in emerging
and developed countries where rising demand is challenging dwindling fossil fuel supplies.
Managing wastewater as a resource rather than a waste, offers the opportunity to forego
expensive centralized treatment in lieu of technologies that recoup nutrients and energy at the
site of generation.
6.2.1 Avoided Costs
6.2.1.1Wastewater Treatment
In the USA, it is estimated that 33 billion gallons of wastewater are treated annually at a cost of
approximately $25 billion. Other estimates place average treatment costs at about a dollar per
hundred gallons (Mankiewicz et al). Regardless of the actual cost, it is a major expense for
society. Further the cost to upgrade and repair the USA’s crumbling wastewater infrastructure
(collection pipelines and treatment plants) is estimated to be over a trillion dollars. A family of
four is expected to generate over 120,000 gallons of wastewater per year. Although the annual
bill the average American family receives for this service is less than a $1,000, the cost to society
from hidden fees is much greater. Utilizing wastewater as a resource enables the true treatment
costs to be avoided. Further, integration of an IBF can provide treated gray water which could
be used to offset the more than 50% of potable drinking water annually used by homeowners to
water landscapes. This is particularly important as climate change and population growth
diminish water resources.
93
For the approximate 25% of the US population that use on lot septic systems, an IBF has the
potential to manage their wastewater as a resource. Large volumes of wastewater with low
concentrations of pollutants characterize graywater discharges from modern home showers,
baths, and clothes washers. This gray water discharged to a septic tank adversely impacts its
ability to function properly and contributes to system failures from drain field malfunctions.
Separating specific gray water flows from other household discharges would enable septic
systems to operate more effectively, and provide homeowners an opportunity to utilize the bulk
of their wastewater as a resource. Such diverted graywater could be processed through an IBF
and then at minimum, used during growing seasons for landscape application.
Unfortunately, most water and sewer utilities in the USA base sewer charges on the consumption
of drinking water, not the amount of sewage that is discharged (since the former can be readily
metered). Consequently, decreases in wastewater discharge from a residence, often will not
correspond to decreases in usage fees. However, reduction in flows could eliminate the need to
expand a facility thereby saving customers.
6.2.1.2 Energy Use Reduction
The use of air conditioning is increasing rapidly throughout the world. In the 34 member
countries(including the US) of the Organisation for Economic Co-operation and Development
(OECD) almost 46% of the houses have air conditioning and this level is increasing by 7%
annually (Santamouris). The use of air conditioning in the service sector is estimated to be
nearly 100% in Japan, 63% in the US, and 27% in Europe (Waide). During heat waves, the
increased energy demand taxes utility systems and threatens widespread blackouts.
Pre-WWII buildings, especially in southern regions of the US, often lack any insulation in wall
cavities. Application of IBFs on walls can reduce internal building temperatures and decrease
energy consumption of air conditioning. The described studies demonstrated energy use
reductions for cooling up to 18% in central Pennsylvania. Meteorological conditions, R-value of
walls, and directional orientation of walls will impact the amount of reductions on a daily and
seasonal basis.
Combined with other passive cooling techniques, biofilters such as the IBF and green roofs can
minimize the need for air conditioning. As described in Chapter 6, application of treated gray
water on a conventional roof can reduce the temperatures external to the ceiling insulation by
52% resulting in decreased internal temperatures and subsequent diminished energy use for
cooling.
94
6.2.2Urban Heat Island Effect and Peak Power
The urban heat island effect results from the positive heat balance that occurs in densely built
urban environments. This creates a temperature differential between cities and the surrounding
countryside that may exceed 10 degrees Celsius (Santamouris 2001). These elevated ambient
temperatures in urban areas coupled with heat waves can cause life threatening conditions for
those most vulnerable (often the elderly or the very young). During the 2003 heat waves in
Europe, more than 30,000 deaths were attributed to the elevated temperatures. Studies by
Michelozzi et al revealed those populations with low socio-economic status, living in buildings
with insufficient heat protection and ventilation suffered the greatest mortalities. Similar trends
occurred during the Chicago killer heat wave of 1995. Klinenberg noted some of the elderly
victims had air conditioning but did not use it for fear of being unable to pay the utility bills.
Akbari et al found that a 1o Celsius increase in temperature in cities like Los Angeles increases
electrical demand by almost 540 megawatts (MW). Compensating for the urban heat island
effect requires 3 to 8 percent of the current urban electricity demand at a cost of over $1billion
annually.
Biofilters such as the IBF and living roofs provides temperature modification at both the interior
and exterior roof surfaces by complex heat and mass transfer processes resulting in a damping of
temperature fluctuations (Liu 2004). The basic concept is that by providing additional layers on
top of the roof or a wall, the insulation value or thermal resistance (R-value) will increase. Also,
accelerated evapotranspiration occurring at the plant layer, provide a cooling effect on the
surface area. Vegetation further reduces the radiation absorbed by the building surface. The
various processes associated with biofilters are able to modify temperatures, diminish urban heat
island effect and peak power demand. Evapotranspiration is a powerful force to redistribute
energy. The evaporation of 6mm of water over a one hectare field is the energy equivalent of
approximately 15 tons of dynamite (Mankiewicz and Simon 2007). Evaporation is an
endothermic reaction, meaning a system absorbs energy during a phase change such as water
moving from a liquid phase to a gas. The studies described herein attest to the ability of water
(wastewater) to be utilized for reducing the temperature of a building’s envelope whether used in
concert with an IBF, green roof, or applied to an asphalt shingle roof. Also, the studies
demonstrated the ability for these applications to modify and extend the time for maximum
temperature (albeit much reduced) to occur inside a building.
Avoidance of energy use is an important contribution from deploying biofilters as functional
architecture. This research detailed the specific reductions in energy use realized from the
various applications with the test buildings. Beyond the benefit of decreases in building external
95

and internal temperatures and resulting cost savings from decreased utility bills, there is also the
avoidance of environmental degradation. Less energy used translates to decreased energy
demand on the grid and also from air conditioner emissions. By definition, a 1 ton air
conditioner removes 12,000 Btu of heat from inside of a building per hour. That 12,000 Btu of
heat is discharged to the environment. In urban areas, the composite discharge of air
conditioners is a contributor to the increased ambient temperatures. Reduced demand for air
conditioning reduces the heat discharged to the environment. Alternatively, applying wastewater
to a non-living roof can extract heat energy to augment a building’s hot water heater. In less
than 3 hours of application to the roof, the 50 gallon of water in the holding tank used for the wet
roof study increased from 55 degrees F to 84 degrees F. Extracting the energy from this water
could further offset energy use in a building and the associated impacts.
6.2.3 Role of Evapotranspiration in Creating Net Zero Discharge
In addition to providing cooling of buildings, evapotranspiration has another benefit for
wastewater management.
Gray water treatment and reuse is regulated at the state and/or local level throughout the USA.
Currently, there exists a wide range in these programs. States in the south west where droughts
are more frequent, are particularly favorable to gray water treatment and reuse. On the opposite
end of the spectrum are states such as Pennsylvania that regulates gray water as black water. For
states such as Pennsylvania, wastewater treatment systems that have a net zero discharge are
preferred. Consequently, if a gray water stream can be eliminated through evapotranspiration,
the regulatory hurdles would be greatly diminished.
Water loss through evaporative processes was measured for the various studies. Meteorological
conditions such as humidity, wind velocity, ambient temperature, and solar radiation impact the
rate of evaporation. Further, the rate of evapotranspiration is also affected by leaf surface area,
season, plant coverage, and plant health. The maximum rate observed was 1 gallon per square
96

foot of biofilter/day with rates of 0.5 gallon typically measured. The biofilters (IBF and green
roof) were not designed to optimize evapotranspiration rates. Modifications such as the
inclusion of a large percentage of plants possessing leaves with large surface areas (i.e. Canna
sp., Colocasia) would enhance this process. Also, in temperate climates such as central
Pennsylvania, a greenhouse or similar structure with artificial lighting would be necessary during
the non-growing season to optimize evapotranspiration. For small wastewater flows (less than
5,000 gallons per day), IBF systems housed in an enclosure could be designed to produce a zero
discharge.
6.2.4 Agricultural Applications
6.2.4.1 Urban Gardening: Cultivating Crops in IBFs Using Graywater
In past centuries, cities had easy access to farms whose products were transported from short
distances to supply the urban market. That model has changed and today produce is transported
to urban markets from around the world. In addition, many urban areas now have food deserts
from the lack of fresh produce purveyors.
The concentrated population and resulting abundance of nutrient laden wastewater provides an
opportunity to transform food deserts with urban farms. Many areas of the world currently use
untreated wastewater to irrigate their crops. While not advisable due to the potential risk of
pathogens, the logic of using the wastewater as a nutrient resource for crops is sound. Better to
harness this resource, than manage it as a waste.
Studies conducted for this research demonstrated the viability of using IBFs in conjunction with
wastewater to produce a range of produce while attenuating pollutants including fecal coliforms.
Gray water and black water contain a range of macro and micro nutrients necessary for plant
growth. Plants require a certain ratio of specific nutrients: typically a ratio of C: N: P of 100:5:1
is suitable for most biological treatment systems including biofilters. Nutrient levels are also
important to the microbial population of these systems. Although, crops vary as to their specific
nutrient requirements, when used in conjunction with an IBF no adverse effects were observed.
6.2.4.2 Health Considerations
Issues do remain however, regarding the safety of even gray water for use in food crops. Rose et
al. inoculated gray water systems with pathogenic bacteria and viruses and found that some
persisted for several days. The USEPA is currently developing gray water reuse guidelines and
97

agency representatives have expressed concerns regarding the use of untreated gray water on
food crops. Additional studies are needed to determine if pathogens can survive in an IBF and
be incorporated into fruits.
6.2.4.3 Applications for Education Programs
The IBF has the potential to be incorporated into school curricula as a “hands on” demonstration
for a wide array of science and engineering concepts. In addition, school agricultural programs
could utilize the system for educating students especially in urban areas about vertical gardening
and growing crops. A system set up in a school cafeteria to treat liquid wastes from drinks could
provide students a daily example of transforming a waste stream into a resource.
On numerous occasions, as part of this research, school groups across the US and Canada
including elementary, middle school, high school, and university students were instructed on the
building of an IBF for various applications. In all instances construction of a unit sized to treat
residential graywater flow was completed in less than one day using locally available materials
obtained at a nominal cost. In addition to providing an opportunity to discuss various
environmental concepts with the students during construction, the completed IBFs provided a
living laboratory at each school. Further with program such as agriculture education, IBFs
could be integrated with aquaculture systems (common in many programs) to treat the associated
wastewater.
6.2.5 Disaster Relief
Today, major natural disasters seem almost commonplace. Major earthquakes, tsunamis, floods,
tornadoes, and hurricanes seem to occur with increasing frequency and devastate the affect area’s
infrastructure. Too often people survive the natural disaster, only to fall victim to disease caused
by the lack of adequate sanitation, potable water, and food. Often the best of intentions have
adverse unintended consequences. In Haiti, aid organizations have set up traditional “port-a-
potties” to provide sanitary facilities and help reduce the spread of cholera. However, the
contents of the quickly filled units are dumped untreated at a local landfill where residents
scavenge and nearby communities are put at risk. A treatment system such as the IBF that can
be easily constructed with local materials could provide a sustainable alternative.
98

6.3 Limitations and Future Research
Regulatory hurdles are a principal limitation to the incorporation of IBFs as functional
architecture to convert wastewater into a water resource. However, an increasing realization that
our current system of managing wastewater is not sustainable is moving regulators to consider
alternatives. In the USA, public attitudes about wastewater limit applications. Education is
crucial to making the public aware of the potential resource that wastewater represents.
Additional research is needed to fully investigate the potential for pathogenic viruses and
bacteria to persist in biofilters and ultimately end up in our food. Also of critical importance is
the need to delineate the existence of pharmaceutical compounds and by-products, endocrine
disrupters, and other micro-organics that may persist after traditional treatment. Research on
the ability of integrated biofilters to attenuate these compounds is also of utmost importance.
Further investigations with the living column could provide profiles of specific component layers
that will optimize removal of particular compounds such as phosphates. Also, the inclusion of
certain plant species as hyperaccumulators could target specific compounds.
Delineation of the microbial communities and related functions in attenuating pollutants would
provide excellent insight into the operation of the IBF and clues as to how the system could be
further improved.
99

REFERENCES CITED
Akbari, J., Davis, S. Dorsano, S., Huang, J. and S. Winett, Cooling our Communities: a
Guidebook on Tree Planting and Light Colored Surfacing, USEPA, Office of Policy Analysis,
Climate Change Division, and Wash.D.C. 1992
Antonopoulos, K.A., And E.P. Koronaki. 2000. Thermal Parameter Components Of Building
Envelope. Applied Thermal Engineering. 20(2000):1193-1211.
Armstrong, E.L., ed., History of Public Works in the United States: 1776-1976
(Chicago: American Public Works Association, 1976).
Aquacraft, Inc. and American Water Works Association Research Foundation. AWWARF
Residential End Uses of Water study. 1999
Bailey, P.J., G. Cousins, G.A. Snow, and A.J. White, Boron- Containing Antibacterial Agents:
Effects on Growth and Morphology of Bacteria Under Various Culture Conditions,
Antimicrobial Agents and Chemotherapy,Vol.17, No.4, pg.549-553, Apr. 1980,
Bell, H., And G. Spolek. Measured Energy Performance Of Greenroofs. Proceedings Of The
Seventh Annual Greening Rooftops For Sustainable Communities Conference, 2009.
Berghage, R.D., A.Jarrett, D. Beattie, K. Kelley, S.Husain, F. Rezai, B. Long, A. Negassi,
R.Cameron And W.Hunt. Quantifying Evaporation And Transpirational Water Losses From
Green Roofs And Green Roof Media Capacity For Neutralizing Acid Rain, National
Decentralized Water Resources Capacity Development Project (Ndwrcp) Research Project,
2007.
Berghage,R.d., Beattie, A. Jarett,T. and O’Connor., Greenroof runoff water quality. In
Proceeding of Greening rooftops for sustainable communities, Minneapolis, MN. 2007.
Berghage, R.D., A. Wolf, C. Miller., Testing Green Roof Media for Media Content. In
Proceedings of Greening Rooftops for Sustainable Communities. Baltimore. Session 3.4:
Growing Media for Nutrient Content, 2008.
Brdlik, P.M., And B. S. Mezhevnikov, Variable Thermal Conditions For Flooded Roofs, Journal
Of Engineering Physics And Thermophysics ; Volume 8, Number 2, 179-182, Doi:
10.1007/Bf00829064; 1965
100

Bruce, F.E., “Water Supply and Waste Disposal,” in T.I. Williams, ed., A History of
Technology, Volume II: The Twentieth Century c. 1900 to c.1950 Part II (Oxford:
Clarendon Press, 1982).
Burian, SJ, Nix SJ, Pitt RE, and Durrans SR; 2000 Urban Wastewater Management in the
United States: Past Present, and Future; J. of Urban Technology, Vol 7, Number 3, pgs. 33-62.
Butterwick,L., Nicolaas de Oude, and Karen Raymond, Safety Assessments of Boron in Aquatic
and Terrestrial Environments, Ecotoxicology and Environmental Safety, vol. 17, Issue 3, pgs.
339-371 June 1989.
Calheiros, C., et al. 2009. Substrate Effect on Bacterial Communities from Constructed Wetlands
Planted with Typha latifolia Treating Industrial Wastewater. Ecol. Eng. 35, pg.744-753.
Carleton, M.G., 1990, Comparison of Overflows from Separate and Combined Sewers:
Quantity and Quality, Water Science and Technology 22 (October ) 31-38.
Carr,R.W., S.G. Walesh, and D. York, 2000,Micromanagement of Stormwater for Wet
Weather Control, Watershed & Wet Weather Technical Bulletin 5 (January)
Casanova,L.M., V. Little, R.J. Frye, and C.P.Gerba, A Survey of the Microbial Quality of
Recycled Household Graywater, Journal of the American Water Resources Association, vol. 37,
no.5, Oct. 2001
CCSP, The Effects of Climate Change on Agriculture, Land Resources, Water Resources, and
Biodiversity in the United States, 2008.
Chaillou,K., C. Gerente, Y. Andres, D. Wolbert, Bathroom Greywater Characterization and
Potential Treatments for Reuse, Water Air Soil Pollution, 215: 31-42, 2011
.
Chapin,FS, Matson,PA, Mooney,HA 2002, Principles of Terrestrial Ecosystem Ecology,Springer
Science+Business Media,New York
Chen, J.M., B.J. Yang, And R.H. Zhang. 1989. Soil Thermal Emissivity As Affected By Its
Water Content And Surface Treatment. Soil Science. 148(6): 433-435.
Chiemchaisri,C., et al. 2009. Leachate Treatment and Greenhouse Gas Emission in Subsurface
Horizontal Flow Constructed Wetland. Bioresource Tech. 100, 3808-3814.
Crites,R. and G. Tchobanoglous,1998, Small and Decentralized Wastewater Management
Systems (New York: McGraw-Hill Companies, Inc.).
Crook,J., D.K. Ammerman, D.A. Okun, and R.L. Matthews,1992, Guidelines for Water
Reuse, EPA-625/R-92-004 (Washington, D.C.: U.S. Environmental Protection Agency).
101
DeBusk,William F.,1999, Wastewater Treatment Wetlands: Contaminant Removal Processes;
SL155, Soil & Water Science Department, Florida Coop. Extension Service, Institute of Food
and Agricultural Sciences. U. of Fla.
Del Bario, E.P. 1998. Analysis Of The Green Roofs Cooling Potential In Buildings. Energy And
Buildings. 27(2):179-193.
DeFilippi,S.A., and C.S. Shih, 1971,Characteristics of Separated Storm and Combined
Sewer Flows, Journal of the Water Pollution Control Federation 43 (October) 2033-2058.
Denardo, J.C., A.R. Jarrett, H.B. Manbeck, D.J.Beattie, And R.D. Berghage. Stormwater
Mitigation And Surface Temperature Reduction By Green Roofs. Transactions Of Asae 48(4):
1491-1496. 2005
Denardo, J.C., “Green Roof Mitigation Of Stormwater And Energy Usage”, M.S. Thesis, Dept.
Of Hoticulture, The Pennsylvania State University, State College,Pa.2003.
Dodson,R.D.,1995, Storm Water Pollution Control: Industry & Construction NPDES
Compliance (New York: McGraw-Hill, Inc.).
Drizo,A.,C.A. Frost, K.A. Smith, and J. Grace, Phosphate and ammonium removal by
constructed wetlands with horizontal subsurface flow, using shale as a substrate, Water Science
and Technology, vol. 35, issue 5, pg. 95-102, Wetland Systems for Water Pollution Control
1996, Selected Proceedings of the 5th International Conference on Wetland Systems for Water
Pollution Control, 1997
Duffy, J, A History of Public Health in New York City 1625-1866, New York: Russell Sage
Foundation, 1968
Dunbabin, Janet S., and Kathleen H. Bowmer, Potential use of constructed wetlands for
treatment of industrial wastewaters containing metals, Science of the Total Environment, vol.
111, isues 2-3, pgs. 151-168, Jan. 1992
Dworsky,L.B., and B.B. Berger,1979, “Water Resources Planning and Public Health: 1776-
1976,” ASCE Journal of the Water Resources Planning and Management Division
105 (March) 133-149.
Gersberg,RM, Gearheart,RA, Ives,M 1989. Pathogen Removal in Constructed Wetlands.
Constructed Wetlands for Wastewater Treatment: Municipal, Industrial, and Agricultural. P.
431-445.Lewis Publishers, Chelsea, Michigan
102
Gregoire,B.G. and John C. Clausen. 2011. Effect of a modular green roof on stormwater runoff
and water quality, Ecological Engineering 37 (2011) 963-969
Guan,B., et al. 2009. Phosphorus Removal Ability of Three Inexpensive Substrates:
Physicochemical Properties and Application. Ecol. Eng. Vol.35,no.4,pp.576-581. Apr.
Hay,H. , A Passive Heating And Cooling System From Concept To Commercialisation,
Proceedings Of The Annual Meeting Of The American Section Of The International Solar
Energy Society,1978.
Heaney,J.P., L. Wright, D. Sample, R. Pitt, R. Field, and C.-Y. Fan, 1999, Innovative Wet-
Weather Flow Collection/Control/Treatment Systems for Newly Urbanizing Areas
in the 21st Century, in A.C. Rowney, P. Stahre, and L.A. Roesner, eds., Sustaining
Urban Water Resources in the 21st Century, Proceedings of an Engineering
Foundation Conference (New York: ASCE).
Hey,D.L., and W.H. Waggy, 1979,Planning for Water Quality: 1776 to 1976, ASCE
Journal of the Water Resources Planning and Management Division 105 (March) 121-131.
House,M.A., J.B. Ellis, E.E. Herricks, T. Hvitved-Jacobsen, J. Seager, L. Lijklema,
H. Aalderink, and I.T. Clifforde, 1993,Urban Drainage: Impacts on Receiving Water
Quality, Water Science and Technology 27 (December) 117-158.
Intergovernmental Panel on Climate Change, 2007, epa.gov/climatechange/effects/extreme
Jackson,L.M. and J.E. Myers; 2002, Evaluation of Subsurface Flow Wetlands vs. Free-water
Surface Wetlands treating NPR-3 Produced Water-Year No. 2. Prepared for the US Dept. of
Energy/Rocky Mtn. Oilfield Testing Center No. 2001-001; DOERMOTC-020144
Jarrett,A.R. ,J.C. Denardo, H.B. Manbeck, J.M.Hamlett, D.J. Beattie, And R.R. Berghage. Green
Roofs: A Stormwater Lid. Asae Paper No. Nabec 04-0015.2004
Jarrett,A.R., W.F. Hunt, R.D. Berghage. Annual And Individual-Storm Green Roof Stormwater
Response Models. Asabe Annual International Meeting , 2006.
Jokerst,A.W., L.A. Roesner, S.E. Sharvelle, An Evaluation of Graywater Reuse Utilizing a
Wetland Treatment System, Proceedings of World Environmental and Water Congress, vol.
342,pg 1-10, 2009.
Jung,D. , A. Cho, Y. Zo, S. Choi, and T. Ahn. 2009. Nutrient Removal from Polluted Stream
Water by Artificial Aquatic Food Web System. Hydrobiologia 630: 149-159.
Kaufman,H.L., and F.-H. Lai, 1978,Conventional and Advanced Sewer Design Concepts,
EPA-600/78-090 (Cincinnati,USEPA)
103

Klinenberg,E., Heat Wave: A Social Autopsy of Disaster in Chicago, University of Chicago
Press, Chicago, 2002.
Knud-Hansen, C. ,Historical Perspective of the Phosphate Detergent Conflict, Working Paper
94-95, Natural Resources and Environmental Policy Seminar of the University of Colorado
Interdisciplinary Graduate Certificate Program in Environmental Policy February 1994
Lai,Derrick Y.F.,and K.Lam. 2009. Phosphorus sorption by Sediments in a Subtropical
Constructed Wetland Receiving Stormwater Runoff. Ecological Engineering 35; 735-743.
Lazzarin, R.M., Castelloti,F., Andn Busato,F., Experimental Measurements And Numerical
Modeling Of A Green Roof, Energy And Buildings 37:1260-1267, 2005.
Liu,K. Engineering Performance of Rooftop Gardens through Field Evaluation. National
Research Council Canada: Institute for Research in Construction. 2003.
Maltais-Landry,G. et al, 2008. Effect of Artificial Aeration and Macrophyte Species on Nitrogen
Cycling and Gas Flux in Constructed Wetlands. Ecol. Eng. Vol. 35, issue 2, pgs. 221-229. Feb.
Marlatt,W., K. Murray, And S. Squier, Installation, Operation, And Maintenance Experiences
With Roof Pond Systems, Proceedings Of The 9th
National Passive Solar Conference, American
Solar Energy Society, Usa, 69-74, 1984.
Mankiewicz,P.S. and D.B. Simon, Integrating Stormwater and Greywater Treatment for Thermal
Regulation and the Enhancement of Biological Diversity: Using Mass Balance of Water As A
Design Criteria, Proceedings of the Fifth Annual Greening Rooftops for Sustainable
Communities Conference, 2007
Mayer, P.W. et al, 1999. Residential End Uses of Water. AwwaRF and AWWA,Denver.
Melosi,M.V.,1980, Environmental Crisis in the City: The Relationship Between
Industrialization and Urban Pollution, in M.V. Melosi, ed., Pollution and Reform
in American Cities, 1870-1930 (Austin: University of Texas Press)
Melosi,M.V.,1996, Sanitary Engineers in American Cities: Changing Roles from the Age
of Miasmas to the Age of Ecology, in Civil Engineering History: Engineers Make
History, Proceedings of the First National Symposium on Civil Engineering History
(New York: ASCE)
Metcalf,L. and H.P. Eddy, American Sewerage Practice: Volume I, Design of Sewers
(New York: McGraw-Hill Book Company, Inc., 1928).
Metcalf & Eddy, Inc., Wastewater Engineering: Treatment, Disposal, and Reuse,
third edition (New York: McGraw-Hill, Inc., 1991).
104
Moffa,P.E., ed., Control and Treatment of Combined Sewer Overflows (New York:
Van Nostrand Reinhold, 1997).
Moran, A., W. Hunt, G. Jennings 2003. A North Carolina Field Study To Evaluate Greenroof
Runoff Quantity, Runoff Quality, And Plant Growth. Proceedings Of The 2003 Ewri
Conference, Philadelphia Pennsylvania.
Mungur, A.S., R.B.E. Shutes, D.M. Revitt, and M.A. House, An assessment of metal removal
from highway runoff by a natural wetland, Water Science and Technology, vol. 32, issue 3, pgs
169-175, Wetland Systems for Water Pollution Control 1994, Selected Proceedings of the
4tInternational Conference on Wetland Systems for Water Pollution Control, 1995
Mungur,A.S., R. B.E. Shutes, D.M. Revitt, and M.A. House ,An assessment of metal removal by
a laboratory scale wetland, Water Science and Technology, vol 35, issue 5, pgs. 125-133,
Wetland Systems for Water Pollution Control 1996, Selected Proceedings of the 5th
International Conference on Wetland Systems for Water Pollution Control, 1997
National Air & Space Administration, 2011, http//earthobservatory.nasa.gov/
Niachaou, A., K. Papakonstantinou, M. Santamouris, A. Tsangrassoulis, And G. Mihalakakou.
2001. Analysis Of The Green Roof Thermal Properties And Investigation Of Its Energy
Performance. Energy And Buildings. 33(7):719-729.
Onmura,S.,M. Matsumoto, And S. Hokoi., Study On Evaporative Cooling Effect Of Roof Lawn
Gardens, Energy And Buildings 33 653-666, 2001
Peterson, J.A. “The Impact of Sanitary Reform Upon American Urban Planning 1840-1890”,
Journal of Social History 70, 23-52, 1980.
Reed, S 2002, Onsite Wastewater Treatment Systems Manual, EPA/625/R-00/008, Office of
Water Office of Research and Development, USEPA
Retzlaff,W., Ebbs,S, Alsup,S, Morgan,s, Woods,E, Jost,V, and Luckett,K, 2008, What is That
Running Off Of My Green Roof? Proceedings of the Sixth Annual Greening Rooftops for
Sustainable Communities Conference.
Rezaei, F., Evapotranspiration Rates From Extensive Green Roof Plant Species, M.S. Thesis,
Agricultural And Biological Engineering, Pennsylvania State University,State College, Pa. 2005.
Robbins,J.H. 2005. Understanding Alternative Technologies for Animal Waste Treatment;
Waterkeeper Alliance,Tarrytown, New York.
105

Ronkanen,A.K. and B. Klove. 2009. Long-term Phosphorus and Nitrogen Removal Process and
Preferential Flow Paths in Norther Constructed Peatlands. Ecological Engineering 35, 843-855.
Rose,J.B., G.S. Sun, C.P. Gerba, N.A. Sinclair, Microbial Quality and Persistence of Enteric
Pathogens in Graywater from Various Household Sources, Water research WATRAG, Vol. 25,
no.1, pg 37-42, 1991
Rosenberg, C.E., The Cholera Years (Chicago: The University of Chicago Press), 1962.
Santamouris,M., Heat Island Research in Europe: the State of the Art, Journal of Advances in
Building Energy Research (ABER), vol 1, pg. 123-150, 2007.
Santamouris,M., Papanikolaou,N., Livada,I., Koronakis,I., Georgakis, C. and
Assimakaopoulos,D.N., On the Impact of Urban Climate on the Energy Consumption of
Buildings, Solar Energy, vol 70, no 3, pg. 201-216, 2001.
Schultz,S.K., and C. McShane,1977, To Engineer the Metropolis: Sewers, Sanitation, and City
Planning in Late 19th
Century America, The Journal of American History 65 (1977) 389-411.
Scott, Matthew J. and Malcolm N. Jones, The biodegradation of surfactants in the environment,
Biochimica et Biophysica Acta (BBA) - Biomembranes;Volume 1508, Issues 1-2, Pages 235-
251;Detergents in Biomembrane Studies, November 2000
Shuhui,G., Z. Ning, Z. Yanqiu., New Ways for Nitrogen Removal- Anaerobic Ammonium
Oxidation. Environ. Sci. Management vol 34, no. 4, pp. 98-101. Apr.2009
Smulders, E., von Rybinski, W., Sung, E., R hse, W., Steber, J., Wiebel, F. and Nordskog, A.,
Laundry Detergents. Ullmann's Encyclopedia of Industrial Chemistry. by Wiley-VCH Verlag
GmbH & Co. KGaA, 2007
Snodgrass,EC & Snodgrass, LL , Green Roof Plants A Resource and Planting Guide, Timber
Press, Portland, Oregon, 2006
Sonne,J., Evaluating Green Roof Energy Performance., Ashare Journal, Pg.59-61., Feb. 2006
Stecher, M.C., R.W. Weaver, K.J.McInnes, Sizing of a subsurface flow constructed wetland for
onsite domestic wastewater treatment; Pp. 538-546 in On-Site Wastewater Treatment, Proc.
Ninth National Symp. on Individual and Small Community Sewage Systems,11-14 March 2001.
Tao, W., J. Wang. 2009. Effects of Vegetation, Limestone, and Aeration on Nitritation,
Anammox, and Denitrification in Wetland Treatment Systems. Ecol. Eng. 35, 836-842.
Tarr,J.A.,1984, The Separate vs. Combined Sewer Problem: A Case Study in Urban
Technology Design Choice, Journal of Urban History 5 (May) 308-339.
106

Tarr,J.A., J. McCurley, F.C. McMichael, and T. Yosie,1984, Water and Wastes: A
Retrospective Assessment of Wastewater Technology in the United States, 1800-
1932, Technology and Culture 25 (February) 226-263.
Tarr,J.A., and F.C. McMichael, 1977,Historic Turning Points in Municipal Water Supply
and Wastewater Disposal, 1850-1932, ASCE Civil Engineering 47 (October) 82-86.
USEPA, Drinking Water Standards, www.epa.gov/ogwdw000/mcl.html
USEPA, epa.gov/waterinfrastructure/infrastructuregap.html
USEPA , www.epa.gov/watersense/pubs/outdoor.html
United States Environmental Protection Agency, 1998, National Water Quality Inventory,
1996 Report to Congress, EPA-841/R-97-008 (Washington, D.C.: U.S. Environmental
Protection Agency)
United States Environmental Protection Agency, 1997,Response to Congress on Use of
Decentralized Wastewater Treatment Systems, EPA-832-R-97-001b (Washington,
D.C.: U.S. Environmental Protection Agency).
United States Environmental Protection Agency, 1996,Seminar Publication—National
Conference on Sanitary Sewer Overflows,” EPA-625/R-96-007 (Washington, D.C.:
U.S. Environmental Protection Agency).
USEPA ( 1988 ) Phosphorus: Water Quality Standards Criteria Summaries: A Compilation of
State/Federal Criteria, EPA 440588012
USEPA (2002). Onsite Wastewater Treatment Systems Manual. Office of Water; EPA/625/R-
00/008.
USEPA (2002b). Wastewater Technology Fact Sheet: Facultative Lagoons. U.S. Environmental
Protection Agency. Retrieved from http://www.epa.gov/OW-OWM.html/mtb/faclagon.pdf.
USEPA (1992). Statistical Support Document for the 40 CFR, Part 503: Final Standards for the
Use or Disposal of Sewage Sludge. Volumes I and II. Final Report, Engineering and Analysis
Division,Office of Science and Technology, U.S. Environmental Protection Agency. Nov 1992.
USEPA 2008. Drinking Water Health Advisory for Boron and Compounds. Prepared by Health
and Ecological Criteria Division (HECD), Office of Science and Technology (OST), Office of
Water (OW) for Office of Groundwater/Drinking Water (OGWDW), OW, U.S. EPA.
Zhang,Chong-Bang, Effects of plant diversity on microbial biomass and community metabolic
profiles in a full-scale constructed wetland, Ecological Engineering 36, 62–68, 2010
107

Urban Wastewater Management in the United States: Past, Present, and Future 61
NRC (2002). Biosolids Applied to Land: Advancing Standards and Practices. Report by the
National Research Council. Washington, DC: National Academy Press. July.
Van Setters T., Rocha L, MacMillan G, 2007 Evaluation of the runoff quantity and quality
performance of an extensive green roof in Toronto, Ontario. In: Proc. Greening Rooftops for
Sustainable Communities, Minneapolis, MN.
Velasco,Paulo Cesar Tabares, J.Srebric, And R.D. Berghage. Thermal Performance Of A
Lightweight Tray For The Green Roof Growing Media. Proceedings Of The Greening Rooftops
For Sustainable Communities Conference 2007.
Velasco,Paulo Cesar Tabares, And J.Srebric. Heat Fluxes And Water Management Of A Green
And Brown Roof: Laboratory Experiments. Proceedings Of The Greening Rooftops For
Sustainable Communities Conference 2009.
Warne,M.St.J. and A.D. Schifko, Toxicity of Laundry Detergent Components to A Freshwater
Cladoceran and their Contribution to Detergent Toxicity; Ecotoxicology and Environmental
Safety, vol.44, issue 2, pgs. 196-206, Oct. 1999
WHO/UNICEF JMP, 2004, www.waterindustry.org/Water-Facts/world-water-6.htm
WHO/UNICEF, 2010, Progress on Sanitation and Drinking Water, ISBN 9789241563956
Wolverton,BC,&Harrison,D.D. 1973. Aquatic Plants for removal of mevinphos from the aquatic
environment, J. MS Acad. Sci. 19:84-88
Wolverton, BC,& McDonald,RC, 1980, Vascular Plants for Water Pollution Control and
Renewable Sources of Energy, Proceedings: Bio-Energy ’80 World Congress and Exposition,
NAS 1.15:87554, NASA-TM-87554
Wong,N.H., D.K.W. Cheong, H. Yan, J. Soh, C.L. Ong, And A. Sia; The Effects Of Rooftop
Garden On Energy Consumption Of A Commerical Building In Singapore, Energy And
Buildings 35(4): 353-364, 2003.
108

APPENDIX A
WASTEWATER ANALYSIS REPORTS FROM PSU AG. ANALYTICAL LABORATORY
Analysis Report For: Copy To:
Bob Cameron
PSU Horticulture Dept.
103 Tyson Bldg
University Park PA 16802
IBF/Inter 9/1 11:45
Centre
W03469
9/8/2010
9/1/2010
Research
LAB ID: REPORT DATE:SAMPLE ID: DATE SAMPLED SAMPLE TYPE INTENDED USE
COUNTY
WATER ANALYSIS
Irrigation Water Report (WH02)
Analysis Result Units Normal Range Upper Limit
pH 7.9 6.0
to 7.5 -
Total Alkalinity as CaCO3 230.8 mg/L 80 -100 -
Bicarbonates (HCO3) 281.5 mg/L 80 -100 -
Carbonates (CO3) 0.0 mg/L -
Hardness as CaCO3 356.2 mg/L < 150 -
Electrical Conductivity (EC) 0.64 mmhos/cm -3 -5
Total Dissolved Solids (TDS) 407.6 mg/L --
Fertilizer-Nitrogen (N) 1.49 mg/L 50 -150 -
Nitrate-Nitrogen (NO3-N) < 0.50 mg/L 50 -100 -
Ammonium-Nitrogen (NH4-N) < 0.99 mg/L 0 -75 100
Phosphorus (P) 0.52 mg/L 10 -50 -
Potassium (K) 4.98 mg/L < 200 -
Calcium (Ca) 94.25 mg/L > 150 -
Magnesium 29.36 mg/L20 -60 -
Iron (Fe) < 0.10 mg/L 2 -5 5 -20
Manganese(Mn) 0.04 mg/L 0.3 -1.0 10
Zinc (Zn) 0.05 mg/L --
Copper (Cu) 0.01 mg/L 0.01 -1 10
Boron (B) 0.27 mg/L 0.3 -0.5 1
Molybdenum (Mo) 0.015 mg/L 0.06 -0.1 5 -10
Sulfur (S) 33.3 mg/L < 60
Chloride (Cl) 16.10 mg/L 0 -30 30
Sodium (Na) 21.14 mg/L -30
Sodium Adsorbtion Ratio (SAR) 0.49 ---
109

Analysis Report For: Copy To:
www.aasl.psu.edu
Bob Cameron
PSU Horticulture Dept.
103 Tyson Bldg
University Park PA 16802
IBF2wetland 9/221:50
Centre
W03562
10/5/2010
9/22/2010
Irrigation Water
LAB ID: REPORT DATE:SAMPLE ID: DATE SAMPLED SAMPLE TYPE INTENDED USE
COUNTY
WATER ANALYSIS
Irrigation Water Report (WH02)
Analysis Result Units Normal Range Upper Limit
pH 7.5 6.0
to 7.5 -
Total Alkalinity as CaCO3 302.8 mg/L 80 -100 -
--
Bicarbonates (HCO3) 369.4 mg/L 80 -100 -
Carbonates (CO3) 0.0 mg/L -
Hardness as CaCO3 345.9 mg/L < 150 -
Electrical Conductivity (EC) 0.71 mmhos/cm -3 -5
Total Dissolved Solids (TDS) 453.3 mg/L --
Fertilizer-Nitrogen (N) 1.50 mg/L 50 -150 -
Nitrate-Nitrogen (NO3-N) < 0.50 mg/L 50 -100 -
Ammonium-Nitrogen (NH4-N) < 1.00 mg/L 0 -75 100
Phosphorus (P) 1.35 mg/L 10 -50 -
Potassium (K) 12.60 mg/L < 200 -
Calcium (Ca) 87.68 mg/L > 150 -
Magnesium 30.84 mg/L20 -60 -
Iron (Fe) 0.39 mg/L 2 -5 5 -20
Manganese(Mn) 0.52 mg/L 0.3 -1.0 10
Zinc (Zn) 0.04 mg/L --
Copper (Cu) 0.01 mg/L 0.01 -1 10
Boron (B) 0.76 mg/L 0.3 -0.5 1
Molybdenum (Mo) < 0.010 mg/L 0.06 -0.1 5 -10
Sulfur (S) 18.4 mg/L < 60
Chloride (Cl) 16.00 mg/L 0 -30 30
Sodium (Na) 15.67 mg/L -30
Sodium Adsorbtion Ratio (SAR) 0.37 ---
110

Appendix B Meterological Data at Center for Green Roof Research
111
0
20
40
60
80
100
120
De
gre
es
Fah
ren
he
it
July 1 through July 31
Temperature
Temperature
0
20
40
60
80
100
120
% R
ela
tive
Hu
mid
ity
July 1 though July 31
Humidity
Humidity

112
0
100
200
300
400
500
600
700
800
900
1000
wat
ts/s
qu
are
me
ter
July 1 through July 31
Solar Radiation
Solar radiation *w/m2)
0
0.1
0.2
0.3
0.4
0.5
0.6
0.7
inch
es
July 1 through July 31
Precipitation
Rainfall in

113
0
10
20
30
40
50
60
70
80
90
100
De
gre
es
Fah
ren
he
it
August 1 through August 31
Ambient Temperatures for August at Center for Green Roof Research
Temperature
0102030405060708090
100
% R
ela
tive
Hu
mid
ity
August 1 through August 31
% Relative Humidity for August at Center for Green Roof Research
RH%

114
0
100
200
300
400
500
600
700
800
900
wat
ts/s
q. m
ete
r
August 1 through August 31
Solar Radiation (watts/m2) for August at Center for Green Roof Research
solar rad wat/m2
0
0.05
0.1
0.15
0.2
0.25
0.3
Inch
es
of
Pre
cip
itat
ion
August 1 through August 31
Precipitation for August at Center for Green Roof Research
Precip.

APPENDIX C
ADDITIONAL DATA FOR IMPACT OF IBF ON WALL TEMPERATURE FOR PERIOD 8/1-8/12
115
0
5
10
15
20
25
30
35
40
Tem
pe
ratu
re (
Ce
lsiu
s)
August 1 through August 12
Effect on South Wall Temp. of IBF
Bldg2 inside
Bldg 2 outside
Bldg.2
0
10
20
30
40
50
60
70
Tem
pe
ratu
re (
Ce
lsiu
s)
August 1 through August 12
Effect of Solar Radiation on External South Wall of Bldg2 with IBF vs. Bldg 5 Control
Bldg 5 outside
Bldg 2 outside

116
10
12
14
16
18
20
22
24
Tem
pe
ratu
re (
Ce
lsiu
s)
August 1 through August 12
Effect of Solar Radiation on Internal South Wall of Bldg2 with IBF vs. Bldg5 Control
Bldg2 inside
Bldg5 inside
0
10
20
30
40
50
60
70
Tem
pe
ratu
re (
Ce
lsiu
s)
August 1 through August 12
Effect of Solar Radiation on South Walls of Bldg2 with IBF vs. Bldg5 control
Bldg2 inside
Bldg5 inside
Bldg 5 outside
Bldg 2 outside
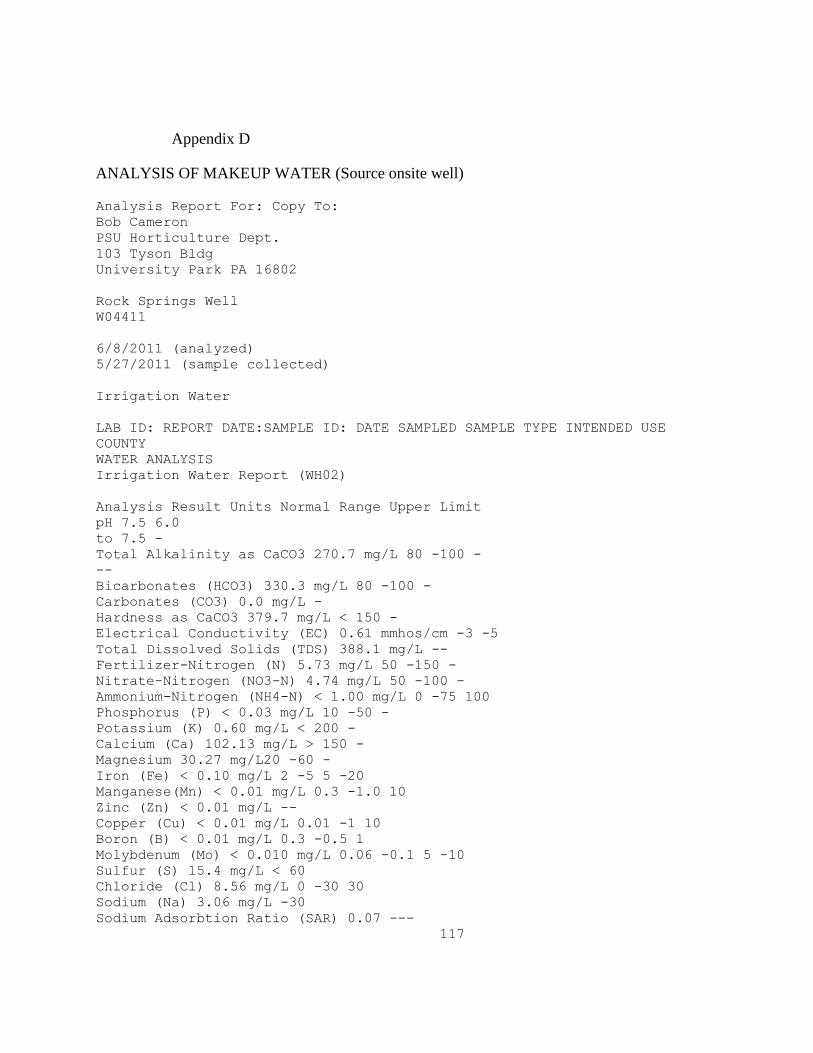
Appendix D
ANALYSIS OF MAKEUP WATER (Source onsite well)
Analysis Report For: Copy To:
Bob Cameron
PSU Horticulture Dept.
103 Tyson Bldg
University Park PA 16802
Rock Springs Well
W04411
6/8/2011 (analyzed)
5/27/2011 (sample collected)
Irrigation Water
LAB ID: REPORT DATE:SAMPLE ID: DATE SAMPLED SAMPLE TYPE INTENDED USE
COUNTY
WATER ANALYSIS
Irrigation Water Report (WH02)
Analysis Result Units Normal Range Upper Limit
pH 7.5 6.0
to 7.5 -
Total Alkalinity as CaCO3 270.7 mg/L 80 -100 -
--
Bicarbonates (HCO3) 330.3 mg/L 80 -100 -
Carbonates (CO3) 0.0 mg/L -
Hardness as CaCO3 379.7 mg/L < 150 -
Electrical Conductivity (EC) 0.61 mmhos/cm -3 -5
Total Dissolved Solids (TDS) 388.1 mg/L --
Fertilizer-Nitrogen (N) 5.73 mg/L 50 -150 -
Nitrate-Nitrogen (NO3-N) 4.74 mg/L 50 -100 -
Ammonium-Nitrogen (NH4-N) < 1.00 mg/L 0 -75 100
Phosphorus (P) < 0.03 mg/L 10 -50 -
Potassium (K) 0.60 mg/L < 200 -
Calcium (Ca) 102.13 mg/L > 150 -
Magnesium 30.27 mg/L20 -60 -
Iron (Fe) < 0.10 mg/L 2 -5 5 -20
Manganese(Mn) < 0.01 mg/L 0.3 -1.0 10
Zinc (Zn) < 0.01 mg/L --
Copper (Cu) < 0.01 mg/L 0.01 -1 10
Boron (B) < 0.01 mg/L 0.3 -0.5 1
Molybdenum (Mo) < 0.010 mg/L 0.06 -0.1 5 -10
Sulfur (S) 15.4 mg/L < 60
Chloride (Cl) 8.56 mg/L 0 -30 30
Sodium (Na) 3.06 mg/L -30
Sodium Adsorbtion Ratio (SAR) 0.07 ---
117

Appendix E
E. INCORPORATING BIOFILTERS IN RESIDENTIAL APPLICATIONS
E.1 Innovative and Cost Effective Biofilters For Smallscale Residential Applications
The following was presented at the Tenth Annual Greening Rooftops for
Sustainable Communities Conference:
Session 5: Case Studies, Design
Innovative and Cost Effective Biofilters
For Smallscale Residential Applications
Robert D. Cameron, Robert D. Berghage
The Pennsylvania State University
Abstract
Natural and artificial biological systems have been utilized by man to attenuate pollutants for thousands
of years. Since the 1940s, the benefits of these biofilters such as green roofs, living walls, constructed
wetlands, and living columns have been rediscovered. Commercial and industrial applications of
biofilters are numerous and becoming commonplace. Potential small scale application of these
technologies for single family residences abound, and yet, have been largely overlooked. With more
than 75 million single family residences in the USA alone, it is a large, essentially, untapped market.
Benefits of incorporating biofilters for a home owner include: energy conservation, aesthetics, habitat
diversity, air pollutant attenuation, gardening opportunities for high yield food production, and water
management. The latter offers the potential to transform wastewater into a water resource.
Residential case studies from a single family dwelling in State College, PA. are presented that include: a
living wall for a window well; integration of a living wall with an extensive green roof to provide a
vertical garden for tomatoes, peppers, herbs, and more; an ultra light weight roof for an existing
structure,and a miniature constructed wetlands integrated with a living wall for a living shower. Also
discussed is an integrated biofilter to convert residential wastewaters to a water resource.
118

Introduction:
Numerous opportunities exist for incorporating biofilters such as greenroofs, living walls, and
constructed wetlands into existing or new construction of single family residential homes. Small,
medium, and large scale applications are presented and corresponding benefits discussed. Although
these projects vary in complexity, each can be acco8plished by one person. Aside from the 600 sq.ft. (
55.74 sq.meters ) extensive roof which required one week to complete, the other projects can be
constructed in less than two days.
E.1.1 Urban Agriculture Applications
Why garden on a roof? In urban areas, where land is at a premium, there may be little area available at
ground level. Also, neighboring buildings may cast shadows which limit the amount of solar exposure at
ground level. But, even in areas with ample ground level space, rooftop gardening may be a preferred
alternative. Rabbits, deer, and groundhogs cannot fly! After three seasons of rooftop gardening, other
less obvious benefits have been discovered. These benefits were a result of the garden’s design.
Successful rooftop gardening begins with the design:
Costs and structural limitations on single family homes preclude the consideration of an intensive green
roof for most homeowners. Alternatively, an extensive roof has more potential application for both
existing and new construction of single family dwellings. Unfortunately, extensive roofs, by their nature,
are not conducive to many of the most popular garden plants which require a deep, loamy soil.
However, by incorporating a living wall around the roof’s parapet, an optimum habitat for most garden
plants can be created without jeopardizing load constraints. The structural limitation for most roofs
occurs in the middle of the span. Along the wall, is typically, the area where the largest load can be
applied. For this application, a plastic coated mesh wire, four feet in height was folded in half along the
horizontal axis, creating a “U” shape with each of the arms approximately two feet in height. The top of
one of these arms was attached to the parapet taking care not to damage the EPDM liner that extended
up the parapet. A piece of 4mil plastic sheeting was cut to line the inside of the U arm attached to the
wall with sufficient amount to also line the botton of the U. DuPont Seed Germination Blanket (wood
excelsior with 1 sided plastic mesh) was overlapped on the bottom of the U and allowed to drape over
both sides of the outside arm. Zip ties were then used to connect the two sides of the U, while allowing
four to five inches of spacing in between. Zip ties were applied in this manner along the length of the
wall at the top, middle, and bottom of the arms. A rich,highly organic soil was added to fill the U along
the length of the parapet. This resulted in a column of soil approximately 2 feet (0.6m) in height, 25
feet(7.6m) in length, and 5in.(12.7cm.) in width (at the top of the U).
119

A wide variety of garden plants could be placed at the top of the U or planted on the external face
within the excelsior/wire mesh. Table 1 is a list of the fruits and vegetables that have been successfully
grown during the past three seasons. In addition, a wide spectrum of perennials and annuals have been
cultivated in the wall to provide additional color and attract pollinators. These plants are not included in
Table 1. The current walls are a total of 50 feet(15.2m) in linear length. Costs for materials (in US
dollars) are:
Vinyl coated wire mesh lawn fence (4ft.X50ft.) roll: $50US
DuPont Seed Germination Blanket (excelsior wood fiber with plastic mesh)4ft.X50ft.: $25US
4ml. roll of plastic: $20US
Pack of Zip ties: $5US
Soil (used soil from compost pile)
Total Cost: $100US
One person can construct similar walls in one day. The most onerous aspect is the transport of soil to
the roof, in this case, done in 5 gallon(18.9liters) buckets.
120

Table 6.01 PLANTS: LIVING WALL GARDEN ON EXTENSIVE ROOF
Artemisia dracunculus Tarragon
Brassica oleracea Kale
Capscium L. Peppers
Foeniculum vulgare sweet fennel
Fragaria x ananassa Strawberry
Lactuca sativa L. Lettuce
Ocimum basilicum sweet basil
Ocimum basilicum 'Purple Ruffles' purple basil
Ocimum sanctum holy basil
Origanum vulgare 'hirtum' Greek oregano
Pisum sativum Peas
Rosmarinus officinalis Rosemary
Salvia officinalis garden sage
Solanum lycopersioum L. Tomato
Solanum melongena Eggplant
Thymus citriodorus lemon thyme
Thymus vulgaris Thyme
121
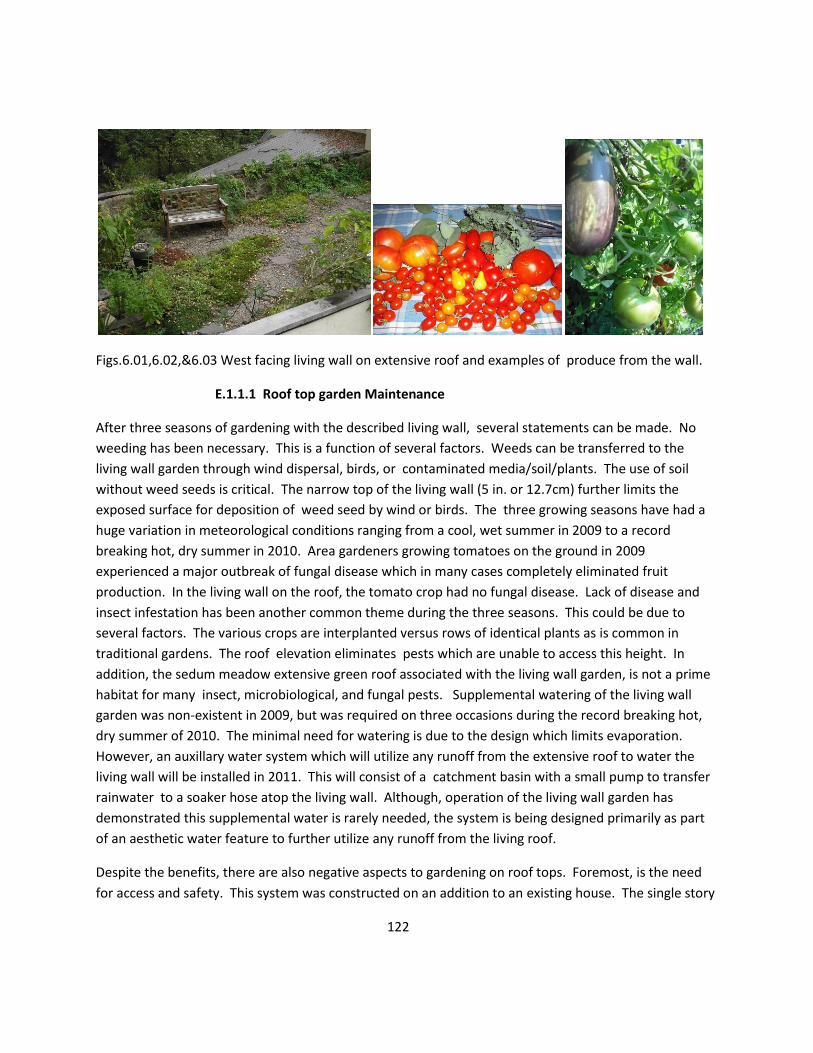
Figs.6.01,6.02,&6.03 West facing living wall on extensive roof and examples of produce from the wall.
E.1.1.1 Roof top garden Maintenance
After three seasons of gardening with the described living wall, several statements can be made. No
weeding has been necessary. This is a function of several factors. Weeds can be transferred to the
living wall garden through wind dispersal, birds, or contaminated media/soil/plants. The use of soil
without weed seeds is critical. The narrow top of the living wall (5 in. or 12.7cm) further limits the
exposed surface for deposition of weed seed by wind or birds. The three growing seasons have had a
huge variation in meteorological conditions ranging from a cool, wet summer in 2009 to a record
breaking hot, dry summer in 2010. Area gardeners growing tomatoes on the ground in 2009
experienced a major outbreak of fungal disease which in many cases completely eliminated fruit
production. In the living wall on the roof, the tomato crop had no fungal disease. Lack of disease and
insect infestation has been another common theme during the three seasons. This could be due to
several factors. The various crops are interplanted versus rows of identical plants as is common in
traditional gardens. The roof elevation eliminates pests which are unable to access this height. In
addition, the sedum meadow extensive green roof associated with the living wall garden, is not a prime
habitat for many insect, microbiological, and fungal pests. Supplemental watering of the living wall
garden was non-existent in 2009, but was required on three occasions during the record breaking hot,
dry summer of 2010. The minimal need for watering is due to the design which limits evaporation.
However, an auxillary water system which will utilize any runoff from the extensive roof to water the
living wall will be installed in 2011. This will consist of a catchment basin with a small pump to transfer
rainwater to a soaker hose atop the living wall. Although, operation of the living wall garden has
demonstrated this supplemental water is rarely needed, the system is being designed primarily as part
of an aesthetic water feature to further utilize any runoff from the living roof.
Despite the benefits, there are also negative aspects to gardening on roof tops. Foremost, is the need
for access and safety. This system was constructed on an addition to an existing house. The single story
122

roof is accessed through a former window, now converted to a doorway, across an arched metal bridge
spanning a hall below, and out an exterior door. The easy access and parapet around the roof allows for
children (accompanied by an adult) and the elderly to access the living roof and associated garden. Still,
each Spring, plants must be carried through the house and up to the roof. However, this inconvenience
is more than offset by the benefits and the incredulous looks of dinner guests who learn a portion of
their meal was grown on the roof.
Sedum meadow Extensive Roof:
Living roofs offer many benefits for single family homeowners. Yet, cost, structural concerns,
permitting, and the lack of qualified installers in many areas have limited the number of residential living
roofs. Following is a description of two very different roofs installed at the same residence. The larger
of the two projects was installed on an addition to a 1950s Cape Cod home. The new construction
enabled structural considerations to be included in the original design resulting in a nominal upcharge.
The total roof measured: 600sq.ft.(56 sq.meter) and was surrounded on three sides with a parapet. An
EPDM membrane from Carlisle was applied in one piece to the plywood deck and parapet above the
19inch(48.26cm) wood trusses. Icynene foam insulation was applied under the deck, throughout the
truss system. An additional layer of PVC plastic was placed loose above the EPDM membrane and up
the parapet sidewalls. A moisture mat was placed on top of the PVC for water distribution. Local
washed gravel was applied in a width of 30 inches(76cm.) and a depth of 3 inches(7.62cm.) to create a
meandering path that also functions as a water drainage area. Recycled extensive roof media was
added to the remainder of the roof in depths ranging from 3 inches (7.63cm.) to 5 inches ( 12.7cm).
Media was transported to the roof by carrying 5 gallon (18.9liters) buckets up an extension ladder. The
roof’s long axis faces to the north, with east and west exposures open. The second story of the home
rises above the southern side, and large silver maple trees shade the northernmost portion of the roof.
These factors combine to limit the amount of solar radiation portions of the roof receives. A portion of
the second story roof incorporated an additional sedum roof and was designed to discharge to the first
story living roof. Consequently, although the first story living roof is only 600 sq. ft.(55.7 sq.meters), it
exhibits a wide variety of ecological niches, including moist shady, dry sunny, and dry shady habitats.
The variation in the media depth adds further complexity to the niches. The addition of the living wall
attached to the parapet (described above) completes the range of habitats and adds an additional
100sq.ft.(9.3 sq.meter) of vertical surface area. The various micro-habitats enabled a diverse flora to be
established as indicated by the more than 90 species delineated by habitat in Tables 1 and 2. Habitat
diversity is equally important in man made environments and can provide benefits such as improved
pollutant attenuation. Many of these species such as the five species of ferns growing in the
moist/shady area would not typically be associated with an extensive roof. In addition to the perennials
listed, annuals such as Solenostemon and Caladiums are seasonally added to their preferred micro-
habitats. The dry sunny habitat comprises the largest area and is planted with a wide variety of plants
to create a sedum meadow. The boundary between the edge of the sedum meadow and the living
walloffers another microhabitat where plants such as Rubeckia hirta Toto, and Achillea thrive. In the
123

transition area from the dry hot to the dry shady, a small water garden is located and allows seasonal
hydrophilic plants that include Colocasia and Pistia stratiotes. A one foot (30.48cm.) step down to
another roof tier allowed the water garden basin to be surrounded by a deeper zone of media resulting
in another variation in species including Hibiscus moscheutos and Lobelia x speciosa (Russian Princess).
The dry shady area includes shade tolerant species such as Sedums and Lysimachia nummularia.
Experimentation with additional species of plants continues. Once the EPDM membrane was installed
by professional roofers, the living roof installation was completed by one person in less than one week.
Costs of the materials excluding the EPDM membrane was less than $1.50US/sq.ft. The Pennsylvania
State University’s Ag Analytical Laboratory is reknown for its ability to analyze green roof media for
physical and chemical parameters. Consequently, the numerous samples received for analysis from
around the globe add up to over a ton of medias per year. In the past, these media samples were
disposed. This material is now recycled and provided all of the media needed for this project. The
simplistic design of the roof and the use of recycled media allowed the total cost of materials to be very
inexpensive. The benefits of a living roof have often been touted. For this residence, the ability of the
roof to reduce stormwater runoff was an integral part of the site’s stormwater management plan that
includes rain gardens,French drains, porous paving, and storing/recycling of stormwater. However, the
reduction in air conditioning, aesthetics, and addition of an “outdoor room” have proved equally
beneficial.
Figs.6.04&6.05 Portion of sedum meadow extensive roof; Extensive roof with smaller roof on garage.
124

Table 6.02 PLANT SPECIES BY EXTENSIVE ROOF'S MICRO-HABITATS
Dry/ Sunny Area Agastache foeniculum
Erysium 'Gold Shot'
Sedum sexangulare
Allium senescens glaucum Gaillardia grandiflora
Sedum spurium 'Voodoo'
Allium schoenoprasum Iberis sempervivens
Sedum spurium tricolor
Anthyllis vulneria
Leptinella squalid
Sempervivum sp.
Arabis blepharophylla
Lychnis flos jovis nana
Silene acaulis 'Mt. Snowdon'
Armeria maritime
Melampodium paludosum Sisrinchium 'Calif. Skies
Artemesia sp.
Opuntia sp.
Talinum sp.
Aubrieta
Santolina sp.
Thymus citriodorus
Chrysogonum virginianum Sedum album
Thymus herbabarona
Coreopsis enano
Sedum cauticola
Thymus praecox
Dianthus deltoids
Sedum kamtschticum
Thymus pseudolanuginosus
Delosperma basuticum Sedum rupestre 'Angelina' Thymus vulgare
Delosperma cooperi
Sedum sarmentosum
Yucca rostrata 'Saphire Skies'
Shady/Moist Area
Shady/Dry Area
Aquatic Garden Border Area
Adiantum pedatum L.
Erodium x variabile
Crocosmia
Dryopteris marginalis
Lysimachia nummularia Campanula poscharskyana
Osmunda claytoniana
Sedum 'Siebodi'
Cryptotaeia japonica
Osmunda regalis
Sedum sexangulare
Hibiscus moscheutos
Thelypteris decursive pin. Sedum spurium
Iris siberica
Ajuga reptans
Aquatic Garden(Seasonal) Lobelia x speciosa
Astilbe sp.
Canna sp.
Platycodon grandiflorus
Lysimachia nummularia Colocasia
Sage pineapple
Heuchera sp.
ginger lily
Sedum sp.
water lettuce
Veronica peduncularis
Boundary Area Between Living Wall and Dry/Sunny Sedum Meadow Achillea sps.
Capsicum
Ocimum sps.
Agastache foeniculum
Echinacea purpurea
Rubeckia hirta 'Toto'
Artemesia sp.
Lanvandula sps.
Salvia x superba
125

Living Roof on an Existing Structure:
The dormer of a two story garage was the recipient of an ultra lightweight extensive roof. The south
facing, sloped roof has a pitch of 3/12 and is 104 sq.ft.(9.6619sq.meter) in area. Additional structural
elements (posts and beams) were added to transfer weights from the roof to the ground. This turned
out to be unnecssary for the living roof load, but, allowed the second floor to be used as a library/office.
An EPDM membrane with no seams was placed on the existing wood deck. A six mill pvc plastic sheet
was placed on top of the EPDM membrane and in turn covered with a water distribution mat. Lumber
(2inchX4inch) was used to create a grid of four equal rectangles. Beaver Plastics styroblock product
made of extruded polystyrene were recycled from a completed research project and formed the basis
for the roof. Recycled media was placed at a depth of 1 to 2 inches across the three types of styroblocks
which were either 4 or 6 inch in depth. Along the edges of the roof and in voids formed between the
grid and the styroblocks, media was placed to a depth of four inches. The average weight of the living
roof, saturated, is less than ten lbs./sq.ft.(48kg/sq.meter). This living roof was constructed in less than
one day by one person. Plants are primarily Sedums and include the following species: spurium Voodoo,
spurium tricolor, album, cauticola, kamtschaticum, rupestre ‘Angelina’, sarmentosum, and sexangulare.
Additional perennials include: Agastache foeniculum, Dianthus sp., and Delosperma sp. Also, Portulaca
grandiflora is planted seasonally.
All of the living roof materials above the EPDM membrane were salvaged and consequently there were
no monetary costs for the materials. Plants were propagated from the larger extensive roof. However,
if the recycled styroblocks had been purchased, the total cost for the amount needed for this roof
would have been approximately $35US.The roofs primary objective was aesthetics. However, it also
plays a role in stormwater management, reduces the need for air conditioning, and will extend the life
of the roof membrane.
Fig.6.06&6.07 Beaver Plastics Styroblock; Lightweight roof on two story existing garage
126

E.1.2 Unique Niches: Window well IBF
The popularity of finished basements has resulted in the need for emergency egress from these spaces.
Depending on the architecture of a home, some building codes may require window wells with a
window that can serve as an emergency exit. Although functional, an escape window and associated
metal window well lack aesthetic appeal (Figure 8). Without impeding access, a south facing window
well was converted into a unique habitat with a living wall and constructed subsurface wetlands. The
bottom of the well was excavated by shovel to a depth of one foot below the bottom of the window. A
swimming pool liner was salvaged, cut to size, placed in the bottom of the well and lapped two feet up
the side. An overflow to the foundation footer drain was installed.The wall of the well was wrapped
with two layers of six mill plastic sheeting. PVC pipe grids were constructed using Tees and pipe. Holes,
2.25 inches(5.715cm) in diameter were cut in the upright PVC as well as the horizontal section for
planting and draining of the irrigation water. In addition, ¼ inch (0.64cm) holes were drilled in the
bottom of the horizontal pipes. Salvaged aluminum rain gutter was cut to length, and attached atop one
of the five horizontal pipes (Figure 9). Holes, ¼ inch (0.64cm.) were also drilled in the bottom of each
gutter. This was duplicated for the opposing side of the well. Limestone gravel (1 to 2 inch diameter)
was placed in the bottom of each gutter segment which was then filled with soil. So as not to interfere
with the ladder while fitting the curve of the well wall, a flexible living wall was constructed using plastic
coated wire mesh covered with excelsior. Compost was place on half of the wire/excelsior which was
folded over to create a flexible wall, five feet(1.5m) tall, one foot wide (30.48cm), and two
inches(5.08cm) in depth. One of these flexible walls was placed on each side of the ladder. A geotextile
membrane was then used to cover over the gutter walls and the flexible walls along the entire inner
wall of the well. The geotextile membrane was slit in areas to allow plants to be placed in the gutters
and holes of the PVC. A plastic pot was placed in the bottom of the well as a housing for a water pump.
River stone (#3) was then placed in the bottom of the well to a depth of 12inches (30.48cm.). An
additional living wall, similar to that used for the rooftop garden was applied around the exterior of the
window well at the ground level. Plants used on the exterior and the inside of the well include:
Ceratostigma plumbagnoides, Hedera helix, Houttuynia cordata, Origanum vulgare, Ipomoea batatas,
Portulaca grandiflora, Solenostemon scutellarioides, Petrosalinum crispum, Impatiens walleriana, and
Caladium bicolor. Grass seed was initially applied to obtain a complete greening until plants filled the
voids. Construction of this biofilter required a full day by one person. The primary rationale for this
project was aesthetics. However, additional benefits have been realized. The water from the
dehumidifier in the basement can now be emptied to the basin. The system has the potential to serve
as a mini greenhouse during the winter months by covering the top with plastic.
127

Figs.6.08 & 6.09 Basement emergency exit; construction of living walls and constructed wetlands
Figs. 6.10 & 6.11 Completed Living wall; Ground level completed exterior living wall.
E.1.3 Converting wastewater into a water resource: Interior IBFs
Four primary sources of wastewater are generated by most residential homes. Black water from
camodes, and graywaters from clothes washing machines, tub/shower/bathroom sinks,and kitchen
sinks /dish washers. The volume and characteristics of these wastewaters vary. An exterior integrated
biofilter(IBF) to convert each of these wastewaters into a water resource was presented previously. This
128

application considers the use of an interior living wall with a constructed wetlands to create an eco
shower. An EPDM membrane was used to create a 6 inch (15.24cm) deep basin with no drain. A
double layer of six mil plastic was attached to “hardy board” on the walls and allowed to drape into the
basin. A grid system of PVC plastic was constructed, resulting in 5 feet(1.5m) upright 4in.(10.16cm) pipe
with 3in.(7.62cm) horizontal pipe connected with Tees. Two inch(5.08cm) diameter holes were cut in
the PVC pipe along with 1/4inch(0.635cm) drainage holes. The grid system was attached to two of the
shower walls. Light weight aggregate green roof media was used to fill the PVC pipes. A ½ inch (1.26cm)
pvc pipe was installed along the top of the grid and down one of the uprights to the basin to provide for
a water irrigation system. Holes 1/4inch ( 0.635cm.) were drilled at intervals in the pipe. A plastic pot
was placed in the basin as a housing for a small pump. A geotextile membrane was attached to the PVC
grids on the shower walls. Holes were drilled in the membrane to correspond to the two inch holes in
the pvc. Crushed limestone (2B) was placed in the basin at a depth of 5inches. Plants were placed in
the holes of the wall. A four feet covered double fluorescent light was installed above the shower.
Plant selections include tropical species that are adept at growing in low light/moist environments
(Table 3). Salvaged shower heads were installed. The shower delivers 1.5 gallons(5.7liters) of water
per minute. The basin and wall hold approximately 40 gallons (151.4 liters) of water. Consequently,
the system could typically handle shower water from 2 to 4 people depending on the length of showers.
The basin pump is never operated while someone is showering as a safety precaution. Tests show the
water is cleaned for reuse in applications such as camode flushing within 24 hours. Alternatively, during
growing seasons the water could be drained to agricultural cops or landscaping. Local regulations may
affect the applications for the reclaimed water.
Table 6.03 PLANT SPECIES IN THE LIVING SHOWER
Caladium bicolor
Fittonia argyroneura Onoclea sensibilis Synonium podophyllum
Chlorophytum osmosum Gynura aurantiaca
Pilea cadierei
Dendrobium sps.
Hedera helix
Pothos
Dracaena marginata
Ipomoea batatas
Solenostemon
Dryopteris marginalis Nephrolepis exaltata Spathiphyllum sp.
129

Figs.6.12 &6.13 Completed Living Shower; Exterior IBF for wastewater conversion
E.2 Summary:
Biofilters such as living walls, living roofs, and constructed wetlands can be successfully incorporated
into residential applications to create inexpensive, functional architecture. Benefits are numerous and
include: aesthetics, wastewater and stormwater management, energy savings, food production, and
water conservation.
130
Appendix F
Following is copy of draft paper accepted to be presented and published in the proceedings of
the 10th
annual conference of Greenroofs for Healthy Cities.
Session Number: Session Title
REDUCING BUILDING TEMPERATURE WITH LIVING WALL
WASTEWATER TREATMENT SYSTEM
Robert D. Cameron, Robert D. Berghage, PhD.
Department of Horticulture, Pennsylvania State University
Abstract
Integration of biofilters such as living walls, constructed wetlands, and greenroofs offer potential for
living architecture systems with a total function greater than the sum of its parts. This paper describes
research of an integrated system which significantly reduced building envelope temperatures while
attenuating wastewater pollutants and minimizing the system’s footprint. Tests were conducted over a
three year period using five replicate buildings which had interior conditioned space. Each building was
fitted with at least 12 temperature sensors throughout the building envelope. Two of the five buildings
had replicate integrated biofilters (IBF) consisting of a living wall, living columns, and constructed
wetlands installed on each building’s south side. Average mean exterior temperatures of the buildings
with IBF were significantly less than buildings with no IBF. Mean interior wall temperatures were also
significantly reduced. Energy to condition the interior air of buildings with IBF was less than buildings
with no IBF. Treated wastewater from the IBF was also applied to asphalt shingled roofs. The
associated impact to temperatures throughout the roof structure was contrasted with replicate extensive
green roofs. This
multi-year study demonstrated the utility of integrating biofilters to provide functional architecture
capable of converting wastewater to a water resource while significantly reducing building energy needs.
Introduction Our planet’s surface is nearly 75% covered with water. However, less than 1% of all water is available
for human consumption (http//earthobservatory.nasa.gov/). Extensive droughts, desertification, salt water
intrusion, and the contamination of potable water further threaten this limited resource. The World
Health Organization estimates that 1.1 billion people lack access to clean water supplies, and 2.4 billion
lack access to basic sanitation. Water shortages now plague almost every country in North Africa and the
Middle East (WHO/UNICEF 2010). Currently, many areas of the USA are in drought. Global warming
is likely to subject many additional areas to drought. There are significant health impacts of water
shortages. Water-borne diseases account for roughly 80% of infections in the developing world.
(Estimation for 2002, by the WHO/UNICEF JMP, 2004). We must reduce the use of potable water for
non-drinking purposes, recycle water, and reconsider wastewater as an unused resource. However,
programs and associated technologies devised during the 20th century for managing domestic wastewater
131

have focused on eliminating materials from the source as expeditiously as possible. This approach has
been applied to human wastes as well as storm water and has resulted in large transmission systems,
typically associated with a centralized treatment unit. Although this approach has solved the major
outbreaks of water borne diseases such as cholera in developed nations, it is unsustainable. Further, it is
not a model that should be adopted by developing nations. Alternatively, utilizing wastewater as a
resource offers the potential of benefits including decreased groundwater extraction, nutrient recovery,
and reduced energy costs. Natural wetlands have long been recognized for their ability to act as
biological filters (biofilters) to remove contaminants, resulting in a functional comparison to kidneys.
Biofilters are simply defined, as any biological system which utilizes living organisms to filter a media
containing contaminants. In modern times, man-made wetlands have been evaluated as potential
wastewater treatment technologies since the early 1950s in Germany (DeBusk 1999). Constructed
wetlands and variations such as John Todd’s Living Machine have been developed as decentralized
wastewater systems. During the past four decades, constructed wetlands have been deployed in a wide
array of applications including domestic and industrial wastewaters, acid mine drainage, and agricultural
runoff. Consequently, a large body of research studies ranging from the specific microbes responsible for
a pollutant attenuation, to design modifications to enhance performance has developed. (Wolverton and
Harrison 1973, Wolverton and McDonald 1980, DeBusk 1999, Jung et al 2009). The disadvantage of
constructed wetlands for wastewater treatment is the large footprint required due to the typical hydraulic
retention time (hrt) of 7 to 14 days. Mankiewicz et al proposed the use of gray water for thermal
regulation and the enhancement of biological diversity on green roofs (Mankiewicz 2007). However, the
role of green roofs as a biofilter has primarily focused on the ability to detain storm water and not
attenuate wastewater. Although vines have covered building facades for millennia, vertical biofilters,
known as living walls, are recent innovations. Vine trellis systems, planted retaining walls, and interior
planted membrane covered walls, all are considered living walls. As one might expect with such a recent
development, the body of research is scant with a focus on the aesthetics of living walls Researchers at
the University of Maryland have investigated the ability of vine trellises to minimize solar radiation
impacts to building facades (Schumann 2008). Quantification of the ability of living walls to attenuate
wastewater pollutants has been largely overlooked. A review of the literature indicates that mankind has
taken a circuitous route in the attempt to manage wastewater from the early use of decentralized natural
systems which utilized the wastes as a resource to centralized systems in the 20th century. Now the
exorbitant costs of upgrading and maintaining centralized systems have returned wastewater
management’s focus on decentralized systems and a renewed interest in managing wastewater as a
resource. The proliferation of constructed wetlands in the late 20th century has offered a sustainable
alternative to more energy intensive technologies. The advent of biofilters such as green roofs and living
walls to create functional, living architectural features offer the potential for additional applications of
treating wastewater as a water resource. Chong-Bang Zhang et al (2010) found that increasing the
diversity of plants in constructed wetlands increased the biological performance due to increased diversity
of associated microorganisms. Integration of biofilters to manage wastewater as a resource offers the
potential for enhanced performance from the increased diversity of microhabitats.
Methods
An effective and cost efficient decentralized management system was designed to convert wastewater into
a water resource. Constructed wetlands, living wall, and living columns were integrated into a single
system with a footprint less than 15 square feet. Designated an integrated biofilter (IBF); the system
treated up to 50 gallons of gray water or black water in a batch process. Analyses for 26 parameters
demonstrated the IBF capable of decreasing levels of pollutants such as organics (BOD) and surfactants
by 99% in 24 hours and meeting applicable discharge limits. Specifications of the system are described in
an earlier publication which discusses the IBF’s attenuation of wastewater pollutants (Cameron 2009).
132
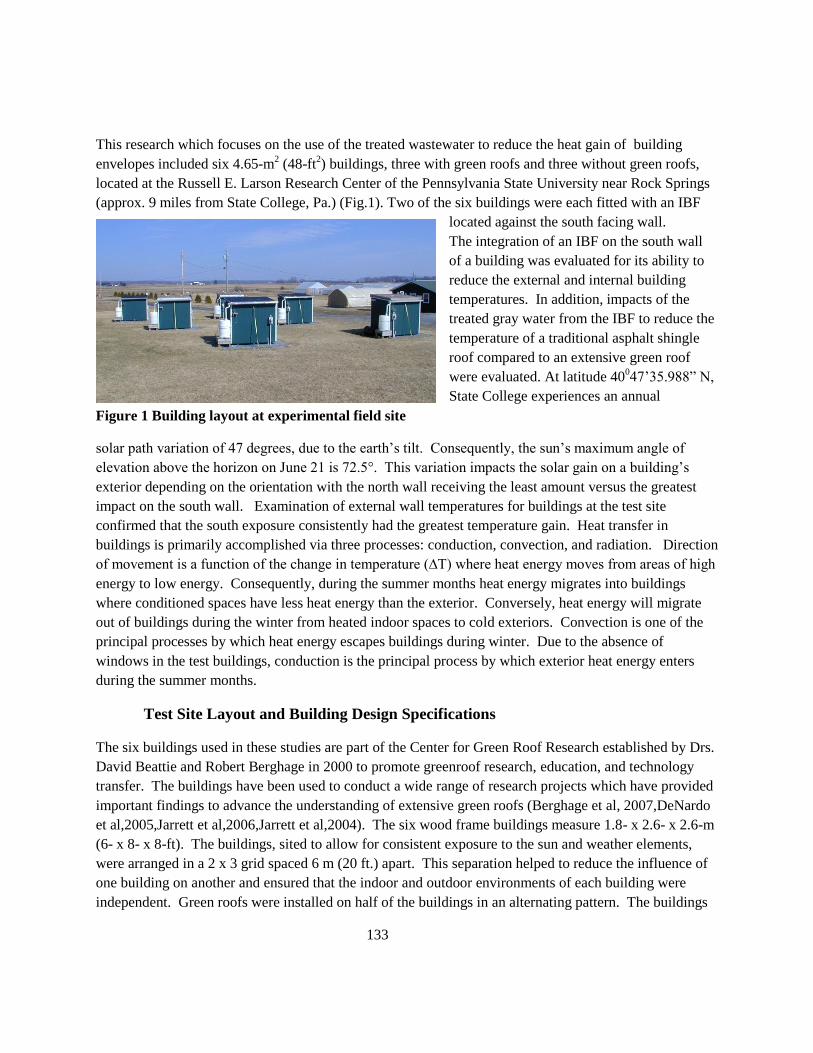
This research which focuses on the use of the treated wastewater to reduce the heat gain of building
envelopes included six 4.65-m2 (48-ft
2) buildings, three with green roofs and three without green roofs,
located at the Russell E. Larson Research Center of the Pennsylvania State University near Rock Springs
(approx. 9 miles from State College, Pa.) (Fig.1). Two of the six buildings were each fitted with an IBF
located against the south facing wall.
The integration of an IBF on the south wall
of a building was evaluated for its ability to
reduce the external and internal building
temperatures. In addition, impacts of the
treated gray water from the IBF to reduce the
temperature of a traditional asphalt shingle
roof compared to an extensive green roof
were evaluated. At latitude 40047’35.988” N,
State College experiences an annual
Figure 1 Building layout at experimental field site
solar path variation of 47 degrees, due to the earth’s tilt. Consequently, the sun’s maximum angle of
elevation above the horizon on June 21 is 72.5°. This variation impacts the solar gain on a building’s
exterior depending on the orientation with the north wall receiving the least amount versus the greatest
impact on the south wall. Examination of external wall temperatures for buildings at the test site
confirmed that the south exposure consistently had the greatest temperature gain. Heat transfer in
buildings is primarily accomplished via three processes: conduction, convection, and radiation. Direction
of movement is a function of the change in temperature (∆T) where heat energy moves from areas of high
energy to low energy. Consequently, during the summer months heat energy migrates into buildings
where conditioned spaces have less heat energy than the exterior. Conversely, heat energy will migrate
out of buildings during the winter from heated indoor spaces to cold exteriors. Convection is one of the
principal processes by which heat energy escapes buildings during winter. Due to the absence of
windows in the test buildings, conduction is the principal process by which exterior heat energy enters
during the summer months.
Test Site Layout and Building Design Specifications
The six buildings used in these studies are part of the Center for Green Roof Research established by Drs.
David Beattie and Robert Berghage in 2000 to promote greenroof research, education, and technology
transfer. The buildings have been used to conduct a wide range of research projects which have provided
important findings to advance the understanding of extensive green roofs (Berghage et al, 2007,DeNardo
et al,2005,Jarrett et al,2006,Jarrett et al,2004). The six wood frame buildings measure 1.8- x 2.6- x 2.6-m
(6- x 8- x 8-ft). The buildings, sited to allow for consistent exposure to the sun and weather elements,
were arranged in a 2 x 3 grid spaced 6 m (20 ft.) apart. This separation helped to reduce the influence of
one building on another and ensured that the indoor and outdoor environments of each building were
independent. Green roofs were installed on half of the buildings in an alternating pattern. The buildings
133

were oriented with the bottom edge of the roof slope (1/12) on the south side of the buildings to optimize
solar exposure. Each building was constructed with only one opening, a door located on the north side,
identical insulation levels, and air conditioning. A 3 kW (10,200 Btu/h) window air conditioning unit was
located in the north wall of each building to maintain an indoor temperature of 21 ˚C (69.8 ˚F). A
WatchDog weather station was installed on the NW corner of a building to collect ambient temperature,
solar radiation, relative humidity, cumulative rainfall, wind speed, and wind direction. The insulation in
the walls and roof of each building is 89mm (3.5in.) of fiberglass batting insulation with a thermal
resistance (R) of 2.3 m2-K/WS (13 ft
2-h-F/Btu). Sheets of 6.35 mm (¼ in.) oriented strand board (OSB)
sheathing were placed on the interior of the insulation. The building floor insulation was also fiberglass
batting insulation with an R-value of 2.3 m2-K/WS (13 ft
2-h-°F/Btu) installed below the 6.35 mm (¼ in.)
OSB floor surface. Temperature sensors were placed directly at interfaces between the layers of
components of the building walls, roof, and floor. The placement of these sensors was identical in each
building except that several additional thermistors were placed in the layers of the green roofs. All the
thermistors were connected to the multiplexer located in each building and then to a Campbell datalogger
located in a support building. The datalogger signal goes to a computer where collected values are
recorded. Standard power meters ( 2.5% readability error) were installed on each building, and the
energy consumption required to maintain the indoor temperature was collected manually during the study.
Three portable P4460 Kill A Watt EZ Power Meters from P3 International Corporation were initially used
to provide additional, more sensitive readings of energy use. This duplicate tracking system allowed for
verification of specific readings. The portable Kill A Watt Meters were moved to monitor energy use of
specific buildings in a particular study. The Kill-A-Watt meters, which provides a digital readout of kW
to the one hundredths, is accurate to 0.5% according to the manufacturer’s manual (P3 International
Corporation, 132 Nassau St., NY, NY). Potential operating errors with some of the utility meters
combined with the inability of these meters to measure energy usage less than 1 kW hr. necessitated the
subsequent purchase of two additional Kill A Watt meters. A Campbell 23X datalogger was used for the
temperature data collection. The datalogger recorded the change in voltage in the thermistors relating to
the temperature of the thermistors. A sequence of mathematical operations changed these voltage
readings to temperature in °C. This operation was done once every 30 seconds; every 10 minutes the
measurements were averaged. These average values were recorded and stored for each thermistor
location. Site specific meteorological parameters were also collected. Data collection systems were
calibrated before the instrumentation was taken from the lab to the field site. Examination of the output
of each instrument individually and when connected in series verified that each instrument was
performing correctly. The thermistors were attached to a digital multimeter to check the resistance at
given temperatures. The computer output for the datalogger was checked against the initial multimeter
reading for the thermistors to ensure that the values were the same.
134
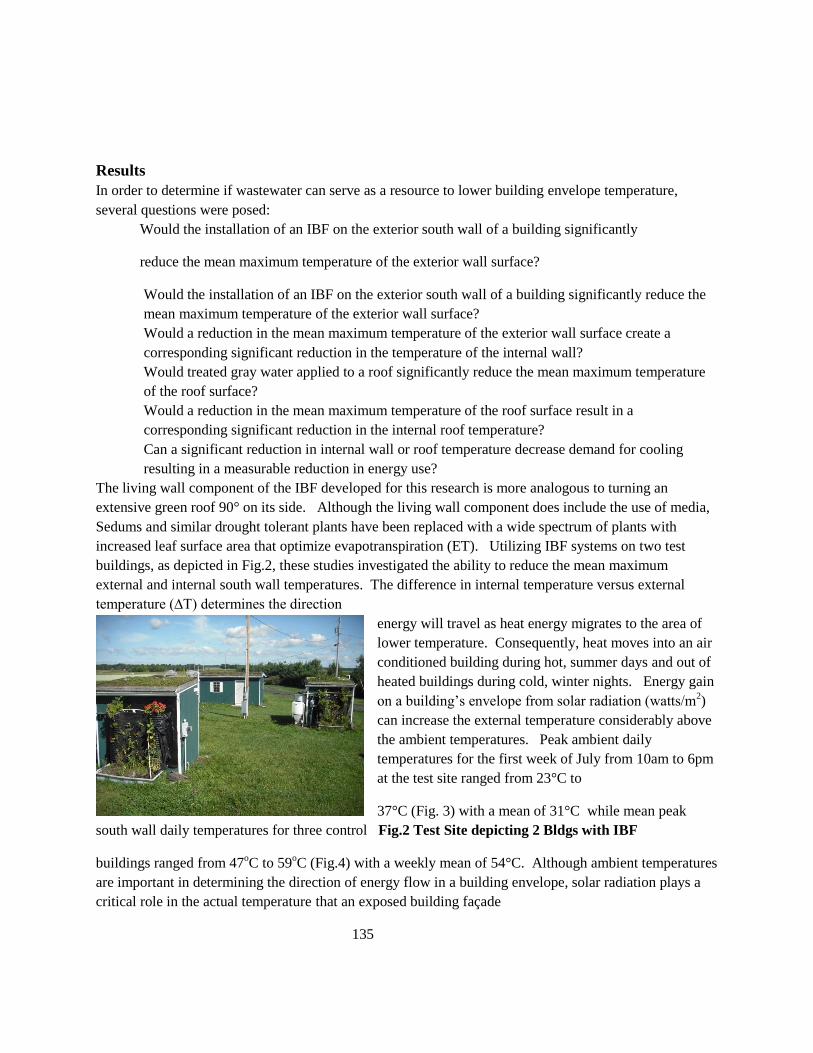
Results
In order to determine if wastewater can serve as a resource to lower building envelope temperature,
several questions were posed:
Would the installation of an IBF on the exterior south wall of a building significantly
reduce the mean maximum temperature of the exterior wall surface?
Would the installation of an IBF on the exterior south wall of a building significantly reduce the
mean maximum temperature of the exterior wall surface?
Would a reduction in the mean maximum temperature of the exterior wall surface create a
corresponding significant reduction in the temperature of the internal wall?
Would treated gray water applied to a roof significantly reduce the mean maximum temperature
of the roof surface?
Would a reduction in the mean maximum temperature of the roof surface result in a
corresponding significant reduction in the internal roof temperature?
Can a significant reduction in internal wall or roof temperature decrease demand for cooling
resulting in a measurable reduction in energy use?
The living wall component of the IBF developed for this research is more analogous to turning an
extensive green roof 90° on its side. Although the living wall component does include the use of media,
Sedums and similar drought tolerant plants have been replaced with a wide spectrum of plants with
increased leaf surface area that optimize evapotranspiration (ET). Utilizing IBF systems on two test
buildings, as depicted in Fig.2, these studies investigated the ability to reduce the mean maximum
external and internal south wall temperatures. The difference in internal temperature versus external
temperature (∆T) determines the direction
energy will travel as heat energy migrates to the area of
lower temperature. Consequently, heat moves into an air
conditioned building during hot, summer days and out of
heated buildings during cold, winter nights. Energy gain
on a building’s envelope from solar radiation (watts/m2)
can increase the external temperature considerably above
the ambient temperatures. Peak ambient daily
temperatures for the first week of July from 10am to 6pm
at the test site ranged from 23°C to
37°C (Fig. 3) with a mean of 31°C while mean peak
south wall daily temperatures for three control Fig.2 Test Site depicting 2 Bldgs with IBF
buildings ranged from 47oC to 59
oC (Fig.4) with a weekly mean of 54°C. Although ambient temperatures
are important in determining the direction of energy flow in a building envelope, solar radiation plays a
critical role in the actual temperature that an exposed building façade
135

Fig. 3 Ambient Temp. for July 1-7 at Test Site Fig.4 S. Wall Temp of Bldg without IBF for July1-7
attains. Exposed building wall peak temperatures can far
exceed peak ambient temperaturesdue to direct solar
radiation. Daily solar radiation at the test side for the period
July 1 through 7 is depicted in fig. 5. Using a conversion
of 1kW per 0.2931 Btu/hr., the 800 watts/m2 of solar
radiation observed during July would equate to 136Btu/hr.
/m2 of energy delivered to some part of the building
envelope depending in part on the surface orientation and
angle of the sun. The angle of the sun affects the amount of
Fig. 5 Daily Solar Radiation at Test Site for July 1- 7
radiation that a particular part of a building can receive. As discussed previously, at the latitude of the
test building site, the sun’s angle varies 47 degrees annually. Figures 6 and 7 show the comparative daily
temperatures of the south wall, roof, and inside temperature for a test building on 1 day from 4 am to
11pm in July and September respectively. Note that as the sun’s angle decreases from July to September
the south wall receives more energy compared to the roof and consequently peak temperatures of the
south wall are greater than the roof. However, with shorter days, the impact of solar radiation on building
envelope temperatures is decreased with resulting decreases in peak temperatures. Also, without the
artificial control of air conditioning, the maximum internal temperature is delayed compared to the
maximum external temperatures (Fig.6). This is a function of not only the ∆T, but also the R-value of
intervening materials.
136

Fig. 6 Comparison of Temps from Inside Building with no AC, External South Wall,
and Roof Surface for July 5 4am to 11pm (Note: Range of Y axis 0 to 80°C)
Fig. 7 Temperatures of Internal Building with AC, South Wall Exterior,
and Roof Surface for Sept. 11 4am to 11pm (Note: Range of Y axis 0 to 60°C)
The impact of the IBFs installed on the south walls of two buildings were evaluated to determine if
building envelope temperatures were reduced compared to three control buildings with no IBFs. The July
temperature mean for buildings with IBF (30o C) during the time interval of 10am to 6pm were
significantly lower (p<0.05) than the average temperature mean for control buildings with no IBF (42°C).
Similarly, comparison of mean temperatures from 10am to 6pm for the month of August of the exterior
south wall for the control buildings with no IBFs (41o C) to buildings with IBF on the South wall (25
oC)
indicate a significant difference(p<0.05). September temperature mean for buildings with IBF (21oC)
during the time interval of 10am to 6pm were significantly lower (p<0.05) than buildings with no IBF
(36oC). This difference represents a 29% decrease in mean temperatures during the month of July, a 39%
decrease for August, and a 42% decrease for September. These results are summarized in Table 1.
Month Mean Max. Exterior Temperature
of South Wall with No IBF (°C)
Mean Max. Exterior Temperature of
South Wall with IBF (°C)
July 42 30
August 41 25
September 36 21
Table 1 Mean Max Monthly Exterior Temp of a S Wall with No IBF vs. a S Wall with IBF
Analysis of exterior south wall temperature means for July and August (10am to 6pm) for individual
buildings were compared to demonstrate agreement between members of a group. The mean July
temperature of building 2 with IBF (30o C) is not significantly different (p<0.05) from building 3 with
IBF (30oC). Similarly, the mean July temperature comparison of the south wall exterior of building 4
137
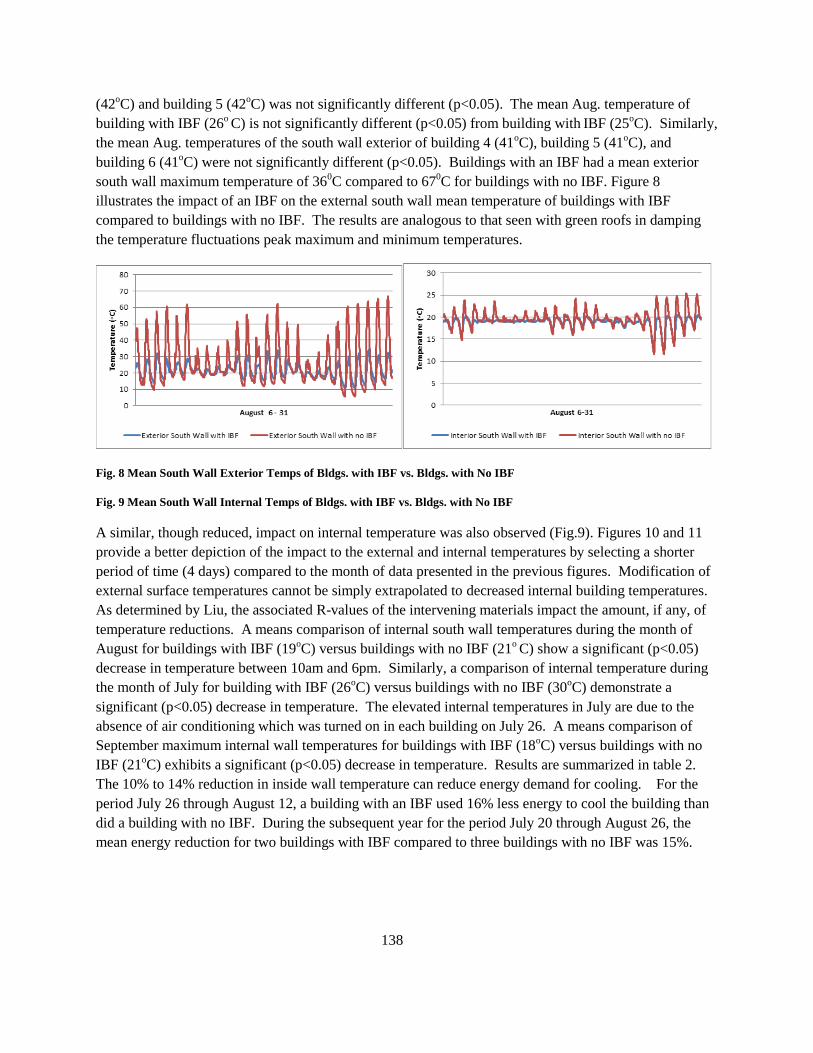
(42oC) and building 5 (42
oC) was not significantly different (p<0.05). The mean Aug. temperature of
building with IBF (26o C) is not significantly different (p<0.05) from building with
IBF (25
oC). Similarly,
the mean Aug. temperatures of the south wall exterior of building 4 (41oC), building 5 (41
oC), and
building 6 (41oC) were not significantly different (p<0.05). Buildings with an IBF had a mean exterior
south wall maximum temperature of 360C compared to 67
0C for buildings with no IBF. Figure 8
illustrates the impact of an IBF on the external south wall mean temperature of buildings with IBF
compared to buildings with no IBF. The results are analogous to that seen with green roofs in damping
the temperature fluctuations peak maximum and minimum temperatures.
Fig. 8 Mean South Wall Exterior Temps of Bldgs. with IBF vs. Bldgs. with No IBF
Fig. 9 Mean South Wall Internal Temps of Bldgs. with IBF vs. Bldgs. with No IBF
A similar, though reduced, impact on internal temperature was also observed (Fig.9). Figures 10 and 11
provide a better depiction of the impact to the external and internal temperatures by selecting a shorter
period of time (4 days) compared to the month of data presented in the previous figures. Modification of
external surface temperatures cannot be simply extrapolated to decreased internal building temperatures.
As determined by Liu, the associated R-values of the intervening materials impact the amount, if any, of
temperature reductions. A means comparison of internal south wall temperatures during the month of
August for buildings with IBF (19oC) versus buildings with no IBF (21
o C) show a significant (p<0.05)
decrease in temperature between 10am and 6pm. Similarly, a comparison of internal temperature during
the month of July for building with IBF (26oC) versus buildings with no IBF (30
oC) demonstrate a
significant (p<0.05) decrease in temperature. The elevated internal temperatures in July are due to the
absence of air conditioning which was turned on in each building on July 26. A means comparison of
September maximum internal wall temperatures for buildings with IBF (18oC) versus buildings with no
IBF (21oC) exhibits a significant (p<0.05) decrease in temperature. Results are summarized in table 2.
The 10% to 14% reduction in inside wall temperature can reduce energy demand for cooling. For the
period July 26 through August 12, a building with an IBF used 16% less energy to cool the building than
did a building with no IBF. During the subsequent year for the period July 20 through August 26, the
mean energy reduction for two buildings with IBF compared to three buildings with no IBF was 15%.
138

Month Mean Max. Interior Temperature
of South Wall with No IBF (°C)
Mean Max. Interior Temperature of
South Wall with IBF (°C)
July 30* 26*
August 21 19
September 21 18
Table 2 Mean Maximum Interior Temp of a S. Wall with No IBF vs. a S Wall with IBF (*
Building Air Conditioners were turned on July 25 at 4:30pm)
For the period, September 6 through September 15, the air conditioner for a building with an IBF used
17% less energy than a building with no IBF (12.79kWh versus 15.39kWh). According to the Kill A
Watt meters, the buildings’ air conditioners consumed 12.79 kWh versus 15.39 kWh. The traditional
dial utility meter on each building indicated 12 kWh and 15kWh of energy were used respectively
resulting in a 20% reduction. The Kill A Watt meters provide more sensitive kWh readings than the
traditional dial utility meters. Consequently, for studies such as these where daily energy consumption
and the comparative differences are low, dial utility meters may be problematic. During the course of the
energy studies over two summers, energy use was periodically monitored using both the dial utility
meters and Kill A Watt meters. Sporadic problems were noted with some of the dial meters including
low readings and intervals when dial meters would stop for a period of hours before resuming operation.
Discussions with local utility meter readers indicated such issues were not uncommon and part of the
rationale for replacing dial meters with digital meters.
Fig. 10 Mean S Wall External Temp of Bldgs. with IBF vs. Bldgs. with No IBF
Fig. 11 Mean S Wall Internal Temp of Bldgs. with IBF vs. Bldgs. with No IBF
As with a living roof, the living wall provides additional layers thereby increasing the insulation value or
thermal resistance (R-value). Increasing the R-value of a wall or roof impedes the migration of heat into
or out of a building depending on the direction of the ∆T. Impedance of heat migration can be monitored
by observing the time interval from maximum exterior surface
temperature until maximum interior temperature is observed. For the period August 26-31, the mean time
to attain the maximum internal wall temperature after achieving the maximum outside wall temperature
139

was 21 minutes for buildings without IBF, while the mean time for buildings with IBF was 233 minutes.
This delay in attaining peak temperature is also observed with green roofs and is in part attributable to the
increase R-value of the materials comprising the biofilters. Not only do IBFs on the south side of a
building significantly reduce the exterior and interior wall temperatures, the attainment of the reduced
maximum temperature is delayed. This delay of peak temperature has ramifications for reductions in
energy costs and heat island effect. Treated wastewater from IBFs was continuously applied through a
PVC grid distribution system (1 gal/min) to green roofs as well as traditional shingled roofs to evaluate
impact to temperatures.
Evaporation Observations
The impact of evaporation (evapotranspiration) on global energy partitioning has been compared to the
daily detonation of atomic bombs in terms of the quantity of energy affected. The evaporation of 6 mm of
water over a one hectare field (2.5 acres) is the energy equivalent of 15 tons of dynamite (Mankiewicz et
al 2007). The rate of evapotranspiration (ET) from biofilters such as the IBFs or a green roof is affected
by several meteorological factors including the ambient air temperature, moisture content, and wind
velocity. Seasonal and biological factors such as plant morphology also impact ET rates. While
conducting studies of pollutant attenuation and building envelope impact of IBFs, water loss was
monitored. These observations were not intended to detail ET rates of biofilters. Rather, the data was
collected to provide an indication of the range of water loss occurring during these studies and subsequent
implications for zero wastewater discharge systems. The specific amount of energy (Btu) absorbed during
the evaporation of water is impacted by the initial temperature of the water. However, the difference is
minimal over the range of temperatures of the gray water in these studies (18 to 21o C). Consequently, a
value of 8,700Btu to evaporate 1 gallon of water is used to evaluate the potential impact of the IBFs.
Based on the mean water loss rates, an IBF with continuous flow and a footprint of 15 sq. ft. absorbed
104,400Btu per day (the equivalent of nearly 9 tons of air conditioning). At a water loss of 0.27 gals/sq.
ft. /day, the shingled roof (48 sq. ft.) with gray water application absorbed 112,752 Btu per day (the
equivalent of over 9 tons of air conditioning). The observed water loss for the respective type of study is
as expected. Continuous flow with the increased exposure to air and bio-filter surface should have a
greater water loss than intermittent flow. The presence of plants with large leaf areas such as Canna sp.
should provide the IBFs with a greater ET than an extensive green roof planted with Sedum sp. Water
cascading over a living wall is more exposed to solar radiation than water percolating through media on a
green roof. Water loss from a shingled roof has no ET component.
Conclusions
Treated gray water, applied to various building facades, was demonstrated to reduce the corresponding
surface temperatures resulting in reduced energy demand for interior air conditioning. Studies included
the continuous or intermittent circulation of gray water through an IBF positioned on the south wall of a
building, gray water circulated to a green roof, and gray water applied to an asphalt shingled roof. IBF
studies indicated significant temperature reductions to building facades for both intermittent and
continuous gray water flow. Mean exterior temperature reductions of 29% for the month of July, 39% for
the month of August, and 42% for the month of September were observed. Reductions of inside wall
temperatures amounted to 13%, 10%, and 14% respectively. The median reduction in maximum internal
south wall temperatures of buildings with an IBF were 54% for intermittent flow and 56% for continuous
140

flow compared to maximum internal south wall temperatures for control buildings with no IBF. The
decrease in internal south wall temperatures from the effect of an IBF consequently decreases the demand
for air conditioning resulting in less energy consumed. Energy use data collected for more than a month
(July 20-August 26) showed mean reductions of 15% when the IBF buildings were compared to buildings
with no IBF. These significant decreases in energy use may vary if an IBF were used with a different
building configuration. The south wall of the buildings in these studies account for 21% of the total
exposed surface area of each building. By comparison, the east and west sides each account for 17% of
the total, and the roof 18%. Also, the R-value of a building’s facade impacts the heat flux to the interior
conditioned spaces. Peak temperatures observed on the exterior of the control building’s south wall
coincided with peak temperatures on the interior of the south wall typically within the 15 minute span
during which the data was collected. Buildings with an IBF and continuous wastewater flow,
demonstrate a significant time lag in recording the internal daily maximum temperature versus the
external maximum temperature. This phenomenon has been observed with green roofs as well. The
intermittent flow produced more variable results, possibly due to the heating or cooling of the pooled
water during non-flow periods. This effect has possible ramifications for reducing energy use during
peak use.
Although the application of gray water to a green roof showed a decrease in internal temperatures, the
impacts were negligible. Periodic rainfalls during the study period provided sufficient moisture for green
roof plants and the corresponding evapotranspiration. The results do suggest that at times of extended dry
periods or in more arid regions, application of gray water would have a more significant impact on
reducing internal temperatures. Applying gray water to a traditional roof offers the prospect of an
inexpensive method to significantly decrease a building’s energy demand for air conditioning. Reduction
of roof surface temperatures by 27% resulted from the application of treated gray water to an asphalt
shingled roof compared to the mean surface temperature of three green roofs. Application of treated gray
water on a conventional roof can reduce the temperatures external to the ceiling insulation by 52%
resulting in decreased internal temperatures and subsequent diminished energy use for cooling.
Studies showed decreases of up to 11% in energy usage compared to a non-green roof control building.
There are many factors which can impact the actual energy reductions realized, including meteorological
factors, and building design. In total, the studies demonstrate that wastewater applied to buildings’
exterior surfaces can provide energy benefits. Combining an IBF on the south wall of a building to treat
gray water with subsequent spray application to a traditional roof could provide an inexpensive method to
significantly reduce cooling demand.
An IBF and associated treated gray water were shown to have a significant effect on decreasing both
external and internal building façade temperatures. Temporal delays in achieving the reduced peak
temperatures suggest favorable implications for urban heat island and peak power issues. Reductions in
energy usage for air conditioning result from the temperature reductions. Consequently, the IBF can
convert wastewater into a water resource. In the USA, it is estimated that 33 billion gallons of wastewater
are treated annually at a cost of approximately $25 billion. Other estimates place average treatment costs
at about a dollar per hundred gallons (Mankiewicz et al 2007). Regardless of the actual cost, it is a major
expense for society. Further the cost to upgrade and repair the USA’s crumbling wastewater
infrastructure (collection pipelines and treatment plants) is estimated to be over a trillion dollars. A family
141
of four is expected to generate over 120,000 gallons of wastewater per year. Although the annual bill the
average American family receives for this service is less than a $1,000, the cost to society from hidden
fees is much greater. Utilizing wastewater as a resource enables the true treatment costs to be avoided.
Further, integration of an IBF can provide treated gray water which could be used to offset the more than
50% of potable drinking water annually used by homeowners to water landscapes. This is particularly
important as climate change and population growth diminish water resources. For the approximate 25%
of the US population that use on lot septic systems, an IBF has the potential to manage their wastewater
as a resource. Large volumes of wastewater with low concentrations of pollutants characterize graywater
discharges from modern home showers, baths, and clothes washers. This gray water discharged to a
septic tank adversely impacts its ability to function properly and contributes to system failures from drain
field malfunctions. Separating specific gray water flows from other household discharges would enable
septic systems to operate more effectively, and provide homeowners an opportunity to utilize the bulk of
their wastewater as a resource. Such diverted graywater could be processed through an IBF and then at
minimum, used during growing seasons for landscape application. Unfortunately, most water and sewer
utilities in the USA base sewer charges on the consumption of drinking water, not the amount of sewage
that is discharged (since the former can be readily metered). Consequently, decreases in wastewater
discharge from a residence, often will not correspond to decreases in usage fees. However, reduction in
flows could eliminate the need to expand a facility thereby saving customers.
Developing nations such as China are rapidly increasing their use of air conditioning (McNeil 2008). In
the 34 member countries(including the US) of the Organisation for Economic Co-operation and
Development (OECD) almost 46% of the houses have air conditioning and this level is increasing by 7%
annually (Santamouris). During heat waves, the increased energy demand taxes utility systems and
threatens widespread blackouts.
Pre-WWII buildings, especially in southern regions of the US, often lack any insulation in wall cavities.
Application of IBFs on walls can reduce internal building temperatures and decrease energy consumption
of air conditioning. The described studies demonstrated energy use reductions for cooling up to 18% in
central Pennsylvania. Meteorological conditions, R-value of walls, and directional orientation of walls
will impact the amount of reductions on a daily and seasonal basis.
Integrated biofilters can provide functional architecture to not only attenuate wastewater pollutants, but
also reduce building energy needs.
142

References Cited
Berghage, R.D., A.Jarrett, D. Beattie, K. Kelley, S.Husain, F. Rezai, B. Long, A. Negassi, R.Cameron,
and W.Hunt. Quantifying Evaporation And Transpirational Water Losses From Green Roofs And Green
Roof Media Capacity For Neutralizing Acid Rain, National Decentralized Water Resources Capacity
Development Project (Ndwrcp) Research Project, 2007.
Berghage,R.D., Beattie, A., Jarett,T., and O’Connor., Greenroof runoff water quality. In Proceeding of
Greening rooftops for sustainable communities, Minneapolis, MN. 2007.
Cameron, Robert D. and Robert D. Berghage, Integrated Biofilter: Converting Wastewater to a Water
Resource Greening Rooftops for Sustainable Communities Conference, Minneapolis,2007
DeBusk,William F., Wastewater Treatment Wetlands: Contaminant Removal Processes; SL155, Soil &
Water Science Department, Florida Coop. Extension Service, Institute of Food and Agricultural Sciences.
U. of Fla., 1999.
Denardo, J.C., A.R. Jarrett, H.B. Manbeck, D.J.Beattie, and R.D. Berghage. Stormwater Mitigation And
Surface Temperature Reduction By Green Roofs. Transactions Of Asae 48(4): 1491-1496. 2005
Denardo, J.C., “Green Roof Mitigation of Stormwater And Energy Usage”, M.S. Thesis, Dept. Of
Hoticulture, The Pennsylvania State University, State College,PA.2003.
Jarrett,A.R. ,J.C. Denardo, H.B. Manbeck, J.M.Hamlett, D.J. Beattie, And R.D. Berghage. Green Roofs:
A Stormwater Lid. Asae Paper No. Nabec 04-0015.2004
Jarrett,A.R., W.F. Hunt,and R.D. Berghage. Annual And Individual-Storm Green Roof Stormwater
Response Models. Asabe Annual International Meeting , 2006.
Jung,D. , A. Cho, Y. Zo, S. Choi, and T. Ahn.. Nutrient Removal from Polluted Stream Water by
Artificial Aquatic Food Web System. Hydrobiologia 630: 149-159.2009.
Liu,K. Engineering Performance of Rooftop Gardens through Field Evaluation. National Research
Council Canada: Institute for Research in Construction. 2003.
Mankiewicz,P.S. and D.B. Simon, Integrating Stormwater and Greywater Treatment for Thermal
Regulation and the Enhancement of Biological Diversity: Using Mass Balance of Water As A Design
Criteria, Proceedings of the Fifth Annual Greening Rooftops for Sustainable Communities Conference,
2007
143

McNeil, Michael A. and Virginia E. Letschert; Future Air Conditioning Energy Consumption in
Developing Countries and what can be done about it: The Potential of Efficiency in the Residential
Sector; Lawrence Berkeley National Laboratory, http://escholarship.org/uc/item/64f9r6wr; 04-18-2008
Santamouris,M., Heat Island Research in Europe: the State of the Art, Journal of Advances in Building
Energy Research (ABER), vol 1, pg. 123-150, 2007.
Santamouris,M., Papanikolaou,N., Livada,I., Koronakis,I., Georgakis, C. and Assimakaopoulos,D.N., On
the Impact of Urban Climate on the Energy Consumption of Buildings, Solar Energy, vol 70, no 3, pg.
201-216, 2001.
Schumann,Laura and David Tilley, Modeled Effects of Roof vine Canopy on Indoor Building
Temperatures in July; Greening Rooftops for Sustainable Communities, Baltimore, 2008.
WHO/UNICEF JMP, 2004, www.waterindustry.org/Water-Facts/world-water-6.htm
WHO/UNICEF, 2010, Progress on Sanitation and Drinking Water, ISBN 9789241563956
Wolverton,BC,&Harrison,D.D. 1973. Aquatic Plants for removal of mevinphos from the aquatic
environment, J. MS Acad. Sci. 19:84-88
Wolverton, BC,& McDonald,RC, 1980, Vascular Plants for Water Pollution Control and Renewable
Sources of Energy, Proceedings: Bio-Energy ’80 World Congress and Exposition, NAS 1.15:87554,
NASA-TM-87554
Zhang,Chong-Bang, Effects of plant diversity on microbial biomass and community metabolic profiles in
a full-scale constructed wetland, Ecological Engineering 36, 62–68, 2010
144

Appendix G Statistical Analysis and Characterization of Selected Wastewater Data
BOD:
Total Numbers: 11
Mean (Average): 406.45455
Standard deviation: 225.53685
Variance(Standard deviation): 50866.87273
Population Standard deviation: 215.04095
Variance(Population Standard deviation): 46242.61157
Description of pre-treatment concentrations for BOD
Total Numbers: 10
Mean (Average): 16.797
Standard deviation: 10.52014
Variance(Standard deviation): 110.67338
Population Standard deviation: 9.98028
Variance(Population Standard deviation): 99.60604
Description of post 24hr. treatment concentrations for BOD (No sample collected from 1 run since all water
evaporated therefore 10 samples).
145
0
100
200
300
400
500
600
700
800
1 2 3 4 5 6 7 8 9 10 11 12 13 14
BO
D C
on
cen
trat
ion
(m
g/L)
Graywater Studies of IBF Units
BOD ConcentrationsPretreatment
BOD ConcentrationsPost 24hrs.
control 1
Control 2
control 1
Control 1: No Media; No Plants Control 2: Media; No Plants

Surfactants:
Total Numbers: 7
Mean (Average): 72.57143
Standard deviation: 15.30117
Variance(Standard deviation): 234.12571
Population Standard deviation: 14.16613
Variance(Population Standard deviation): 200.67918
Description of pre-treatment concentrations for Surfactant
Total Numbers: 7
Mean (Average): 0.94971
Standard deviation: 0.5054
Variance(Standard deviation): 0.25543
Population Standard deviation: 0.46791
Variance(Population Standard deviation): 0.21894
146
0
100
200
300
400
500
600
700
pretreatment control IBF1 post24hrs.
IBF2 post24hrs.
BO
D C
on
cen
trat
ion
(m
g/L)
Run 1
Run 2
35.4 28.5 18.5 5.6
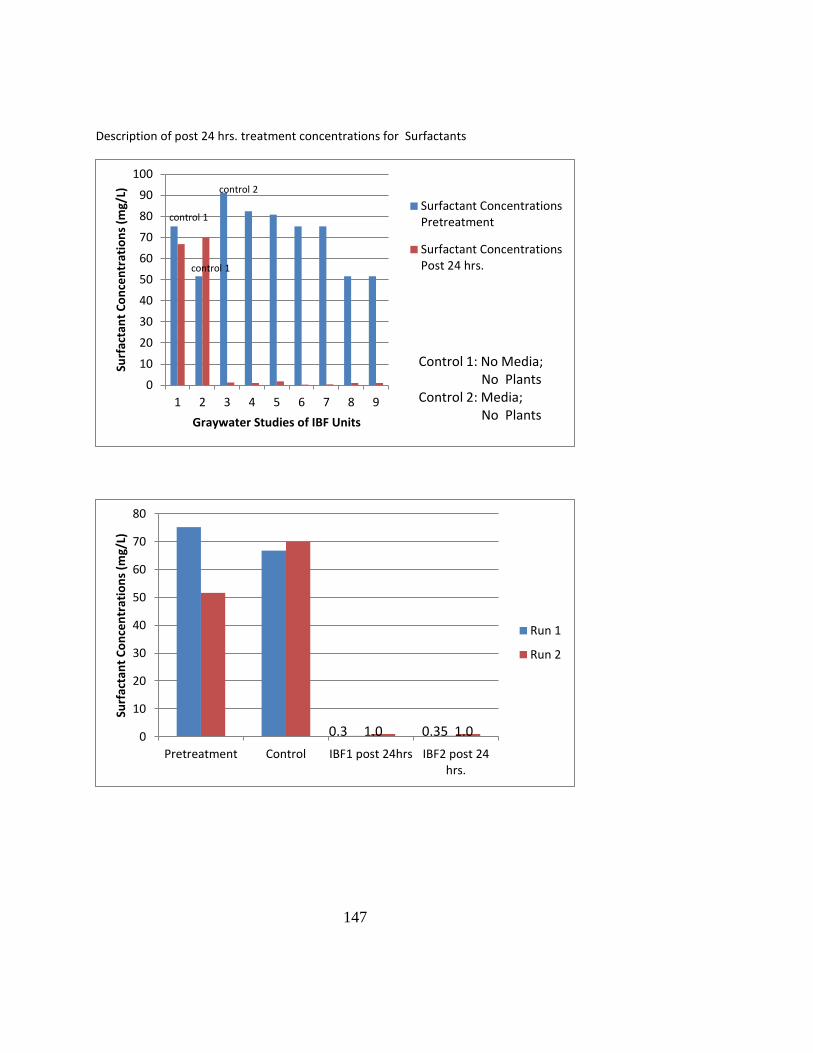
Description of post 24 hrs. treatment concentrations for Surfactants
147
0
10
20
30
40
50
60
70
80
90
100
1 2 3 4 5 6 7 8 9
Surf
acta
nt
Co
nce
ntr
atio
ns
(mg/
L)
Graywater Studies of IBF Units
Surfactant ConcentrationsPretreatment
Surfactant ConcentrationsPost 24 hrs.
Control 1: No Media; No Plants Control 2: Media; No Plants
control 1
control 1
control 2
0
10
20
30
40
50
60
70
80
Pretreatment Control IBF1 post 24hrs IBF2 post 24hrs.
Surf
acta
nt
Co
nce
ntr
atio
ns
(mg/
L)
Run 1
Run 2
0.3 1.0 0.35 1.0

Robert D. Cameron 521 W. Main Street
Boalsburg, Pa. 16827
Education
PhD 2012, The Pennsylvania State University, Horticulture
MS 1982, University of Houston, Environmental Management
BS 1976 The Pennsylvania State University, Microbiology
BS 1976 The Pennsylvania State University, Animal Science
Teaching Experience 2011 Instructor of Record for Plant Systematics, The Pennsylvania State University
2006- 2010 8 semesters, Teaching Assistant, The Pennsylvania State University
2006 -2007 Plant Science , Pennsylvania Governor’s School
2006 -2007 Advisor for student engineering group regarding sustainable technologies
2003 Instructor of Record for Industrial Emissions, The Pennsylvania State University
2003-2010 Designed, constructed, and manned educational exhibits for Smithsonian, Pa.Farm Show,..
1995- 2010 Guest Lecturer at numerous universities including LSU, Cornell, Bucknell, Northwestern
Selected Conference Papers and Presentations 2010 Tenth Annual Greening Rooftops for Sustainable Communities Conference:
Innovative and Cost Effective Biofilters For Smallscale Residential Applications
2010 VIII MEETING ON ORGANIC AND SUSTAINABLE AGRICULTURE 2010 Havana City:
Integrated Biofilters and Urban Gardening
2009 Ninth Annual Greening Rooftops for Sustainable Communities Conference:
INTEGRATED BIOFILTERS :Converting wastewater to a water resource.
Commercial Sustainable Technology Experience 1995-2005 President and creator of Olde Cloverleaf Village, Danville,Pa.
Deconstructed and moved over 20 historic buildings and train cars
Reconstructed with green technologies to create historic village
Village focused on Arts, Education, and Music
Industrial Experience 1977-1998 Directed EH&S programs for diversified multi-national operating on 6 continents
Conducted environ. research in water, air, and soil medias
Collaborated with NASA to design and construct 1st constructed wetlands to treat
wastewater from natural gas industry
Audited more than 500 manufacturing sites worldwide
Interfaced with local, state, federal, and international agencies/governments
Managed teams of scientists/engineers throughout US and international
Directed due diligence for numerous acquisitions and divestitures including Georgia
Pacific assets, Mobil Plastics, Amoco Foam, and Jiffy Packaging
Expert Witness
Awards & Patents
Governor’s Award for Environmental Excellence
Outstanding Graduate Teacher- The Pennsylvania State University
Provisional Patent for Integrated Biofilter