water and sewerage state of the industry report …...tasmanian water and sewerage state of the...
TRANSCRIPT

OFFICE OF THE TASMANIAN ECONOMIC REGULATOR
TASMANIAN
WATER AND SEWERAGE
STATE OF THE INDUSTRY REPORT
2016-17
A P R I L 2 0 1 8

CONTACT DETAILS
Office of the Tasmanian Economic Regulator
Office hours: 8.45am to 5.00pm, Monday to Friday
(except public holidays)
Street address: Level 3, 21 Murray Street, Hobart, Tasmania 7000
Postal address: GPO Box 770, Hobart, Tasmania 7001
Telephone: (03) 6166 4422 or international +61 3 6166 4422
Email: [email protected]
Website: www.economicregulator.tas.gov.au
Printed April 2018
Office of the Tasmanian Economic Regulator
ISBN 978-0-7246-5460-4
Copyright
© Office of the Tasmanian Economic Regulator
Cover image: Prince of Wales Bay sewage treatment plant (EPA Tasmania)

TASMANIAN WATER AND SEWERAGE STATE OF THE INDUSTRY REPORT 2016-17
TABLE OF CONTENTS
ACRONYMS ................................................................................................................................ 5
FOREWORD ............................................................................................................................... 7
OVERVIEW ................................................................................................................................ 11
1 INTRODUCTION ........................................................................................................ 17
1.1 SCOPE OF THIS REPORT ............................................................................................................. 17
1.2 INFORMATION SOURCES .......................................................................................................... 18
1.4 INDUSTRY STRUCTURE .............................................................................................................. 19
1.5 REGULATORY FRAMEWORK .................................................................................................... 19
1.6 INDUSTRY REGULATORS ........................................................................................................... 20
1.7 OTHER REGULATORY OBLIGATIONS AND RESPONSIBILITIES ................................. 23
1.8 PERFORMANCE AND REGULATORY REPORTING .......................................................... 25
2 WATER SUPPLY ........................................................................................................... 27
2.1 SOURCES OF WATER ................................................................................................................... 27
2.2 WATER USAGE ................................................................................................................................ 27
2.3 WATER ASSETS ............................................................................................................................... 29
2.4 PERFORMANCE OF WATER INFRASTRUCTURE ............................................................... 32
3 SEWERAGE SERVICES ................................................................................................. 39
3.1 SEWAGE COLLECTED .................................................................................................................. 39
3.2 SEWERAGE ASSETS ........................................................................................................................ 40
3.3 RECYCLED WATER ....................................................................................................................... 41
3.4 PERFORMANCE DATA ................................................................................................................. 43
4 CUSTOMER SERVICE .................................................................................................. 47
4.1 CALL CENTRE PERFORMANCE ................................................................................................ 47
4.2 COMPLAINTS ................................................................................................................................... 48
4.3 PAYMENT MANAGEMENT .......................................................................................................... 49

TASMANIAN WATER AND SEWERAGE STATE OF THE INDUSTRY REPORT 2016-17
5 PUBLIC HEALTH ..........................................................................................................51
5.1 DRINKING WATER TREATMENT ............................................................................................ 51
5.2 BACTERIOLOGICAL COMPLIANCE OF WATER SUPPLY SYSTEMS ........................... 52
5.3 CHEMICAL COMPLIANCE OF WATER SUPPLY SYSTEMS .............................................. 54
5.4 FLUORIDATION OF PUBLIC DRINKING WATER SUPPLY SYSTEMS ......................... 56
6 ENVIRONMENT ...........................................................................................................59
6.1 SEWERAGE SCHEMES ................................................................................................................... 59
6.2 OUTFALLS TO THE ENVIRONMENT ..................................................................................... 60
6.4 SEWAGE TREATMENT PLANT COMPLIANCE .................................................................... 61
6.5 BIOSOLIDS REUSE .......................................................................................................................... 67
6.6 NET GREENHOUSE GAS EMISSIONS ...................................................................................... 69
7 PRICING AND FINANCE ..........................................................................................71
7.1 PRICING ............................................................................................................................................. 71
7.2 FINANCIAL PERFORMANCE ...................................................................................................... 74
7.3 STATUS OF MAJOR PROJECTS ................................................................................................. 80
8 PRIORITIES FOR IMPROVING PERFORMANCE .................................................87
8.1 ENVIRONMENT PROTECTION AUTHORITY ..................................................................... 87
8.2 PUBLIC HEALTH ............................................................................................................................. 89
8.3 WATER ALLOCATIONS/LICENCES AND DAM SAFETY ................................................. 90
8.4 ECONOMIC REGULATION ........................................................................................................ 91
APPENDIX 1 PERFORMANCE INDICATORS ...........................................................93
APPENDIX 2 SEWAGE MANAGEMENT ISSUES ......................................................99
APPENDIX 3 DAM SAFETY ......................................................................................... 105
APPENDIX 4 STP PERFORMANCE SUMMARY ..................................................... 107
APPENDIX 5 CUSTOMER SERVICE STANDARDS ............................................... 119

TASMANIAN WATER AND SEWERAGE STATE OF THE INDUSTRY REPORT 2016-17 5
ACRONYMS
Term Meaning within the context of this report
ADWF Average dry weather flow
ADWG Australian Drinking Water Guidelines 2011
AMT Accepted Modern Technology
ANCOLD Australian National Committee on Large Dams
ANZBP Australian and New Zealand Biosolids Partnership
COAG Council of Australian Governments
Code Customer Service Code
CSO Community Service Obligation
DHHS Department of Health and Human Services (Tas)
DPIPWE Department of Primary Industries, Parks, Water and Environment (Tas)
DSMP Dam Safety Management Plan
DWQG Tasmanian Drinking Water Quality Guidelines 2005
EBIT Earnings Before Interest and Tax
EMPCA Environmental Management and Pollution Control Act 1994 (Tas)
EPA Environment Protection Authority (Tas)
EPN Environment Protection Notice
ERR Economic Rate of Return
NDTE Net Debt to Equity
NPAT Net Profit After Tax
NPR National Performance Report
STP Sewage treatment plant or wastewater treatment plant
WDRC Written down replacement cost
WTP Water treatment plant
WWMP Wastewater Management Plan
Basic measures:
kL kilolitre = 1 000 litres or 1 m3 (cubic metre) and weighs 1 tonne
ML megalitre = 1 000 kL (or 1 000 m3)
GL gigalitre = 1 000 ML
TL teralitre = 1 000 GL or 1 km3 (cubic kilometre)


TASMANIAN WATER AND SEWERAGE STATE OF THE INDUSTRY REPORT 2016-17 7
FOREWORD
The water and sewerage industry in Tasmania has been operating under the current
regulatory framework for nine years. In that time significant reform has occurred to the
structure of the industry, moving from 29 local councils to three water and sewerage
corporations and then to one state-wide operator. The current mode of operation has been
in place for four years, since July 2013.
However, the network of many large, dispersed assets delivering water and sewerage services
to regional and urban towns across Tasmania has remained largely unchanged in this time, a
legacy that remains regardless of changes to operating boundaries and regulatory
frameworks. This is the challenge that TasWater faces and will continue to face for many years
to come.
While TasWater has made some significant gains in understanding and managing its network,
it is also facing challenges associated with ageing infrastructure that, in some cases, doesn’t
meet the required standards nor community expectations. Drinking water in some regional
towns in Tasmania is still affected by poor water quality and are subject to boil water or public
health alerts. While the population affected by these alerts is relatively small, it is a core
responsibility that must be addressed by TasWater. During 2016-17, microbiological
compliance was achieved for 99.4 per cent of the population supplied with drinking water via
the reticulated network. This is an improvement of 0.2 per cent compared to 2015-16.
The number of water supplies affected by either long term boil water alerts or do not consume
notices grew from 23 to 25 during 2016-17.1 During the year, a permanent boil water alert
was lifted from Scamander after 10 years of alerts while a public health alert was lifted for
Whitemark. However, boil water alerts were added in a further four supplies, Colebrook,
Rocky Creek, National Park and Bronte Park, during the year; both the Rocky Creek and
Colebrook water supplies were changed from a temporary boil water alert to a permanent
boil water alert while TasWater took over the management and control of the Bronte Park
water supply which was placed on a permanent boil water alert.
I note that TasWater has committed to accelerate its regional towns water supply program to
improve the water quality in regional towns and remove all alerts by August 2018. Achieving
this target will be a significant task. However, by early 2017-18, TasWater had already lifted
alerts for ten water supplies.
The performance of the State’s sewage treatment plants (STPs) consistently failed to meet
environmental discharge limits. In 2016-17, only two of TasWater’s 79 STPs achieved 100 per
cent compliance against regulatory discharge limits, noting that one of those two plants is
subject to older, less stringent limits.
However, overall environmental compliance has improved after several years of declining
performance. In 2016-17, overall environmental compliance (ie flow weighted compliance) of
1 Note that this figure may differ from the number reported by TasWater, which is based on the number of towns supplied by the water supply (28). This is because one water supply may service several towns.

8 TASMANIAN WATER AND SEWERAGE STATE OF THE INDUSTRY REPORT 2016-17
TasWater’s 79 STPs was 85.9 per cent which is slightly better than the result in July 2013 when
TasWater was formed. This is further evidenced by the number of STPs that achieved greater
than 90 per cent compliance, increasing from 24 to 30 STPs in 2016-17. One large STP that
achieved significant improvement was the Macquarie Point STP, improving from 88.3 to
94.0 per cent compliance in 2016-17. Sewage treatment compliance improvements are
expected to continue into the future, with TasWater and the environmental regulator, the
Environment Protection Authority, signing a memorandum of understanding in December
2016 that establishes an agreed approach for the next three years targeting the State’s largest
STPs and those that pose localised environmental risk, with a focus on improving
environmental performance. A compliance program targeting commercial trade waste
customers was also established by TasWater during the year which also is expected to reduce
the impact of trade waste on the performance of its STPs.
Improvements to drinking water quality and environmental compliance do not, of course,
come without a cost. TasWater spent over $103 million in 2016-17 on capital projects, a large
proportion of which was on projects targeting improved safety, health and environmental
compliance. A considerable amount of capital expenditure was on asset renewal, as TasWater
faces the challenge of replacing and repairing ageing infrastructure inherited from councils
much of which was, and continues to be, in poor condition. TasWater has spent a total of
$413 million on capital projects since 2013, with a further $135 million planned for 2017-18.
TasWater continued to invest in dam safety, with $2.4 million spent in 2016-17 on compliance
activities to ensure public safety. A number of dams affected by floods in June 2016 were
repaired during the year and upgrade works to the Margaret Street Detention Basin in
Launceston were also completed.
Prices for water and sewerage services rose by 3.6 per cent in 2016-17, with residential
customers paying, on average, $1 104 per annum. Rising operating costs and investment in
new infrastructure underlie growing water bills for customers, although Tasmanians are still
paying around $150 less per annum for water and sewerage services than their mainland
counterparts. While progress has been made towards consistent industry pricing, around six
per cent of customers are still paying less than the target tariffs for water and sewerage
meaning that cross‐subsidies still exist.
An increase in regulated target tariffs has flowed through to revenue, with TasWater’s total
income rising by approximately two per cent in 2016-17. Operating costs also increased,
although not as sharply as previous years, as a result of initiatives by TasWater to reduce costs
and improve efficiency. Nevertheless, TasWater’s operating costs are still much higher than
those of similarly sized utilities on the mainland; this is due, at least in part, to the number and
condition of the assets it operates across the State.
TasWater has sufficient revenue to maintain financial sustainability, with a net profit after tax
of $28.6 million in 2016-17. During the year, TasWater returned $19.5 million to its
shareholders as dividends which represented 68 per cent of its profit after tax (not including
income tax equivalents and guarantee fees which totalled $10.5 million). Continuing the trend
of recent years, TasWater’s net debt to equity ratio continues to rise although, at
TASMANIAN WATER AND SEWERAGE STATE OF THE INDUSTRY REPORT 2016-17 9
29.8 per cent, the ratio is lower than almost all of its mainland counterparts and is much lower
than the median of all major utilities at 79 per cent.2
One area of concern this year is the quality of performance data provided by TasWater in
relation to its service targets under the Customer Service Code. During the year, TasWater
implemented a new asset management information system (AMIS) which resulted in
incomplete and lost data for six months of the reporting period. This has significantly
constrained my ability to assess TasWater’s performance against a range of service targets for
2016-17. In some cases, the data is of such poor reliability that I have excluded the data from
this Report. TasWater has advised that the technical issues will be rectified for the 2017-18
reporting period onwards.
Customers generally didn’t have to wait long on the phone to TasWater’s call centre, with
89 per cent of calls answered within 30 seconds. TasWater has outperformed its mainland
counterparts in this respect for the last two financial years. TasWater received 2 500
complaints in 2016-17, most of which were in relation to water quality. Issues with billing and
accounts also generated a significant number of complaints, although overall, the total
number of complaints has fallen by 14 per cent compared to the previous year.
Interruptions to water and sewerage services can’t be reliably quantified for 2016-17 due to
data issues, but the data seems to indicate that at least high priority (ie with potential to cause
harm) water bursts and leaks were attended to quickly most of the time. However, TasWater’s
data indicates a high rate of unplanned water interruptions, with 48 water main breaks per
100 km of water main reported which is much higher than previous years when the rate was
around 30 per 100 km of main. Favourable weather conditions, as well as preventative
maintenance, have helped reduce the rate of sewer main breaks, reported to be
45 per 100 km of sewer main in 2016-17.
Overall, TasWater has made some progress towards improving its compliance outcomes in
2016-17. It has worked with key industry regulators to ensure its program of works aligns with
agreed priorities and actions that should result in improved outcomes for public safety,
drinking water quality and environmental compliance. I particularly note the improved level
of communication and interaction that has occurred between TasWater and its stakeholders
in formulating its capital works schedule. Delivery of projects in accordance with the agreed
schedule will continue to be an area of regulatory scrutiny.
Joe Dimasi
TASMANIAN ECONOMIC REGULATOR
2 Bureau of Meteorology, National performance report 2016-17: urban water utilities, March 2018.


TASMANIAN WATER AND SEWERAGE STATE OF THE INDUSTRY REPORT 2016-17 11
OVERVIEW
The Tasmanian Water and Sewerage State of the Industry Report 2016-17 is the latest in a series of reports published by the Tasmanian Economic Regulator that provide an independent review of the industry’s performance.
It addresses the key areas of affordability, customer service, network reliability and efficiency, financial performance, drinking water quality and environmental performance. It also outlines opportunities for improved performance, as identified by industry regulators and the State’s single water and sewerage service provider, TasWater.
During 2016-17, TasWater provided around 205 000 properties (181 999 residential
properties) with a reticulated water supply. Around 85 per cent of the State’s households
received water supply services from TasWater.
Key performance measures
2015-16 2016-17
Water and sewerage connected properties 202 478 204 949
Total urban water supplied 52 383 ML 56 155 ML
Average residential consumption 176 kL 179 kL
Water network reliability (water main breaks/100 km of main) 33 48
Sewer network reliability (sewer breaks and chokes/100 km of main)
61 45
Average customer minutes off water supply (minutes) 199 NR
Average sewerage interruption (minutes) 277 NR
Number of unplanned interruptions - water (per 1 000 properties) 167 148#
Treated wastewater volume compliant with EPA requirements (flow-weighted compliance percentage)
84.2 % 85.9 %
Percentage of population receiving drinking water that complied with ADWG microbiological guidelines
99.2 % 99.4 %
Drinking water supplies on long term boil water alerts or public health alerts
23 of 87 25 of 87
Customer complaints 2 892 2 500
Calls answered within 30 seconds 88 % 89 %
Total revenue $309.3 m $315.5 m
Operating costs $177.7 m $187.6 m
Capital expenditure $128.6 m $103.7 m
Net Debt to Equity ratio 27 % 30 %
NR - Not reported, data is considered to be inadequate or unreliable.
# - due data loss relating to the reporting of water interruptions, the Regulator considers it reasonable to assume that this figure
was likely higher.

12 TASMANIAN WATER AND SEWERAGE STATE OF THE INDUSTRY REPORT 2016-17
Water supply
Sources of water
In 2016-17 the state-wide total volume of water sourced was 82 623 ML, similar to the previous year: the total volume of urban water supplied increased by 7 per cent to 56 155 ML.
Across the State, almost 94 per cent of sourced water came from surface water in 2016-17. The remaining water was sourced from recycled water (6 per cent) and groundwater (<1 per cent).
Residential water supply
Average annual residential water supplied has been stable over the past five years, with 179 kL per property consumed on average in 2016-17. This is 11 per cent above the median residential consumption for major Australian water utilities, which was 161 kL.1
Water network
Between 2015-16 and 2016-17, the total number of properties connected to water mains grew by one per cent, to reach 204 949 properties. The length of water mains across Tasmania increased slightly to 6 266 km.
The number of water main breaks, bursts and leaks, increased to 48 per 100 km of water mains in 2016-17.
Performance on water loss from the distribution system has significantly improved in 2016-17, with TasWater reporting an infrastructure leakage index (ILI) of 1.6 (ratio of real losses to unavoidable real losses) which is 45 per cent lower than the ratio of 2.99 reported in 2015-16. The volume of water unaccounted for was 16 879 ML, around 23 per cent of potable water produced.
Water supply interruptions
Interruptions to water supply affected at least 30 347 customers in total during 2016-17,
which means on average, more than 148 in 1 000 properties (15 per cent of customers) across
Tasmania experienced an unplanned interruption to their water supply in 2016-17. However,
due to missing or incomplete data, is it thought that the actual number of unplanned water
supply interruptions was likely higher.
Ninety three per cent of ‘priority 1’ bursts and leaks were responded to within 60 minutes
which satisfies the service standard of 90 per cent.
Performance against several water supply indicators has not been reported due to problems
experienced with TasWater’s information systems and data collection.
1 Bureau of Meteorology, National performance report 2016-17: urban water utilities, March 2018.

TASMANIAN WATER AND SEWERAGE STATE OF THE INDUSTRY REPORT 2016-17 13
Dam safety
During 2016-17 TasWater spent $2.4 million on dam safety compliance activities and carried out interim measures to reduce the risk to a number of dams that are categorised as having ‘high’ consequences were they to fail. During the year, plans progressed for the upgrade of the Conglomerate Dam, and upgrade works for the Margaret Street Detention Basin were completed.
Sewerage services
Sewage collected and recycled
The volume of sewage collected in 2016-17 was 56 582 ML, or 311 kL per property. Thirty three of the State’s 79 sewage treatment plants recycled at least some proportion of the treated sewage effluent. In 2016-17, 8.4 per cent of the sewage volume collected was reused as recycled water for agricultural and industrial use.
Sewerage network
As at 30 June 2017 there were 179 677 properties connected to the sewerage network. The length of sewerage mains and channels was 4 745 km.
Sewerage service interruptions
In 2016-17 there were, on average, 45 sewerage mains breaks and chokes per 100 km of sewer main. TasWater’s preventative efforts as well as favourable weather conditions during the year, helped reduce the incidence of root growth into sewers causing blockages.
Eighty four per cent of sewer spills, breaks and chokes were attended to within the 60 minute standard, with the average response time around 56 minutes.
Performance against other sewerage service indicators has not been reported due to
problems experienced with TasWater’s information systems and data collection.
Customer service
Customer complaints
In 2016-17 TasWater received 2 500 complaints, down 14 per cent from 2 892 for the previous year. The largest group of complaints were in relation to water quality (54 per cent) and billing and accounts (16 per cent). Ninety three per cent of complaints were resolved within ten days (or within an agreed timeframe).
Call centre performance
TasWater’s call centre answered 89 per cent of calls within 30 seconds in 2016-17 against a target of 85 per cent. TasWater has been the highest performing against this metric amongst similar mainland utilities for the last two financial years.

14 TASMANIAN WATER AND SEWERAGE STATE OF THE INDUSTRY REPORT 2016-17
Public health
Drinking water quality
Of the 87 Tasmanian drinking water supplies, 81 were adequately monitored for bacteriological compliance and 79 for chemical water quality.
Seventy one of the State’s 87 drinking water supplies achieved microbiological compliance, while ten water supplies had chemical contaminants detected above the ADWG health guideline values (four of which reported metal concentrations above safe health limits).
There were 25 water supplies on long term boil water alerts or public health alerts compared to 23 the previous year. Twenty four systems were operated under a boil water alert (three temporary and 21 permanent) while another four systems had a public health alert (do not consume) in place.
During the year, a permanent boil water alert was lifted from Scamander after 10 years of alerts while a public health alert was lifted for Whitemark. However, boil water alerts were added in a further four supplies, Colebrook, Rocky Creek, National Park and Bronte Park, during the year. The boil water alert in Bronte Park was placed as a result of TasWater taking over from a private operator and hence applying more stringent compliance requirements.
Key projects such as the Ringarooma Valley, Mole Creek, King Island and Flinders Island water systems and the Regional Towns Program (24 Glasses) will address many of the issues with currently non-compliant water supplies and will improve the overall level of compliance within the State. TasWater has already made some progress in this respect, with ten alerts lifted early in the 2017-18 financial year.
Microbiological compliance was achieved for 99.4 per cent of the population supplied with drinking water via the reticulated network. This is 0.2 per cent higher than in 2015-16.
Environment
Sewage treatment plant compliance
In 2016-17, TasWater failed to achieve full compliance with the regulatory discharge limits in
relation to all except two Level 2 STPs under its control.
Overall, TasWater achieved 85.9 per cent compliance with the regulatory discharge to waters
limits (flow-weighted) which is a two per cent improvement on the previous financial year.
Twelve Tasmanian STPs were classified as substantially non-compliant (ie less than 75 per cent
compliant), while the number of STPs with compliance above 90 per cent increased from 24
to 30 (out of 72).
In 2016-17 TasWater reported 134 sewer overflows to the environmental regulator, the EPA.
This equates to around 2.8 overflows per 100 km of sewer main which is an improvement
compared to the rate of 4.3 per 100 km of sewer main reported in 2015-16. TasWater
reported that progressive upgrades have helped to reduce the number of overflows.

TASMANIAN WATER AND SEWERAGE STATE OF THE INDUSTRY REPORT 2016-17 15
Pricing
Typical residential bill
The typical annual bill for residential customers with average water consumption
(176 kL per annum) was $1 104 in 2016-17. The typical bill is based on $507 for water and
$596 for sewerage. TasWater customers are paying around $150 less per annum than their
interstate counterparts for water and sewerage, with prices nine per cent below the national
median.
The water usage component (based on measured volume) accounted for 16 per cent of the
total bill. This reflects the fact that the fixed cost of providing the service to a property (such
as the cost of maintaining dams, pipes, reservoirs and other essential infrastructure) is much
higher than the variable cost of delivering water to a property.
In 2016-17, annual residential bills rose by around four per cent nominally, which will continue
for each year of the second regulatory period from 1 July 2015 to 30 June 2018.
Finance
Revenue and expenditure
TasWater’s total income in 2016-17 was $315 million, up two per cent compared to the
previous year. Operating costs grew by 5.5 per cent to $188 million while capital expenditure
was 19 per cent lower than the previous year, at almost $104 million.
Financial performance
In 2016-17, TasWater’s net profit after tax rose to just under $28.6 million, up 13 per cent
compared to 2015-16 ($25.3 million). TasWater returned $19.5 million to its shareholders as
dividends which represented 68 per cent of its profit after tax (not including income tax
equivalents and guarantee fees which totalled $10.5 million).
TasWater’s net debt to equity ratio rose to 30 per cent in 2016-17, up from 27 per cent in
2015-16.


TASMANIAN WATER AND SEWERAGE STATE OF THE INDUSTRY REPORT 2016-17 17
1 INTRODUCTION
This Report assesses the Tasmanian Water and Sewerage Corporation Pty Ltd’s (trading as TasWater) performance during 2016-17 across a number of key measures. The purpose of this Report is to make TasWater accountable for its performance by providing stakeholders with relevant information.
The objectives of this Report are to:
provide an overview of TasWater’s performance; and
identify key priorities for improved performance by TasWater.
The Economic Regulator has prepared this Report in consultation with the Director of Public Health, the Director of the Environment Protection Authority (EPA) and the Secretary of the Department of Primary Industries, Parks, Water and Environment (DPIPWE).
This Report is the fourth to assess TasWater’s performance, following the amalgamation of the three previous regional corporations into the single corporation on 1 July 2013.1
1.1 Scope of this report
The structure and content of this Report is based on the Urban National Performance Framework (see section 1.6 of this Report), with some additional State-based measures. However, reporting against a number of indicators is limited due to the absence of some performance data.
This Report focuses on indicators across a number of key performance areas, including:
water supply – water sources, infrastructure, treatment, consumption and reliability;
sewage services – infrastructure, collection, treatment and reliability;
customers – customer complaints, call centre performance and payment management;
public health – water quality compliance with bacteriological, chemical and fluoridation standards;
environment – wastewater treatment, effluent discharge, impacts on waterways, effluent and biosolids reuse; and
pricing and finance – tariff structures, revenue and expenditure, future capital expenditure and status of major projects.
This Report does not include information on the collection and use of stormwater or the supply or use of water for irrigation purposes. These activities are excluded from the regulation of the water and sewerage industry by clause 3 of the Water and Sewerage Industry
1 Ben Lomond Water, Cradle Mountain Water, Southern Water and Onstream were amalgamated to form TasWater.

18 TASMANIAN WATER AND SEWERAGE STATE OF THE INDUSTRY REPORT 2016-17
Declaration Order 2011 (Order) and section 3 of the Water and Sewerage Industry Act 2008 (Industry Act) respectively.
While services in relation to recycling or re-use of water are also excluded from the regulation of the water and sewerage industry by clause 3 of the Order, Chapter 3 of this Report provides commentary on these issues in the context of the treatment of wastewater.
1.2 Information sources
This Report is based on two principal sources of information:
performance data provided by TasWater against key performance measures, specified by the Economic Regulator in its Reporting Guideline, and TasWater’s explanations about its performance; and
performance data collected as part of regulatory reporting requirements by the Department of Health and Human Services (DHHS), DPIPWE and the EPA.
Where shown, performance reported between 2009-10 and 2012-13 inclusive is for the three previous regional corporations.
TasWater’s performance indicator data is subject to independent audit at least once every three years in accordance with the Urban National Performance Framework auditing requirements. If errors are identified in the data provided for the Urban National Performance Framework, revised data is included in the Tasmanian water and sewerage state of the industry reports, resulting in discrepancies in the data across these reports. The data provided by TasWater up to 2015-16 has been independently audited, with some data assessed to be at a basic level. While the independent audit of TasWater’s 2016-17 data has occurred, audited data was not available at the time for inclusion in this Report. Any changes to the data for 2016-17 based on the findings of the independent audit will be included in future reports.
The reliability and accuracy of all data therefore, cannot be assured. Readers should consider this when interpreting the data and commentary presented in the Report.
TasWater has adjusted its processes to ensure that in the future independently audited and consistent data will be available for inclusion as part of its annual performance reporting requirements, the Urban National Performance Framework and the state of the industry reports.
Numerous comparisons throughout this Report refer to the performance of similarly sized service providers in other Australian jurisdictions. The selection of similarly sized service providers in these comparisons is based on the number of connections and does not account for other factors that may differ between service providers such as asset number and complexity, geography and climate.
Readers should therefore also consider this when making comparisons between TasWater’s performance and the performance of mainland service providers.

TASMANIAN WATER AND SEWERAGE STATE OF THE INDUSTRY REPORT 2016-17 19
1.4 Industry structure
Since 1 July 2013, TasWater has owned, controlled and operated water supply and sewerage systems in Tasmania. TasWater manages all aspects of the water supply chain from dams and reservoirs to customer property connections. TasWater also manages sewerage systems from customer sewer connections to wastewater treatment and disposal.
Services provided include:
harvesting, storage and treatment of raw water supplies;
transmission of bulk water supplies;
the operation of the sewerage service and treatment of the majority of sewage;
retail services; and
trade waste.
TasWater’s principal objectives2 are to:
promote the efficient delivery of water supply and provision of sewerage services; and
encourage water conservation, demand management of water and the re-use of water on an economic and commercial basis.
1.5 Regulatory framework
The key Tasmanian piece of legislation governing the water and sewerage industry is the Industry Act. The Industry Act requires any persons or entities owning and/or operating water and/or sewerage infrastructure, or supplying water and/or sewerage services to others, to be licensed, unless exempted.
The licence places a number of regulatory obligations on licensees through reference to various regulatory instruments, such as codes and guidelines, as well as requiring the preparation of management plans in relation to matters such as asset and emergency management and compliance.
Industry regulators for the sector include the Tasmanian Economic Regulator, Director, EPA, Director of Public Health, and Secretary, DPIPWE.
Compliance and regulatory obligations are imposed by legislation including the Tasmanian Environmental Management and Pollution Control Act 1994, Public Health Act 1997, Fluoridation Act 1968, Water Management Act 1999 and the Water Management (Safety of Dams) Regulations 2015. A diagram setting out the economic regulatory framework for the Tasmanian water and sewerage industry is shown in Figure 1.1.
2 Prescribed in section 6 of the Water and Sewerage Corporation Act 2012 (Tas).

20 TASMANIAN WATER AND SEWERAGE STATE OF THE INDUSTRY REPORT 2016-17
This industry economic regulatory framework does not cover:
water used for irrigation or electricity generation purposes;
private water supplies, including drinking water supplies at premises that do not receive water from a reticulated system managed by a licensed provider - namely, private bores and tanks and small privately owned water systems; or
on-site sewerage treatment (septic tanks) or small private sewerage treatment plants.
Figure 1.1 Tasmanian water and sewerage industry economic regulatory framework
1.6 Industry Regulators
The regulatory framework for the water and sewerage industry covers economic regulation, technical regulation, water planning and customer service.
1.6.1 Tasmanian Economic Regulator
The Tasmanian Economic Regulator has been responsible for the economic regulation of the water and sewerage sector since July 2008. The Regulator’s role includes industry licensing, consumer protection and retail pricing.3
3 For further details, refer to the Economic Regulator’s previous state of the industry reports and its Draft Report in relation to its 2018 Water and Sewerage Price Determination Investigation, released 30 November 2017. The Economic Regulator’s Final Report in relation to the regulatory period 1 July 2018 to 30 June 2021 is due to be released on 30 April 2018.

TASMANIAN WATER AND SEWERAGE STATE OF THE INDUSTRY REPORT 2016-17 21
Water and sewerage services prices – the Economic Regulator’s Price Determination sets out the services, revenue requirements and pricing structure for TasWater for each regulatory period.
Customer service standards – the Customer Service Code, issued by the Economic Regulator, sets out obligations for the delivery of services to customers across Tasmania including service targets and standards.
Performance monitoring and reporting - a periodic state of the industry report (this Report) prepared by the Economic Regulator in consultation with the other industry regulators.
In carrying out its functions under the Industry Act, the Economic Regulator is required to promote the efficient pricing of regulated services, ensure appropriate service standards are maintained and promote efficient long-term investment in infrastructure.
1.6.2 Director of Public Health
The Director of Public Health (and DHHS) is responsible for regulating drinking water quality and ensuring safety through monitoring and enforcing compliance with drinking water guidelines and policies established under the Public Health Act 1997 and the Fluoridation Act 1968. This includes monitoring and enforcing compliance with the standards and requirements prescribed by the:
Public Health Act (and its associated Tasmanian Drinking Water Quality Guidelines 2015);
Fluoridation Act;
Fluoridation (Interim) Regulations 2009; and
Australian Drinking Water Guidelines 2011 (which were updated in 2015).
The Director of Public Health is also responsible for developing and implementing strategies to protect, promote and improve public health. The Director is supported in discharging their functions and duties by Public Health Services, which is part of DHHS.
1.6.3 Director, Environment Protection Authority
The Director of the Environment Protection Authority (EPA) and the EPA Board are responsible for administering and enforcing the Environmental Management and Pollution Control Act 1994 (EMPCA). The Director and EPA Board are supported in discharging their functions and duties by EPA Tasmania,4 which is part of DPIPWE.5
The Director's responsibilities in regulating Level 26 sewage treatment plants (STPs) include:
4 The EPA Division of DPIPWE adopted the name ‘EPA Tasmania’ in 2016.
5 For further information on the EPA’s functions, see www.epa.tas.gov.au.
6 Only Level 2 STPs, with a design flow capacity to treat more than 100 kL per day, are regulated by the EPA. Level 1 STPs are regulated by local government (Councils).

22 TASMANIAN WATER AND SEWERAGE STATE OF THE INDUSTRY REPORT 2016-17
undertaking, as a member of the EPA Board, environmental impact assessments in relation to proposals for new STPs or significant changes to existing STPs;
imposing legally binding environmental conditions upon the operation of STPs;
applying the Tasmanian State Policy on Water Quality Management 1997 as relevant to wastewater activities; and
ensuring compliance with environmental conditions.
EPA Tasmania also provides TasWater with advice on wastewater issues including those relevant to pumping stations, wastewater reuse, trade waste, blue green algae management and biosolids reuse.
1.6.4 Department of Primary Industries, Parks, Water and the Environment
The Water Policy and Planning Branch in DPIPWE develops and coordinates policies relating to the regulation of the water and sewerage industry and supports the Minister for Primary Industries and Water in fulfilling the Minister’s functions under the Industry Act.
The Water and Marine Resources Division within DPIPWE also plays an important water management, planning and regulatory role for the State’s water resources, including the administration and enforcement of the Water Management Act 1999.
The Water Management Act is part of Tasmania’s resource management and planning system and provides for the use and management of Tasmania's freshwater resources through arrangements for licensing, water trading, water allocations and dam permits.
1.6.5 Delegate for Dam Safety Regulation
The Minister for Primary Industries and Water also has regulatory oversight of dam safety. The Water Operations and Dam Safety Branch, of the Water and Marine Resources Division within DPIPWE, administers the Water Management Act and the Water Management (Safety of Dams) Regulations 2015 to ensure that owners of existing dams meet their dam safety responsibilities7.
The key functions in this regard relate to:
developing prescribed standards required for the design, construction, maintenance, surveillance and decommissioning of dams, and ensuring compliance with those standards (these standards are largely based on the criteria and guidelines produced by the Australian National Committee on Large Dams (ANCOLD)); and
formulating measures to ensure the safety of dams and, in particular, plans to remove or minimise risks to persons, property or the natural environment arising from a dam safety incident.
7 For further information on dam safety, see www.dpipwe.tas.gov.au/water/dams/dam-safety.

TASMANIAN WATER AND SEWERAGE STATE OF THE INDUSTRY REPORT 2016-17 23
1.6.6 Tasmania Fire Service
The Tasmania Fire Service (TFS) is the regulatory authority responsible for fire safety in Tasmania.
TasWater’s obligations under the Industry Act, with respect to fire safety, relate to:
the installation of fire hydrants in its water infrastructure at distances and locations as are necessary for the ready supply of water to control and extinguish fires; and
the need to keep its water infrastructure charged with water where that infrastructure supplies water to a fire hydrant.
The Industry Act provides that TasWater may reduce or restrict the quantity of water it supplies on days declared by the TFS to be days of total fire ban. Such restrictions include specifying how water may be used8, such as prohibiting the use of water outdoors. Limiting non-essential water use such as garden watering or lawn sprinklers on days of total fire ban can help to help to ensure that the TFS and residents who may be facing a bushfire threat have water available for firefighting and prevention.
1.6.7 Ombudsman
If a customer is dissatisfied with the outcome of a complaint made under TasWater’s customer complaints process, the customer may refer the complaint to the Tasmanian Ombudsman (the Ombudsman) under the Ombudsman Act 1978. Under section 77 of the Industry Act, it is a condition of its licence that TasWater complies with any recommendations made by the Ombudsman relating to a complaint.9
1.7 Other regulatory obligations and responsibilities
Regulation of the water and sewerage industry is affected by national policies and obligations. These policies and regulatory obligations and responsibilities are outlined below.
1.7.1 National water initiative
In June 2005, along with the Australian Government and the other states and territories, Tasmania became a signatory to the National Water Initiative (NWI) Agreement. Under the NWI Agreement, the signatories agreed to report independently, publicly and on an annual basis, and to benchmark data on the pricing and service quality of urban water delivery agencies.
The signatories of the NWI Agreement developed a performance reporting framework for urban utilities. This is reflected in the 2013-14 National Performance Framework: Urban performance reporting indicators and definitions handbook, July 2014 and the 2013-14 Urban National Performance Framework Urban Auditing Requirements.
8 See Part 2 of the Water and Sewerage Industry (General) Regulations 2009.
9 See www.ombudsman.tas.gov.au for further information.

24 TASMANIAN WATER AND SEWERAGE STATE OF THE INDUSTRY REPORT 2016-17
1.7.2 National performance reporting framework
In accordance with Tasmania’s obligations under the NWI, TasWater participates in the annual completion of performance indicators for the Bureau of Meteorology (the Bureau) in accordance with the Urban National Performance Framework.
The performance data is subject to independent audit at least once every three years. Further information on the NWI Agreement and the performance reporting framework can be found on the Bureau’s website at www.bom.gov.au/water/npr/index.shtml.
The preparation of annual national performance reports that independently and publicly benchmark pricing and service quality, is an important commitment under the NWI. The reports align with a nationally consistent performance framework, built on reporting practices already in place in the urban water sector.
TasWater submits annual performance data, with oversight of the data provided by the Economic Regulator.
1.7.3 Other government bodies
1.7.3.1 Department of Treasury and Finance
The Department of Treasury and Finance has responsibilities in relation to water and sewerage pricing policy, which the Treasurer is responsible for under the Industry Act.10
1.7.3.2 Local Government
Prior to 2009-10, local government was responsible for providing most reticulated urban water and sewerage services (excluding some water and sewerage infrastructure located within private or Crown land). Local governments now own TasWater.
Local government is responsible for the regulation of small and on-site sewerage infrastructure (such as septic tanks) and private water supplies (such as private bores and tanks).
In March 2017, the Tasmanian Government announced that it would introduce legislation to take over ownership of TasWater from 1 July 2018. Legislation dealing with the proposed transfer of ownership of TasWater and its restructure as a Government Business Enterprise, was passed by the House of Assembly on 17 August 2017. The legislation was read for the first time in the Legislative Council on 15 September 2017. A Select Committee was also established by the Legislative Council to inquire into and report on the benefits and challenges of the Government’s proposal, which included public hearings. Following debate on 23 November 2017, the Legislative Council voted against the legislation.
10 The administration of Subdivision 3 of Division 1, and Division 5 of Part 4 and sections 88 and 111 of the Industry Act are assigned to the Treasurer and the Department of Treasury and Finance.

TASMANIAN WATER AND SEWERAGE STATE OF THE INDUSTRY REPORT 2016-17 25
1.7.3.3 Bureau of Meteorology
In 2008, the Bureau assumed a new role in relation to water accounting, as part of the then Australian Government’s Water for the Future initiative. In 2014, the Bureau also took over the administration of the Urban National Performance Framework for water performance reporting and has produced the annual performance reports since 2013-14.11
The Bureau’s water information functions are contained in the Water Act 2007 (Cwlth), under Part 7 - Water Information. These functions are supported by the Water Regulations 2008 (Cwlth) (the Water Regulations).
In Tasmania, the Water Regulations require a number of organisations, including TasWater, to submit a range of water accounting information to the Bureau.
1.8 Performance and regulatory reporting
1.8.1 Performance reporting
The Industry Act provides that the Economic Regulator is to issue guidelines to regulated entities in relation to their annual performance and information reporting requirements.
The Economic Regulator’s Tasmanian Water and Sewerage Industry Performance and Information Reporting Guideline Version 1.4, sets out the data and contextual information that a regulated entity must provide to the Economic Regulator, so that its performance can be measured.
This Guideline provides for a transitional compliance regime, whereby TasWater is required to achieve compliance with the full range of performance measures over time. The Economic Regulator monitors TasWater’s performance in meeting those requirements.
1.8.2 Regulatory reporting
Licensed water utilities are required to carry out regular audits to assess:
compliance with and the adequacy of management and compliance plans; and
the quality, reliability, and conformity of regulatory information, including performance information.
The audits are an important element of the regulatory framework. They ensure that all stakeholders are provided with sufficient information to properly assess the performance of licensees in meeting their regulatory obligations, and provide a reliable basis for on-going performance assessment.
The approach to regulatory reporting is set out in the Economic Regulator’s Regulatory Reporting Guideline Version 3. Its approach to managing non-compliance is outlined in its Compliance Enforcement Policy Version 2.
11 The National Water Commission (NWC) was previously responsible for overseeing progress under the NWI Agreement including performance reporting. With its closure in 2015, the Bureau, with the agreement of all states and territories, took on the role of co-ordinating and producing annual national performance reports.

26 TASMANIAN WATER AND SEWERAGE STATE OF THE INDUSTRY REPORT 2016-17
TasWater’s performance indicators are independently reviewed, with approximately one third of indicators assessed each year. This way, each indicator is assessed at least triennially as required under the Urban National Performance Framework. The first round of appraisals was conducted between 2013–14 and 2015–16. A second round of appraisals commenced in 2016-17, with the final appraisal of this round due to be completed during 2018–19.
1.8.3 Regulatory compliance
For 2016-17 TasWater reported:
sixteen drinking water supplies exhibited public health non-compliances relating to elevated levels of microbiological contaminants and ten drinking water supplies exhibited public health non-compliances relating to elevated levels of non-microbiological contaminants;
fifty per cent of treated sewage effluent volume fully complied with EPA requirements (using a linked limits approach, as described in section 6.4.1);
receipt of two environmental infringement notices for contravention of permit conditions in relation to the construction works for a new outfall at the Carrick STP, consisting of failure to submit a Construction Management Plan and failure to provide notice of outfall construction works;
no instances of non-compliance with the Dam Safety regulator; and
no instances of non-compliance with economic regulation. However, due to an information system change during the year, some data reported against the performance reporting guideline, mainly relating to measures outlined in the customer service code, were either incomplete or known to contain errors and as such, are not suitable for publication.

TASMANIAN WATER AND SEWERAGE STATE OF THE INDUSTRY REPORT 2016-17 27
2 WATER SUPPLY
2.1 Sources of water
The average annual volume of surface water runoff in Tasmania is 33 312 000 megalitres (ML)1 and up to 2 500 000 ML of water is potentially available each year from groundwater.2 However, the overwhelming majority of urban water supplied in Tasmania is sourced from surface water, with only minor amounts extracted from groundwater.
Total sourced water includes both freshwater and recycled water resources and supports the requirements of town water supply, irrigation and the majority of the State's electricity requirements.
Drinking water sourced from surface water and consumed by domestic, commercial and industrial customers accounts for around 15 per cent of the estimated total use of surface water in the State (including water used for irrigation and industry).
Urban use of groundwater accounts for only a very small portion of the estimated total groundwater usage and less than 0.5 per cent of reticulated drinking water is sourced from groundwater.
During 2016-17 only 237 ML of groundwater was extracted for use in reticulated supplies, all of which was utilised in the northern and north-western regions of the State. The 2016-17 total was four per cent lower than the volume of groundwater extracted in 2015-16 (248 ML).
Rain water tanks represent another important source of water for many Tasmanian households. Approximately 22 per cent of Tasmanian households have rain water tanks as their primary source of drinking water.3
During 2016-17 TasWater sourced 77 476 ML from surface water (99.7 per cent) and 237 ML from ground water (0.3 per cent) for urban use. Urban water in Tasmania was not sourced from desalination or recycled water, although TasWater did use recycled water for some non-drinking uses (see section 3.2 of this report).
2.2 Water usage
The Australian Bureau of Statistics (ABS) has published a National Water Account for 2015-164 which details the volume of water extraction and consumption for each sector in each state and territory.
1 Tasmanian Planning Commission 2009, State of the Environment Tasmania 2009.
2 Audit Advisory Council 2001, National Land and Water Resources Audit 1997-2002 in Tasmanian Planning Commission 2009, State of the Environment Tasmania 2009.
3 ABS 4602.0.55.033, Environmental Issues: Water Use and Conservation, March 2013.
4 ABS 4610.0 Water Account, Australia 2015-16, November 2017.
Water volumes
kL kilolitres = 1 000 litres
ML megalitres = 1 000 000 litres
GL gigalitres = 1 000 000 000 litres

28 TASMANIAN WATER AND SEWERAGE STATE OF THE INDUSTRY REPORT 2016-17
These figures show that water use for the majority of sectors for Tasmania for 2015-16 was as follows:
Agriculture 306 438 ML;
Aquaculture5 556 ML;
Urban Water 57 974 ML;
Commercial6 45 050 ML; and
Mining7 not reported.
For this Report, urban water supplied does not include irrigation water or water usage in private supply systems. It differs from the Australian Bureau of Statistics’ estimated urban consumption, as total urban water supplied is TasWater’s metered volume of water (both drinking water quality and non-drinking water quality) supplied to customers during 2016-17 plus estimated non-metered water supplied. The total water supplied comprises the sum of residential, commercial, municipal, industrial and other water supplied.
TasWater provided the following detailed breakdown of the 56 156 ML of water supplied to around 205 000 residential and non-residential customers8 during 2016-17:
residential customers were supplied with 32 537 ML of water; and
commercial, municipal and industrial customers were supplied with 23 619 ML of water.
The average annual consumption per connection across the State in 2016-17 was 274 kilolitres (kL). This is six per cent higher than the average for 2015-16, which was 259 kL.
The average annual consumption per residential connection across the State increased, with consumption rising from 176 kL in 2015-16 to 179 kL in 2016-17. Average annual consumption per residential connection has shown marginal variation over recent years with the lowest value calculated in 2014-15 at 172 kL. There is no clear association between this annual consumption variation and annual variation in summer rainfall across the State. Average consumption per connection remains lower than the values reported during the first three years of annual reporting; 2010-11 (225 kL), 2011-12 (223 kL), 2012-13 (182 kL) which likely reflects the following factors:
the state-wide roll-out of water meters raising consumers’ awareness of their consumption levels; and
the improvement in the quality of the data collection relating to water consumption with the state-wide introduction of water meters.
5 The Tasmanian aquaculture industry accessed 662 021 ML but almost all of this water was used in-stream. The industry consumed only 556 ML of water during 2015-16.
6 Commercial is made up of self-extracted water usage figures for the manufacturing and “other” industry classifications from the Water Account, Australia 2015-16.
7 Comparable extraction and consumption figures for the mining sector are not available. ABS data includes a significant mine de-watering component which is not separately reported.
8 Non-residential customers include all commercial, industrial and municipal users.

TASMANIAN WATER AND SEWERAGE STATE OF THE INDUSTRY REPORT 2016-17 29
Figure 2.1 shows the average annual volumes of residential water supplied by major utilities (100 000 or more connected properties) across Australia during 2016-17 together with the median volume of water supplied by providers in this category.
TasWater’s average annual residential water supplied of 179 kL per residence was 11 per cent above the median for major water utilities in 2016-17, which was 161 kL.
Figure 2.1 Average annual residential water supplied (kL/property) – major utilities (large)
Source: Bureau of Meteorology, National performance report 2016-17: urban water utilities
2.3 Water assets
Tasmania’s hilly terrain poses a unique challenge for the redistribution of its fresh water resources, which are unevenly distributed across the State. Water is relatively abundant in the lightly populated western part of the state, and less abundant in the more heavily populated south-east and east coast regions.
Transferring water from the source of supply to the point of use can be difficult. The large distances and difficult terrain mean that, in some instances, pumping water from remote sources of supply to where it is needed incurs high costs.
The water assets that enable the treatment and transmission of water to customers include water treatment plants (WTPs), storage dams, reservoirs and the reticulated system of pipes and pumps.
0
50
100
150
200
250
Cit
y W
est
Wat
er
Yarr
a V
alle
y W
ater
Sou
th E
ast
Wat
er L
td
Loga
n C
ity
Co
un
cil
Qu
een
slan
d U
rban
Uti
litie
s
Un
ityw
ater
Bar
wo
n W
ater
Cen
tral
Co
ast
Co
un
cil
Go
ld C
oas
t C
ity
Co
un
cil
Hu
nte
r W
ater
Co
rpo
rati
on
TasW
ater
ICO
N W
ater
Syd
ney
Wat
er C
orp
ora
tio
n
Wat
er C
orp
ora
tio
n -
Per
th
wat
er s
up
plie
d (
kL/p
rop
erty
)
group median

30 TASMANIAN WATER AND SEWERAGE STATE OF THE INDUSTRY REPORT 2016-17
2.3.1 Water supply systems and treatment plants
A WTP is an individual facility receiving raw or partially treated water for treatment and ultimate delivery to customers and does not include secondary or booster disinfection plants. There may be more than one WTP at a specific location. TasWater is required to report the level and complexity of treatment provided to bring water quality to an acceptable level for the customer.
There are three broad categories of WTP:
disinfection only – the treatment plant solely disinfects the water prior to supply to customers. This category also includes WTPs that provide fluoridation only;
further treatment – the treatment plant provides additional processes to serve a particular purpose. It does not meet the requirements of full treatment, but may address some of those elements; and
full treatment – a substantial structure involving multiple treatment steps to achieve high quality water. The plant includes processes that remove turbidity and/or colour via different types of filtration and varying filter types, as well as providing filtration and disinfection. Most full treatment plants also fluoridate the water. Other treatment processes can include removal of taste and/or odour, softening, pH correction and the targeted removal of elements and compounds such as iron, manganese, nitrates and pesticides.
During 2016-17, an estimated 486 061 people living in Tasmania received a reticulated drinking water supply provided by TasWater through 70 drinking water systems9, that were serviced by 61 water treatment plants. Table 2.1 provides details of the number and type of WTPs operated by TasWater during 2016-17.
Table 2.1 Drinking water plants in Tasmania, 2016-17
Disinfection only WTPs Further treatment Fully treated Total WTPs
13 0 48 61
In July 2016 the water and sewerage services in Bronte Park were transferred to TasWater and four new WTPs started operations in the townships of Lady Barron, Mole Creek, Ringarooma and Whitemark.
2.3.2 Storage dams
TasWater is responsible for the operation and maintenance of in excess of 300 water supply and wastewater dams throughout Tasmania.
Owners of dams have a legal obligation to maintain and operate them so as not to cause danger to the public or significant environmental harm or present a danger to the public. Each dam is assessed under Australian National Committee on Large Dams (ANCOLD) guidelines for its potential severity of damage and loss and potential population at risk.
9 A water supply system is a unique system for the extraction and preparation of water for distribution via the water supply network. A system may have more than one treatment plant.

TASMANIAN WATER AND SEWERAGE STATE OF THE INDUSTRY REPORT 2016-17 31
The consequence and risk assessment includes three major considerations:
the potential population placed at risk in the event of a dam failure;
the potential impact on community and private infrastructure, such as bridges, roads, buildings, communication, energy and water and sewerage assets; and
the impact on the environment.
Once assessed, each dam is assigned a consequence category. The consequence category of each dam can be assigned to one of seven levels (Table 2.2) through a structured process provided by ANCOLD.
Table 2.2 ANCOLD Guidelines consequence category for dams
Severity of damage and loss
Population at Risk Minor Medium Major Catastrophic
<1 Very Low Low Significant High C
>1 to <10 Significant (Note 2) Significant (Note 2) High C High B
>11 to <100 High C High C High B High A
>100 to <1 000 (Note 1) High B High A Extreme
>1 000 (Note 1) (Note 1) Extreme Extreme
Source: Table 3 of the ANCOLD Guidelines on the Consequence Categories for Dams (2012).
Note 1: With a population at risk in excess of 100, it is unlikely that damage will be minor. Similarly with a population at risk in excess of 1 000 it is unlikely damage will be classified as medium.
Note 2: Change to “High C” where there is potential of one or more lives being lost.
All dams with a consequence category of “Significant” or higher require comprehensive surveillance inspections, and for dams where there is the potential for loss of life in the event of dam failure, dam safety emergency plans are required.
These compliance requirements become more significant as the consequence category increases. TasWater owns and operates in excess of 300 water and wastewater dams, lagoons and weirs around the state. Of these 37 are identified as having a consequence category of “Significant” or higher, due to their potential downstream impact (life, business, economic, damage) in the unlikely event of a complete dam failure. The remaining dams and storages are assessed as a “Low” or “Very Low” risk. TasWater has a five year program in place to assess the consequence category for its smaller, un-categorised dams. The consequence category for these dams is expected to lie as “Very Low” however, some may categorise up to “Significant”.
Table 2.3 details TasWater’s storage dams by consequence category as set out in TasWater’s Dam Safety Management Plan (DSMP) 2016-17. The terminology used in Dam Safety Assessments is set out in Appendix 3.
Table 2.3 TasWater’s storage dams by consequence category (no.)
Very low Low Significant High C High B High A Extreme
64 102 14 9 3 7 4

32 TASMANIAN WATER AND SEWERAGE STATE OF THE INDUSTRY REPORT 2016-17
In 2016-17, TasWater progressed its planned upgrades of the Conglomerate Dam (scheduled for completion in 2017-18); and completed the upgrade works for the Margaret Street Detention Basin.
In addition, detailed design and investigation work is continuing for the Mikany, Isandula and Ridgeway dams while the Pet Dam upgrade investigations are scheduled to commence in 2017-18. Decommissioning of Waratah, Grey Mountain No. 1 and No. 2 (all high risk dams) is currently being considered. Lowering the risk at Tolosa Dam commenced in late 2016, with the reduction of the water level, in anticipation of the dam’s decommissioning during 2017-18.
Interim risk reduction measures are in place for nine high risk dams, ensuring immediate risk mitigation measures whilst further assessments are being undertaken, and business needs confirmed.
2.3.3 Other water assets
Other water assets utilised by TasWater in its water supply systems include fluoridation stations/equipment, water pumping stations, water mains and water distribution storage facilities.
Table 2.4 summarises the other water infrastructure assets in Tasmania. The total length of water mains includes all transfer, distribution, reticulation mains and recycled water distribution and reticulation mains delivering water for urban areas.
Table 2.4 Other water assets owned by TasWater as at 30 June 2017
Number of water pumping stations
Number of water distribution storage facilities
Length of water mains (km)
219 297 6 266
In 2016-17 the length of the water network increased only marginally, with an average customer density of 33 properties per kilometre of main, which was the same as the previous year. Compared to other large mainland water utilities TasWater’s customer density is relatively low, owing to the regional nature of much of the network’s service area.
2.4 Performance of water infrastructure
A useful measure of water-supply network reliability is the frequency of interruptions, as indicated by the number of water main breaks per 100 kilometres of water main, or by the number of customers affected per 1 000 properties. If the duration of an outage is known, reliability in terms of customer minutes off supply can also be a useful indicator of performance. Water loss and leakage figures (eg the volume of water that does not reach customers due to leaking pipes or other factors) also help to gauge system reliability.
Several indicators in this section were affected by data collection issues caused by changes to TasWater’s asset management information systems, resulting in unreliable or incomplete data that is not considered to be representative of performance. Where reported, these indicators are identified with the # suffix.

TASMANIAN WATER AND SEWERAGE STATE OF THE INDUSTRY REPORT 2016-17 33
2.4.1 Water main breaks
A water supply interruption is an event that causes a total loss of water supply to customers. Factors affecting the frequency of interruptions include soil type, rainfall, pipe material and the age and condition of the network. Water main breaks are the primary cause of supply interruptions for the reticulated water network.
Table 2.5 shows the number of water main breaks, bursts and leaks per 100 kilometres of water main reported by TasWater. In 2016-17, the average rate of bursts and leaks across the State was 48 per 100 kilometres of water main. This is the same rate as reported in 2012-13 and is significantly higher than the reported rates in any of the intervening three years. TasWater has explained that recent improvements to its asset management system and data collection practices have contributed to an increase in the reporting of water main breaks.
Table 2.5 Water main breaks, bursts and leaks
Total number of water main breaks (breaks, bursts and leaks)
Water main breaks (per 100 km of water main)
2012-13 3 063 48
2013-14 2 056 35
2014-15 1 753 28
2015-16 2 051 33
2016-17 3 021 48
For comparative purposes the median rate of water main breaks for mainland major water utilities was 20 per 100 kilometres of water main.10 TasWater’s performance in 2016-17 was more than double the national median for this indicator.
The rate of unplanned water supply interruptions (ie the number of breaks that resulted in an unplanned interruption), has been affected by data issues and cannot be assessed against the CSC minimum standard of 68 per 100 km of water main.
Depending on the location of the break or fault, an unplanned interruption may affect one or many customers. Interruptions to water supply affected at least 30 347 customers in total during 2016-17, although due to data loss, this total is thought to be much higher.
Table 2.6 shows that the number of customers affected by unplanned interruptions decreased somewhat in 2016-17 compared to the preceding two years (an unplanned interruption is often the result of a water main break).
10 Bureau of Meteorology, National performance report 2016-17: urban water utilities, March 2018 (indicator A8).

34 TASMANIAN WATER AND SEWERAGE STATE OF THE INDUSTRY REPORT 2016-17
Table 2.6 Unplanned water interruptions
Number of unplanned interruptions Number of customers affected
2012-13 3 513# 23 382
2013-14 4 451 28 286
2014-15 6 007 33 352
2015-16 5 807 33 898
2016-17 2 695# 30 347#
# - Missing or incomplete data
In relation to the number of unplanned interruptions shown, TasWater believes that northern region data for 2012-13 was significantly under-reported. TasWater further notes that the number of unplanned interruptions reported for 2016-17 represents only six months of data collected since the upgrade of its asset management information systems.
2.4.2 Water losses
Water losses in the distribution system can be either apparent losses (unauthorised consumption, retail metering errors) or real losses (leakage and overflows from mains, service reservoirs and service connections prior to customer meters).
Real losses per service connection per day provide a measure of effective network management. Water pressure, condition and age of the infrastructure, or a combination of these factors can all influence this measure. Real losses represent a wasted resource, reduce the effective capacity of a water supply system and may result in unnecessary operating costs.
TasWater estimates that real losses in its reticulation networks during 2016-17 were in the order of 182 litres per service connection per day, or 5.7 kL per kilometre of water main per day. This equates to around 13 036 ML of real losses in the distribution system.
Unaccounted water equated to around 23 per cent of the total water produced by TasWater in 2016-17, a significant proportion. However, it is a considerable improvement on 2015-16, when unaccounted water equated to roughly 33 per cent of TasWater’s total water produced.
In 2016-17, TasWater’s infrastructure leakage index (ILI) was 1.6 (ratio of real losses to unavoidable real losses) which is 45 per cent lower than the ratio of 2.99 reported in 2015-16.
2.4.3 Water supply interruptions
Water supply interruptions may be unplanned, such as when a pipe bursts, or planned, such as scheduled repairs and maintenance. TasWater is required to notify customers of planned interruptions.
An unplanned interruption begins when TasWater is aware that water is no longer available at a customer’s tap, and ends with the restoration of normal service. The average duration of unplanned interruptions is another useful measure of the condition of the water supply network and its effective operation and management.
Unplanned interruptions
An interruption is classed as unplanned
when a customer has not been given at
least 24 hours notification or when a
planned interruption exceeds the
original notified duration.

TASMANIAN WATER AND SEWERAGE STATE OF THE INDUSTRY REPORT 2016-17 35
Potential influences on the frequency of unplanned water supply interruptions include infrastructure age, construction material, the condition of water mains and the type of soil surrounding pipes.
Figure 2.2 shows the average frequency and duration of unplanned water supply interruptions over the last five years. In 2016-17 TasWater reported more than 148# in 1 000 properties (15 per cent of customers) across Tasmania experienced an unplanned interruption to their water supply in 2016-17, although this data is known to be incomplete due to data loss relating to the reporting of unplanned interruptions and the actual frequency is therefore probably higher than reported.
The median rate reported by similar utilities on the mainland was typically around 126 unplanned interruptions per 1 000 properties.11
In 2016-17, TasWater was unable to reliably report either the duration of, or number of customers impacted by, water supply interruptions due to issues with data collection and reporting. Hence, the average customer minutes off supply (duration of unplanned water supply interruptions) cannot be reported for 2016-17. Similar utilities on the mainland reported a median of 134 customer minutes off supply during the year.
Figure 2.2 Incidence and duration of unplanned water supply interruptions
As shown in Figure 2.2, the duration of unplanned water interruptions reported by TasWater has generally increased in recent years, while the incidence of interruptions also grew. While data for 2016-17 is unreliable and hence has not been included in the chart, TasWater notes historically these values have not been captured reliably and the quality of reporting against these indicators are expected to improve significantly in 2017-18.
Table 2.7 shows the average duration of interruptions and customer minutes off supply for both planned and unplanned water interruptions, together with the minimum service standards for 2016-17.
Due to concerns regarding the completeness of TasWater’s 2016-17 service interruptions data, these figures may not be properly representative of its performance and cannot be used to reliably assess TasWater’s performance against the minimum standards of the CSC.
11 Bureau of Meteorology, National Performance Report: Urban Water Utilities 2016-17.
0
20
40
60
80
100
120
140
160
180
200
2012-13 2013-14 2014-15 2015-16 2016-17
Incidence of unplannedinterruptions - water(per 1000 properties)
Average duration of anunplanned interruption-water (minutes)
un
relia
ble
dat
a#

36 TASMANIAN WATER AND SEWERAGE STATE OF THE INDUSTRY REPORT 2016-17
However, it appears that TasWater probably met the target for restoring planned interruptions within five hours, though fell just short of the standard for unplanned interruptions.
Table 2.7 Water supply interruptions
CSC standard12
2012-13 2013-14 2014-15 2015-16 2016-17
Planned interruptions
Average duration (minutes) 180 228 244 292 130 NR
Average duration (% of time standard achieved)
80 - - - 94 NR
Average customer minutes off supply 15 7 11 9 2 NR
Interruptions restored within five hours (%) 85 85 81 95 97 99#
Average frequency (number) 0.1 0.03 0.05 0.03 0.01 NR
Unplanned interruptions
Interruptions (per 100 km of water main) 68 55 75 97 84 NR
Average duration (minutes) 180 175 131 143 199 NR
Average duration (% of time standard achieved)
80 - - NR 90 NR
Average customer minutes off supply 25 12 21 24 34 NR
Interruptions restored within five hours (%) 90 98 98 97 94 86#
Average frequency (number) 0.1 0.12 0.14 0.17 0.17 0.15#
# - Data contains errors or is unreliable NR - Not reported due to incomplete or missing data
2.4.4 Bursts and leaks
Bursts and leaks are often attributable to the failure of a pipe, hydrant, valve, fitting or joint material. A burst or leak may not necessarily result in a loss of supply to customers.
Table 2.8 shows the percentage of bursts and leaks, categorised by interruption priority, which TasWater attended to within the minimum service standard times during 2016-17. In previous years, TasWater was required to report only its average response time (in minutes) for attending to bursts and leaks, hence data is unavailable for per cent of time target achieved.
In the case of both priority 1 and priority 2 bursts and leaks, TasWater met the minimum service standards more than 90 per cent of the time. The average time to respond to priority 2
12 Minimum service standards for 2016-17, as per the Customer Service Code.
Bursts and leaks – interruption priority
categories
A burst or leak that causes, or has potential to cause:
Priority 1: substantial damage or harm to customers, water quality, flow rate, property or environment.
Priority 2: minor damage or harm to customers, water quality, flow rate, property or environment
Priority 3: no discernible impact on customers, property or the environment

TASMANIAN WATER AND SEWERAGE STATE OF THE INDUSTRY REPORT 2016-17 37
bursts and leaks has increased significantly compared to the previous year, taking an average of 94 minutes, which is still below the standard of 180 minutes.
Table 2.8 Average time to attend bursts and leaks (minutes/% of time standard achieved)
CSC standard13 2012-13 2013-14 2014-15 2015-16 2016-17
Priority 1 60 min/90% 47/- 31/- 36 /- 35/87% 30/93%
Priority 2 180 min/90% 152/- 95/- 70/- 69/98% 94/94%
Priority 3 4 320 min/90% 2 083/- 1 930/- 673/- 1 861/91% 2 428/81%
Priority 3 bursts and leaks represent a lower risk and have correspondingly less stringent attendance targets than priorities 1 and 2. TasWater met these targets 81 per cent of the time in 2016-17 with crews taking on average about one and a half days to respond (minimum standard is 3 days).
13 Customer Service Code minimum standard.


TASMANIAN WATER AND SEWERAGE STATE OF THE INDUSTRY REPORT 2016-17 39
3 SEWERAGE SERVICES
In 2016-17, TasWater operated 79 Level 2 sewage treatment plants (STPs) (design flow rate greater than 100 kL/day) and 34 Level 1 STPs (design flow rate less than 100 kL/day). In addition, Parks and Wildlife Service operated two Level 2 STPs (Ben Lomond and Lake St Clair National Parks) and the Port Arthur Historical Site Management Authority operated one Level 2 STP.
Where the relevant information for Level 1 STPs is not available, this chapter relates only to the performance of the 79 Level 2 STPs operated by TasWater.1,2
3.1 Sewage collected
Sewage volumes discussed in this section are based on total inflows received by STPs.
Table 3.1 Volume of sewage collected
2010-11 2011-12 2012-13 2013-14 2014-15 2015-16 2016-17
Sewage collected (ML) 60 734 54 201 51 131 56 718 50 876 50 356 56 582
Per property (kL) 333 301 283 324 288 283 311
In 2016-17, the total volume of sewage collected at both Level 1 and Level 2 STPs across the
State was 56 582 ML. TasWater’s Level 2 STPs collected 98.9 per cent of this total (55 948 ML).
The average volume of sewage collected (residential and non-residential) was 311 kL per
property.
Figure 3.1 Volume of sewage received / treated (GL and per property)
1 Level 1 STPs are not regulated by the EPA and are not required to report performance information.
2 Level 2 STPs operated by organisations other than TasWater are not included in the scope of this report.
0
10
20
30
40
50
60
70
250
260
270
280
290
300
310
320
330
340
2009-10 2010-11 2011-12 2012-13 2013-14 2014-15 2015-16 2016-17
sew
age
colle
cted
per
pro
per
ty (
kL)
Sew
age
colle
cted
(G
L)

40 TASMANIAN WATER AND SEWERAGE STATE OF THE INDUSTRY REPORT 2016-17
Figure 3.1 shows the volume of sewage received by TasWater’s STPs over the past eight years.
Total annual flow volumes are generally affected to some degree by the climatic patterns. Rainfall can increase inflow and infiltration of water into the sewer system, resulting in increased volumes being received by STPs. Widespread flooding occurred in Tasmania in June 2016, followed by a wet spring, with very much above average rainfall across the central northern and north western parts of Tasmania and above average rainfall for most of the remainder of the State until the end of 2016. Between January and June 2017, rainfall dropped to below or very much below average across the State, with the south and south-east of the State being the driest. Rainfall has a particularly pronounced impact on flows to Launceston’s Ti-Tree Bend STP, which includes significant areas of combined catchment carrying both sewage and stormwater.
3.1.1 Comparative sewage treatment levels
Sewage treatment is divided into three categories indicating the degree to which sewage is treated.
During 2016-17 approximately 41 316 ML or 73.8 per cent of all sewage was treated to secondary standard, including the majority of effluent discharged to reuse schemes. Tertiary treatment contributed 15.6 per cent of the total effluent volume (8 709 ML) and primary treatment the remaining 10.6 per cent (5 922 ML).
As a proportion of total treated effluent discharged to the environment, effluent subject to secondary treatment clearly outweighs the other categories. State-wide proportions of discharge by treatment levels have remained fairly constant since 1 July 2009.
The sewage treatment levels of TasWater’s STPs are discussed further in section 3.2.1 below.
3.2 Sewerage assets
Sewerage assets include STPs, pumping stations3, sewer mains and effluent outfalls4. Performance indicators for these assets relate to their number, density, length and operational performance.
3 Sewage pumping stations pump sewage from low points in the reticulation system to facilitate the passage of sewage to the sewage treatment plant.
4 An effluent outfall is the outlet of a drain or a sewer where it discharges into another body of water, usually a lake, river or the sea.
Sewage treatment levels
Primary treatment involves screening the solids from the
water and allowing a proportion of the suspended solids
and organic matter to settle from the sewage.
Secondary treatment takes primary treated effluent and,
with the aid of biological processes, breaks down a
further proportion of the dissolved or suspended organic
matter to a form that reduces its environmental impact if
discharged. Disinfection by means of chlorination,
ozonation or UV radiation is generally also considered to
be part of the secondary treatment step.
With tertiary treatment, the secondary treated effluent
is further processed using various techniques including
flocculation, coagulation, clarification and filtration.

TASMANIAN WATER AND SEWERAGE STATE OF THE INDUSTRY REPORT 2016-17 41
3.2.1 Sewage treatment plants
Nearly every major township in Tasmania has reticulated sewerage and an associated STP. STPs discharge to waterways and to effluent recycling schemes. There were 179 677 properties connected to the sewerage network across Tasmania in 2016-17.
Table 3.2 Sewerage assets operated by TasWater as at 30 June 2017
Sewage pumping stations
Length of sewerage mains (km) Level 1 STPs Level 2 STPs
Total number of STPs
747 4 745 34 79 113
Table 3.2 summarises the sewerage assets operated by TasWater during 2016-17.
The number of properties serviced per kilometre of sewer main gives an indication of the scale of TasWater’s sewerage network and the spatial density and distribution of properties serviced. Table 6.1 in Chapter 6 provides a list of the largest STPs by inflow volume.
In 2016-17, there were, on average, 38 properties serviced per kilometre of sewer main. This is lower than for most major mainland utilities, which would usually service around 64 properties per kilometre of sewer main.5
Table 3.3 provides a breakdown of Level 2 STPs by treatment level, which remains unchanged from 2015-16. The majority of Level 2 STPs operated by TasWater (67 of 79) fall into the secondary treatment category.
Table 3.3 Number of Level 2 STPs operated by TasWater (by treatment level)
Primary Secondary Tertiary
1 67 11
Pardoe STP in Devonport continued to be the sole Level 2 STP in Tasmania providing primary treatment in 2016-17. Effluent from this STP is discharged via a long ocean outfall. Long-term ambient monitoring has not indicated any significant environmental impacts outside the mixing zone.
3.3 Recycled water
Recycled water is sewage effluent that is treated to an appropriate standard and then reused. Recycled water can be used on-site at an STP or for off-site applications such as land irrigation or industrial processes.6 As effluent reuse schemes in Tasmania predominantly involve land irrigation, annual fluctuations in the volume of effluent recycled are generally reflective of climatic factors driving the demand for irrigation at any given time.
Table 3.4 shows the volume of recycled water used per annum in Tasmania and the percentage of total treated effluent volume recycled each year compared to the preceding years.
5 Bureau of Meteorology, National Performance Report 2016-17: urban water utilities, March 2018 (indicator A6).
6 These uses require treated effluent to meet ‘Class B’ quality standard as specified in the Tasmanian environmental guidelines for the use of recycled water in Tasmania (DPIWE 2002).

42 TASMANIAN WATER AND SEWERAGE STATE OF THE INDUSTRY REPORT 2016-17
In 2016-17 the total volume of effluent recycled from Level 2 STPs was 4 691 ML, equivalent to 8.4 per cent of the total effluent discharged from Level 2 STPs. The Clarence Recycled Water Scheme, which sources effluent from Richmond, Rokeby, Rosny, and Cambridge STPs, remains the largest reuse scheme in the State (2 072 ML recycled), followed by the Brighton/Bridgewater combined scheme (771 ML recycled). As a result of these two schemes, 2 759 ML (approximately 68 per cent) of treated effluent generated at the associated STPs was diverted from the Derwent Estuary to sustainable reuse.
A wet spring followed by drier conditions in the second half of the financial year resulted in a more moderate uptake of recycled effluent in 2016-17 compared with previous years.
Table 3.4 Volume of Recycled Water and percentage of total treated effluent reused
Year Total volume of effluent recycled (ML) Percentage of treated effluent recycled
2012-13 4 147 8.5
2013-14 5 239 9.47
2014-15 4 814 9.4
2015-16 5 257 10.4
2016-17 4 691 8.4
Table A-4.3 in Appendix 4 lists the proportion of effluent reused and reuse flow per year for each Level 2 STP between 2012-13 and 2016-17 inclusive.
3.3.1 Recycled water treatment plants
Out of the 79 Level 2 STPs operated by TasWater in 2016-17, 33 plants discharge a proportion of their respective outflows to effluent reuse schemes.
Table 3.5 categorises the Level 2 STPs operated by TasWater according to whether full, partial or no reuse of treated effluent occurred over the last five financial years. Partial reuse schemes are further divided into those achieving less or greater than 50 per cent recycling. Schemes are classified each year based on actual recycling percentages achieved.
The table highlights that the total number of STPs associated with full reuse schemes in 2016-17 has reduced compared to the previous two financial years, while the total number of STPs which discharge to effluent reuse remained static.
The State Policy on Water Quality Management8 requires that effluent reuse needs to be pursued in order to minimise the discharge of pollutants to water, unless there are valid reasons not to do so. Improvements in the uptake of effluent recycling such as consistent achievement of full effluent reuse at a higher number of STPs, higher volumes of reused effluent or an increase in the total number of STPs where effluent recycling occurs, are generally the result of structural investment in this area.
7 Correction of typographical error from 2013-14 Report which erroneously stated 9.24.
8 Policy available at http://epa.tas.gov.au/Documents/State_Policy_on_Water_Quality_Management_1997.pdf

TASMANIAN WATER AND SEWERAGE STATE OF THE INDUSTRY REPORT 2016-17 43
Table 3.5 Classification of reuse schemes associated with Level 2 STPs
Tasmanian reuse category
Full
Partial
(>50% recycled)
Partial
(<50% recycled) None
2012-13 8 17 12 42
2013-14 7 19 11 42
2014-15 10 18 7 43
2015-16 13 12 8 46
2016-17 8 13 12 46
3.4 Performance data
The performance of the sewerage infrastructure is assessed against a range of measures relating to sewer blockages, breaks and chokes, at both the sewer main and property connection points.
Several indicators in this section were affected by data collection issues caused by changes to TasWater’s asset management information systems, resulting in unreliable or incomplete data that is not considered to be representative of performance. Where reported, these indicators are identified with the # suffix.
3.4.1 Sewer main breaks and chokes
The number of breaks and chokes in the sewer main indicates both the level of service received by customers and the condition of the sewerage network. A break is a failure of the sewer main which results in an interruption to the sewerage service. A choke is a partial or total blockage that may or may not result in a spill from the sewer system to the external environment.
Stormwater ingress, particularly during periods of high rainfall, is a major factor affecting the frequency and impact of sewerage system overflows.
Across its sewerage system in 2016-17, TasWater reported 2 156 sewer main breaks and chokes, which is less than the 2 895 breaks and chokes reported in 2015-16.
Reliability of the sewerage network is measured by the frequency of service failure, as indicated by the rate of sewer breaks and chokes per 100 kilometres of sewer main (Table 3.6). This measure does not include sewer breaks and chokes that occur within property connections.
TasWater’s performance of 45 breaks and chokes per 100 kilometres in 2016-17 is better than previous years and is well below the minimum service standard of 104. Preventative efforts by TasWater in addition to favourable weather conditions during the year reduced the incidence of root growth into sewers causing blockages. However, the rate reported nationally

44 TASMANIAN WATER AND SEWERAGE STATE OF THE INDUSTRY REPORT 2016-17
for similarly sized utilities was less than TasWater’s performance, with typically 30 breaks and chokes per 100 kilometres of sewer main.9
Table 3.6 Sewer main breaks and chokes
Total number of breaks and chokes Sewer mains breaks and chokes
(per 100km sewer main)
2010-11 2 619 56
2011-12 2 723 57
2012-13 2 669 56
2013-14 2 244 50
2014-15 2 710 57
2015-16 2 895 61
2016-17 2 156 45
3.4.2 Property connection sewer breaks and chokes
The property connection is a short sewer owned and operated by TasWater, which connects the sewer main to the customer’s property at the inspection opening. TasWater measures and reports on breaks and chokes in property connections on a per 1 000 connected properties basis.
The rate of property connection sewer breaks and chokes reported for 2016-17 was 4.9 per 1 000 property connections. This is the same result as the previous year and is comparable to other water utilities on the mainland. The national median for similarly sized urban water utilities around Australia was around 4.5 breaks per 1 000 properties.10
3.4.3 Sewer overflows
An overflow occurs when untreated sewage spills or discharges from the sewerage system (ie pumping stations, pipes, maintenance holes or designed overflow structures) escape into the external environment.
TasWater must notify the Director, EPA, of any release of sewage that causes or may cause serious or material environmental harm.11 The threshold for reporting sewer overflows varies between environmental regulators.
The rate of sewer overflows is calculated with reference to the length of the sewer mains and channels to give the average frequency of sewer overflows for the system per 100 km of sewer main as shown in Table 3.7.
9 Bureau of Meteorology, National Performance Report 2016-17: urban water utilities, March 2018 (indicator A14).
10 Bureau of Meteorology, National Performance Report 2016-17: urban water utilities, March 2018 (indicator A15)
11 The Sewage Spill Notification Guidelines issued by EPA Tasmania in October 2017 provide clarification as to what is considered a sewage spill that is notifiable to the Director, EPA. The guidelines are available from EPA Tasmania on request.

TASMANIAN WATER AND SEWERAGE STATE OF THE INDUSTRY REPORT 2016-17 45
In 2016-17 TasWater reported 134 sewer overflows to the environmental regulator, the EPA. This equates to around 2.8 overflows per 100 km of sewer main. TasWater noted that performance has improved due to progressive upgrades of sewer infrastructure.
The rate of reportable sewer overflows across Tasmania is high compared to similar sized utilities on the mainland, which historically report an average of between 0.5 and 1.0 sewer overflows per 100 kilometre of sewer main.12
Table 3.7 Sewer overflows
Number of sewer overflows reported
Sewer overflows (per 100 km of sewer main)
2010-11 235 5.7
2011-12 173 3.7
2012-13 178 3.9
2013-14 645 14.3
2014-15 164 3.5
2015-16 201 4.3
2016-17 134 2.8
3.4.4 Sewerage service interruptions
A sewerage service interruption is any planned or unplanned event causing a loss of sewerage services. An interruption starts when TasWater is made aware that sewerage services are no longer available and ends when normal service is restored.
Figure 3.2 Sewerage service interruptions
The average duration of sewerage interruptions over the past five years is shown in Figure 3.2. During 2016-17, TasWater reported 3 897# sewer service interruptions, though data for this measure is considered to be unreliable. The duration of an average interruption in 2016-17
12 Bureau of Meteorology, National Performance Report 2016-17: urban water utilities, March 2018 (indicator E13).
0
50
100
150
200
250
300
0
500
1 000
1 500
2 000
2 500
3 000
3 500
4 000
4 500
2012-13 2013-14 2014-15 2015-16 2016-17
Total number ofsewerageinterruptions
Average sewerageinterruption (minutes)
Tota
l nu
mb
er
Ave
rage
du
rati
on
(m
inu
tes)
un
relia
ble
dat
a

46 TASMANIAN WATER AND SEWERAGE STATE OF THE INDUSTRY REPORT 2016-17
has not been reported due to data issues. Performance in previous years has been well outside the minimum service standard (180 minutes) and the typical performance level reported by similar utilities on the mainland (210 minutes).
Table 3.8 shows the average duration of interruptions and customer minutes off supply for sewerage interruptions, together with the minimum service targets which TasWater is required to meet.
Table 3.8 Sewerage service interruptions
CSC standard13 2012-13 2013-14 2014-15 2015-16 2016-17
Average time to attend breaks and chokes (minutes)
60 66 61 51 55 56#
Average time to attend breaks and chokes (% of time standard achieved)
90 % - - - 74 84#
Average duration (minutes) 180 137 118 274 277 NR
Average duration (% of time standard achieved)
80 % - - - 78 NR
Spills contained within five hours (%) 99 94 99 98 100 99#
# - based on incomplete data NR - Not reported due to incomplete or missing data
In 2016-17, TasWater met the attendance time standard specified in the Code for sewerage breaks and chokes for 84 per cent of the time with an average attendance time of 56 minutes. While this is an improvement on the 74 per cent reported in 2015-16, it is still below the required service standard of 90 per cent.
Due to concerns regarding the completeness of TasWater’s service interruptions data, the average duration of sewerage service interruptions cannot be reported for 2016-17 nor used to reliably assess TasWater’s performance against the minimum standards of the CSC. TasWater has failed to meet the minimum standards for the duration of sewer interruptions for the past two years.
Almost all sewage spills (from reticulation and branch sewers) were contained within five hours in accordance with the service target of 99 per cent, with 11 spills taking more than five hours to contain. However, data against this indicator is known to be of poor quality and accuracy, with only six months of data recorded and reported. Given the potential impacts on human health of such spills, the Regulator expects TasWater’s reporting for sewage spills to improve in 2017-18 and onwards.
13 Minimum service standards for 2016-17, as per the Customer Service Code.

TASMANIAN WATER AND SEWERAGE STATE OF THE INDUSTRY REPORT 2016-17 47
TASM
AN
IAN
WA
TER A
ND
SEWER
AG
E STATE O
F THE IN
DU
STRY R
EPOR
T 20
14
-15
47
4 CUSTOMER SERVICE
This Chapter outlines TasWater’s customer service performance with respect to the operation of its call centre and management of complaints as well as the treatment of customers with payment difficulties.
As at 30 June 2017, around 205 000 properties were connected to the water and sewerage network operated by TasWater, with residential customers making up around 89 per cent of those connections.
4.1 Call centre performance
TasWater’s call centre provides an important link between customers and TasWater and remains a popular way of doing business for many customers.
TasWater’s call centre performance is measured in terms of the time it takes an operator to answer a customer’s call. Since 2015-16, TasWater’s call centre operators have been required to answer 85 per cent of calls (ie where the customer has selected a relevant operator option) within 30 seconds. The target had previously been 90 per cent, but following an assessment of service standards as part of the 2015 Water and Sewerage Price Determination Investigation, it was reduced slightly to 85 per cent, which was considered to be a more apprpriate target.
Table 4.1 shows call centre performance during the previous five years. Overall, the responsiveness of the call centre has been positive, exceeding the target on three occasions. The observed peak in call volume and slightly reduced performance during 2012-13 occurred during the operation of the three regional corporations.
Table 4.1 Call centre performance
Category 2012-13 2013-14 2014-15 2015-16 2016-17
Total number of calls 165 400 134 479 126 152 134 127 149 170
Number of calls answered by an operator within 30 seconds
133 683 124 393 111 748 118 691 132 876
Performance/service standard target 81 / 90% 92 / 90% 89 / 90% 88 / 85% 89 / 85%
Results in bold and underlined indicate that the standard was not met
Call volumes were substantially higher for 2016-17 than for the previous three years, but remained lower than 2012-13 levels, just prior to TasWater’s commencement.
TasWater’s call centre response time was better than the national median for similar sized water utilities, which was 67 per cent of calls answered within 30 seconds in 2016-17.1 TasWater has been the highest performing against this metric amongst similar utilities for the last two financial years.
1 Bureau of Meteorology, National Performance Report 2016-17: urban water utilities, March 2018 (indicator C14).

48 TASMANIAN WATER AND SEWERAGE STATE OF THE INDUSTRY REPORT 2016-17
4.2 Complaints
The numbers of, and categories of, customer complaints received by TasWater provides a general indication of overall customer satisfaction and is also a useful way of identifying issues of concern to customers.
During 2016-17, TasWater received 2 500 complaints or 12 complaints per 1 000 properties which did not meet the service standard of nine complaints per 1 000 properties. However, while the rate of complaints exceeded the regulatory target, the total number of complaints decreased by 14 per cent compared with the previous year.
Figure 4.1 summarises the complaints received by category over the previous five years. The majority (54 per cent) of complaints received in 2016-17 related to water quality (ie taste, colour and odour), which was also the case for the three years prior. The number of complaints for water quality increased by 23 per cent from 2015-16, which is reflective of the water quality challenges that TasWater continues to confront.
For all other complaint categories, the number of complaints received decreased in 2016-17, although complaint numbers were still above 2014-15 levels, with the exception of billing and account complaints which reduced over the two year period.
Figure 4.1 Summary of complaints received by category
During the year TasWater implemented a number of initiatives to reduce the rate of complaints, particularly in regards to water quality. These include:
the Regional Towns drinking water program aiming to remove public health alerts and boil water alerts by August 2018;
establishment of a Water Systems Optimisation Team to accelerate improvements in water quality; and
formation of a complaints working group to determine appropriate actions to address the underlying issues causing complaints.
500
1 000
1 500
2 000
2 500
3 000
2012-13 2013-14 2014-15 2015-16 2016-17
billing and accounts
sewerage service
water service
water quality
other
TasWater defines a complaint as :
“...an expression of dissatisfaction made to an organisation, related to its products, or the complaints-process itself, where a response or resolution is explicitly or implicitly expected.”

TASMANIAN WATER AND SEWERAGE STATE OF THE INDUSTRY REPORT 2016-17 49
TASM
AN
IAN
WA
TER A
ND
SEWER
AG
E STATE O
F THE IN
DU
STRY R
EPOR
T 20
14
-15
49
TasWater advised that, overall, 93 per cent of complaints were resolved within 10 days for the year against a target of 90 per cent, which is a slight increase from the previous year.
The rate of complaints per 1 000 properties continues to be higher than reported for comparable utilities on the mainland (median of 3.5 per 1 000 properties for 2016-17).2
Customers whose complaints are not resolved through TasWater’s customer complaints process may refer their complaint to the Ombudsman. TasWater is bound by recommendations made by the Ombudsman in relation to a complaint. The service standard that applies to TasWater for complaints to the Ombudsman is 0.5 per 1 000 customers.
During 2016-17, the Ombudsman received 72 complaints3 regarding TasWater which was a small reduction compared with the previous year. However, as noted by the Ombudsman this is still a notable decrease from previous years when complaints were double this amount. This equates to 0.35 complaints per 1 000 properties and met the service standard. Of these complaints, 56 per cent related to billing and accounts, while the remaining 44 per cent related to issues associated with the supply of water and sewerage services.
4.3 Payment management
TasWater is obliged under the Code to provide customers with flexible payment options and to offer a hardship program to customers who are experiencing difficulty paying their bill.
In certain circumstances, TasWater may restrict or disconnect the water supply to residential customers for non-payment. Water restrictions are only applied after other arrangements such as flexible payment plans have not resulted in the customer either paying or agreeing to pay their outstanding debt.
After all reasonable steps have been taken to allow a customer to pay an outstanding debt, TasWater may commence legal action to recover the debt.
Table 4.2 Residential customers with payment difficulties
Category 2015-16 2016-17
Customers repaying a debt 5 095 4 617
Average debt $1 155 $1 150
Customers owing more than $500 (percentage) 2 913 (57) 2 583 (56)
Customers on hardship program (concession customers) 82 (37) 70 (29)
Average debt of customers on hardship program (upon entry) $2 946 $2 943
Restrictions applied for non-payment (concession customers) - - 112 (0)
Restrictions removed within seven days of being applied (concession customers)
- - 73 (0)
Customers to which legal action applied for non-payment of water bill - 149
2 Bureau of Meteorology, National Performance Report 2016-17: urban water utilities, March 2018 (indicator C13).
3 Ombudsman Tasmania, Annual Report 2016-17, November 2017.

50 TASMANIAN WATER AND SEWERAGE STATE OF THE INDUSTRY REPORT 2016-17
Table 4.2 shows data for residential customers who had difficulty paying their accounts during 2015-16 and 2016-17. Data for concession customers are shown in brackets.
As at 30 June 2017, the number of residential customers repaying a debt, the number of customers owing more than $500 and the number of customers on the hardship program had all declined compared to the previous year. The average amount of debt was similar to the previous year, with residential customers owing on average $1 150, which is the equivalent of a typical annual bill for water and sewerage, assuming water consumption of around 200 kL per year.
The number of customers on the hardship program has reduced further to 70 as at 30 June 2017, with 29 concession customers using the program. Customers using the hardship program have significant levels of debts, with the average debt at the time of starting hardship around $2 943 which is more than two and a half times a typical annual bill for water and sewerage.
TasWater advised that it has increased its efforts to reduce overdue debt and now has a specific framework in place. Increases in the number of restrictions for non-payment of a bill and the number of customers to which legal action applied for non-payment of a water bill, are a consequence of the new framework.
As at 30 June 2017, 741 non-residential customers were also repaying a debt, which was a 14 per cent reduction compared with the previous year.
TASMANIAN WATER AND SEWERAGE STATE OF THE INDUSTRY REPORT 2016-17 51
5 PUBLIC HEALTH
This Chapter assesses drinking water quality compliance with bacteriological, chemical and fluoridation standards.
There were 87 monitoring zones (water supplies) across the 71 public drinking water supply systems managed by TasWater during 2016-17.
Sixty nine of the water supply systems are classified by a single monitoring zone (or water supply). The Greater Hobart system has ten monitoring zones and the Huon Valley system has eight monitoring zones. Compliance is assessed against each of the monitoring zones and accordingly this Chapter reports the information of the 87 water supplies only.
As at 30 June 2017 there were 25 water supplies on long term boil water alerts or public health alerts compared to 23 the previous year. In November 2016, TasWater reported the Permanent Boil Water Alert (BWA) was lifted from Scamander after ten years of alerts, making it the first project to be delivered under TasWater’s Regional Towns Water Supply Program. A public health alert (do not consume) was also lifted in Whitemark on Flinders Island. However, boil water alerts were added for a further four supplies, Colebrook, Rocky Creek, National Park and Bronte Park, during the year. Boil water alerts are detailed in Section 5.2 (bacteriological compliance) while chemical compliance and public health alerts (do not consume notice) are discussed in Section 5.4.
5.1 Drinking water treatment
Further to the three categories of water treatment discussed in section 2.3.1, some water supplies have no treatment processes prior to supply to customers.
During 2016-17, 17 water supplies supplied raw water (no treatment) with 14 of these supplies operating on a permanent boil water alert; while the other three operated under a public health alert (see Section 5.4.1).
Eleven water supplies provided disinfection only, with a single treatment barrier such as chlorination or ultra violet light. Seven of these water supplies operated on a permanent boil water alert, one on a temporary boil water alert, one on a public health alert, with the other two classified as drinking water quality. Chlorination can become ineffective if the source water becomes turbid, which commonly affects raw water during heavy rain and/or drought conditions. When chlorination may become ineffective a temporary boil water alert is issued.
The remaining 59 water supplies (68 per cent) had multiple water treatment processes to address public health risks posed by the source water quality. These require effective operation and ongoing maintenance to ensure the water treatment processes are appropriate and adequate. These systems are effective against most bacteriological hazards that may be present in the source water.

52 TASMANIAN WATER AND SEWERAGE STATE OF THE INDUSTRY REPORT 2016-17
5.3 Bacteriological compliance of water supply systems
Bacteriological compliance monitoring is one way of measuring the effectiveness of the management of drinking water supplies. Bacteriological monitoring of the water demonstrates whether the microbiological risk associated with the water supply has been adequately managed.
The determination of the bacteriological compliance of a drinking water supply depends on collecting sufficient appropriate microbiological samples. Water suppliers must sample and test drinking water from their drinking water supplies in accordance with the sampling requirements prescribed in the ADWG and the Tasmanian DWQG. Sufficient samples and appropriate frequency of sampling demonstrate that monitoring is representative of the water provided to consumers throughout the year.1
In 2016-17 TasWater adequately monitored 81 of 87 (93 per cent) of its water supplies in compliance with the required sampling frequency specified in the ADWG and DWQG. The exceptions were the water supplies to Cam River (9 492 people), Leven River (4 816), North Esk (36 590), South Esk (13 059), Tullah (243) and Zeehan (1 200), where insufficient samples were taken. By assuming the worst case for missing samples (ie that the missing sample was non-compliant) it was still possible to evaluate the overall bacteriological compliance for these supplies. Specifically, there was sufficient data to determine that all six of these water supplies were bacteriologically compliant.
Of TasWater’s 87 public drinking water supplies, 71 were considered by the DHHS to be bacteriologically compliant (82 per cent). The 16 water supplies (18 per cent) that were non-compliant were: Branxholm (378 people), Bronte Park (31), Cornwall (142), Derby (176), Gladstone (144), Gormanston (50), Gretna (138), Herrick (67), Judbury (273), Mathinna (245), Mole Creek (500), Mountain River (5), Pioneer (17), Ringarooma (344), Rossarden (229) and Winnaleah (180).
Table 5.1 compares the level of compliance, non-compliance and unknown compliance (due to insufficient sampling) from 2012-13 to 2016-17. The highest level of compliance during this period was achieved in 2016-17.
Comparisons of previous years with 2015-16 and 2016-17 should be done with caution because of the changed methodology for determining bacteriological compliance in water supplies that have not met their required sampling frequency. Prior to 2015-16, any water supply that was not sufficiently sampled was classified as of unknown compliance. In 2015-16 and 2016-17, by assuming that all missing samples were non-compliant (ie a worst case scenario) most such supplies could be assessed as compliant, rather than of unknown compliance.
1 Information about the quality of each drinking water supply can be obtained from the DHHS Annual Drinking Water Quality Report or from water quality reports published by TasWater.
Drinking water guidelines
The Australian Drinking Water Guidelines
(ADWG) and the Tasmanian Drinking
Water Quality Guidelines 2015 (DWQG)

TASMANIAN WATER AND SEWERAGE STATE OF THE INDUSTRY REPORT 2016-17 53
Table 5.1 Bacteriological compliance of drinking water supplies (number of supplies)
Bacteriological compliance 2012-13 2013-14 2014-15 2015-16 2016-17
Compliant 68 67 63 66 71
Non-compliant 22 20 15 20 16
Unknown compliance 0 1 10 1 0
TasWater uses bacteriological compliance data to inform management of the risks associated with non-compliant water supplies. These risks are intended to be addressed by TasWater commissioning the capital projects required to provide permanent improvements to the bacteriological quality of these water supplies.
Key projects such as the Ringarooma Valley, Mole Creek, King Island and Flinders Island water systems and the Regional Towns Program will address many of the issues with currently non-compliant water supplies and will improve the overall level of compliance within the State. TasWater has already made some progress in this respect, with seven permanent boil water alerts lifted early in the 2017-18 financial year.
5.3.1 Incidence of boil water alerts
In accordance with the DWQG issued under the Public Health Act 1997, when water samples indicate non-compliance (eg E.coli are detected), TasWater must undertake immediate corrective actions to minimise the public health risk. Most commonly, the source of the contamination is quickly identified and the contamination removed or treated. At other times a more extensive investigation is required and a temporary boil water alert is issued to protect the public from the risk of water contamination in the meantime.
Permanent boil water alerts are issued for water supplies that are subject to contamination from various environmental sources and where there is inadequate or no water treatment process in place. In these instances consumers need to act to protect themselves from the hazards of potentially contaminated water.
Temporary boil water alerts are used to manage well defined time-limited (usually short term) events. If the source of contamination or risk cannot be addressed within three months, the status is changed to a permanent boil water alert, and additional criteria must be met before the alert can be lifted.
Of the Tasmanian water supplies which operate under a permanent boil water alert, most have no water treatment processes (such as disinfection by chlorination) in place to reliably protect the public from risks posed by any episodic contamination.
In 2016-17, 21 of TasWater’s public drinking water supplies operated under a permanent boil water alert because they did not receive any water treatment or significant public health risks were identified that could not be mitigated by their respective treatment barriers. These water supplies collectively supplied water to around one per cent of the Tasmanian
Boil water alerts
When a boil water alert is issued, water should
be brought to a rolling boil and then cooled to
room temperature or below before drinking or
use in food preparation. Boiling the water kills
pathogenic bacteria, viruses and protozoa.

54 TASMANIAN WATER AND SEWERAGE STATE OF THE INDUSTRY REPORT 2016-17
population receiving a reticulated supply2. Of these 21 water supplies, 14 were raw water supplies where no treatment is provided and seven were treated with disinfection only.
Three water supplies operated on a temporary boil water alert owing to varied compliance with the microbiological standards or the identification of potential risks to public health. These water supplies affected approximately 3.4 per cent of the Tasmanian population receiving a reticulated water supply. Of these three water supplies, two received disinfection only and one was a fully treated supply. None of these temporary boil water alerts remained in place at the end of the reporting period; however two supplies (Greater Hobart – National Park and Rocky Creek) had their temporary boil water alert changed to permanent boil water alerts as the identified risks could not be addressed in the short term by TasWater.
Table 5.2 compares the number of water supplies which operated with permanent or temporary boil water alerts between 1 July 2012 and 30 June 2017. As at 30 June 2017 there were 21 drinking water supplies with a permanent boil water alert in place. This is an increase in the number reported in 2015-16 owing to both the Rocky Creek and Colebrook water supplies being changed from a temporary boil water alert to a permanent boil water alert. During 2016-17, TasWater took over the management and control of the Bronte Park water supply which was placed on a permanent boil water alert.
Table 5.2 Number of boil water alerts
Alert type 2012-13 2013-14 2014-15 2015-16 2016-17
Temporary boil water alerts 6 6 5 7 3
Permanent boil water alerts 22 19 16 18 21
5.3.2 Population receiving bacteriologically compliant reticulated water
Approximately 94 per cent of Tasmanians3 receive their drinking water from a public drinking water supply.
In 2016-17, 0.6 per cent of the Tasmanian population serviced with reticulated water supply received drinking water that was bacteriologically non-compliant or of unknown compliance. This affected 2 919 people out of the estimated serviced population of 486 061.
5.4 Chemical compliance of water supply systems
In 2016-17, TasWater adequately monitored 79 of 87 water supplies for chemical contaminants. The exceptions were Coles Bay (207 people), Currie (1 055), Deep Creek (5 090), Distillery Creek (38 615), Grassy (312), Greater Hobart – Coal Valley (1 615), Rosebery (881) and Whitemark (320). Two of these supplies (Coles Bay and Rosebery) recorded contaminants that exceeded the health related guideline value and were therefore assessed as being non-compliant. The required number of chemical samples were not taken in the remaining six water supplies and therefore have been classified as of unknown
2 Throughout this chapter, ‘reticulated water supply’ refers specifically to reticulated water supplies operated by TasWater. There are a small number of private reticulated water supply systems in Tasmania that are not operated by TasWater, and are not subjects of this report.
3 Connection data provided by TasWater is normalised through the estimated occupancy rate for each water supply area as sourced from the ABS website through population data.

TASMANIAN WATER AND SEWERAGE STATE OF THE INDUSTRY REPORT 2016-17 55
compliance. In the samples that were taken within these six supplies, contaminants did not exceed the health related guideline values.
Health based guideline values are conservative and incorporate a range of safety factors that err on the side of caution so as to protect public health. Guideline values represent the maximum allowable concentration of a chemical that would not result in any significant risk to the health of the consumer over a lifetime of consumption. For most parameters, intermittent exceedances of guideline limits do not harm health.
Ten of TasWater’s water supplies had chemical contaminants detected above the ADWG health guideline during 2016-17.
Table 5.3 shows the number of water supplies that had chemical contaminants detected above the ADWG health guideline values between 1 July 2012 and 30 June 2017.
Table 5.3 Number of water supplies exhibiting chemical non-compliances
2012-13 2013-14 2014-15 2015-16 2016-17
Chemical non-compliances 14 14 14 13 10
During 2016-17, temporarily elevated levels of lead and disinfection by-products were detected in one water supply (Conara (133 people)). One water supply (Rosebery (881)) detected temporarily elevated levels of lead and cadmium. One water supply (Greater Hobart – New Norfolk, 6 888 people) detected temporarily elevated levels of mercury. One water supply (Leven River, 4 816 people) detected temporarily elevated levels of chromium. Six water supplies Avoca (264), Bronte Park (31), Coles Bay (207), Ellendale (158), Epping (56) and Wayatinah (43)) detected temporarily elevated levels of disinfection by-products. In all cases, remedial action by TasWater and re-sampling of the water supply showed that contaminants had returned to acceptable levels.
5.4.1 Incidence of Public Health Alerts
Public health alerts (do not consume notices) are put in place when non-compliant water is detected that cannot be rendered safe by boiling. Four water supplies operated under a public health alert during 2016-17 (Avoca, Pioneer, Rossarden and Winnaleah).4 These alerts affected 0.1 per cent of the serviced population.
Table 5.4 shows the number of water supplies operating under a public health alert from 1 July 2012 to 30 June 2017. There were no new public health alerts issued during 2016-17, whilst the public health alert on the Whitemark supply was lifted after commissioning of a new water treatment plant. The increase from before 2012-13 to 2014-15 is attributable to greater compliance with monitoring programs to better identify potential public health risks.
Table 5.4 Number of water supplies operating on a public health alert
2012-13 2013-14 2014-15 2015-16 2016-17
Public health alerts 3 3 5 5 4
4 Three of these PHA’s had been lifted as at March 2018, with only Rossarden remaining on a PHA.

56 TASMANIAN WATER AND SEWERAGE STATE OF THE INDUSTRY REPORT 2016-17
5.4.3 Population receiving chemically compliant reticulated water
In 2016-17, 87.6 per cent of the Tasmanian population serviced by a reticulated water supply received drinking water that was chemically compliant throughout the year. The 12.4 per cent of the Tasmanian population receiving drinking water that was chemically non-compliant or of unknown compliance was a significant increase from the 1.2 per cent reported in 2015-16. This was largely due to six supplies determined to be of unknown compliance as a result of the required number of samples not being taken. These six supplies collectively service 9.7 per cent of the serviced population. However, as previously noted, the sampling that was carried out detected no non-compliances.
5.5 Fluoridation of public drinking water supply systems
Natural fluoridation of water occurs when fluoride compounds dissolve in water as it passes through rocks and soil. Tasmania’s natural water supplies are comparatively low in fluoride, so fluoridation of drinking water is used to adjust the level of fluoride in the water to a level considered safe and effective in preventing tooth decay.
The widespread fluoridation of water in Tasmania is conducted in accordance with the Australian National Oral Health Plan 2015-2024 which advocates water fluoridation of public water supplies for communities across Australia with populations of 1 000 or more. In Tasmania, fluoridation of public water supplies has been achieved in all communities of greater than 1 000. Only Tasmania, the Australian Capital Territory and the Northern Territory have achieved this significant outcome.
Tasmania was the first jurisdiction to fluoridate a public drinking water supply (Beaconsfield in 1953). Under the Fluoridation Act 1968, the Minister for Health directs TasWater (based on recommendations from the Fluoridation Committee) to fluoridate specific public water supplies in a prescribed manner. TasWater needs to monitor the level of fluoride in drinking water daily.
5.5.1 Fluoridation compliance
Of the Tasmanian population receiving a reticulated water supply, 98 per cent receive fluoridated water.5
Under the Fluoridation (Interim) Regulations 2009 the fluoride concentration range required in the drinking water supply (to achieve optimum tooth decay prevention) is 0.8 to 1.2 milligrams per litre (mg/L) whilst the maximum level of fluoride allowed in the water (ie the maximum level specified in the ADWG) is 1.5 mg/L. The Tasmanian Code of Practice for Fluoridation of Public Water Supplies (2007-10) prescribes a compliance level of 90 per cent (ie 90 per cent of all daily readings must fall within the required concentration range).
In 2016-17 there were 38 fluoridation systems in operation throughout the State servicing 51 of the 87 water supplies. Thirty one of the 39 fluoridation systems maintained an average fluoride level within the required fluoride concentration range.6 This is a decrease on the
5 TasWater is wholly responsible for the operation and maintenance of fluoridation systems and is obliged under the Fluoridation Act to fluoridate the drinking water when directed to do so.
6 All daily fluoride samples (both treated and distribution) are averaged over a 12 month period to result in a yearly fluoride average against which compliance is assessed.

TASMANIAN WATER AND SEWERAGE STATE OF THE INDUSTRY REPORT 2016-17 57
compliance reported in 2015-16. The non-compliant fluoridation systems, including their average fluoride concentration were Bicheno (0.73 mg/L), Distillery Creek (0.55 mg/L), Gawler (0.64 mg/L), Leven River (0.46 mg/L), Scamander (0.71 mg/L), St Helens (0.13 mg/L) and West Tamar (0.77 mg/L). All these systems provided less than the required annual average fluoride level.
Table 5.5 shows fluoridation compliance between 1 July 2012 and 30 June 2017. In 2016-17, 82 per cent of Tasmanians receiving a fluoridated reticulated water supply received water with an average fluoridation concentration within the prescribed range of 0.8 to 1.2 mg/L.
Table 5.5 Fluoridation compliance (per cent of serviced population)
2012-13 2013-14 2014-15 2015-16 2016-17
Fluoridation compliance 99 99 97 100 82
Of the 38 fluoridated systems 22 achieved compliance of 90 per cent or greater in 2016-17. These systems provided fluoridated water to approximately 64 per cent of the Tasmanian population who receive reticulated water. This is a decrease from 2015-16 when 87 per cent of the serviced population received compliant fluoridated water and is comparable to 2014-15 when 69 per cent of the population received compliant fluoridated water.
The Hobart supply system is complex with four fluoridation systems servicing the ten water supplies. At any given time the reticulated water can comprise a mix of water from different supplies and fluoridation systems, with the mix varying in different Hobart locations. Extensive monitoring therefore occurs around the Greater Hobart reticulation network to confirm fluoridation levels being supplied to customers. Two of the four fluoridation systems servicing Greater Hobart did not comply with the requirement of having greater than 90 per cent of samples within the 0.8 – 1.2 mg/L range.


TASMANIAN WATER AND SEWERAGE STATE OF THE INDUSTRY REPORT 2016-17 59
6 ENVIRONMENT
This Chapter outlines the performance of TasWater’s sewage treatment plants (STPs) including effluent and biosolids reuse and their environmental impact on waterways.
6.1 Sewerage schemes
For the purposes of this Chapter, only the performance of the 79 Level 2 STPs operated by TasWater is assessed.
Key issues, which can have an impact on performance of STPs, are outlined in Appendix 2.
The EPA’s analysis of the performance of individual STPs operated by TasWater during 2016-17 can be found in Appendix 4.
As shown in Table 6.1, 14 of TasWater’s Level 2 STPs received annual inflows of more than 1 000 ML for 2016-17. Most of these service major urban catchments and/or accept large volumes of industrial sewage (ie Pardoe, Smithton, Ulverstone and Wynyard). In 2016-17, Pardoe STP was the largest STP by inflow volume in the State.
Table 6.1 Tasmanian STPs with annual inflows exceeding 1 000 ML/year
Premises name
Catchment area
Total flow
2015-16
ML/year
Total flow
2016-17
ML/year Change (%)
Pardoe Devonport 4 838 5 922 22
Ti-Tree Bend Launceston 6 158 5 805 -6
Macquarie Point Hobart 3 780 4 016 6
Ulverstone Ulverstone 2 631 3 793 44
Selfs Point Hobart 3 696 3 756 2
Prince of Wales Bay Hobart 2 963 3 035 2
Round Hill Burnie 2 042 2 662 30
Rosny Hobart 2 192 2 302 5
Cameron Bay Hobart 1 682 1 854 10
Wynyard Wynyard 1 345 1 734 29
Smithton Smithton 1 308 1 558 19
Blackmans Bay Kingston 1 474 1 507 2
Newnham Drive Launceston 1 122 1 170 4
Norwood Launceston 820 1 045 27
Sewage treatment plants (STPs)
The information in this section does not extend to Level 1 STPs, which have a design capacity of less than 100 kilolitres per day and continue to be regulated by local government (Councils), nor does it include STPs operated by bodies other than TasWater.
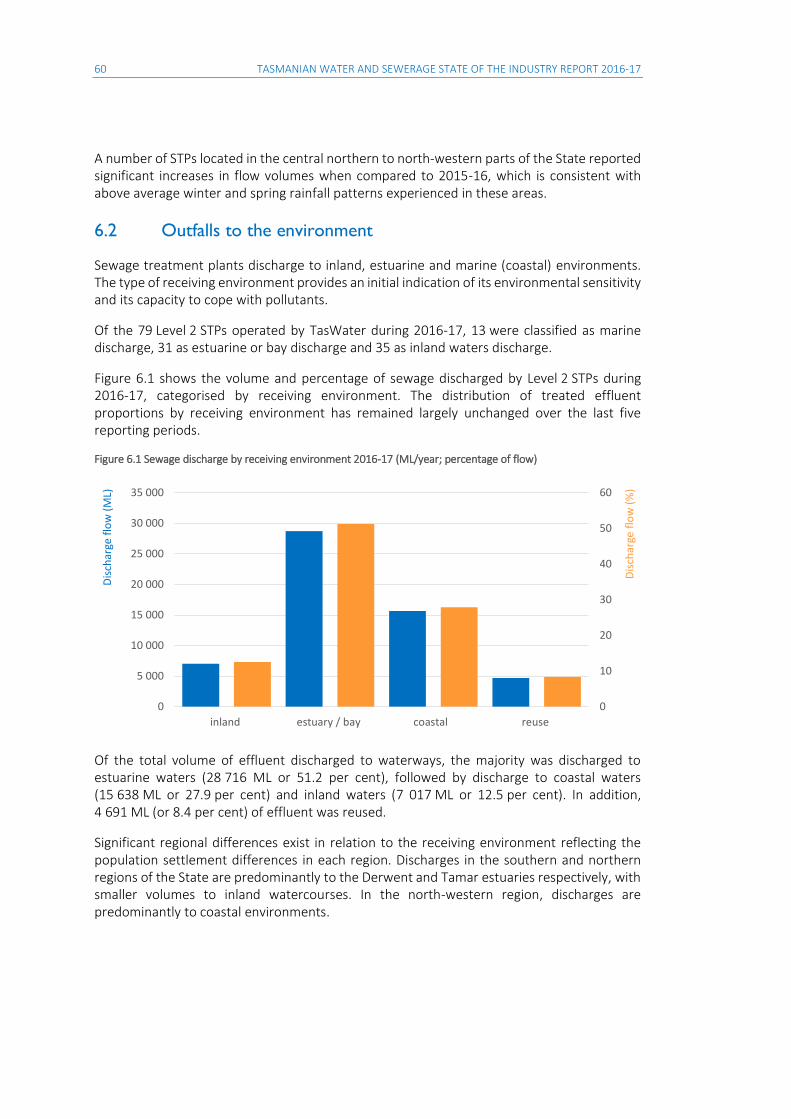
60 TASMANIAN WATER AND SEWERAGE STATE OF THE INDUSTRY REPORT 2016-17
A number of STPs located in the central northern to north-western parts of the State reported significant increases in flow volumes when compared to 2015-16, which is consistent with above average winter and spring rainfall patterns experienced in these areas.
6.2 Outfalls to the environment
Sewage treatment plants discharge to inland, estuarine and marine (coastal) environments. The type of receiving environment provides an initial indication of its environmental sensitivity and its capacity to cope with pollutants.
Of the 79 Level 2 STPs operated by TasWater during 2016-17, 13 were classified as marine discharge, 31 as estuarine or bay discharge and 35 as inland waters discharge.
Figure 6.1 shows the volume and percentage of sewage discharged by Level 2 STPs during 2016-17, categorised by receiving environment. The distribution of treated effluent proportions by receiving environment has remained largely unchanged over the last five reporting periods.
Figure 6.1 Sewage discharge by receiving environment 2016-17 (ML/year; percentage of flow)
Of the total volume of effluent discharged to waterways, the majority was discharged to estuarine waters (28 716 ML or 51.2 per cent), followed by discharge to coastal waters (15 638 ML or 27.9 per cent) and inland waters (7 017 ML or 12.5 per cent). In addition, 4 691 ML (or 8.4 per cent) of effluent was reused.
Significant regional differences exist in relation to the receiving environment reflecting the population settlement differences in each region. Discharges in the southern and northern regions of the State are predominantly to the Derwent and Tamar estuaries respectively, with smaller volumes to inland watercourses. In the north-western region, discharges are predominantly to coastal environments.
0
10
20
30
40
50
60
0
5 000
10 000
15 000
20 000
25 000
30 000
35 000
inland estuary / bay coastal reuse
Dis
char
ge f
low
(%
)
Dis
char
ge f
low
(M
L)

TASMANIAN WATER AND SEWERAGE STATE OF THE INDUSTRY REPORT 2016-17 61
6.4 Sewage treatment plant compliance
The level of compliance with discharge limits stipulated by the EPA for STPs is a key measure of overall environmental compliance.
In Tasmania, regulatory discharge limits for Level 2 STPs are specified in the environmental conditions issued for each facility by the Director of the Tasmanian EPA. Discharge limits vary depending on the sensitivity of the receiving environment and the volume of discharge. Discharge limits may also vary depending on the date the conditions were issued. A program of updates is underway to ensure all STPs are ultimately subject to contemporary regulatory discharge limits.
STP performance is also evaluated against Accepted Modern Technology (AMT) limits. AMT limits represent a theoretical but stable benchmark. While AMT limits are not binding, the degree to which they are met is an indicator of performance over time, as they have remained unchanged over the last five years. Decisions about upgrading regulatory limits to AMT standard for a particular STP will occur in the future.
Section 6.4.1 examines compliance against current regulatory limits, whilst performance against potential AMT limits is examined in section 6.4.2.
Compliance has been calculated for TasWater as a single entity since its formation in July 2013. Previously, compliance was calculated separately for the three Regional Water and Sewerage Corporations. Back calculations of compliance on a state-wide level for the period prior to July 2013 provide a baseline against which TasWater’s compliance can be compared.
Calculations and charts in this section are based on analysis of effluent quality monitoring data held by EPA Tasmania.
Compliance is assessed for each parameter for which a limit is specified by determining the number of scheduled samples that complied with the specified limit as a percentage of the total number of scheduled samples analysed in the reporting period. Compliance percentages for all parameters are combined to provide one overall compliance figure for each STP. To account for STPs of varying hydraulic capacities, the flow weighted average of individual STP compliance is used as the value representing the overall utility-based compliance.
If both land-based and water-based discharge limits exist for a STP, compliance is assessed separately against each limit, provided an adequate monitoring data set is available. To calculate utility-based compliance, only flows directed to the respective receiving environments (ie waters vs reuse) are taken into account.
Discharge limits
Environmental conditions for many STPs have been updated over the past years via the issue of new Environment Protection Notices (EPNs) - a process that is continuing. While the majority of these EPNs contain interim discharge limits based on the 90th percentile of recent performance, the next phase of EPNs will introduce limits that reflect the assimilative capacity of the receiving environment and are commensurate with contemporary standards. This process will ultimately provide a more consistent and relevant benchmark for STP compliance.

62 TASMANIAN WATER AND SEWERAGE STATE OF THE INDUSTRY REPORT 2016-17
6.4.1 Compliance with current discharge to waters limits
After excluding STPs without regulatory discharge to waters limits (which did not discharge to water), or those with inadequate monitoring data sets, 72 out of the total 79 Level 2 STPs were assessed under this measure.
Figure 6.2 shows compliance against discharge to waters limits over time. In 2016-17, TasWater achieved 85.9 per cent compliance with the regulatory discharge to waters limits, continuing the upward trend and slightly exceeding the compliance level of 85.2 per cent recorded for 2012-3 prior to TasWater’s formation.
The majority of mainland utilities reporting on this indicator under the NPR framework in the past have recorded compliance levels in excess of 95 per cent. However, under the NPR classification system TasWater was compared with large utilities servicing predominantly metropolitan areas, which establishes a relatively higher benchmark. Since this indicator is no longer included in the NPR, a direct comparison with mainland utilities is no longer possible.
Figure 6.2 Compliance against discharge to waters regulatory limits (per cent)
Compliance levels are further illustrated in Table 6.2. In 2016-17, 12 TasWater STPs were classified as substantially non-compliant (ie 75 per cent or less compliant), down from 17 STPs in this category in 2015-16. Comparatively more STPs were in the two higher compliance categories in 2016-17 than in previous periods.
Overall, compared to 2015-16, 21 STPs improved performance and moved into a higher compliance category. Of these, 12 STPs moved into the greater than 90 per cent category, with combined inflows of approximately 5 420 ML. Amongst these was the Macquarie Point STP (ie one of the ‘Big13’1) which improved from 88.3 per cent to 94.0 per cent compliance in
1 Refers to the ‘Big 13’ strategy targeting performance improvements for TasWater’s largest STPs by volume, discussed in Chapter 8.
75
80
85
90
95
100
2009-10 2010-11 2011-12 2012-13 2013-14 2014-15 2015-16 2016-17
Compliance Calculations
Effluent compliance can be calculated in a number of ways. The EPA uses an independent limits calculation where each testing parameter is assessed for compliance and the results aggregated. This approach allows a more detailed analysis of non-compliant parameters within a monitoring program. TasWater has traditionally used a linked limits calculation where all parameters must be compliant before the sample is considered compliant. The linked limits approach is more stringent and leads to lower state-wide compliance results.

TASMANIAN WATER AND SEWERAGE STATE OF THE INDUSTRY REPORT 2016-17 63
2016-17. Of the six STPs that dropped from the greater than 90 per cent category in 2016-17, two were ‘Big 13’ STPs Round Hill and Wynyard, with combined inflows of just under 4 400 ML.
Two STPs (Risdon Vale and St Helens) achieved 100 per cent compliance and are considered fully compliant with regulatory discharge limits for 2016-17. Risdon Vale was subject to older, less stringent, regulatory discharge limits in 2016-17. St Helens is subject to contemporary site-specific regulatory discharge limits which are more stringent than AMT requirements.
Table 6.2 Number of STPs by compliance category (regulatory limits)
2012-13 2013-14 2014-15 2015-16 2016-17
>90% compliance 33 25 22 24 30
>75 - 90% compliance 23 30 29 31 30
>50 - 75% compliance 11 15 15 12 8
<50 % compliance 9 5 5 5 4
Table 6.3 shows the two STPs which demonstrated 50 per cent or less compliance against regulatory discharge to water limits in 2016-17. Both are lagoon systems. Sludge surveys carried out in the past two years confirmed significant sludge accumulations within treatment lagoons at Port Sorell STP, which may be impacting on performance. Partial desludging of Port Sorell STP was undertaken in 2016-17 and further planned desludging is expected to lead to improved performance outcomes in the future.
Kempton (27.1 per cent) and Oatlands (37.5 per cent) STPs were also assessed to have low compliance levels with discharge to water limits but did not discharge to the aquatic environment, as full reuse of effluent from these STPs was achieved during 2016-17. The discharge to waters compliance figure for STPs with full reuse has relevance as an indicator of the likely discharge quality for potential future discharge events. It does not, however, contribute to the flow weighted utility-based compliance result for TasWater for 2016-17, as there is no contributing discharge flow for this period.
Table 6.3 STPs with 50 per cent or less compliance against discharge to waters limits
STP Limit type Number of limits assessed Compliance
(%)
Port Sorell1 Max 4 39.6
Bridport1 Max/Min 9 49.1
Notes: 1. Indicates consecutive years of 50 per cent or less compliance.
6.4.2 Performance against AMT discharge to waters limits
The limits adopted for the analysis in this section represent AMT standards contained in the Emission Limit Guidelines for Sewage Treatment Plants (DPIPWE, 2001). AMT limits, which differentiate between fresh water and marine receiving environment, incorporate stringent nutrient reduction standards. While AMT limits generally reflect expected performance at a tertiary treatment level, most sewage in Tasmania is currently treated to a secondary level only.
Figure 6.3 shows performance of TasWater’s Level 2 STPs against AMT limits as a time series.

64 TASMANIAN WATER AND SEWERAGE STATE OF THE INDUSTRY REPORT 2016-17
Figure 6.3 Performance against AMT discharge to waters limits (per cent)
Performance against AMT limits has remained relatively stable over the years with no consistent trends. The 2016-17 performance level of 62.0 per cent of flow-weighted sample compliance indicates a slight increase against the 2015-16 performance of 61.0 per cent but is still below the level of 63.5 per cent achieved in 2014-15.
Two STPs, Ranelagh and St Helens, achieved 100 per cent compliance in accordance with AMT limits in 2016-17.
The AMT category distribution in Table 6.4 below shows an improvement when compared to past reporting periods, with ten STPs represented in the greater than 90 per cent category for the first time since TasWater’s formation. Similarly, there was an increase in the second highest performing category which overall represents a slight upward trend in the number of treatment plants in the two higher-performing categories for 2016-17.
Table 6.4 STPs by performance category (AMT limits)
2012-13 2013-14 2014-15 2015-16 2016-17
>90% compliance 7 7 9 9 10
>75 - 90% compliance 14 13 8 9 15
>50 - 75% compliance 32 38 39 33 34
<50 % compliance 25 19 17 23 15
Despite an additional seven STPs achieving above 75 per cent compliance in 2016-17 when compared to 2015-16, TasWater’s overall flow weighted performance against AMT limits did not increase significantly. A contributing factor for this result is the relative size of the STPs involved.
Of those STPs that improved performance and moved into a higher compliance category, two are considered to be ‘Big13’; Cameron Bay STP increased from 74.1 to 80.2 per cent compliance and Newnham STP edged above 50 per cent compliance. Just three STPs dropped into a lesser compliance category in 2016-17, two of which are considered to be ‘Big13’; Round Hill STP dropped from 95.4 to 81.3 per cent compliance while Wynyard STP compliance decreased from 75.9 to 69.0 per cent against AMT limits. These two STPs had combined inflows of around 4 400 ML.
50
55
60
65
70
75
80
85
90
95
100
2009-10 2010-11 2011-12 2012-13 2013-14 2014-15 2015-16 2016-17

TASMANIAN WATER AND SEWERAGE STATE OF THE INDUSTRY REPORT 2016-17 65
6.4.3 Summary of discharge to waters limits compliance
TasWater’s flow weighted compliance against regulatory discharge to waters limits in 2016-17 continued the upwards trend observed in 2015-16 with a further lift from 84.2 per cent in 2015-16 to 85.9 per cent in 2016-17. Flow weighted performance against AMT limits improved from 61.0 per cent in 2015-16 to 62.0 per cent in 2016-17. A positive development is a shift in the numbers of STPs in the AMT performance categories from the lower towards the higher categories.
Whereas both regulatory and AMT compliance measures improved in the 2016-17 period, the percentage improvements observed remain relatively small and do not represent a significant uplift in compliance.
Significant flooding affected the north of Tasmania in early June 2016. A number of TasWater’s Level 2 STPs were affected either through flooding of the STP itself (as was the case for Deloraine, Fingal, Hoblers Bridge, Norwood, Turners Beach and Westbury STPs); temporary loss of operator access to the infrastructure; and/or the need for precautionary safety measures such as the removal/disconnection of chlorination infrastructure. Despite the potential for longer lasting negative impacts on sewage treatment performance where damage to infrastructure or significant loss of treatment biomass occurred, compliance results for the period following the floods showed no significant drop in performance for the flood affected STPs.
Table A4.1 and Figures A4.1 to A4.2 in Appendix 4 show compliance with regulatory limits and AMT limits for each STP.
6.4.4 Compliance with discharge to land limits
This section assesses the levels of compliance reported for effluent recycling schemes which utilise treated effluent generated by Level 2 STPs. Effluent recycling schemes operated during the reporting period were generally required to comply with ‘Class B2’ quality standards (as outlined in the Environmental Guidelines for the Use of Recycled Water in Tasmania (DPIWE, 2002).
In 2016-17, TasWater’s flow-weighted performance against ‘Class B’ reuse limits was 88.1 per cent, dropping below the acceptable range of greater than 90 per cent for the first time since July 2009 (Figure 6.4). This decrease in flow weighted performance is largely attributable to low sample compliance with biochemical oxygen demand limits at Rosny STP, which provided the largest single contribution to the effluent reused from Level 2 STPs (27 per cent) in 2016-17.
A review of compliance levels achieved by individual STPs indicates that some systems continue to struggle with overloading and/or sludge accumulation, with one STP reporting less than 50 per cent compliance (Kempton), another eight STPs reporting less than 75 per cent compliance and nine STPs reporting less than 90 per cent compliance with the relevant limits. Seventeen STPs achieved compliance of 90 per cent or above with ‘Class B’ reuse limits in 2016-17.
2 The EPA’s assessment is against ‘Class B’ Recycled Water quality with an adjusted pH range of 5.5 – 8.5 and an additional upper limit of 10 000 cfu/100mL thermotolerant coliforms.

66 TASMANIAN WATER AND SEWERAGE STATE OF THE INDUSTRY REPORT 2016-17
Figure 6.4 Compliance with ‘Class B’ discharge to land limits (per cent)
Table A4.2 and A4.3 in Appendix 4 show compliance with ‘Class B’ reuse limits and reuse proportion for each STP.
6.4.5 Public disclosure of sewage treatment plant performance
TasWater is required to submit Annual Environmental Review (AER) reports to the Director, EPA and make these publically available. TasWater provided AERs for all Level 2 STPs in 2016-17 and has therefore satisfied this requirement.
The EPA makes AERs available to the public upon request. In addition, publication of STP performance information in this report is another means of public disclosure, supporting transparency and making TasWater accountable to the community, government and regulators for its performance.
Monitoring data for STPs discharging to estuarine and marine environments is available from the National Outfalls Database3. TasWater makes discharge monitoring results for individual STPs available to the public on request.
6.4.6 Compliance with the Director, EPA’s requirements
As discussed in previous sections, apart from two STPs, TasWater did not achieve full compliance with regulatory discharge limits for Level 2 STPs.
Incidents with the potential to cause environmental harm at STPs or associated sewerage infrastructure can trigger an enforcement response under the provisions of the Environmental Management and Pollution Control Act 1994, or the associated regulations. Environmental Infringement Notices (EINs) and formal Written Warning letters are the most commonly used enforcement provisions.
TasWater received two EINs in June 2017 for breach of permit conditions in relation to works for the construction of a new outfall at Carrick STP in 2016-17. No formal Written Warnings were issued in 2016-17.
3 Refer to www.nod.org.au for further details
80
82
84
86
88
90
92
94
96
98
100
2009-10 2010-11 2011-12 2012-13 2013-14 2014-15 2015-16 2016-17

TASMANIAN WATER AND SEWERAGE STATE OF THE INDUSTRY REPORT 2016-17 67
On several occasions, EPA officers identified instances of non-compliance with permit conditions and notified TasWater of the need to implement measures for improvement. In these instances, the EPA did not pursue formal enforcement action against the non-compliances, being satisfied that such action would not have been proportionate to the non-compliance, and that TasWater had implemented appropriate corrective actions. Such instances include:
unauthorised discharge to waters from Scamander STP in December 2016;
failure to undertake effluent compliance sampling for discharge to water at St Marys and Railton STPs;
failure to undertake effluent compliance sampling for discharge to a reuse scheme at Beaconsfield STP; and
non-compliance against permit conditions for the Cameron Bay STP in three instances, in relation to calibration of equipment, records of calibration and odour management.
6.5 Biosolids reuse
This section reports on the level of reuse of biosolids, being the stabilised organic solids that result from sewage treatment processes.
Reuse involves managing biosolids safely and sustainably to beneficially utilise their nutrient, energy or other values. This may include biosolids beneficially used for agriculture (as fertiliser), soil conditioning, mine rehabilitation and other applications recognised as reuse.
The reuse proportion can be calculated on the basis of:
Total dry weight (tonnes) of biosolids reused
Total dry weight (tonnes) of biosolids produced during the reporting period
Based on the information provided by TasWater to the EPA under the EPA’s regulatory annual reporting obligations, approximately 6 400 dry solid tonnes (DST) of biosolids were produced at Level 2 STPs across Tasmania in 2016-17. Approximately 2 300 DST remained stored on STP sites at the end of the reporting period while approximately 6 200 DST were beneficially reused during 2016-17. A minor amount of about 9 DST was taken to landfill.
The proportion of the biosolids material beneficially reused in 2016-17 was 95.7 per cent of the volume generated. Significant volumes of biosolids (1 700 DST) remained stockpiled at Ti-Tree Bend STP at the end of 2016-17.
TasWater continued sludge surveys at lagoon systems across the state in 2016-17, complementing the available information on sludge accumulation and feeding into the ongoing review of desludging priorities. Significant sludge accumulations at levels likely to impact on the treatment capacity are evident in a number of lagoon systems. Desludging of lagoons with a high percentage of accumulated sludge is likely to enhance the treatment capacity of a lagoon system. Port Sorell STP lagoons were desludged in 2016-17, and a major desludging program commenced at the Smithton STP in mid-2017.
An overview of the STPs generating the greatest volumes of biosolids in 2016-17 and associated reuse/management practices is provided in Table 6.5 below.

6
8
TASM
AN
IAN
WA
TER A
ND
SEWER
AG
E STATE O
F THE IN
DU
STRY R
EPOR
T 20
16
-17
Table 6.5 Biosolids – major volumes generated and reuse percentage in 2016-17
Ti-Tree Bend 1 115 1 415 Ti-Tree Bend STP generates significant volumes of biosolids at the premises as well as receiving additional material from other STPs (Hoblers Bridge, Newnham, Norwood, Riverside and St Helens STPs).
1 700 DSTs of sewage sludge remained stockpiled at the STP premises at the end of 2016-17, down from 2 000 DST at the end of 2015-16. The remainder was beneficially reused on agricultural land.
123%
Selfs Point 671 671 Biosolids generated at Selfs Point STP were beneficially reused on agricultural land. 100%
Port Sorell 600 600 Biosolids removed from the Port Sorell lagoon STP were beneficially reuse on agricultural land.
100%
Prince of Wales Bay 489 489 Biosolids generated at Prince of Wales Bay STP were composted prior to beneficial reuse. 100%
Rosny 464 464 Biosolids generated at Rosny STP were beneficially reused on agricultural land. 100%
State-wide (TasWater) total
6 445 6 165 Material removed from the treatment system but not the premises is counted as generated but not reused. An additional 2336 DST remains stored at STP sites at the end of 2016-17, up from 2065 at the end of 2015-16.
Composted sewage sludge is counted as beneficially reused if the end product is used in accordance with the relevant definition in the Tasmanian Biosolids Reuse Guidelines (1999). Stockpiles from previous reporting periods are not counted in biosolids generated.
95.7%
STP Name Biosolids generated
(dry solid tonnes / year)
Biosolids beneficially reused
(dry solid tonnes / year)
End use / purpose Biosolids reused
(%)

TASMANIAN WATER AND SEWERAGE STATE OF THE INDUSTRY REPORT 2016-17 69
69
TA
SMA
NIA
N W
ATER
AN
D SEW
ERA
GE STA
TE OF TH
E IND
USTR
Y REPO
RT 2
01
6-1
7
6.6 Net greenhouse gas emissions
This section reports on the impact of water and sewerage activities on greenhouse gas emissions. In doing so, it is important not to consider a single indicator in isolation, but rather to look at the total environmental footprint arising from water and sewerage activities. For example, increased sewage treatment levels can provide water quality benefits but will also consume additional energy, resulting in greater net greenhouse gas emissions.
In 2016-17, TasWater’s total net greenhouse gas emissions were around 32 500 tonnes CO2-equivalents (CO2e) or an average of 159 tonnes produced per 1 000 properties. Greenhouse gas emissions categorised into water and sewerage related operations are provided in Table 6.6.
As the quality and accuracy of the data reported to date is low, the only observation that can be made is that sewerage related operations produce a higher volume of CO2e compared to water treatment operations due to the nature of STPs and the production of nitrous oxide and methane through sewage processing.
Table 6.6 Volume of greenhouse gases produced by TasWater (CO2-equivalent)
2013-14 8 888 44.3 25 433 145.4
2014-15 9 786 48.8 21 697 123.0
2015-16 9 873 48.8 22 646 127.3
2016-17 9 129 44.5 21 856 121.6
TasWater did not trigger the 50 000 tonnes CO2-equivalent per facility reporting threshold under the National Greenhouse and Energy Reporting Act 2007 (Cwlth).
TasWater is not required to report greenhouse gas emissions directly to the EPA under the stipulated environmental conditions for STPs.
Water-related operations Sewerage-related operations
C2e (tonnes) CO2e (per 1 000 properties)
CO2e (tonnes) CO2e (per 1 000 properties)

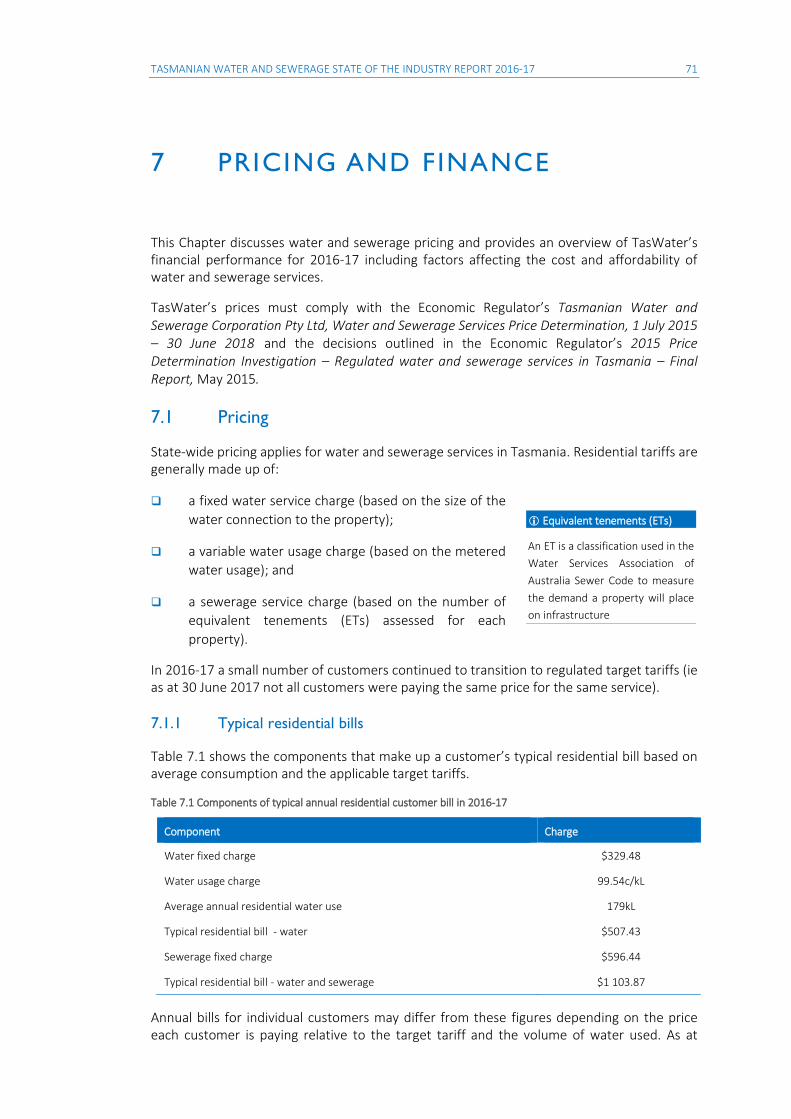
TASMANIAN WATER AND SEWERAGE STATE OF THE INDUSTRY REPORT 2016-17 71
7 PRICING AND FINANCE
This Chapter discusses water and sewerage pricing and provides an overview of TasWater’s financial performance for 2016-17 including factors affecting the cost and affordability of water and sewerage services.
TasWater’s prices must comply with the Economic Regulator’s Tasmanian Water and Sewerage Corporation Pty Ltd, Water and Sewerage Services Price Determination, 1 July 2015 – 30 June 2018 and the decisions outlined in the Economic Regulator’s 2015 Price Determination Investigation – Regulated water and sewerage services in Tasmania – Final Report, May 2015.
7.1 Pricing
State-wide pricing applies for water and sewerage services in Tasmania. Residential tariffs are generally made up of:
a fixed water service charge (based on the size of the
water connection to the property);
a variable water usage charge (based on the metered
water usage); and
a sewerage service charge (based on the number of
equivalent tenements (ETs) assessed for each
property).
In 2016-17 a small number of customers continued to transition to regulated target tariffs (ie as at 30 June 2017 not all customers were paying the same price for the same service).
7.1.1 Typical residential bills
Table 7.1 shows the components that make up a customer’s typical residential bill based on average consumption and the applicable target tariffs.
Table 7.1 Components of typical annual residential customer bill in 2016-17
Component Charge
Water fixed charge $329.48
Water usage charge 99.54c/kL
Average annual residential water use 179kL
Typical residential bill - water $507.43
Sewerage fixed charge $596.44
Typical residential bill - water and sewerage $1 103.87
Annual bills for individual customers may differ from these figures depending on the price each customer is paying relative to the target tariff and the volume of water used. As at
Equivalent tenements (ETs)
An ET is a classification used in the
Water Services Association of
Australia Sewer Code to measure
the demand a property will place
on infrastructure

72 TASMANIAN WATER AND SEWERAGE STATE OF THE INDUSTRY REPORT 2016-17
30 June 2017, TasWater has advised that 94.1 per cent of customers were on the target tariff for water and 93.7 per cent of customers were on target tariff for sewerage. Under the Industry Act, the transition of customers to target tariffs is required to be completed by 1 July 2020. Price constraints continued to apply during 2016-17 to customers transitioning up to target tariffs.
Figure 7.1 provides a comparison of water and sewerage bills for customers of major water utilities (with 100 000 or more customers) across Australia, including TasWater (target tariffs), for a hypothetical residential customer using 200 kL per annum in 2016-17.1 The typical residential bill for water and sewerage services was around $1 300 while a TasWater customer’s bill was the fourth lowest in this group at $1 125, or around nine per cent below the national median.
Figure 7.1 Annual bills based on 200kL/a (water and sewerage), 2016-17
Within this group, Queensland's water utilities are the most expensive. Overall, it appears that TasWater customers are paying around $150 less per annum than their interstate counterparts for water and sewerage. However, this reflects the fact that TasWater prices are moving towards full cost recovery and have been constrained by limits on price increases.
Figure 7.2 shows the calculated annual residential bill for TasWater customers based on the target tariffs, average usage and 200 kL per annum.
In 2016-17, annual residential bills rose by 3.6 per cent nominally, which will continue each year over the second regulatory period from July 2015 to June 2018 (Figure 7.2).
1 Bureau of Meteorology, National Performance Report - urban water utilities, 2016-17 (indicator P7).
$1 074
$1 084
$1 119
$1 125
$1 147
$1 152
$1 219
$1 253
$1 260
$1 338
$1 418
$1 676
$1 703
$1 759
0 200 400 600 800 1000 1200 1400 1600 1800
0 200 400 600 800 1000 1200 1400 1600 1800
Sydney Water Corp. (NSW)
Barwon Water (Vic)
Hunter Water (NSW)
TasWater (Tas)
City West Water (Vic)
Icon Water Ltd. (ACT)
South East Water Ltd. (Vic)
SA Water Corp.(SA)
Yarra Valley Water Ltd. (Vic)
Water Corp. - Perth (WA)
Queensland Urban Utilities (Qld)
Unitywater (Qld)
Gold Coast City Council (Qld)
Logan City Council (Qld)
water charges
sewerage charges

TASMANIAN WATER AND SEWERAGE STATE OF THE INDUSTRY REPORT 2016-17 73
Figure 7.2 Annual residential bill ($nominal)
Compared to other large utilities nationally, TasWater’s fixed water charges are notably high, with the mainland charge typically around $200 per property.2 As a percentage of total water and sewerage bills, TasWater’s fixed water charges represent around 30 per cent of the total while the fixed water charges of mainland providers are typically around 15 per cent of the total.
Conversely, TasWater’s usage charges are significantly less than those charged by mainland utilities, whose higher usage charges (around $2.60 per kL compared to TasWater’s $1.00 per kL) reflect priorities to encourage efficient water use. For example, many mainland utilities have inclining block tariff structures for water, with usage charges rising to over $3.00 per kL. This difference in pricing reflects the fact that Tasmania does not typically experience water shortages with respect to supplying water for urban use.
This pricing structure reflects the fact that the fixed cost of providing the service to a property (such as the cost of maintaining dams, pipes, reservoirs and other essential infrastructure) is much higher than the variable cost of delivering water to a property.
7.1.2 Concession customers
To be eligible for a concession discount, the applicant must be legally responsible for the account and occupy the property as their principal place of residence as well as holding either a:
Department of Human Services Health Care Card;
Department of Human Services or Department of Veterans’ Affairs Pensioner Concession Card; or
Department of Veterans’ Affairs Health Card - All Conditions (“Gold Card”).
Eligible customers were entitled to an annual water and sewerage concession discount of up to $186 ($93 each for water and sewerage) in 2016-17. Year on year, the concession has
2 Bureau of Meteorology, National Performance Report - urban water utilities, 2016-17 (indicator P1.2)
$ 900
$ 950
$1 000
$1 050
$1 100
$1 150
$1 200
Jul-12 Jul-13 Jul-14 Jul-15 Jul-16 Jul-17
average usage
200 kL
based on:

74 TASMANIAN WATER AND SEWERAGE STATE OF THE INDUSTRY REPORT 2016-17
generally increased in line with prices. In 2016-17, 55 696 customers received the benefit of a concession discount.
These concession arrangements are funded by the State Government and administered by TasWater. A community service obligation (CSO) payment is a subsidy provided by the State Government to allow for the provision of a good and/or service at less than total cost. In 2016-17, TasWater received a total of $8.5 million in CSO payments to cover the cost of providing these concessions.
7.2 Financial performance
This section presents TasWater’s financial performance against a range of indicators. Analysis of these indicators provides a guide as to TasWater’s financial efficiency, viability and longer term sustainability. Data for 2012-13 is the sum of the previous regional corporations’ financial performance.
7.2.1 Revenue
Table 7.2 shows the previous regional corporations’ aggregated total income and TasWater’s total income together with the revenue collected from the provision of regulated water and sewerage services for the period 1 July 2012 to 30 June 2017 inclusive. It should be noted that total income includes revenue from other sources3 but does not include revenue from third parties (ie CSOs) or investments.
Table 7.2 Revenue ($'000s, nominal)
2012-13 2013-14 2014-15 2015-16 2016-17
Water 121 844 129 071 150 070 142 665 143 471
Sewerage 109 993 121 519 146 389 150 450 157 197
Total income 263 460 268 617 300 314 309 331 315 484
Total income in 2016-17 increased slightly reflecting underlying increases in regulated target tariffs and the continuation of arrangements to transition customers up to these tariffs. Residential revenue from water usage represented around 34 per cent of water revenue in 2016-17, which was 30 per cent higher than the previous year (26 per cent). The fall in water revenue from 2014-15 to 2015-16 was consistent with a decrease in urban water supplied and customers paying above target moving down to target tariffs in accordance with the Regulator’s 2015 Determination.
7.2.2 Asset values
The written down replacement cost (WDRC) of TasWater’s water and sewerage infrastructure assets (excluding plant and equipment) is shown in Table 7.3. For regulatory purposes, TasWater is required to report on a WDRC basis rather than on the fair value basis required for its financial statements.4
3 See the 2013-14 National Performance Framework: Urban performance reporting indicators and definitions handbook for definitions.
4 See Note 9 of TasWater’s 2015-16 Financial Statements (attachment to TasWater 2015-16 Annual Report).

TASMANIAN WATER AND SEWERAGE STATE OF THE INDUSTRY REPORT 2016-17 75
Table 7.3 Fixed Asset values ($'000s, nominal)
2012-13 2013-14 2014-15 2015-16 2016-17
Water assets 1 441 614 1 383 105 1 378 227 1 308 099 1 270 735
Sewerage assets 1 369 638 1 307 119 1 316 010 1 320 226 1 289 229
As at 30 June 2017 TasWater held water and sewerage assets with a WDRC of around $2.5 billion. Over recent years, regulatory depreciation has offset capital expenditure and led to decreases in fixed asset values.
7.2.3 Operating costs
Operating costs (Opex) include any costs associated with the operation and maintenance of the infrastructure assets used to provide water and sewerage services plus the associated administration costs. Opex includes salaries and wages, chemicals and raw materials and energy costs. Table 7.4 shows TasWater’s Opex and the breakdown between water and sewerage operations.
Table 7.4 Operating costs ($'000s, nominal)
2012-13 2013-14 2014-15 2015-16 2016-17
Water 73 181 71 061 80 655 88 951 84 184
Sewerage 80 849 82 559 85 796 88 812 103 414
Total 154 030 153 620 166 451 177 763 187 598
TasWater’s Opex rose by 5.5 per cent in 2016-17 compared to the previous year due, in part, to increased employee and related expenses. The increase is less than in 2014-15 and 2015-16, when opex rose by 8.4 and 6.8 per cent respectively. TasWater advised that an internal restructure contributed to the reduced increase in costs and resulted from initiatives to reduce costs and improve efficiency through reviewing resource effort, rationalising and reorganising functions.
TasWater’s Opex per property, shown in Figure 7.3, was higher compared to the costs reported by mainland service providers5 which were typically around $865 per property in 2016-17.6 Across the nation, median operating cost decreased by five per cent in 2016-17, signalling a change from historical annual increases.
Residential water supply per property is 11 per cent higher in Tasmania than the national median, which also impacts on operating costs.
5 Major Utilities (Large) with 100 000 or more customers.
6 Bureau of Meteorology, National Performance Report - urban water utilities, 2016-17 (indicator F13).

76 TASMANIAN WATER AND SEWERAGE STATE OF THE INDUSTRY REPORT 2016-17
Figure 7.3 Operating costs ($/property)
It should be noted that TasWater’s Opex is based on its current level of regulatory non-compliance meaning that these costs are not directly comparable to mainland providers with relatively higher levels of regulatory compliance ie increased regulatory compliance generally leads to increases in operating costs. TasWater’s Opex also reflects its relatively larger number of dispersed water and sewerage assets.
7.2.4 Capital expenditure
Capital expenditure (Capex) is investment in new assets including expenditure on new works, renewals or replacements and any other expenditure that would otherwise be referred to as capital.
Figure 7.4 shows TasWater’s Capex for water and sewerage over the previous six years including 2016-17 when almost $104 million in Capex was spent. Gifted assets and developer charges have been excluded.
Figure 7.4 Capital expenditure ($’000s, nominal)
$754
$836 $826$888
$939$987
$ 0
$ 100
$ 200
$ 300
$ 400
$ 500
$ 600
$ 700
$ 800
$ 900
$1 000
2011-12 2012-13 2013-14 2014-15 2015-16 2016-17
sewerage
water
$/p
rop
erty
$119 398
$100 962
$74 161
$102 481
$128 647
$103 677
$ 0
$20 000
$40 000
$60 000
$80 000
$100 000
$120 000
$140 000
2011-12 2012-13 2013-14 2014-15 2015-16 2016-17
Tho
usa
nd
s
sewerage
water

TASMANIAN WATER AND SEWERAGE STATE OF THE INDUSTRY REPORT 2016-17 77
TasWater’s Capex during 2016-17 fell by around 20 per cent compared to the previous year, with the level of investment similar to 2014-15. TasWater advised that the focus for 2016-17 was to plan for a number of priority projects that are to be delivered in 2017-18, including the Kingborough Sewerage Project, the Regional Water Supply Improvement Program (which will aim to remove all Boil Water Alerts and Do No Consume Alerts by August 2018) as well as various water and sewerage optimisation projects. TasWater anticipates that total capital expenditure for the second regulatory period, which ceases on 30 June 2018, will be as noted in its Proposed Price and Service Plan for the third regulatory period.7
Capex per property was $322 for water and $210 for sewerage, which is high compared to similar utilities on the mainland that reported a median capex per property of around $165 for water and $237 for sewerage in 2016-17.8 This is indicative of the scale of capex required to bring the water and sewerage network up to expected standards, including the work associated with replacing old or poor infrastructure that is currently underperforming. Despite this, prices for Tasmanian customers are comparatively lower than their mainland counterparts.
Table 7.5 shows Capex categorised between new works, renewals or replacements and other capital expenditure for both water and sewerage infrastructure.
Table 7.5 Water and Sewerage Capex by category ($'000s, nominal)
2012-13 2013-14 2014-15 2015-16 2016-17
Water:
New works 38 881 4 798 6 399 4 764 3 887
Renewals or replacements 8 939 16 683 17 272 19 402 15 449
Other 7 569 15 090 26 613 46 191 46 588
Subtotal for water 55 389 36 571 50 284 70 357 65 924
Sewerage:
New works 17 050 4 932 6 284 5 559 10 351
Renewals or replacements 20 920 17 148 16 071 20 610 12 095
Other 7 602 15 510 29 842 32 121 15 308
Subtotal for sewerage 45 573 37 590 52 197 58 290 37 753
Total 100 962 74 161 102 481 128 647 103 677
The key drivers for capital expenditure in 2016-17 were compliance and renewals, with expenditure on improvements and new works (growth) for water notably lower for the year. Capex by driver is shown in Figure 7.5.
Approximately $54.7 million was spent on dedicated water assets and $38.5 million on dedicated sewerage assets, with the balance relating to both water and sewerage assets.
7 TasWater’s proposed PSP for 2018-21 is available at: http://www.economicregulator.tas.gov.au/water/pricing/price-determination-investigations/2018-water-and-sewerage-price-determination-investigation
8 Bureau of Meteorology, National Performance Report - urban water utilities, 2016-17 (indicators F28 & F29)

78 TASMANIAN WATER AND SEWERAGE STATE OF THE INDUSTRY REPORT 2016-17
During the year approximately $7.25 million was spent on non-network business information systems, office relocation, and fencing, fleet and facilities.
The amount spent on ‘other’ Capex, which includes compliance and improvements, has increased significantly during the previous five years. Expenditure in this category includes upgrading SCADA remote monitoring and control to improve system operation and service response times; and implementing a new Asset Management Information System (AMIS) in January 2017, that has the objective of improving how data is collected, work is programmed and asset performance is assessed.
Figure 7.5 Capex by driver, 2016-17
In 2016-17 TasWater did not receive any capital works grants from State or Commonwealth governments to undertake specific capital works. Further detail on capital projects completed or commenced during 2016-17 are outlined in section 7.3 below.
7.2.5 Other financial performance information
Table 7.6 provides a summary of other financial performance information used to determine how efficiently a business is using its financial resources, its financial sustainability and viability.
Table 7.6 Financial performance measures (nominal)
2012-13 2013-14 2014-15 2015-16 2016-17
Net profit after tax ($000s) 22 439 27 236 33 155 25 310 28 592
Profit ratio (%) 8.5 10.1 11.0 8.2 9.1
Economic rate of return 1.05 -0.20 0.65 0.48 -0.15
Dividends ($000s) 12 640 18 647 22 120 20 332 19 457
Dividend payout ratio (%) 56.3 68.5 66.7 80.3 68.0
Net debt to equity (%) 21.0 22.8 27.2 29.8
Interest cover (times) 0.88 0.91 0.61 0.48
Note: For the 2013-14 and 2014-15 state of the industry reports, the Interest Cover ratio was based on information published by the Auditor-General in its annual report to Parliament on the financial performance of Local Government and TasWater. The Auditor-General’s calculation of Earnings before Interest and Tax (EBIT) is based on TasWater’s statutory financial statements. However, the Regulator considers it more appropriate that the reporting of this measure is based on the Urban NPR requirements. The 2013-14 Urban NPR Handbook requires TasWater to, amongst other things, deduct depreciation based on the WDRC of its assets from its revenue when calculating EBIT. This results in TasWater reporting a far lower EBIT and consequentially, a far lower Interest Cover ratio than that reported by the Auditor-General. The Interest Cover ratio for each of the 2013-14, 2014-15, 2015-16 and 2016-17 financial years has therefore been reported on this basis.
compliance43%
growth14%
improvement16%
renewal27%

TASMANIAN WATER AND SEWERAGE STATE OF THE INDUSTRY REPORT 2016-17 79
Key observations:
Net profit after tax increased by 13 per cent in 2016-17 and remained within the range recorded for the four years prior.
TasWater’s economic rate of return remained relatively low as it continues to work towards meeting its regulatory compliance obligations.
TasWater’s profit ratio increased slightly compared to the previous year and was lower than that of most mainland utilities which was around 18 per cent.
TasWater’s return to its shareholders9 reduced slightly in 2016-17 and its dividend payout ratio reduced significantly compared to the previous year, to a level similar to the dividend payout ratios of comparable mainland utilities, which are typically around 60 per cent.
TasWater’s net debt to equity (NDTE) ratio while increasing remains low compared to the ratio for comparable mainland service providers where the median ratio is around 79 per cent.
In August 2016 the Board of TasWater determined it will reduce and freeze annual distributions to Owner Councils at $20 million for a period of seven years commencing 1 July 2018. Dividends will be more than halved to less than $10 million per annum, with the balance of payments made up of loan guarantee fees and income tax equivalent payments.
9 Returns to owners in 2016-17 excludes income tax equivalents and guarantee fees totalling $10.5 million.

80 TASMANIAN WATER AND SEWERAGE STATE OF THE INDUSTRY REPORT 2016-17
7.3 Status of major projects
This section provides an overview of the major projects completed or progressed by TasWater during 2016-17. Major projects are those that are high priority and/or involve expenditure of over $2 million.
TasWater’s 2015-18 price and service plan10 included its proposed major capital investment projects that were to be progressed or completed during the regulatory period. Therefore, it is appropriate TasWater explain delays or changes to its project schedule, because approved funds will flow from pricing whether the expenditure is incurred or not.
A range of major projects that continued or commenced during 2016-17, including the forecast expenditure for 2016-17 and the project budget, is set out in Table 7.7 below.
In 2016-17 TasWater completed nine major projects while five projects encountered delays that will affect their respective completion dates. Another 19 projects are still proceeding on schedule.
Of the seven projects listed as delayed or deferred in 2016-17, four projects were deferred or rescheduled after other higher priority projects were bought forward such as drinking water projects, while two projects were rescheduled to align with an updated management plan or to allow for additional planning requirements.
Five projects have had their timeframes for completion extended by a year or more either due to scheduling of staged works or an increase in costs.
10 TasWater’s 2015-18 PSP is available at: http://www.taswater.com.au/Your-Account/Price---Service-Plan

TA
SMA
NIA
N W
ATER
AN
D SEW
ERA
GE STA
TE OF TH
E IND
USTR
Y REPO
RT 2
01
6-1
7
81
Table 7.7 Major capital projects continued or commenced in 2016-17
Project Driver
Project
value
($ millions) Project description
Scheduled
start date
Scheduled
completion
date Status
Water
Regional Towns Water Supply Compliance $41 Project has been accelerated and split into five work packages in 11 towns. Construction works awarded in 2016-17 and tenders in progress
2016-17 2017-18 On schedule
Ridgeway Dam – Upgrade Post Tensioned Anchors
Compliance $22 Replace the existing post tensioned anchors to ensure the stability of the abutment blocks in the long-term.
2014-15 2022-23 Deferred
Tolosa Dam - decommissioning and supply upgrade
Compliance $19 Decommissioning of the dam and construction of two reservoirs and connecting pipework to replace the Tolosa Dam. Due to be completed in December 2017.
2014-15 2017-18 On schedule
King Island Water Supply Upgrade Compliance $16 Construction of a new water treatment plant and a connecting pipeline between Grassy and Currie.
2014-15 2018-19 Extended
Flinders Island Water Supply Compliance $11 Construction of water treatment infrastructure for the towns of Whitemark and Lady Barron to remove permanent boil water alerts.
2015-16 2017-18 On schedule
Ringarooma Valley Treated Water Supply Compliance $14.5 Project to provide clean drinking water to the towns of Ringarooma, Legerwood, Branxholm and Derby. The project may also incorporate construction of a pipeline to the town of Winnaleah.
In 2016-17 construction of pipelines completed and WTP and storage reservoirs were under construction.
Note: Partially funded from PSP1.
2013-14 2017-18 On schedule
Margate Water Main – Stage 2 Growth $8 Installation of pipeline to serve fast growing areas in Kingborough. 2010-11 2017-18 On schedule
Rosebery Water Treatment Plant Compliance $7 Construction of a new WTP for the town of Rosebery to improve compliance with ADWG.
2012-13 2017-18 Extended
Lake Mikany – Filter Buttress Compliance $7 Upgrade to the existing Lake Mikany Dam to lower operating risk associated with the dam.
2014-15 2018-19 Extended

8
2
TASM
AN
IAN
WA
TER A
ND
SEWER
AG
E STATE O
F THE IN
DU
STRY R
EPOR
T 20
16
-17
Project Driver
Project
value
($ millions) Project description
Scheduled
start date
Scheduled
completion
date Status
Scottsdale – Bridport Pipeline Growth $5.5 Construction of a new pipeline between Scottsdale and Bridport. Pipeline will allow for decommissioning of existing poorly performing Bridport WTP and make use of surplus capacity at Scottsdale WTP.
2017-18 Sept 2022 Deferred
Avoca Treated Water Supply Compliance $5 Capital improvement works (WTP or pipeline from Fingal) to remove the Do Not Consume notice in place at Avoca.
2014-15 2016-17 Completed on time
Conglomerate Dam - upgrade Compliance $5 Works to decommission the dams, along with works to upgrade Conglomerate Dam to ensure the future of Queenstown’s water supply network.
2013-14 2017-18 On schedule
Gretna/Bushy Park/Glenora water supply upgrade
Compliance $5 Upgrade to the Gretna scheme and supply to Glenora and Bushy Park 2016-17 2017-18 Commenced
Mole Creek water supply Compliance $4 Construction of a WTP at the top end of the existing water system including associated pipe and network upgrades.
2015-16 2017-18 On schedule
Longford trunk main Growth $4 Duplication main from Longford WTP to the reservoir to ensure service standards are met.
2015-16 2017-18 On schedule
Winnaleah treated water supply Compliance $3.8 Construct a pipeline from the new Ringarooma WTP to Winnaleah providing treated water.
2016-17 2017-18 Commenced
Sewerage
Kingborough Sewerage Strategy - Treatment
Compliance $51 Rationalisation of existing STP’s at Margate, Electrona and Blackmans Bay. The existing plants are all high on the EPA priority list.
Construction of STP and pipelines commenced in 2016-17.
2013-14 2019-20 On schedule
Northern Midlands sewerage improvement plan
Compliance $43 Evandale and Western Junction STPs both perform poorly and could be rationalised into a single new STP at the Evandale STP site.
2017-18 2024-25 Commenced

TA
SMA
NIA
N W
ATER
AN
D SEW
ERA
GE STA
TE OF TH
E IND
USTR
Y REPO
RT 2
01
6-1
7
83
Project Driver
Project
value
($ millions) Project description
Scheduled
start date
Scheduled
completion
date Status
Wynyard STP – Major Plant Upgrade Compliance $17 Major upgrade at Wynyard STP to achieve compliance with AMT limits and rationalisation with Somerset STP.
Note: $5M to be funded during third pricing period.
2015-16 2020-21 Deferred
Kingborough Sewerage Strategy - Network
Compliance $14 Construction of pipelines to allow rationalisation of existing STP’s at Margate, Electrona and Blackmans Bay.
2013-14 2019-20 On schedule
Sewage pump station Electrical Switchboard Renewal
Renewal $12 A number of switchboards have been identified as exceeding their useful life and are failing. Project will replace a number of switchboards at SPS across the southern region.
Note: Approximately $3.5M funded in first PSP.
2015-16 2017-18 On schedule
Ti Tree Bend STP odour management Compliance 12 Digester upgrade works underway in 2016-17 2016-17 2017-18 On schedule
Ti Tree Bend Centrifuge – Biosolids Reduction
Compliance $8.4 Construction of a centrifuge and sludge drying facilities to improve sludge handling at the STP.
2014-15 2021-22 Commenced
Brighton STP Rationalisation Compliance $9 High priority plant on EPA list, flows exceed treatment capacity. 2014-15 June 2021 Deferred
Legana STP Upgrade Compliance $9 The existing plant is hydraulically overloaded due to continued growth in the system. High volumetric loading causes discharge into the Tamar River.
Note: $6M to be funded during fourth pricing period.
2014-15 TBC Deferred
Longford STP Process Improvements Compliance $7 Upgrade to treatment process to handle high trade waste content from Swift abattoirs and relocate/upgrade existing outfall location.
2017-18 Delayed
STP inlet works program Compliance $6.7 Installation of inlet works (screens and grit removal) at 11 priority STPs 2016-17 2016-17 Completed on time
Cambridge STP detention storage Compliance $4.5 Improvement of detention storage to reduce the risk of sewage spills 2017-18 2018-19 Deferred
Burnie STP upgrade Compliance $4 Construction of Balance Storage 2016-17 2017-18 On schedule
Huonville main road sewer pump station Replacement $4 Upgrade to the existing pump station 2016-17 2018-19 Extended

8
4
TASM
AN
IAN
WA
TER A
ND
SEWER
AG
E STATE O
F THE IN
DU
STRY R
EPOR
T 20
16
-17
Project Driver
Project
value
($ millions) Project description
Scheduled
start date
Scheduled
completion
date Status
Prince of Wales STP- Digester roof Replacement $3.5 Replacement of the digester roof and refurbishment of the primary digester 2016-17 2018-19 Extended
Smithton SPS Davis St Compliance $1.7 Urgent works to upgrade the pump station 2016-17 2017-18 Commenced
St Helens STP upgrades Compliance $1.7 Upgrades to the St Helens STP inlet works, pump station and rising main 2016-17 2018-19 On schedule
Cameron Bay STP digester roof upgrade Compliance $2 Refurbishment of digester roof, replacement of sludge mixing system and upgrade to all instrumentation and switchboards
2016-17 2016-17 Completed on time
Non-network
Asset Management Information System
(AMIS)
Improvement $13.3 Installation of commercial off the shelf, fit for purpose AMIS that integrates to all major corporate functions and interfaces.
Note: Partially funded from the third pricing period.
2015-16 2016-17 Completed on time
Minor Plant and Equipment Program Renewal $5.4 $1.2M annual ongoing renewal program for minor plant and equipment to maintain field services capability.
2015-16 2017-18 Ongoing
Statewide Miscellaneous Minor Works Program
Renewal $4.5 $1M annual ongoing renewal program for unplanned minor asset renewals. 2015-16 2017-18 Ongoing
Statewide Asset Safety Rectification Program
Improvement $4 $1M annual ongoing program to address safety risks identified throughout the business.
2015-16 2017-18 Ongoing
Northwest regional office relocation Non-network $3 The relocation of non-operational staff from the Forth Depot site, including a new shopfront at Devonport
2016-17 2016-17 Completed on time
Fleet (Vehicles and Plant) Replacement Program
Renewal $2 $2M annual ongoing renewal program for vehicles and fleet to maintain field services capability.
2016-17 Ongoing

TASMANIAN WATER AND SEWERAGE STATE OF THE INDUSTRY REPORT 2015-16 85
7.3.1 Future capital projects
The 2017-18 capital works program includes projects and programs with a total budget in excess of $135 million for the year.
Capital works projects due to commence in 2017-18, including forecast expenditure are set out in Table 7.8 below. Continuing projects from previous years are included in Table 7.7.
Table 7.8 Capital projects to be commenced in 2017-18
Project
Project value
($ millions) Project description
Scheduled
completion
Bronte Park water supply system $8.2 Treated Water Supply to Bronte Park 2017-18
Judbury water supply upgrade $5.3 Treated Water Supply to Judbury 2017-18
Epping Forest Water Supply $4.8 Treated Water Supply to Epping Forest 2017-18
Flagstaff Gully - Dam Safety Upgrade $5 Remove Dam from above the ANCOLD level of Tolerability
2018-19
Swansea Dam (Meredith) – Rectification and Improvement
$4.2 Upgrade of the Swansea Dam to ensure operation at the designed level.
2018-19
Upper Reservoir Outlet Conduit & Bypass Channel Repairs
$4.3 Remove Dam from above the ANCOLD level of Tolerability
2018-19
Westbury Dam $2 Remove Dam from above the ANCOLD level of Tolerability
2018-19
Pet Dam Safety Upgrade $7.7 Remove Dam from above the ANCOLD level of Tolerability
2019-20
Numerous other capital projects are planned to deliver treated drinking water to regional towns across Tasmania, all scheduled for completion in 2017-18.
Projects that are considered by industry regulators to be high priority for improving performance in the future are discussed further in Chapter 8. TasWater’s proposed Price and Service Plan for the upcoming third regulatory period (PSP3) outlines planned capital expenditure over the period 2018-19 to 2021-22.11
11 A copy of TasWater’s proposed plan is available at http://www.economicregulator.tas.gov.au/water/pricing/price-determination-investigations/2018-water-and-sewerage-price-determination-investigation#ProposedPriceandServicePlan


TASMANIAN WATER AND SEWERAGE STATE OF THE INDUSTRY REPORT 2016-17 87
8 PRIORITIES FOR IMPROVING
PERFORMANCE
The following sections examine the processes and considerations adopted by key industry regulators in identifying priorities for improving performance across the water and sewerage sector.
8.1 Environment Protection Authority
8.1.1 Strategic Initiatives for Wastewater Management
In December 2016, the EPA and TasWater signed a Memorandum of Understanding on Public Wastewater Management (MOU) to adopt key management and regulatory strategies aimed at achieving accelerated improvements in environmental compliance and performance. The purpose of the MOU is to achieve a 50 per cent uplift1 in state-wide effluent compliance by December 2019.
To achieve this end, the MOU establishes focus areas for wastewater management and regulatory effort to obtain the greatest environmental and performance benefits, including:
the ‘Big 13’ strategy – targeting improvements at those STPs that account for 70 per cent of all treated wastewater from TasWater’s network;
the ‘Top 20’ strategy – targeting improvements at those STPs that have been identified to pose the highest environmental risks in terms of pathogen, toxicant, nutrient and odour impacts, and
enhancing state-wide control of trade waste, tankered waste and leachate inputs into TasWater’s network.
The full text of the MOU is available on the EPA website under http://epa.tas.gov.au/epa/about-us/corporate-documents/mou.
Implementation of TasWater’s 2015-18 Wastewater Management Plan (WWMP), which outlines wastewater priorities and project funding over the second Price and Service Plan period, has been adjusted to align with the MOU priorities. During 2016-17, TasWater, in consultation with its regulatory authorities including the EPA, also invested significant effort into the development of its Long Term Strategic Plan.2
8.1.2 Environmental conditions updating
A priority project for the EPA is ensuring that all STPs are regulated under contemporary environmental conditions, particularly with regard to technical standards, monitoring
1 Values based on ’linked limits’ metric used by TasWater to calculate compliance, moving from 44 to 65 per cent.
2 TasWater’s Long Term Strategic Plan 2018 - 2037 is available at: https://www.taswater.com.au/About-Us/Long-Term-Strategic-Plan-2018---2037

88 TASMANIAN WATER AND SEWERAGE STATE OF THE INDUSTRY REPORT 2016-17
practices, reporting arrangements and plant management. Modern environmental conditions are generally imposed via Environment Protection Notices (EPNs).
New EPNs incorporate a suite of standardised conditions which are designed to be consistent with the principles outlined in relevant policy documents, including:
State Policy on Water Quality Management (1997);
Environmental guidelines for the reuse of recycled water in Tasmania (Department of Primary Industries, Water and Environment (DPIPWE), 2002);
Emission limit guidelines for sewage treatment plants that discharge pollutants into fresh and marine waters (DPIPWE, 2001); and
National water quality management strategy (a suite of documents relating to wastewater management).
8.1.3 Ambient monitoring
The EPA has identified the need for comprehensive ambient monitoring (the monitoring of impacts in the aquatic receiving environment) around sewage treatment plant outfalls as a priority for environmental regulation in the wastewater sector. Properly designed ambient monitoring programs can provide crucial information for the determination of site-relevant, cost-effective and sustainable solutions consistent with the State Policy on Water Quality Management 1997.
Ambient monitoring programs, prioritised according to environmental considerations, have been rolled out across the State for a number of years. The EPA expects TasWater to continue progressing these commitments. Corresponding requirements are incorporated into EPNs with timeframes determined for each STP according to priority.
Information collected through ambient monitoring is essential to strategic decision-making for managing and upgrading STPs. Ambient monitoring programs primarily aim to detect and quantify impacts of current STP discharge practices, identify mixing zones associated with outfalls and assist with the determination of required improvement measures. In addition, these programs are likely to enhance the general understanding of our waterways, especially when co-ordinated with existing water quality monitoring programs.
During 2016-17, TasWater submitted Ambient Monitoring Reports for a number of locations, while other ambient monitoring programs moved into the implementation and/or analysis phase.
Noteworthy milestones were:
The EPA accepted the North Esk River and Tamar Estuary Monitoring Report in November 2016. This report collated and analysed data collected to assess impacts of the five STPs servicing the urban Launceston catchment (Hoblers Bridge, Newnham, Norwood, Riverside and Ti-Tree Bend STPs) on the North Esk and upper Tamar Rivers. Its findings will feed into the determination of upgrade requirements for these STPs.
Longford STP - the EPA Board endorsed Water Quality Objectives for Back Creek Upstream of Longford WWTP. TasWater submitted a report to the EPA reviewing ambient monitoring results previously collected in Back Creek in relation to Longford STP to determine the likely impacts from the discharge following the proposed upgrade

TASMANIAN WATER AND SEWERAGE STATE OF THE INDUSTRY REPORT 2016-17 89
to bring Longford STP into compliance with current effluent quality limits. The report provided by TasWater indicates that Back Creek has inadequate flow to dilute the discharge in all seasons and so further investigations and discharge management options will need to be considered to ensure water quality objectives are not compromised.
The EPA approved the Derwent Estuary Sewage Treatment Plant Ambient Monitoring Report in May 2017. This report collated and analysed data collected for the Green Point, Cameron Bay, Prince of Wales Bay, East Risdon, Selfs Point, Macquarie Point and Rosny STP outfalls to determine impacts of these discharges and provide a basis for prioritisation of upgrade works at these STPs.
Ambient monitoring around the new outfall at Orford was completed in June 2017. The EPA expects submission of monitoring results and modelled outputs in 2017-18.
Ambient Monitoring Reports were submitted for the Railton, Ridgley, Queenstown and Zeehan STPs. A program of ambient monitoring of a further four STP outfalls (Pardoe, Ulverstone, Wynyard and Smithton) commenced in May 2017.
Additional ongoing or seasonal ambient monitoring which is not linked to a campaign-based program occurs in a number of other locations. Ongoing ambient monitoring programs pre-dating the AMP requirements which continued in 2016-17 include those undertaken at Blackmans Bay, Cradle Valley, Electrona, Longford and Margate STPs.
8.1.4 Biosolids management
Sustainable and cost-effective biosolids management, including regular intermittent desludging of lagoon sewage treatment systems to maintain treatment capacity, is an integral component of sewage treatment. Biosolids management incurs significant expenditure for treatment, testing and transport and forward planning is needed to make use of those times of the year when ground conditions and plant growth cycles allow land application of biosolids.
After finalising its state-wide biosolids management policy and strategy documents in 2015-16, TasWater submitted the first draft of its state-wide biosolids management plan to the EPA for review during 2016-17.
8.2 Public health
The Department of Health and Human Services (DHHS) works closely with TasWater to maintain and improve compliance with its legislative requirements.
During 2016-17 TasWater continued to address the priority capital works list agreed with DHHS as part of the previous water corporations’ respective interim operating licences. An ongoing role for DHHS is to incorporate emerging public health issues and associated risks (which have been identified with the improved monitoring of drinking water supplies) into TasWater’s decision-making processes when prioritising capital works. In this regard, DHHS issued a revised priority listing to TasWater in early 2014 and in March 2017, DHHS issued a further revised priority listing to TasWater for inclusion in the 2018-21 Price and Service Plan.
DHHS has mandated, through legislation, an independent auditing framework for the verification and validation of TasWater’s drinking water quality management plan. This was achieved through the release of the Tasmanian Drinking Water Quality Guidelines (2015) in

90 TASMANIAN WATER AND SEWERAGE STATE OF THE INDUSTRY REPORT 2016-17
November 2015. TasWater has a Drinking Water Quality Management Plan for all of its public drinking water supply systems. The plans outline the identified public health risks of each drinking water supply and TasWater’s corresponding systematic preventative measures to minimise and manage those risks. The plans also specify the monitoring regimes, including parameters and frequency determined by a risk assessment for each drinking water supply. TasWater’s management plan was audited in November and December 2017.
It is expected that the revised Tasmanian Code of Practice for the Fluoridation of Drinking Water Supplies will be finalised during 2017-18. However, in the interim, TasWater has agreed to implement the Code as best practice until a final version of the Code is approved and issued by the Fluoridation Committee.
DHHS has reiterated its commitment to working with TasWater to ensure that matters of public health are given due consideration in this process now that the water and sewerage sector’s activities are managed by a single water corporation.
8.3 Water allocations/licences and dam safety
The Department of Primary Industries, Parks, Water and Environment (DPIPWE) is responsible for the sustainable management and development of the State’s freshwater resources through the Water Management Act 1999.
Before water can be taken directly from a stream or stored in a dam for supply to urban water systems, an allocation licence must be obtained from DPIPWE. The Department, along with TasWater, is continuing a review of all current urban water allocations and licences which were initially transferred to the regional corporations and now TasWater. The review has focussed on ensuring that the extraction points of water allocations endorsed on licences are correctly designated in terms of the extraction location and the specific resource from which the water is taken, and that the quantum of the allocation reflects the historical entitlement. In the context of expected and emerging future urban water demand and supply scenarios, allocations may be varied to maximise the quality and reliability of allocated water and to better reflect actual, and expected future, demand.
DPIPWE is also responsible for assessing applications for dam works (including new and significant repairs or modifications) and for the regulation of dam safety to ensure the owners of existing dams meet their statutory safety responsibilities.
TasWater has decommissioned two high risk dams at Queenstown and rehabilitated each dam site, removing public safety risks. Further progress is being made with two other high risk dams: the Margaret Street Detention Basin has now been upgraded and works continue with the Conglomerate Dam on remedial works, scheduled for completion during the 2017-18 financial year. In addition to this, detailed design and investigation work is continuing for a number of other high risk dams (Mikany, Isandula, Ridgeway, Waratah, Grey Mountain No. 1 and Blackman River No. 2).
All applications to undertake dam works must include a range of information, including engineering designs, for review by departmental staff who advise the Minister or delegate.3 The Minister then decides whether or not to grant approval for an application and to issue the
3 As of 1 January 2016, the approval Committee (Assessment Committee for Dam Construction) requirements under the Water Management Act 1999 have been rescinded.

TASMANIAN WATER AND SEWERAGE STATE OF THE INDUSTRY REPORT 2016-17 91
terms and conditions of this approval. This is to ensure that all dam works are undertaken in a manner that ensures they avoid environmental harm and do not present a risk to the Tasmanian population (as required under the Water Management Act 1999 and the Water Management (Safety of Dams) Regulations 2015).4
DPIPWE is responsible for ensuring that owners of existing dams meet their safety responsibilities through mandatory ongoing surveillance and maintenance of dams and, where necessary, ensuring dams meet contemporary safety standards. TasWater have been required to undertake a portfolio risk assessment (PRA) of all dams to ensure the risk that these dams may present are mitigated to within modern tolerable risk standards as outlined in the various Australian National Committee on Large Dams Incorporated (ANCOLD) guidelines and other acceptable risk standards and legislation. DPIPWE’s role as dam safety regulator is to ensure that:
these risk mitigation plans are developed;
that they are to an acceptable standard as outlined by ANCOLD; and
that they are implemented to an agreed schedule as outlined in their respective PRAs.
The Delegate for Dam Safety Regulation monitors and reviews annual management plans for dams to ensure that the required maintenance and risk mitigation tasks are being carried out in accordance with assessed PRA priorities and the identified high risk dams are being managed to reduce their risk to a tolerable level.
8.4 Economic regulation
8.4.1 Performance monitoring and reporting
One of the Tasmanian Economic Regulator’s main roles is that of setting and monitoring customer service standards, as well as performance monitoring and reporting.
The Regulator relies on information provided to it to assess the performance of TasWater in meeting its regulatory obligations. However, recent audits of TasWater’s performance indicators have revealed some of the data reported is still at a basic level in terms of quality and reliability.
A recent independent audit revealed that at least 20 performance indicators relating to the 2016-17 financial year, most of which were service standards under the Customer Service Code, were not reliably captured by TasWater’s business systems and hence, were not of a suitable quality to be published or relied on. That is, TasWater’s performance against some of the minimum service standards and targets could not be assessed for 2016-17 and in some cases, these affected measures have been excluded from this report.
TasWater reported that the issues occurred due to changes in its asset management information system (AMIS), implemented in 2017 and has provided assurances to the Regulator that the matter has been investigated and will be rectified for 2017-18.
4 The Water Management (Dam Safety) Regulations 2011 were rescinded and replaced as of 1 January 2016.

92 TASMANIAN WATER AND SEWERAGE STATE OF THE INDUSTRY REPORT 2016-17
8.4.2 Water and sewerage services pricing
The 2018 Water and Sewerage Price Determination Investigation for the third regulatory period (1 July 2018 to 30 June 2021) is currently underway. TasWater’s proposed Price and Service Plan was submitted to the Economic Regulator on 30 June 2017.
The investigation has highlighted issues that will need to be addressed in the future including:
transitioning the remaining customers to target tariffs;
reviewing the sewerage service pricing methodology;
reviewing the customer service framework;
requiring TasWater to provide more detailed and regular reporting of the status of capex projects;
requiring TasWater to develop a longer term plan that accounts for regional planning strategies and rationalisation opportunities; and
incentivising TasWater to deliver projects as scheduled.
The Regulator expects to complete its investigation and release its Final Report and Price Determination in April 2018.

TASMANIAN WATER AND SEWERAGE STATE OF THE INDUSTRY REPORT 2016-17 93
APPENDIX 1 PERFORMANCE
INDICATORS
Performance indicators used in this report are subsets of those defined in the 2013-14 National Performance Framework: Urban performance reporting indicators and definitions handbook, July 2014, and the Tasmanian Water and Sewerage Industry Performance and Information Reporting Guideline, November 2016Key performance indicators are shown below.
Indicator NPR reference
WATER RESOURCES
Sources of water
Volume of water sourced from surface water (ML) W1
Volume of water sourced from groundwater (ML) W2
Volume of water sourced from desalination of marine water (ML) W3.1
Volume of water sourced from recycling (ML) W4
Volume of water received from bulk supplier (ML) W5
Volume of bulk recycled water purchased (ML) W6
Total sourced water (ML) W7
Uses of water supplied
Volume of water supplied - residential (ML) W8
Volume of water supplied - commercial, municipal and industrial (ML) W9
Volume of water supplied - other (ML) W10
Total urban water supplied (ML) W11
Average annual residential water supplied (kL per property) W12
Volume of water supplied - environmental (ML) W13
Volume of bulk water exports (ML) W14
Volume of bulk recycled water exports (ML) W15
Sewage collected
Volume of waste collected - residential sewage, non-residential sewage and non-trade waste (ML)
W16
Volume of waste collected -trade waste (ML) W17
Total sewage collected (ML) W18
Sewage collected per property (kL per property) W19
Uses of recycled water and stormwater
Volume of recycled water supplied - residential (ML) W20
Volume of recycled water supplied - commercial, municipal and industrial (ML) W21
Volume of recycled water supplied - agricultural (ML) W22

94 TASMANIAN WATER AND SEWERAGE STATE OF THE INDUSTRY REPORT 2016-17
Indicator NPR reference
Volume of recycled water supplied - environmental (ML) W23
Volume of recycled water supplied - on-site (ML) W24
Volume of recycled water supplied - other (ML) W25
Total recycled water supplied (ML) W26
Recycled water (percent of effluent recycled) W27
Volume of urban stormwater supplied to other infrastructure operators (ML) W28.1
Volume of urban stormwater used (ML) W28.4
Total volume of treated and untreated sewage discharges from a sewage discharge point W29
ASSET
Water treatment plants
Number of water treatment plants providing disinfection only
Number of water treatment plants providing further treatment
Number of water treatment plants providing full treatment A1
Other water assets
Number of water pumping stations
Length of water mains (km) A2
Properties served per km of water main (no. per km) A3
Number of water distribution storage facilities
Sewerage assets
Number of sewage treatment plants A4
Number of sewage pumping stations
Length of sewerage mains and channels (km) A5
Properties served per km of sewer main (no. per km) A6
Water main breaks
Water main breaks (no. per 100 km of water main) A8
Water losses
Infrastructure leakage index (ILI) A9
Real losses (L per service connection per day) A10
Real losses (kL per km of water main per day) A11
Sewerage breaks and chokes
Sewerage mains breaks and chokes (no. per 100 km sewer main) A14
Property connection sewer breaks and chokes (no. per 1 000 properties) A15
CUSTOMERS
Connected properties and population
Population receiving water supply services (000s) C1
Connected residential properties - water supply (000s) C2
Connected non-residential properties - water supply (000s) C3

TASMANIAN WATER AND SEWERAGE STATE OF THE INDUSTRY REPORT 2016-17 95
Indicator NPR reference
Total connected properties - water supply (000s) C4
Population receiving sewage services (000s) C5
Connected residential properties - sewerage (000s) C6
Connected non-residential properties - sewerage (000s) C7
Total connected properties - sewerage (000s) C8
Complaints, call wait time, service interruptions, customer restrictions and legal actions
Water quality complaints (no. per 1 000 properties) C9
Complaints meaningfully responded to within ten days (%)
Water service complaints (no. per 1 000 properties) C10
Sewerage service complaints (no. per 1 000 properties) C11
Billing and account complaints - water and sewerage (no. per 1 000 properties) C12
Total water and sewerage complaints (no. per 1 000 properties) C13
Percent of calls answered by an operator within 30 seconds (%) C14
Average duration of an unplanned interruption - water (minutes) C15
Average sewerage interruption (minutes) C16
Number of sewer spills
Time to attend sewer spills, breaks and chokes (minutes)
Incidence of unplanned interruptions - water (no. per 1 000 properties) C17
Customers to which restrictions applied for non-payment of water bill (no. per 1 000 properties) C18
Customers to which legal actions applied for non-payment of water bill (no. per 1 000 properties)
C19
ENVIRONMENT
Percent of sewage treated to a primary level (%) E1
Percent of sewage treated to a secondary level (%) E2
Percent of sewage treated to a tertiary or advanced level (%) E3
Percent of biosolids reused (%) E8
Greenhouse gas emissions - water (tonnes CO2-equivalents per 1 000 properties) E9
Greenhouse gas emissions - sewerage (tonnes CO2-equivalents per 1 000 properties) E10
Net greenhouse gas emissions - other (net tonnes CO2-equivalents per 1 000 properties) E11
Total net greenhouse gas emissions (net tonnes CO2-equivalents per 1 000 properties) E12
Sewer overflows reported to the environmental regulator (no. per 100 km of main) E13
FINANCE
Revenue
Total revenue - water ($000) F1
Total revenue - sewerage ($000) F2
Total income for whole of utility ($000) F3
Residential revenue from usage charges - water (%) F4
Revenue per property for water supply services ($ per property) F5

96 TASMANIAN WATER AND SEWERAGE STATE OF THE INDUSTRY REPORT 2016-17
Indicator NPR reference
Revenue per property for sewerage services ($ per property) F6
Income per property for whole of utility ($ per property) F7
Revenue from community service obligations (%) F8
Written down replacement costs of fixed assets
Nominal written down replacement cost of fixed water supply assets ($000) F9
Nominal written down replacement cost of fixed sewerage assets (000$) F10
Costs
Operating cost - water ($ per property) F11
Operating cost - sewerage ($ per property) F12
Combined operating cost - water and sewerage ($ per property) F13
Capital expenditure
Total water supply capital expenditure ($000) F14
Total sewerage capital expenditure ($000) F15
Total capital expenditure for water and sewerage ($000) F16
Water supply capital expenditure ($ per property) F28
Sewerage capital expenditure ($ per property) F29
Economic real rate of return
Economic real rate of return - water F17
Economic real rate of return - sewerage F18
Economic real rate of return - water and sewerage F19
Dividends
Dividend ($000) F20
Dividend payout ratio (%) F21
Net debt to equity, interest cover, net profit after tax and community service obligations
Net debt to equity (%) F22
Interest cover F23
Net profit after tax (NPAT) ($000) F24
NPAT ratio (%) F30
Community service obligations ($000) F25
Capital works grants
Capital works grants - water ($000) F26
Capital works grants - sewerage ($000) F27
HEALTH
Water quality guidelines H1
% of population where microbiological compliance was achieved H3
Number of zones where chemical compliance was achieved (eg 23 / 24) H4
Risk-based drinking water management plan externally assessed? (yes/no) H5

TASMANIAN WATER AND SEWERAGE STATE OF THE INDUSTRY REPORT 2016-17 97
Indicator NPR reference
PRICING
Water
Tariff structure - water (text) P1
Free water allowance (kL per property) - water P1.1
Fixed charge ($ per property) - water P1.2
Usage charge 1st step ($ per kL) P1.3
Special levies ($ per property) - water P1.12
Income from special levies retained by utility? (yes/no) - water P1.13
Annual bill based on 200kL per annum - water P2
Average annual residential water supplied (kL per property) P2.1
Typical residential bill - water P3
Sewerage
Tariff structure - sewerage (text) P4
Fixed charge ($ per property) - sewerage P4.1
Usage charge - sewerage ($ per kL) P4.2
Special levies ($ per property) - sewerage P4.3
Income from special levies retained by utility? (yes/no) - sewerage P4.4
Annual bill based on 200kL per annum - sewerage P5
Typical residential bill - sewerage P6
Water and sewerage
Annual bill based on 200kL per annum (water and sewerage) P7
Typical residential bill (water and sewerage) P8


TASMANIAN WATER AND SEWERAGE STATE OF THE INDUSTRY REPORT 2016-17 99
TASM
AN
IAN
WA
TER A
ND
SEWER
AG
E STATE O
F THE IN
DU
STRY R
EPOR
T 20
09
-10
A
-99
APPENDIX 2 SEWAGE MANAGEMENT
ISSUES
This Appendix presents the Environment Protection Authority’s (EPA) overview of some of the environmental management issues associated with Tasmania’s sewage treatment systems. These issues potentially affect system performance and may lead to impacts on Tasmania’s waterways and other receiving environments.
Capacity restrictions
Several STPs across Tasmania report average inflows that significantly exceed average dry weather flow limits imposed by the EPA (Appendix 4, Table 4.4). This may be indicative of issues with hydraulic flow capacity at the STP. Operating at or over the hydraulic capacity limit restricts the ability of the system to cope with existing loads. Where seasonally fluctuating loads or trade waste inputs are an additional concern, such capacity issues are further compounded. Operating outside hydraulic capacity limits may translate to poor compliance. In addition, insufficient hydraulic capacity may also restrict potential for further residential or industrial development in a sewerage catchment.
The reticulation network delivering sewage to the treatment plants may also suffer from capacity limitations. One common concern is inflow and infiltration ie the ingress of water (either stormwater or groundwater) into the sewerage system which increases the sewage volume transported to the STP for treatment. This may result in overflows of raw or diluted sewage from points in the reticulation system (eg manholes, dedicated emergency overflow pipes and pumping stations) or at the STP itself. Alternatively, sewage may only receive partial treatment during, for example, peak wet weather flow periods. Areas with old or poorly maintained reticulation systems are particularly affected, as are those which commonly experience prolonged wet weather periods. The depth of the reticulation infrastructure which affects whether it comes into contact with groundwater, is another factor.
The impacts of sewage overflows from failed or under-capacity reticulation are potentially serious in terms of public and environmental health. Contamination of oysters by sewage or overflows in the vicinity of popular swimming areas are two scenarios which can have significant public health consequences. The health of waterways can be affected by overflows of raw sewage through a reduction in the available oxygen level and smothering by solids. Toxic impacts of sewage constituents such as ammonia can result in fish kills in extreme cases. Gross solids from overflows may result in visual pollution.
Conflict with other land or water uses
A number of Tasmanian STPs discharge effluent to waters used for domestic and industrial water supplies, recreational purposes, aquaculture or agricultural irrigation. Conflict with other water users or uses can occur depending on the quality of the effluent discharged, the dilution received at the point of discharge and any exacerbating circumstances such as the presence of harmful substances or organisms. Generally, such situations are managed by TasWater notifying affected water users, having effluent discharge management procedures in place and developing improvement options for affected STPs. In some cases, the proximity of STPs has resulted in odour impacts on adjacent residential and recreational areas.

100 TASMANIAN WATER AND SEWERAGE STATE OF THE INDUSTRY REPORT 2016-17
A-100
TASM
AN
IAN
WA
TER A
ND
SEWER
AG
E STATE O
F THE IN
DU
STRY R
EPOR
T 20
08
-09
Analysis of the environmental sensitivity of the discharge locations of existing sewage treatment plants has been undertaken by the EPA and TasWater. This feeds into strategic documents underpinning decisions regarding upgrading and investment priorities related to sewage infrastructure, such as the Memorandum of Understanding on Public Wastewater Management and consecutive versions of TasWater’s Wastewater Management Plan.
Flow monitoring and control
The reliable and accurate measurement of sewage inflows and effluent discharge flows is critical for effective operation, maintenance and planning for continued improvement of sewerage systems. Significant investment into the roll-out of flow meters across the state has been made over past reporting periods which has resulted in considerable improvements in monitoring flows. Further progress is required to ensure that flow meters are regularly serviced and adequate data control processes are in place, to improve and maintain the ongoing accuracy of measurements.
Trade waste
Several sewage treatment systems in Tasmania receive major trade waste inputs from one or more trade waste generators. Often these generators, particularly in the food processing industry, contribute not only a significant hydraulic load but also a sizeable organic and nutrient load.
Important considerations related to trade waste in the sewerage system include:
trade waste inputs into the sewerage system can cause fluctuations in sewage quality and quantity which can be difficult to deal with at the STP;
odour issues reported in relation to some Tasmanian STPs are often associated with plants receiving major trade waste inputs; and
plants receiving high trade waste loads generate substantial volumes of sludge which need to be managed and regularly removed to maintain system efficiency. Some trade waste has the potential to impact on biosolids quality and reuse options.
Additionally, highly saline trade waste inputs into the reticulation system can make effluent unsuitable for reuse applications, such as irrigation.
Lagoon systems
In Tasmania, sewage lagoons or systems incorporating sewage lagoons are present at almost half of the Level 2 STPs. There is a slightly higher proportion of lagoon systems in the northern region. The southern region, due to a greater number of urban STPs, has a slightly lower proportion of lagoons, as does the north-west region.
Sewage lagoon systems represent a simple method of treating sewage, characterised by a low level of technical complexity and low power consumption. They are a popular treatment system in rural areas where the cost of land is not prohibitive and where the less frequent requirement for operator attendance is an advantage. Lagoons provide secondary level treatment, which can be sufficient where the receiving waterways provide sufficient dilution, or in combination with effluent reuse applications. In many cases, these lagoon systems are operated in conjunction with an effluent reuse scheme.

TASMANIAN WATER AND SEWERAGE STATE OF THE INDUSTRY REPORT 2016-17 101
TASM
AN
IAN
WA
TER A
ND
SEWER
AG
E STATE O
F THE IN
DU
STRY R
EPOR
T 20
09
-10
A
-101
Issues with Tasmanian sewage lagoons which at times have a negative impact on performance include:
periodic growth of algae, including blue-green algae, is a common occurrence in lagoons. Apart from presenting a potential toxin risk in the case of blue-green algae blooms, prevalence of algae may impact on oxygen transfer into the system and increase the turbidity of the effluent;
accumulation of sludge in sewage lagoons can significantly reduce treatment efficiency. In a number of lagoon systems, sludge has accumulated to such a degree that treatment capacity is significantly affected and desludging options need to be urgently progressed;
lagoon liners should be designed and maintained to prevent leaking of sewage into the underlying groundwater. Where liners were not installed to the required specification, or subsequently damaged, groundwater contamination is a potential issue requiring consideration; and
sewage lagoons can also be prone to flooding and sludge wash-out depending on location.
Blue-green algae (cyanobacteria) blooms
Blue-green algae (BGA) blooms are a relatively common occurrence in sewage lagoons. Unlike mechanical-biological STPs, sewage lagoons provide a calm, stable water environment high in nutrients which, coupled with suitable climatic conditions, provides a perfect environment for BGA populations to increase. Blooms typically occur in summer and autumn, particularly during periods of prolonged stable weather. Under favourable conditions, blooms can persist into the winter months and, as BGA can survive over winter in spore or vegetative forms, they may seasonally disappear but re-establish once suitable conditions return.
Experience with Tasmanian sewage lagoons has shown that BGA are often present at sufficient concentrations to pose a potential risk to stock and human health if toxins are produced and the affected water is released into streams or recycled for irrigation. This emphasises the need for caution in managing affected effluent. Not all species of BGA are toxic, or toxic all the time. The production of toxins is influenced by environmental conditions as well as species composition.
The management of BGA is complex and presents a challenge to wastewater managers. Various measures can be used in conjunction and should ideally be documented in a contingency management plan specific to each lagoon system.
The majority of Tasmanian sewage lagoons (approximately 40 Level 2 STPs have a lagoon component) have been affected by BGA blooms at some point.
The publication of the Guidelines for Managing Blue-Green Algae (Cyanobacteria) Blooms in Sewage Treatment Lagoons in March 2011 assists with the preparation of appropriate Contingency Management Plans. The guidelines are accessible via the EPA’s webpage at: http://epa.tas.gov.au/regulation/wastewater/resources-for-wastewater-managers/wastewater-treatment-lagoons/blue-green-algae-guidelines.

102 TASMANIAN WATER AND SEWERAGE STATE OF THE INDUSTRY REPORT 2016-17
A-102
TASM
AN
IAN
WA
TER A
ND
SEWER
AG
E STATE O
F THE IN
DU
STRY R
EPOR
T 20
08
-09
Reuse scheme management
A considerable degree of variability exists in relation to the management of effluent reuse schemes around the State. This is partially due to the differences in long-term supplier – user arrangements; the type of end use (eg golf course versus agricultural application); and type of user (eg corporate body or user cooperative versus single user). Historical differences in management approaches originally adopted by different councils for reuse schemes are another factor. This situation is gradually being addressed by TasWater, with progressive audits and reviews of schemes and comprehensive monitoring and reporting regimes being implemented across its effluent reuse schemes.
The EPA assesses and reviews effluent reuse schemes associated with Level 2 STPs but does not directly regulate these schemes. Environmental regulation of these schemes is largely the domain of local government. Environmental conditions for reuse schemes typically require adherence to an approved management plan and compliance with specified discharge limits.
Determining whether the rate of uptake of effluent recycling is sufficient requires closer examination of data for most Level 2 STPs. Whilst there may be valid technical or climatic reasons preventing or minimising reuse, the feasibility of effluent reuse needs to be more fully considered, consistent with the State Policy on Water Quality Management. Under the policy, effluent reuse needs to be pursued in order to minimise discharge to waters, unless there are valid reasons not to do so. A range of factors, including practical considerations, environmental outcomes and financial implications will be considered by TasWater to determine whether effluent reuse is viable.
Under the suite of contemporary environmental conditions which continues to be rolled out to all STPs, the preparation of an effluent reuse feasibility study is a standard requirement where it has not previously been investigated. This ensures that effluent recycling is considered as a sustainable alternative option to discharging treated effluent into waterways.
Biosolids
Sewage sludge is a by-product of the sewage treatment process. Sludge is separated from the liquid portion of sewage as part of the treatment process and may require further treatment to address stabilisation and contamination issues. Following further testing and provided all relevant guideline requirements are met, sewage sludge may be classified as biosolids and beneficially re-used, generally in agricultural applications. Issues previously identified by the EPA for sustainable management of sewage sludge include:
management of biosolids quality through implementation of measures such as installation of inlet screening and improved controls on sewage inputs including trade wastes;
thorough investigation of sustainable and cost-effective management options for existing biosolids stockpiles;
consideration of beneficial reuse in preference to disposal methods wherever feasible;
adequate reporting in relation to the volume of sewage sludge produced at a site and, where material is transported off site, information regarding its destination and end use; and
scheduling and implementation of regular intermittent desludging of sewage lagoons to maintain or enhance operational capacity.

TASMANIAN WATER AND SEWERAGE STATE OF THE INDUSTRY REPORT 2016-17 103
TASM
AN
IAN
WA
TER A
ND
SEWER
AG
E STATE O
F THE IN
DU
STRY R
EPOR
T 20
09
-10
A
-103
Significant progress has been made in improving biosolids management in Tasmania. Desludging of some lagoon systems identified as high priority has been progressed although timely, regular lagoon desludging continues to pose a challenge to TasWater.
The Tasmanian Biosolids Reuse Guidelines 1999 provide the current regulatory guidance in relation to biosolids management and are accessible via the EPA’s webpage at http://epa.tas.gov.au/regulation/wastewater/resources-for-wastewater-managers/biosolids
Since publication of the original guidelines in 1999, significant research into biosolids has been undertaken both nationally and internationally. As a result the guidelines are currently under review by the EPA.
The outcome of the review will be a contemporary guideline to ensure sustainable biosolids reuse in Tasmania and guide appropriate commitments to expenditure on biosolids management.
The EPA is a member of the Australian and New Zealand Biosolids Partnership (ANZBP), which is a collective of utilities, consultants, academics and government agencies with an interest in ensuring the sustainable reuse of biosolids. It is contributing to the research being undertaken by the ANZBP and is utilising ANZBP resources, references and tools in its review of the Biosolids Guidelines.


TASMANIAN WATER AND SEWERAGE STATE OF THE INDUSTRY REPORT 2016-17 105
TASM
AN
IAN
WA
TER A
ND
SEWER
AG
E STATE O
F THE IN
DU
STRY R
EPOR
T 20
09
-10
A
-105
APPENDIX 3 DAM SAFETY
Dam safety assessment terminology
Consequence category
This refers to the classification scale that details the consequences resulting from a catastrophic dam failure. There are seven consequence categories in a graded scale ranging from “Very Low” (the consequences of a dam failure are negligible) through to “Extreme” (the consequences of a dam failure are severe in terms of loss of life and infrastructure impacts). (Refer to Table A3.1)
Consequence of Dam Failure
The result of a dam failure in terms of loss of life and damage to infrastructure, services and the environment.
Dam
An artificial barrier together with any works that is constructed for the storage, control or diversion of water and other liquids, silt, debris of liquid borne debris.
Dam Safety Management Plans
TasWater is required to develop five year dam safety works programs. These works programs are required to be submitted to, and agreed to by, the Dam Safety Regulator. The overall objective of each five year program is that all dams which have a “Significant” or higher consequence category are within the Limit of Tolerability in terms of societal risk and reduced to As Low As Reasonably Practicable, as defined in the Australian National Committee on Large Dams (ANCOLD) guidelines. Dams that do not currently meet these criteria require a program of works to bring them within acceptable criteria.
Dam Safety Emergency Plans (DSEP)
A DSEP is prepared for use in a situation where there is a dam safety emergency; it is the Department of Primary Industries, Parks, Water and Environment’s (DPIPWE’s) policy that all dams where there is the potential for loss of life in the event of dam failure, require a DSEP. As a minimum a DSEP is required to include general information about the dam, emergency contact details, flood inundation maps, dam specifications, a plan of the dam and emergency procedure information.
Comprehensive Surveillance Inspections and Reports
TasWater is required to undertake a comprehensive surveillance inspection every five years for each of its dams that have a “Significant” or higher consequence category, and report, to the Dam Safety Regulator (DPIPWE) in its annual Dam Safety Management Plan, on the condition of each dam inspected, outlining any planned remedial works required to maintain or upgrade the inspected dam.

106 TASMANIAN WATER AND SEWERAGE STATE OF THE INDUSTRY REPORT 2016-17
A-106
TASM
AN
IAN
WA
TER A
ND
SEWER
AG
E STATE O
F THE IN
DU
STRY R
EPOR
T 20
08
-09
Table A3.1 TasWater’s Significant or higher consequence category dams in Tasmania, 2016-17
Dam name Consequence category
Flagstaff Gully Extreme
Knights Creek Extreme
Limekiln Gully Extreme
Tolosa Reservoir Extreme
Curries Dam High A
Lower Reservoir High A
Meredith Reservoir High A
Mooreville Road Reservoir High A
Ridgeway Reservoir High A
Upper Burnie Reservoir High A
Upper Reservoir High A
Lake Isandula High B
Lake Mikany High B
Risdon Brook High B
Conglomerate Dam High C
Duckhole Rivulet High C
Girdlestones Reservoir High C
Illabrook Dam High C
Lower Prosser High C
Margaret Street Detention Basin High C
Pet Dam High C
Westbury Dam High C
Williams Reservoir High C
Barwick Effluent Lagoons Significant
Bicheno Dam Significant
Blackmans #1 Significant
Blackmans #2 Significant
Coles Bay Significant
Fenton Significant
Grey Mountain No.1 Significant
Grey Mountain No.2 Significant
Guide Dam Significant
Midway Point Sludge Lagoon Significant
Sorell Sludge Lagoons Significant
Stiglitz Wastewater & Reuse Dams Significant
Waratah Dam Significant
Georges River Weir Significant

TASMANIAN WATER AND SEWERAGE STATE OF THE INDUSTRY REPORT 2016-17 107
APPENDIX 4 SEWAGE TREATMENT
PLANT (STP) PERFORMANCE
SUMMARY
Chapter 6 reports compliance results on a state-wide level. As it may also be important to understand how the performance of individual STPs contributes to corporation-wide performance, more detailed compliance information is provided in this Appendix.
Table A4.1 and Figures A4.1 to A4.2 show compliance with regulatory discharge limits and in comparison to AMT limits for effluent discharges to water for all Level 2 STPs assessed. Where STPs report compliance with AMT limits that exceeds compliance with regulatory limits, this generally means that the regulatory limits, which are site-specific, are more stringent than AMT limits.
Table A4.2 lists the compliance reported for each recycling scheme which utilises treated effluent generated by Level 2 STPs. Compliance is measured against ‘Class B’ quality expectations (as outlined in the Environmental Guidelines for the Use of Recycled Water in Tasmania, DPIWE 2002) for each of the 2012-13 to 2016-17 financial years.
Table A4.3 lists the proportion of effluent reused and reuse flow per year for each Level 2 STP with associated effluent reuse for each of the 2012-13 to 2016-17 financial years.
Table A4.4 provides the licensed average dry weather flow limit and the actual average annual inflow in 2016-17 for each Level 2 STP.

1
08
TA
SMA
NIA
N W
ATER
AN
D SEW
ERA
GE STA
TE OF TH
E IND
USTR
Y REPO
RT 2
01
6-1
7
Table A4.1 Summary of STP discharge to waters Regulatory Limits and AMT Limits compliance results, 2012-13 to 2016-17
2016-17 2015-16 2014-15 2013-14 2012-13
Premises name Reg
limits (%)
AMT
limits (%)
Reg
limits (%)
AMT
limits (%)
Reg
limits (%)
AMT
limits (%)
Reg
limits (%)
AMT
limits (%)
Reg
limits (%)
AMT
limits (%)
Beaconsfield 80.6 57.4 83.6 60.7 93.4 55.7 83.6 57.4 90.7 53.1
Beauty Point 94.7 66.0 88.5 48.2 93.1 64.4 91.7 63.0 91.7 62.0
Bicheno 87.5 76.9 89.6 68.5 89.6 68.9 68.8 57.4 83.4 59.1
Blackmans Bay 70.4 55.8 73.3 53.7 90.0 58.3 86.0 58.5 95.0 64.8
Boat Harbour 85.9 83.8 74.1 71.3 55.6 51.5 66.4 69.1 84.5 77.4
Bothwell (91.7) (76.9) (75.9) (69.4) (85.9) (74.5) 88.9 75.0 (91.4) (77.1)
Bridgewater 90.7 61.1 87.6 62.3 86.0 61.7 76.4 54.6 91.6 61.7
Bridport 49.1 49.1 45.4 45.4 50.8 50.8 54.5 54.5 47.7 47.7
Brighton (-)1 (-)1 (-)1 (-)1 (-)1 (-)1 (77.5) (33.3) 74.0 39.3
Cambridge 88.9 92.6 83.3 88.0 83.3 90.4 81.5 88.0 77.8 92.9
Cameron Bay 93.3 80.2 92.5 74.1 89.1 74.8 82.2 66.7 84.3 62.0
Campania 58.3 51.9 37.5 38.0 (39.6) (41.5) (35.4) (45.4) (42.0) (43.9)
Campbell Town (72.0) (44.4) (80.2) (50.0) (80.2) (56.9) 86.3 54.2 (89.6) (56.5)
Carrick 82.5 63.1 75.2 54.3 82.8 60.6 80.2 54.7 87.6 57.1
Cradle Mountain 99.6 99.8 98.8 99.2 98.7 99.0 94.7 96.5 99.3 99.8
Cressy 93.8 55.6 (83.3) (40.7) (91.6) (51.4) 91.6 47.7 84.4 40.7
Currie 96.7 57.1 90.1 66.0 90.3 72.4 97.6 72.3 87.4 59.8
Cygnet 89.6 83.3 100 85.9 97.9 77.6 100 85.2 91.5 73.0
Deloraine 71.7 71.7 57.4 54.6 66.0 66.0 66.0 52.4 73.5 63.7
Dover 97.2 89.8 96.3 88.9 96.3 88.0 89.8 82.4 85.3 66.4
East Strahan 83.0 65.0 91.4 70.2 90.5 69.1 90.1 72.5 95.1 83.2
Electrona 89.2 55.6 90.0 36.1 85.6 27.4 31.3 37.0 37.5 37.9
Evandale 33.3 72.2 29.4¹ 67.4 29.9¹

TA
SMA
NIA
N W
ATER
AN
D SEW
ERA
GE STA
TE OF TH
E IND
USTR
Y REPO
RT 2
01
6-1
7
10
9
2016-17 2015-16 2014-15 2013-14 2012-13
Premises name Reg
limits (%)
AMT
limits (%)
Reg
limits (%)
AMT
limits (%)
Reg
limits (%)
AMT
limits (%)
Reg
limits (%)
AMT
limits (%)
Reg
limits (%)
AMT
limits (%)
Evandale 76.8 33.3 (71.9) (33.3) 72.9 34.3 72.2 29.4 67.4 29.9
Exeter 90.6 42.6 80.2 32.4 87.1 36.6 93.6 51.2 95.7 41.5
Fingal 93.5 63.0 83.3 53.1 73.9 46.4 79.4 47.7 52.4 47.5
Geeveston 82.5 75.0 73.3 67.6 74.2 73.2 83.9 77.8 91.7 84.2
George Town 89.5 68.5 83.3 63.0 83.3 62.5 88.7 74.1 94.5 82.4
Hoblers Bridge 93.7 80.5 90.2 68.8 86.2 64.6 97.5 72.2 95.9 64.8
Kempton (27.1) (39.8) (39.6) (41.5) (33.3) (32.1) (45.8) (46.3) (31.3) (35.2)
Latrobe 64.6 47.2 81.3 48.2 80.4 54.7 73.9 58.5 71.7 51.0
Legana 83.0 40.9 75.9 34.3 84.0 34.9 85.1 45.5 81.4 36.1
Lilydale 91.7 84.3 89.4 85.2 92.0 67.0 90.8 70.4 90.7 57.0
Longford 70.2 56.6 64.6 46.3 54.4 35.0 44.1 28.6 57.3 32.4
Macquarie Point 94.0 54.2 88.3 54.6 78.9 50.9 87.8 50.5 93.0 42.9
Margate 81.7 53.7 79.5 48.2 73.3 52.8 70.3 49.1 79.2 50.5
Midway Point 91.7 75.0 95.8 72.2 97.9 69.8 100 78.3 100 73.7
New Norfolk 87.5 54.6 91.7 56.5 85.8 57.4 85.5 56.5 89.6 53.7
Newnham 82.8 52.6 71.7 50.0 85.9 58.5 84.8 56.5 95.8 61.1
Norwood 91.7 73.1 94.5 72.6 96.4 82.0 94.1 78.7 97.9 77.8
Oatlands (37.5) (45.4) (53.2) (50.5) 50.0 44.3 (39.6) (41.7) 29.2 39.1
Orford 84.9 62.3 88.0 63.9 86.8 59.4 93.5 66.7 93.5 68.5
Pardoe 89.7 23.7 84.4 19.6 58.7 14.3 70.0 15.7 82.6 19.2
Perth 64.6 29.6 (73.5) (35.5) 76.0 35.2 84.9 35.2 76.1 27.8
Port Sorell 39.6 32.4 27.1 25.9 35.4 28.9 52.1 36.3 39.6 15.5
Prince of Wales 87.9 59.7 79.2 52.8 83.0 55.1 89.6 62.0 87.5 59.4
Prospect Vale 82.0 71.2 85.9 67.7 89.9 71.7 82.4 69.5 88.0 66.7

1
10
TA
SMA
NIA
N W
ATER
AN
D SEW
ERA
GE STA
TE OF TH
E IND
USTR
Y REPO
RT 2
01
6-1
7
2016-17 2015-16 2014-15 2013-14 2012-13
Premises name Reg
limits (%)
AMT
limits (%)
Reg
limits (%)
AMT
limits (%)
Reg
limits (%)
AMT
limits (%)
Reg
limits (%)
AMT
limits (%)
Reg
limits (%)
AMT
limits (%)
Queenstown 96.4 75.0 91.5 68.2 70.2 72. 62 62.5 59.72 74.5 76.2
Railton -2 -2 (-) (-) (-) (-) 89.0 65.8 91.2 68.0
Ranelagh 97.5 100 93.3 95.4 95.0 100 86.0 93.6 47.4 47.4
Richmond (-)1 47.5 -1 44.4 -1 44.3 -1 42.6 -1 41.7
Ridgley 86.9 89.9 80.2 80.0 90.9 90.7 87.7 88.1 93.0 85.5
Risdon Vale 100 94.4 97.9 90.7 96.1 93.0 97.9 89.8 100 93.3
Riverside 93.5 52.8 93.5 52.8 97.0 58.4 100 63.9 91.7 57.4
Rokeby 93.6 93.6 (95.3) (95.3) 82.2 81.4 99.1 99.1 87.4 85.2
Rosebery 94.2 94.2 79.3 79.3 - - - - - -
Rosny 85.0 58.3 89.6 58.3 85.9 65. 88.3 67.6 100 68.8
Round Hill 81.1 81.3 95.4 95.4 90.6 90.6 85.6 85.6 93.5 93.5
Scamander -1 82.4 -1 64.3 (-)1 (64.7) (-)1 (69.4) (-)1 (69.6)
Scottsdale 97.9 60.2 96.8 57.0 94.3 64.3 91.7 65.7 95.5 70.7
Selfs Point 93.3 96.4 90.3 96.2 87.4 93.8 94.2 97.8 86.4 93.6
Sheffield 99.1 99.1 95.4 95.4 98.0 98.0 97.2 97.2 94.3 94.3
Sisters Beach 97.0 97.0 96.3 97.2 88.0 88.0 95.7 95.7 85.9 89.4
Smithton 85.0 42.7 89.7 46.0 88.2 56.8 57.6 36.62 43.7 35.1
Somerset 93.2 75.8 88.8 66.7 100.0 58.5 100 67.9 100 77.8
Sorell 89.6 61.1 91.7 68.5 89.6 78.7 97.9 78.8 91.7 66.3
St Helens 100 100 96.3 100 96.0 100 96.2 98.1 97.2 98.1
St Marys -2 -2 -2 -2 -2 -2 83.3 47.2 (77.0) (45.0)
Stanley 94.4 54.01 86.1 37.2 75.0 43.1 69.0 50.7 66.2 48.7
Stieglitz (-)1 (-)1 (-)1 (-)1 (-)1 (-)1 (100) (73.2) (100) (64.5)
Swansea 75.9 45.41 83.3 48.2 81.1 44.3 83.3 52.8 74.5 42.7
Ti-Tree Bend 95.8 83.3¹ 97.9 73.1¹

TA
SMA
NIA
N W
ATER
AN
D SEW
ERA
GE STA
TE OF TH
E IND
USTR
Y REPO
RT 2
01
6-1
7
11
1
2016-17 2015-16 2014-15 2013-14 2012-13
Premises name Reg
limits (%)
AMT
limits (%)
Reg
limits (%)
AMT
limits (%)
Reg
limits (%)
AMT
limits (%)
Reg
limits (%)
AMT
limits (%)
Reg
limits (%)
AMT
limits (%)
Ti-Tree Bend 95.1 84.7 94.3 81.8 96.5 89.6 95.8 83.3 97.9 73.1
Triabunna 87.0 63.0 75.0 51.9 73.6 52.8 79.6 50.9 78.2 54.5
Tullah 95.6 69.6 87.5 65.2 93.9 68.82 93.3 75.42 95.4 84.7
Turners Beach 80.9 60.0 68.5 42.6 74.0 43.3 78.4 55.7 71.2 42.3
Ulverstone 56.0 28.5 41.7 18.2 33.3 11.13 -2 -2 12.5 12.5
Westbury 75.1 75.1 51.9 51.9 72.8 72.8 58.5 58.5 89.7 89.7
Wynyard 88.0 69.0 92.4 75.9 79.7 63.6 84.8 46.5 100 71.8
Zeehan 80.9 78.2 81.6 82.6 68.2 75.32 71.9 76.82 76.1 81.6
AMT dataset completeness:
() Values in brackets: full reuse, no discharge to water 1 cannot be assessed (no relevant limits or no discharge to this location)
2 dataset incomplete

112 TASMANIAN WATER AND SEWERAGE STATE OF THE INDUSTRY REPORT 2016-17
Figure A4.1 STP compliance with regulatory discharge to waters limits, 2016-17 (per cent)
Note: full reuse STPs have been removed from this chart
0 10 20 30 40 50 60 70 80 90 100
RisdonSt Helens
Cradle MountainSheffield
ScottsdaleRanelagh
DoverSisters Beach
CurrieQueenstown
TullahTi-Tree BendBeauty Point
StanleyRosebery
Macquarie PointCressy
Hoblers BridgeRokeby
FingalRiverside
Cameron BaySelfs PointSomerset
LilydaleMidway Point
NorwoodBridgewater
ExeterPardoe
SorellCygnet
George TownElectrona
Cambridge / AirportWynyard
Prince of Wales BayNew Norfolk
BichenoTriabunna
RidgleyBoat Harbour
RosnySmithton
OrfordLegana
East StrahanNewnham
CarrickGeeveston
Prospect ValeMargate
Round HillTurners Beach
ZeehanBeaconsfield
EvandaleSwansea
WestburyDeloraine
Blackmans BayLongford
PerthLatrobe
CampaniaUlverstone
BridportPort Sorell
%

TASMANIAN WATER AND SEWERAGE STATE OF THE INDUSTRY REPORT 2016-17 113
Figure A4.2 STP compliance with AMT discharge to waters limits, 2016-17 (per cent)
Note: full reuse STPs have been removed from this chart.
0 10 20 30 40 50 60 70 80 90 100
RanelaghSt Helens
Cradle…Sheffield
Sisters BeachSelfs Point
Risdon ValeRosebery
RokebyCambridge /…
RidgleyDover
Ti-Tree BendLilydale
Boat HarbourCygnet
ScamanderRound Hill
Hoblers BridgeCameron Bay
ZeehanBicheno
SomersetWestbury
QueenstownGeeveston
Midway PointNorwoodDeloraine
Prospect ValeTullah
WynyardGeorge TownBeauty PointEast Strahan
CarrickFingal
TriabunnaOrfordSorell
BridgewaterScottsdale
Turners BeachPrince of…
RosnyBeaconsfield
CurrieLongford
Blackmans BayCressy
ElectronaNew Norfolk
Macquarie…Stanley
MargateRiverside
NewnhamCampania
BridportLatrobe
SwanseaSmithton
ExeterLegana
EvandalePort Sorell
PerthUlverstone
Pardoe
%

114 TASMANIAN WATER AND SEWERAGE STATE OF THE INDUSTRY REPORT 2016-17
Table A4.2 STP compliance with modified ‘Class B’ reuse limits1
STP 2016-17 2015-16 2014-15 2013-14 2012-13
Beaconsfield -* 93.3 * * 88.9
Beauty Point 94.8 86.7 92.1 93.3 91.7
Bicheno 93.3 96.7 94.8 83.3 93.3
Bothwell 93.3 85.0 93.1 90.0 94.6
Bridgewater 98.3 98.3 96.6 75.0 96.7
Bridport 83.3 80.0 87.9 100 91.7
Brighton 83.9 79.3 86.4 83.1
81.7
Cambridge/Airport 100 98.3 100 95.0 100
Cameron Bay 98.5 98.3 98.3 98.3 100
Campania 83.3 90.0 77.6 80.0 85.5
Campbell Town 70.0 80.0 87.1 90.0 95.0
Carrick 96.6 - 87.3 80.0 91.4
Cressy 91.7 85.0 91.5 90.0 81.7
Evandale 66.7 68.3 61.7 59.0 65.0
Exeter 71.7 78.3 87.3 94.1 96.6
Kempton 45.0 53.5 51.7 71.7 61.7
Latrobe 53.3 - 87.9 75.9 65.5
Legana 86.3 80.0 88.8 89.7 93.5
Lilydale 91.7 93.6 92.9 94.3 93.3
Macquarie Point 95.0 - 98.3 89.7 94.3
Oatlands 80.0 77.6 79.3 81.7 75.0
Orford 89.7 - 89.7 100 96.7
Penna 86.7 90.0 95.0 91.4 85.7
Perth 68.3 83.9 86.4 87.9 80.0
Railton 93.3 73.4 81.5 78.8 88.9
Richmond 74.5 80.0 87.9 76.7 80.0
Riverside 90.0 90.0 100 100 100
Rokeby 100 100 98.4 100 100
Rosny 82.7 100 98.4 100 100
Scamander 93.3 91.9 95.0 96.7 93.3
Selfs Point 99.6 - 99.7 100 100
St Marys 68.3 72.4 71.4 83.3 86.0
Stieglitz 95.0 95.0 88.7 98.2 96.7
Swansea 75.0 85.0 82.8 88.3 79.0
Triabunna 91.7 75.0 77.6 85.0 83.9
Westbury 93.4 70.2 - - -
* Insufficient number of samples provided
1 EPA assessment is against ‘Class B’ Recycled Water quality with an adjusted pH range of 5.5 – 8.5 and an additional upper limit of 10 000 cfu/100mL thermotolerant coliforms.

TA
SMA
NIA
N W
ATER
AN
D SEW
ERA
GE STA
TE OF TH
E IND
USTR
Y REPO
RT 2
01
4-1
5
A-115
TASM
AN
IAN
WA
TER A
ND
SEWER
AG
E STATE O
F THE IN
DU
STRY R
EPOR
T 20
16
-17
1
15
Table A4.3 Reuse proportion per STP (per cent proportion and ML/year) 2012-13 to 2016-17
2016-17 2015-16 2014-15 2013-14 2012-13
Premises name
Reuse proportion
Reuse flow
Reuse proportion
(%)
Reuse flow
Reuse proportion
(%)
Reuse flow
Reuse proportion
(%)
Reuse flow
Reuse proportion
(%)
Reuse flow
(%) ML/year ML/year ML/year ML/year ML/year
Beaconsfield 60.0 84 89.4 100.7 87.1 62.3 79.4 100.0 69.6 40.4
Beauty Point 38.9 81 74.6 120.1 67.5 107.7 62.0 124.9 73.4 85.7
Bicheno 58.4 66 36.5 46.0 88.3 88.5 51.9 63.7 43.3 45.8
Bothwell 100 48 100 38.6 100 42.4 76.9 33.2 100 41.1
Bridgewater 67.0 550 81.2 644.2 56.0 499.1 63.6 538.6 54.9 433.4
Bridport 9.7 10 12.9 9.0 15.9 13.0 8.5 7.6 0.5 0.5
Brighton 100 221 100 203.2 100 207.9 100 281.3 86.5 226.0
Cambridge 14.7 24 4.3 6.2 7.2 10.2 4.9 5.9 3.9 3.7
Cameron Bay 2.7 50 2.7 45.1 2.4 43.1 2.7 46.5 4.3 74.8
Campania 97.1 33 90.7 29.1 100 16.7 100 30.4 100 29.5
Campbell Town 100 119 100 71.7 100 69.3 98.4 73.7 100 62.7
Carrick - - - - 23.1 39.5 13.7 28.3 36.5 70.6
Cressy 32.4 23 100 56.9 100 60.7 80.0 59.2 97.8 49.8
Evandale 83.3 65 100 75.7 99.6 93.3 64.1 58.9 88.7 59.6
Exeter 36.4 24 41.0 26.4 53.0 29.0 44.2 31.9 58.2 13.2
Kempton 100 21 100 22.5 100 25.5 100 43.6 100 43.0
Legana 41.1 172 63.1 232.1 62.5 222.3 52.6 188.2 60.7 172.5
Lilydale 57.5 42 86.3 31.4 86.0 33.7 63.8 20.8 41.0 8.3
Macquarie Point - - - - - - 2.7 102.2 5.8 225.8
Midway Point 72.9 105 83.1 133.0 69.9 118.9 67.5 117.4 67.4 108.4
Oatlands 100 103 100 72.9 99.8 49.9 100 61.5 72.0 57.8
Penna 100 266 100 270.2 100 246.1 100 237.7 100 279.9
Perth 83.2 154 100 198.8 84.7 175.3 74.3 143.8 72.9 143.9
Railton 41.9 180 100 152.2 100 148.9 43.1 112.1 43.0 73.5
Richmond 100 60 100 63.3 91.2 60.4 87.6 63.1 82.4 55.0

A
-116 TA
SMA
NIA
N W
ATER
AN
D SEW
ERA
GE STA
TE OF TH
E IND
USTR
Y REPO
RT 2
01
4-1
5
11
6
TASM
AN
IAN
WA
TER A
ND
SEWER
AG
E STATE O
F THE IN
DU
STRY R
EPOR
T 20
16
-17
2016-17 2015-16 2014-15 2013-14 2012-13
Premises name
Reuse proportion
Reuse flow
Reuse proportion
(%)
Reuse flow
Reuse proportion
(%)
Reuse flow
Reuse proportion
(%)
Reuse flow
Reuse proportion
(%)
Reuse flow
(%) ML/year ML/year ML/year ML/year ML/year
Riverside 2.8 18 1.5 8.5 11.1 59.2 14.1 89.9 8.1 40.0
Rokeby 98.8 723 100 681.5 98.5 700 98.4 620.4 65.3 393.8
Rosny 55.0 1265 76.3 1672.8 56.3 1251.6 75.2 1684.6 52.2 1170.8
Scamander 91.8 45 85.1 45.7 100 43.8 100 50.9 100 17.1
Selfs Point - 0 - - 3.2 115.8 0.4 14.5 0.4 10.7
Sorell 71.7 165 81.7 165.6 76.8 157.6 65.7 134.9 68.7 169.3
St Marys 39.6 19 79.8 35.6 84.6 34.1 92.9 52.0 100 47.4
Stieglitz 100 102 100 65.7 100 65.0 100 81.5 100 19.0
Swansea 19.3 17 47.9 45.1 86.7 66.4 77.7 64.2 98.0 77.2
Taroona - - - - - - 3.7 4.5 4.9 6.3
Triabunna 90.8 69 93.8 60.3 99.8 60.0 98.3 62.8 65.8 56.6
Westbury 10.4 33 41.8 97.1 18.7 43.0 11.9 42.1 6.9 14.0

TASMANIAN WATER AND SEWERAGE STATE OF THE INDUSTRY REPORT 2015-16 117
Table A4.4 2016-17 Licensed flow limit and actual average annual inflow per STP (kL/day and per cent proportion)
Premises name Catchment area Licensed flow limit (kL/day)
2016-17 average annual inflow
(kL/day)
Actual inflow (per cent of
licensed limit)
Beaconsfield West Tamar 400 383 96
Beauty Point West Tamar 540 570 106
Bicheno Glamorgan/Spring Bay 450 308 68
Blackmans Bay Kingborough 4125 4129 100
Boat Harbour Waratah/Wynyard 170 37 22
Bothwell Central Highlands 155 131 85
Bridgewater Brighton 3500 2250 64
Bridport Dorset 1400 282 20
Brighton Brighton 650 606 93
Cambridge/Airport Clarence 800 446 56
Cameron Bay Glenorchy 6000 5080 85
Campania Southern Midlands 136 94 69
Campbell Town Northern Midlands 325 327 101
Carrick Meander Valley 624 758 121
Cradle Mountain Kentish 500 327 65
Cressy Northern Midlands 240 195 81
Currie King Island 290 332 114
Cygnet Huon Valley 400 349 87
Deloraine Meander Valley 850 1188 140
Dover Huon Valley 360 217 60
East Strahan West Coast 1056 546 52
Electrona Kingborough 450 428 95
Evandale Northern Midlands 375 214 57
Exeter West Tamar 150 183 122
Fingal Break O' Day 125 64 51
Geeveston Huon Valley 300 331 110
George Town George Town 3600 2201 61
Hoblers Bridge Launceston 4500 2719 60
Kempton Southern Midlands 135 57 42
Latrobe Latrobe 1000 1459 146
Legana West Tamar 540 1146 212
Lilydale Launceston 135 199 147
Longford Northern Midlands 2700 2257 84
Macquarie Point Hobart 18000 11002 61
Margate Kingborough 681 561 82
Midway Point Sorell 810 395 49
Turiff Lodge Derwent Valley 4100 1805 44
Newnham Drive Launceston 3920 3205 82
Norwood Launceston 4050 2863 71
Oatlands Southern Midlands 136 283 208
Orford Glamorgan/ Spring Bay 473 217 46

118 TASMANIAN WATER AND SEWERAGE STATE OF THE INDUSTRY REPORT 2015-16
Premises name Catchment area Licensed flow limit (kL/day)
2016-17 average annual inflow
(kL/day)
Actual inflow (per cent of
licensed limit)
Pardoe Devonport 14000 16226 116
Penna# Sorell 1400 728 52
Perth Northern Midlands 450 670 149
Port Sorell Latrobe 961 1071 111
Prince of Wales Glenorchy 9900 8316 84
Prospect Vale Meander Valley 1720 1661 97
Queenstown West Coast 1100 1148 104
Railton Kentish 600 660 110
Ranelagh Huon Valley 1200 1435 120
Richmond Clarence n/a 165
Ridgley Burnie 110 179 163
Risdon Clarence 1000 844 84
Riverside West Tamar 2800 1770 63
Rokeby Clarence 4000 2005 50
Rosebery West Coast 242 697 288
Rosny Clarence 7500 6307 84
Round Hill Burnie 9000 7294 81
Scamander Break O' Day 240 136 57
Scottsdale Dorset 3200 466 15
Selfs Point Hobart 13000 10290 79
Sheffield Kentish 350 717 205
Sisters Beach Waratah/Wynyard 585 96 16
Smithton Circular Head 5200 4268 82
Somerset Waratah/Wynyard 1200 1390 116
Sorell Sorell 810 630 78
St Helens Break O' Day 1500 610 41
St Marys Break O' Day 190 131 69
Stanley Circular Head 276 184 67
Stieglitz Break O' Day 110 281 255
Swansea Glamorgan/ Spring Bay 430 241 56
Ti-Tree Bend Launceston 25000 15904 64
Triabunna Glamorgan/ Spring Bay 253 189 75
Tullah West Coast 243 133 55
Turners Beach Central Coast 600 798 133
Ulverstone Central Coast 7500 10393 139
Westbury Meander Valley 600 871 145
Wynyard Waratah/Wynyard 2900 4752 164
Zeehan West Coast 214 303 142
Source: EPA Tasmania database
# The Penna STP acts as a “polishing plant” for treated effluent from the Midway Point and Sorell STPs, with effluent receiving further treatment prior to being made available for recycled water use

TASMANIAN WATER AND SEWERAGE STATE OF THE INDUSTRY REPORT 2016-17 119
TASM
AN
IAN
WA
TER A
ND
SEWER
AG
E STATE O
F THE IN
DU
STRY R
EPOR
T 20
09
-10
A
-119
APPENDIX 5 CUSTOMER SERVICE
STANDARDS
Table A5.1 Customer Service Code service standards, targets and performance
Indicator CSC minimum standard
2016-17
Water:
Unplanned water supply interruptions (per 100 km of water main) 68 NR
Average time taken to attend bursts and leaks:
priority 1 (minutes/% of time standard achieved) 60 / 90% 30 / 93%
priority 2 (minutes/% of time standard achieved) 180 / 90% 94 / 94%
priority 3 (minutes/% of time standard achieved) 4 320 / 90% 2 428 / 81%
Average frequency of unplanned water supply interruptions (number) 0.10 0.15#
Average frequency of planned water supply interruptions (number) 0.10 0.01
Average unplanned customer minutes off water supply (minutes) 25 NR
Average planned customer minutes off water supply (minutes) 15 NR
Average duration of water supply interruptions:
unplanned (minutes/% of time standard achieved) 180 / 80% NR
planned (minutes/% of time standard achieved) 180 / 80% NR
Unplanned water supply interruptions restored within five hours (per cent) 90% 86%#
Planned water supply interruptions restored within five hours (per cent) 85% 99%#
Number of customers receiving more than five unplanned water interruptions a year (number/% of time standard achieved)^
0 / 90% NR
Unaccounted for water (per cent) 12 23
Sewerage:
Sewer breaks and chokes (per 100 km of sewer main) 98% 45
Average time to attend sewer spills, breaks and chokes (minutes/% of time standard achieved) 60 / 90% 56 / 84%#
Average sewerage service interruption (minutes/% of time standard achieved) 180 / 80% NR
Sewerage spills contained within five hours (per cent) 99% 99%#
Customers receiving more than three sewerage service interruptions per year^ 0 NR
Customers:
Total water and sewerage complaints (per 1 000 properties) 9 12
Water and sewerage complaints to Ombudsman (per 1 000 properties) 0.50 0.35
Percentage of calls answered by an operator within 30 seconds 85% 89%
Results in bold and underlined indicate standard was not met ^ Indicator not measurable # Data of low reliability due to incomplete data NR Not reported. For 2016-17, TasWater and its independent auditor advised that some data was unreliable and was
therefore not included in this Report (problems were encountered when two databases were amalgamated). This matter was subsequently addressed and the data will be available for future years.
