water & sewerage - nehap malaysianehapmalaysia.moh.gov.my/wp-content/uploads/2016/...water &...
TRANSCRIPT

NATIONAL ENVIRONMENTAL HEALTH ACTION PLAN(NEHAP) CONFERENCE 2016
29TH SEPTEMBER, PICC PUTRAJAYA
WATER & SEWERAGE
National Water Services Commission(SPAN), Malaysia
0

SNAP SHOT OF INDUSTRY

POLICIES
ReserveMargin
20%
NRWReduction of25% in 2020
WaterDemand
Management
SewerageSystems for
more than 30units of house
(150PE)
GreenLifestyle –Promotion
andawareness New Sources
Water SavingDevices
Recycling Enforcement

Pahang98%
Perlis99.5%
Labuan100%
N.Sembilan99.9%
Kedah98.2%
Melaka100%
Johor99.8%
P.Pinang99.8%
Kelantan57.3%
Selangor99.8%
Terengganu95.8%
Perak99.6%
Sabah80%
Sarawak93.7%
State WaterOperator
Johor SAJHSWC
Melaka SAMB
N.Sembilan SAINS
Selangor SYABASPNSBSPLASHABASS
Perak LAPMUCAUSB
Pulau Pinang PBAPP
Kedah SADATaliworksAUI
Perlis JKR Perlis
Pahang PAIP
Terengganu SATU
Kelantan AKSB
Sabah JBA Sabah
Sarawak JKR SarawakLAKUSibuKuching
Labuan JBA Labuan
% Population Served
Sewerage sector is managed by IWK except for Kelantan (Majaari), JohorBahru and Pasir Gudang located in Johor (Local Authorities)
Quick Facts On The Water Services In Malaysia
3

Pahang
Perlis
Labuan
N.Sembilan
Kedah
Melaka Johor
Penang Kelantan
Selangor
Terengganu
Perak
Sabah
Sarawak
659 STP, 2.2 m PE8 Regional Plant, 0.21 m PE
505 STP, 0.76 m PE1 Regional Plant, 4.4 k PE
465 STP, 0.87 m PE10 Regional Plant, 0.46 m PE
377 STP, 0.36 m PE3 Regional Plant, 42.2 k PE
131 STP, 0.13 m PENo Regional Plant
1669 STP, 6.1 m PE27 Regional Plant, 1.4 juta PE
891 STP, 1.58 m PE1 Regional Plant, 15.3 k PE
536 STP, 0.92 m PE10 Regional Plant, 1.3 m PE
470 STP, 0.75 m PE4 Regional Plant, 49.5 k PE
8 STP, 47.5 k PENo Regional Plant
32 STP, 30.4 k PE1 Regional Plant, 16.7 k PE
23 STP, 23.2 k PE1 Regional Plant, 21.8 k PE
W.P. Kuala Lumpur204 STP, 0.77 m PE
12 Regional Plant, 2.5 m PE
W.P. Putrajaya1 STP, 66.5 k PE
1 Regional Plant, 30.2 k PE
Note: Operation & Maintenance by IWK except Kelantan (Majaari), Johor Bahru dan Pasir Gudang, Johor (Local Authority)
POPULATION EQUIVALENT (PE) COVERAGE
QUICK FACTS : SEWERAGE SERVICES

WATER SUPPLYSTATISTICS
Water Treatment Plants Design Capacity and Production2014 – 2015
State
2014 2015
No. ofWTPS
WTPsDesign
CapacityProduction Reserve
Margin No. ofWTPS
WTPsDesign
CapacityProduction
Reserve
Margin(MLD) (%) (MLD) %
Johor 44 1,986 1,568 21.1 44 1,986 1,619 18.5Kedah 36 1,300 1,299 0.1 36 1,308 1,315 0Kelantan 35 500 445 10.9 35 500 454 9.2Labuan 6 101 69 31.5 6 101 73 27.6Melaka 9 631 532 15.6 9 639 519 18.8N. Sembilan 23 931 744 20.1 23 994 752 24.4Pulau Pinang 9 1,497 995 r 33.5 r 9 1,479 1,014 31.4Pahang 81 1,447 1,108 23.4 76 1,414 1,129 20.1Perak 46 1,816 1,224 32.6 46 1,816 1,289 29.0Perlis 4 233 208 10.6 4 233 220 5.6Sabah 73 1,304 1,196 8.3 73 1,304 1,229 5.8Sarawak 93 1,532 1,188 22.4 93 1,609 1,268 21.1Selangor 34 4,606 4,594 0.3 34 4,606 4,675 0Terengganu 12 846 598 29.4 12 846 603 28.7MALAYSIA 505 18,730 15,768 15.8 500 18,835 16,159 14.2

Proportion of Domestic and Non-Domestic Connection 2014– 2015

Domestic Consumption Per Capita Per Day 2014 – 2015
StateConsumption Per Capita Per Day
l/cap/d2014 2015
Johor 220 211
Kedah 229 223
Kelantan 147 146
Labuan 170 168
Melaka 234 235
N. Sembilan 223 226
Pulau Pinang 293 291
Pahang 187 187
Perak 239 236
Perlis 258 249
Sabah 114 109
Sarawak 173 172
Selangor 231 234
Terengganu 216 214
MALAYSIA 211 209

Non-Revenue Water (NRW) 2014 – 2015
State
2014 2015
System InputVolume
BilledAuthorised
ConsumptionNRW
NRW (%)System Input
Volume
BilledAuthorised
ConsumptionNRW NRW
(%)
(MLD) (MLD)Johor 1,640 1,215 426 25.9 1,702 1,266 436 25.6Kedah 1,294 697 596 46.1 1,316 702 614 46.7Kelantan 445 225 220 49.4 454 231 222 49.0Labuan 69 48 20 29.5 71 49 22 30.9Melaka 478 376 102 21.4 481 388 93 19.3N. Sembilan 744 476 267 35.9 757 493 264 34.8Pulau Pinang 995 813 182 18.3 1,014 813 202 19.9Pahang 1,108 520 588 53.1 1,128 532 596 52.8Perak 1,237 858 379 30.6 1,260 878 382 30.3Perlis 216 95 121 55.8 220 96 124 56.3Sabah 1,196 577 618 51.7 1,229 552 677 55.1Sarawak 1,192 810 381 32.0 1,268 846 423 33.3Selangor 4,593 3,048 1,545 33.6 4,675 3,178 1,497 32.0Terengganu 605 417 188 31.0 621 428 192 31.0
MALAYSIA 15,809 10,176 5,633 35.6 16,195 10,452 5,743 35.5

Industry Landscape Before Reform
Mix of state water departments, corporatizedwater boards and privatized concessionairesMix of state water departments, corporatizedwater boards and privatized concessionaires
One Government-owned operatorOne Government-owned operator
Government loans & Commercial loansGovernment loans & Commercial loans
Lower than full cost recovery tariffCountry as a whole, there is operating surplusLower than full cost recovery tariffCountry as a whole, there is operating surplus
Water OperatorsWater Operators
Sewerage OperatorsSewerage Operators
CapitalExpenditure/Works
(CAPEX)
CapitalExpenditure/Works
(CAPEX)
TariffTariff
Pre-restructuring
9

NEW WATER INDUSTRY MODEL
10
StateGovernments
Watersources
Pengurusan AsetAir Berhad (PAAB)Asset Holding Co
OperatorsOperators
FederalGovernment thru
MOF Inc
FederalGovernment thru
MOF IncSPAN
•Owner of water assets•Source for competitivefunding
Lease arrangement
Lease payment
Operations andmaintenance of:•Water treatment•Distribution•sewerage
Licensed andregulated Licensed and
regulated100%owned

NRW Achievement (%) (2008 – 2014)
© 2015 SPAN
STATE 2008 2009 2010 2011 2012 2013 20141 Johor 31.3 31.9 29.9 29.2 27.8 26.4 25.92 Melaka 30.1 29.7 26 25.1 23.8 22.1 21.43 N. Sembilan 50.5 49.2 43.4 44.6 40.4 36.3 35.94 P. Pinang 16.9 19.1 18.2 18.4 17.6 18.2 18.35 Perak 31.4 30.7 29.4 30.4 30.1 30.4 30.66 Perlis 41.7 44.7 51.3 59.8 66.4 62.4 55.87 Kedah 45 44.9 44.9 47.8 50.6 50.9 46.18 Kelantan 49.4 48.3 52.4 55.6 53.9 53.1 49.49 Labuan 33.2 25.8 24.9 21.9 20.4 25.9 29.510 Pahang 52.9 59.9 55.3 56.2 54.2 52.7 53.111 Selangor 33.9 32.5 32.4 32.3 33.1 34.5 33.612 Terengganu 38 37.9 39.4 37 36.8 33.8 31.0
Average 36.2 36.6 35.4 36.1 35.9 36.6 35.6
11
Source : Malaysia Water Industry Guide 2015
50.5 49.2 43.4 44.6 40.4 36.3 35.9
2008 2009 2010 2011 2012 2013 2014
Negeri Sembilan
30.1 29.7 26 25.1 23.8 22.1 21.4
2008 2009 2010 2011 2012 2013 2014
Melaka
31.3 31.9 29.9 29.2 27.8 26.4 25.9
2008 2009 2010 2011 2012 2013 2014
Johor
Achievement of the Asset-light Operators
…..lower NRW for Asset-light states

12
Regulatedby SPAN
Public WaterSupply
OperatorsPrivate Water
Supply Operators
PrivateSewerageOperators
Water SupplyContractors
Plumbers
SewerageContractors
Producer/Supplier
PublicSewerageOperators
Water Services Industry
A technical and economic regulatory body for water servicesRegulates all entities in the water services and sewerage industry
Regulation By SPANRole of regulator
12
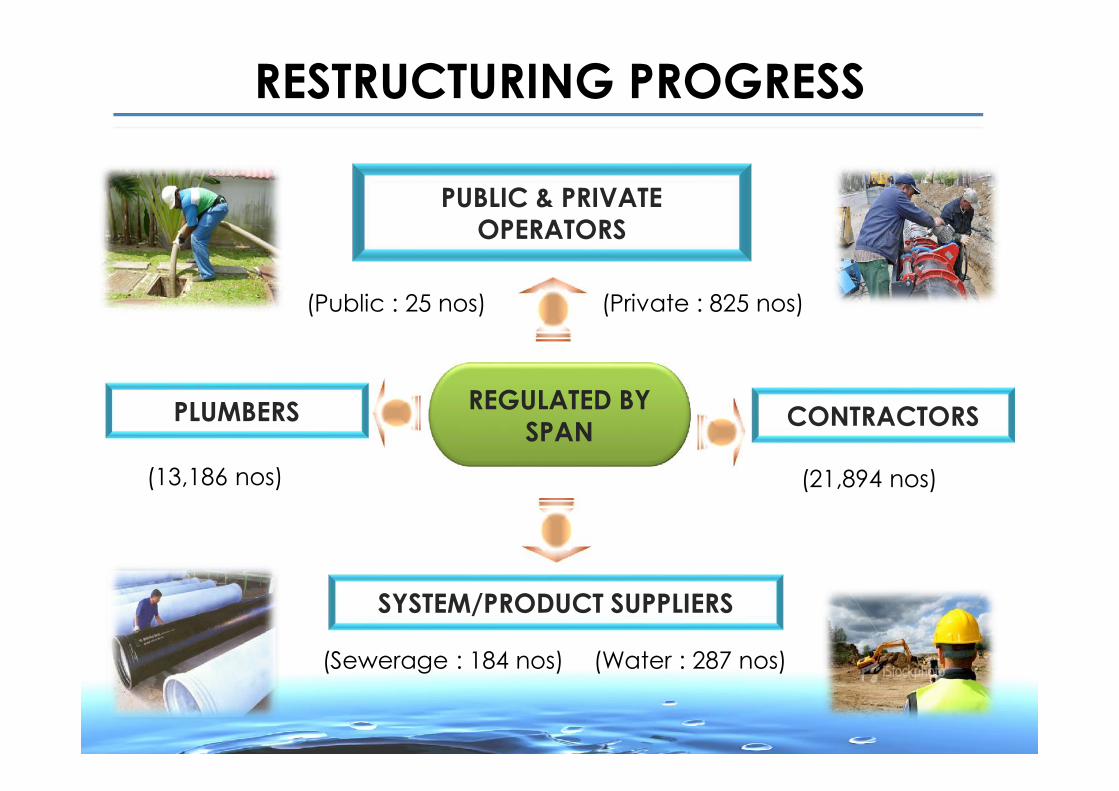
REGULATED BYSPAN
PUBLIC & PRIVATEOPERATORS
CONTRACTORS
SYSTEM/PRODUCT SUPPLIERS
PLUMBERS
(Public : 25 nos) (Private : 825 nos)
(21,894 nos)(13,186 nos)
(Sewerage : 184 nos) (Water : 287 nos)
RESTRUCTURING PROGRESS

Regulatory instruments/provisions to drive efficiency andeffectiveness.
Shaping Efficiency And Effectiveness
AddressingInefficiencies and
Ineffectiveness
AddressingInefficiencies and
Ineffectiveness
ComparativeRegulations /
Benchmarking
ComparativeRegulations /
Benchmarking KPIs/Standards
KPIs/Standards
Integration ofwater andsewerageservices
Integration ofwater andsewerageservices
Water ForumWater ForumRegulated
TariffRegulated
Tariff
LicensingLicensing
BusinessPlan
BusinessPlan
Furnishing ofInformation
Furnishing ofInformation
14

Full-cost Recovery Model
Oper
atin
gEx
pend
iture
Wat
er Ta
riff
Wat
er Ta
riff
Oper
atin
gex
pend
iture
Capi
tal
expe
nditu
re
Capi
tal
expe
nditu
reCurrent Future
Full-
cost
for O
pera
tors
15

Private Sector Driven Infrastructure Developement• Since 1970’s implementation of the 5 yearly national development
programs the private sector has been the prominent developer ofsewerage systems in Malaysia.
• Private sector maintained sewerage systems for 5 years beforehanded over to Local Authorities.
• CAPEX and OPEX of systems were inbuilt in the selling price ofproperties.
• The large scale central sewerage systems were only implementedby Government in selected big cities of >100,000 population
• Government has managed to delay the provision of large scalecentral sewerage system.
• In this respect that policy review as well strategies being introducedtowards realising efficient sewerage infrastructures at affordablecosts and meeting development goals.
16

17
COLLECTIONTREATMENT
RIVER
SEWERAGETREATMENT PLANT
Sewerage services are under the jurisdiction of Federal Government
A) Individual Septic Tank
B) Connected System
PREMISE OWNER
PREMISE OWNER
SEPTIC TANK
SEWERAGE SYSTEM

SEWERAGE STATISTICSSewerage Facilities 2014 – 2015
Sewerage Facilities
2014 2015
QuantityPopulationEquivalent
(PE)Quantity
PopulationEquivalent
(PE)Public Sewage Treatment Plant (a+b) 6,374 22,517,132 6,571 23,517,185
a. Multipoint Plant 6,288 15,724,638 6,481 16,296,052
b. Regional Plant 86 6,792,494 90 7,221,133
Private Sewage Treatment Plant 2,972 2,813,248 3,158 2,795,877
Communal Septic Tank 4,377 529,780 4,386 532,051
Individual Septic Tank 1,324,083 6,739,192 1,321,856 6,747,774
Traditional System 894,859 4,474,293 894,859 4,474,293
Network Pumping Station 1,027 n.a. 1,078 n.a.
Length of Sewer Network (km) 18,076 n.a. 18,689 n.a.

SEWERAGE STATISTICSSewerage Facilities by States - Public Sewage TreatmentPlant
Note:1. Public Sewerage treatment plant:a. Multi point STP: STPs to cater for sporadic and scattered development by different developersb. Regional plant: STPs identified in the Sewerage Catchment Study to cater for a sewerage catchment area
State
Multi Point STP1(a) Regional Plant1(b) TOTAL
2014 2015 2014 2015 2014 2015
NO. PE NO. PE NO. PE NO. PE NO. PE NO. PE
Johor 697 2,432,796 721 2,476,920 11 306,107 14 391,731 708 2,738,903 735 2,868,651
Kedah 524 852,482 550 888,921 4 58,549 4 62,875 528 911,031 554 951,796
Kelantan 8 47,500 8 47,500 0 0 0 0 8 47,500 8 47,500
Melaka 539 837,046 567 881,929 1 5,952 1 5,982 540 842,998 568 887,911
N. Sembilan 456 871,529 441 877,677 11 630,118 11 653,750 467 1,501,647 452 1,531,427
P. Pinang 561 1,038,196 568 1,071,217 10 1,341,912 10 1,476,326 571 2,380,108 578 2,547,543
Pahang 420 391,300 452 422,951 4 70,515 4 72,569 424 461,815 456 495,520
Perak 955 1,687,878 994 1,740,514 3 43,950 3 46,820 958 1,731,828 997 1,787,334
Perlis 37 38,459 41 41,412 1 16,728 1 17,171 38 55,187 42 58,583
Selangor 1,740 6,493,543 1,783 6,850,017 29 1,853,568 29 1,870,712 1,769 8,347,111 1,812 8,720,729
Terengganu 142 156,738 151 169,375 0 0 0 0 142 156,738 151 169,375
F.T. Kuala Lumpur 185 783,996 182 804,494 10 2,407,740 10 2,487,963 195 3,191,736 192 3,292,457
F.T. Labuan 23 23,125 23 23,125 1 24,651 1 24,707 24 47,776 24 47,832
F.T. Putrajaya 1 70,050 0 0 1 32,704 2 110,527 2 102,754 2 110,527
TOTAL 6,288 15,724,638 6,481 16,296,052 86 6,792,494 90 7,221,133 6,374 22,517,132 6,571 23,517,185

SEWERAGE STATISTICSSewerage Facilities by States - Septic Tank
STATECommunal Septic Tank Individual Septic Tank
2014 2015 2014 2015NO. PE NO. PE NO. PE NO. PE
Johor 528 46,290 528 46,290 268,850 1,330,340 268,722 1,329,700Kedah 410 43,782 410 43,782 157,365 786,825 157,130 785,650Kelantan 738 117,728 738 117,728 45,096 344,307 45,096 377,884Melaka 309 31,440 309 31,440 58,171 290,855 57,834 289,170N. Sembilan 440 38,350 452 41,705 77,343 386,715 76,138 380,690P. Pinang 83 15,646 83 16,011 13,389 66,945 8,579 42,895Pahang 175 13,840 177 14,600 138,292 691,460 137,569 687,845Perak 581 100,388 581 100,519 216,624 1,083,120 216,315 1,081,575Perlis 16 2,665 16 2,665 19,719 98,595 19,571 97,855Selangor 929 89,788 929 89,788 180,779 903,895 182,946 914,730Terengganu 145 15,963 145 15,963 89,500 461,360 92,213 461,065F.T. Kuala Lumpur 18 13,110 13 10,770 52,372 261,860 51,731 258,655F.T. Labuan 5 790 5 790 6,581 32,905 8,010 40,050F.T. Putrajaya 0 0 0 0 2 10 2 10
TOTAL 4,377 529,780 4,386 532,051 1,324,083 6,739,192 1,321,856 6,747,774
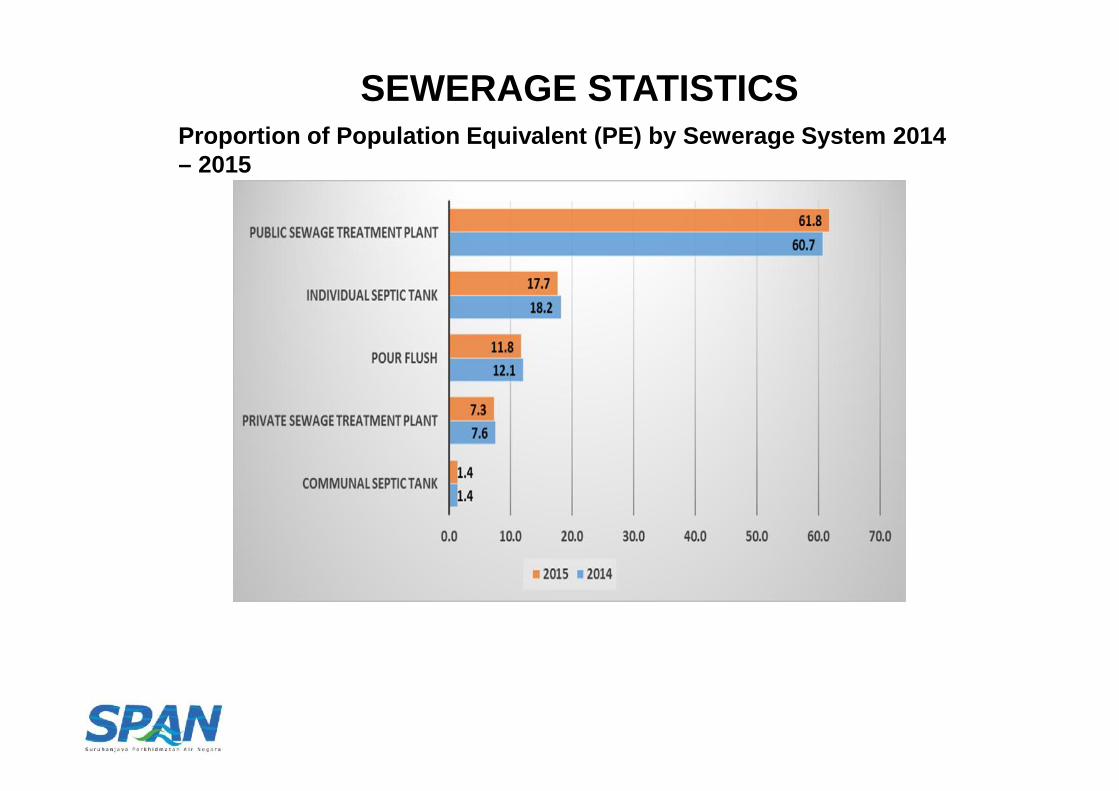
SEWERAGE STATISTICSProportion of Population Equivalent (PE) by Sewerage System 2014– 2015

SEWERAGE STATISTICSSewerage Facilities by States - Private Sewage TreatmentPlant
StatePrivate STP
2014 2015NO. PE NO. PE
Johor 244 604,096 234 405,546Kedah 244 175,076 260 184,838Kelantan 131 134,644 131 134,644Melaka 366 239,408 385 251,638N. Sembilan 181 150,925 192 154,800P. Pinang 107 91,260 136 115,055Pahang 452 510,546 469 521,975Perak 329 178,743 369 196,117Perlis 56 31,861 62 33,174Selangor 467 404,965 520 502,601Terengganu 242 164,332 242 164,332F.T. Kuala Lumpur 105 84,300 110 88,065F.T. Labuan 46 42,558 46 42,558F.T. Putrajaya 2 534 2 534
TOTAL 2,972 2,813,248 3,158 2,795,877

IMPROVEMENT – CAPITAL WORKSPROGRAMME Refurbishment and upgrading of existing public treatment
plants and sewers to ensure acceptable performance
Capital Works are integrated through the formulation ofSewerage Catchment Strategies
Program established to rationalise treatment plants forgreater efficiencies
REFURBISHMENT ANDUPGRADING OF NONPERFORMING TREATMENTPLANTS
Conversion of OP toMechanical Plants
Conversion of Biosoil to IDEAPlants

IMPROVEMENT -DESLUDGINGSERVICES Systematic program for septic tank desludging services put in place
O&M Performance : -Total Desludging Work in Year 1994 - 2006
0
20,000
40,000
60,000
80,000
100,000
120,000
140,000
160,000
180,000
Tota
l Des
ludg
e D
one
-30,000
20,000
70,000
120,000
170,000
220,000
Schedule,Demand& Repeat 25 5,236 18,997 14,681 20,899 105,462 82,396 94,223 114,436 140,844 155,932 160,887 151,191
Pour Flush 0 22 345 24 9,764 26,993 26,857 28,540 26,869 28,102 28,383 29,265 31,721
Responsiv e 0 1 8 10 1,149 3,841 4,771 4,867 4,470 3,903 3,811 3,370 3,609
Total Desludged 25 5,259 19,350 14,715 31,812 136,296 114,024 127,630 145,775 172,849 188,126 193,522 186,521
1994 * 1995* 1996* 1997* 1998* 1999 2000 2001 2002 2003 2004 2005 2006

IMPROVEMENT – NATIONALGUIDELINES
Nationwide standardisationof sewerage infrastructurerequirements
Developer Guidelinesensures new plants arebuilt to comply with DOEStd.
Systematic submission ofthe sewage treatmentplants design to ensurecompliance to Health &Safety and Operationalrequirements

Septage Management -Individual Septic Tank (IST)
Individual Septic Tanks(IST) Communal Septic Tanks(CST)
FiltrationSedimentation
FilterMedia

Number of Individual Septic Tanks(IST) and Communal Septic Tanks( CST)
0
100
200
300
400
500
600
700
800
900
1000
0
50,000
100,000
150,000
200,000
250,000
300,000
350,000
CST
IST
and
Pou
r Flu
shSISTEM PRIMITIF
IST
CST
POUR FLUSH
IST
CST
Number of systems (2014):• Total IST 1.2 million• Total CST 3,300
• Total Pour Flush 300,000•Total of 2000 new ISTs per year since2008
Number of systems (2014):• Total IST 1.2 million• Total CST 3,300
• Total Pour Flush 300,000•Total of 2000 new ISTs per year since2008

RULES ON DESLUDGING
• Responsibility of premise owner to desludge 1in every 3 years.
• IWK or permit holders under SPAN canprovide service.
• Cost is capped at max USD 106 / 2 cu. m andpayment is direct.
• Currently a promotional rate by IWK- payment by installment( USD 33/ six months)
28

Desludging Rules- Transitional Period
Desludge within 1year of the Rulescomes into effect.
Or as determinedby theCommission,whichever ealier.
Unless proventhat desludginghas taken place24 months beforethe effectivedate.
Desludge 36 monthsafter the lastdesludging date.

30
PRODUCTS
1.Reuse in non portable water system and non-food crop application.
2. Recreational water activities
Effluent Sludges/Bio solid
TREATMENT QUALITY

Sewerage Industry DevelopmentThe sewerage industry in Malaysia could meet the ultimate objectiveof overall protection of the environment by 2035, if plans and actionstowards this goal are undertaken immediately.

SANITATION SAFETY PLAN
MOH KETTHA &AGENCIES OPERATORS
• New to Malaysia
• Information sharing
• Objectives is SSP to be set
• The buy-ins from operators
• Policy to be confirmed
• Pilot case studies
Sanitation Safety Plan – The Need for Cooperationand Learning

THANK YOU
33