water quality in the tukituki catchment state, trends and ... · state of the water quality in the...
TRANSCRIPT

Water Quality in the Tukituki catchment
-
State, trends and contaminant loads
December 2008


Water Quality in the Tukituki catchment
-
State, trends and contaminant loads
December 2008
Report prepared for Hawke’s Bay Regional Council by
Dr Olivier Ausseil
Senior Water Quality Scientist
Aquanet Consulting Limited
Peer Review:
Graham Sevicke-Jones, Manager Environmental
Science, Hawke’s Bay regional Council
Dr Bob Wilcock, Principal Scientist- River Ecosystem, NIWA
Acknowledgments to:
Rob Waldron, Hydrology Data Analyst, Hawke’s Bay Regional Council
Brett Stansfield, Environmental Scientist – Water Quality


i
EXECUTIVE SUMMARY
Hawke’s Bay Regional Council (HBRC) monitors water quality and river flow at a number of points
across the Tukituki catchment and has produced a comprehensive report on the state and trends of water
quality across the region, based on data collected between 1998 and 2003 (Stansfield 2004).
The present report was commissioned by HBRC to obtain an up-to-date and independent analysis of the
state of the water quality in the Tukituki River catchment.
The aim of this study is to analyse the water quality and biomonitoring data collected by HBRC and
NIWA between 1977 and 2008. In particular, the study aims at investigating the following points:
- the state of the Tukituki River and its main tributaries;
- temporal trends, i.e. are the water quality or the ecological indicators getting better or
worse over time?;
- the annual contaminant loadings in the Tukituki River;
- the contribution of the different point source discharges and main tributaries to the
measured contaminant loads in the catchment.
Generally, the microbiological water quality is good across the catchment – better than national median
values for comparable systems- and improving over time. Water clarity is acceptable across the
catchment, also better than national medians.
The largest single issue in the Tukituki catchment appears to be nutrient enrichment and associated
periphyton growth, with a general degradation from upstream to downstream in the catchment.
Macroinvertebrate communities also follow a pattern of degradation going downstream in the catchment.
Nutrient concentration ratios indicate that the system is likely to be generally phosphorus limited,
although periods of co-limitation or N-limitation are likely to occur during low river flows.
The analysis has revealed concerns about two tributaries:
the upper Tukipo River (above SH50), which still has relatively good water quality, but not as
good as the other upper catchment sites, and where significant increases of DRP and SIN and
MCI decrease have been detected over the last 10 years;
the Mangatarata Stream, where most parameters except ammonia and SIN indicate the most
degraded water quality of all monitored sites.
Significant temporal trends indicating an increase of DRP concentration and a degradation of
macroinvertebrate communities over time have been found at a number of sites in the Tukituki mainstem
and in tributaries in the upper and middle catchment. Significant increasing trends of the SIN
concentration have also been found in two tributaries, the Tukipo and Mangaonuku Rivers. The state of
macroinvertebrate communities (measured as macroinvertebrate community index - MCI) appears to have
degraded over time at a number of tributaries and mainstem sites in the upper and middle catchment. The
causes for these temporal trends are unknown and should be investigated, including the possible influence
of global weather cycles.
Nutrient load analysis indicates that the upper catchment (above SH50) yields approximately 6 Tonnes of
DRP and 200 to 300 Tonnes of SIN per year. At Shagrock (the bottom point of the middle catchment), the
annual loads are estimated at 30 to 50 Tonnes of DRP and 1,600 to 3,300 Tonnes of SIN per year. The
nutrient loads remain constant or decrease in the lower catchment.
These figures indicate that the middle catchment, between SH50 and Shagrock, appears to receive the
largest sources of nutrients, particularly at low river flows.
In the current situation, the point-source discharges from the Waipawa and Waipukurau oxidation ponds
are the largest source of DRP, representing up to 70 % of the total DRP inputs to the upper and middle
ii
catchment. After the oxidation pond upgrades in 2014, non-point source pollution in the Waipawa and
Mangatarata catchments are expected to become the dominant inputs of DRP to the middle catchment.
SIN loads appear to not be associated with point source discharges, and is likely due to non-point source
pollution from intensive agriculture in the Ruataniwha Plains.
If a management objective is to reduce the frequency and duration of algal blooms in the Tukituki River,
managing DRP inputs to the system is an obvious priority target –this is consistent with the RRMP which
puts emphasis on DRP management. It should be noted however, that managing only one nutrient is
fraught with risk (Wilcock et al. 2007), particularly as some sites in the catchment appear to switch to
SIN-limited conditions during periods of low river flow. In other words, SIN inputs to the Tukituki
catchment waterways should also be managed.
In terms of achieving a reduction of the DRP loads to the Tukituki catchment, the discharges from the
oxidation ponds are the number one target -which has already been addressed through consent conditions.
The next largest contributors, the Waipawa and Mangatarata catchments should become the focus of
active investigation and management.
An important consideration to bear in mind is the fact that even a drastic reduction in nutrient
concentrations in the Tukituki River is unlikely to totally prevent algal proliferations. As demonstrated in
the upper catchment, even sites with low nutrient concentrations have exceeded the periphyton biomass
guideline at least once. These occasional exceedances are likely associated with the extended periods of
low flow occurring in some summers. The benefits of a nutrient concentration reduction are more likely
to be reduced algal growth rates and peak biomass, i.e. how fast and how often high algal biomass will
occur, and how large the algal biomass and cover will be.
Further monitoring and investigations are recommended to better identify, and possibly manage, the
sources of contaminants in the Tukituki catchment.
iii
CONTENTS
Table of Contents
1. Context .................................................................................................................................................. 1
1.1. Introduction ................................................................................................................................... 1
1.2. Aim and scope of the study ........................................................................................................... 1
2. Methods................................................................................................................................................. 1
2.1. Original dataset ............................................................................................................................. 1
2.2. Water quality data preparation ...................................................................................................... 2
2.2.1. Joined Monitoring sites ......................................................................................................... 2
2.2.2. Monthly series ....................................................................................................................... 3
2.3. Flow data ....................................................................................................................................... 3
2.4. Data analysis ................................................................................................................................. 6
2.5. Annual Contaminant loads ............................................................................................................ 6
2.5.1. Averaging approach .............................................................................................................. 6
2.5.2. Ratio approach: The Beale ratio estimator ............................................................................ 7
2.1. Tukituki at Red Bridge: comparison between NIWA and HBRC data......................................... 7
3. Water quality in the Tukituki catchment ............................................................................................... 9
3.1. The Tukituki Catchment ............................................................................................................... 9
3.1.1. Geology and topography ....................................................................................................... 9
3.1.2. Values ................................................................................................................................... 9
3.1.3. Landcover and landuse .......................................................................................................... 9
3.2. Water quality Standards and Guidelines ....................................................................................... 9
3.2.1. Water temperature ............................................................................................................... 10
3.2.2. Water pH ............................................................................................................................. 10
3.2.3. Dissolved oxygen (DO) ...................................................................................................... 10
3.2.1. Organic load ........................................................................................................................ 12
3.2.2. Water clarity and suspended solids ..................................................................................... 12
3.2.3. Ammonia ............................................................................................................................. 12
3.2.4. Bacteriological water quality .............................................................................................. 13
3.2.5. Periphyton biomass, DRP and SIN ..................................................................................... 14
3.2.6. Macroinvertebrate communities ......................................................................................... 14
3.3. Water Quality of the Tukituki River ........................................................................................... 16
3.3.1. Biological monitoring ......................................................................................................... 16

iv
3.3.2. Nutrients .............................................................................................................................. 16
3.3.3. Microbiological water quality ............................................................................................. 16
3.3.4. Water clarity and suspended solids ..................................................................................... 17
3.3.5. Other indicators ................................................................................................................... 17
3.4. Water quality in the Tukituki River Tributaries .......................................................................... 19
3.4.1. MCI ..................................................................................................................................... 19
3.4.2. Periphyton biomass ............................................................................................................. 19
3.4.3. Dissolved reactive phosphorus (DRP) ................................................................................ 20
3.4.1. Soluble inorganic Nitrogen (SIN) ....................................................................................... 22
3.4.1. Nutrient limitation ............................................................................................................... 22
3.4.2. Microbiological water quality ............................................................................................. 25
3.4.1. Water Clarity ....................................................................................................................... 26
3.4.2. Total Organic Carbon (TOC) and Dissolved oxygen.......................................................... 27
3.5. Comparison with national figures ............................................................................................... 28
3.6. Conclusions ................................................................................................................................. 29
4. Effects of point source discharges ...................................................................................................... 29
4.1. Waipukurau oxidation pond ........................................................................................................ 30
4.1.1. DRP ..................................................................................................................................... 30
4.1.2. Ammonia and SIN .............................................................................................................. 30
4.1.3. Micobiological water quality .............................................................................................. 31
4.1.4. Suspended solids ................................................................................................................. 31
4.2. Waipawa oxidation pond ............................................................................................................ 33
4.2.1. DRP ..................................................................................................................................... 33
4.2.2. Ammonia ............................................................................................................................. 33
4.2.3. Microbiological water quality ............................................................................................. 33
4.2.4. Suspended solids ................................................................................................................. 33
5. Temporal trends .................................................................................................................................. 35
6. Contaminant loads analysis ................................................................................................................. 37
6.1. Annual Loads .............................................................................................................................. 37
6.1.1. Dissolved reactive phosphorus (DRP) ................................................................................ 37
6.1.1. Soluble Inorganic Nitrogen (SIN) ....................................................................................... 38
6.2. Load contributions ...................................................................................................................... 40
6.2.1. Methodology ....................................................................................................................... 40
6.2.2. DRP ..................................................................................................................................... 40
6.2.3. SIN ...................................................................................................................................... 42

v
6.3. Catchment yields ......................................................................................................................... 44
6.3.1. DRP ..................................................................................................................................... 44
6.3.2. SIN ...................................................................................................................................... 44
7. Discussion and Conclusions................................................................................................................ 46
7.1. Water quality of the Tukituki River ............................................................................................ 46
7.1.1. Upper catchment (upstream of SH50)................................................................................. 46
7.1.2. Middle catchment (between SH50 and Shagrock) .............................................................. 46
7.1.3. Lower catchment ................................................................................................................. 47
7.1.4. Conclusions ......................................................................................................................... 47
7.2. Recommendations ....................................................................................................................... 48
7.2.1. Management implications ................................................................................................... 48
7.2.2. Further monitoring .............................................................................................................. 49
Figures
Figure 1: Mean macroinvertebrate community index (MCI) ± 95% confidence interval. Sites in the upper
catchment are in clear brown, sites in the middle and lower catchment are in dark brown. The solid red
line represents the recommended guideline for the upper catchment; the dotted orange line represents the
guideline for the middle and lower catchment. ........................................................................................... 19
Figure 2: Maximum (rectangles) and mean (columns) periphyton biomass (mg chlorophyll a/m2) ± 95%
confidence interval. The solid red line represents the recommended periphyton biomass guideline for the
protection of recreational and trout fishery values. ..................................................................................... 20
Figure 3: Mean DRP concentrations (mg/L) ± 95% confidence interval under different flow conditions: at
all river flows (All flow), below three times the median flow (<3*Med), below median flow (<Med) and
below the lower quartile flow (<LQ). The red line indicate the RRMP guideline (0.015 mg/L). .............. 21
Figure 4: Mean SIN concentrations (mg/l) ± 95% confidence interval under different flow conditions: at
all river flows (All flow), below three times the median flow (<3*Med), below median flow (<Med) and
below the lower quartile flow (<LQ). The dotted orange line the recommended guideline for the upper
catchment (0.167 mg/L) and the plain red line indicates the recommended guideline for the middle and
lower catchment (0.444mg/l). ..................................................................................................................... 21
Figure 5: SIN:DRP ratio at monitoring sites in the upper Tukituki catchment. Data for river flows below
3* median flow and when either or both SIN and DRP concentrations are below guideline level (0.015
mg/l for DRP and 0.167 mg/l for SIN. The vertical blue line indicates the Lower quartile flow. Points
above the top dashed horizontal red line are indicative of P- limited conditions. Points below the bottom
red dashed line are indicative of N-limited conditions. .............................................................................. 23
Figure 6: SIN:DRP ratio at monitoring sites in the middle and lower Tukituki catchment. Data for river
flows below 3* median flow and when either or both SIN and DRP concentrations are below guideline
level (0.015 mg/l for DRP and 0.167 mg/l for SIN. The vertical blue line indicates the Lower quartile
flow. Points above the top dashed horizontal red line are indicative of P- limited conditions. Points below
the bottom red dashed line are indicative of N-limited conditions. ............................................................ 24
vi
Figure 7: Median E.coli concentrations (/100mL) ± 95% confidence interval under different flow
conditions: at all river flows (All flow), below three times the median flow (<3*Med), below median flow
(<Med) and below the lower quartile flow (<LQ). The dotted orange line represents the recommended
guideline for the threshold between Green and Amber modes (260 E.coli/100 mL); the solid red line
represents the threshold between Amber and Red modes (260 E.coli/100 mL) as defined in the MfE
microbiological water quality guidelines (2002). ....................................................................................... 25
Figure 8: Mean water clarity (m) ± 95% confidence interval under different flow conditions: at all river
flows (All flow), below three times the median flow (<3*Med), below median flow (<Med) and below
the lower quartile flow (<LQ).The dotted yellow line represents the minimum clarity guideline for
recreational waters (1.6m). The red lines represent the recommended water clarity guidelines for the
protection of the trout fishery value: 3.5m (solid red line) and 5 m (dotted red line). ................................ 26
Figure 9: Mean total organic carbon (TOC) (mg/L) ± 95% confidence interval under different flow
conditions: at all river flows (All flow), below three times the median flow (<3*Med), below median flow
(<Med) and below the lower quartile flow (<LQ). ..................................................................................... 27
Figure 10: Average DRP concentrations (± 95% confidence interval) in the Waipawa and Tukituki Rivers
upstream and downstream of the Waipawa and Waipukurau oxidation pond discharges. *** indicates
statistically significant differences (p<0.001) using the Wilcoxon paired rank test. .................................. 32
Figure 11: Average Ammonia nitrogen concentrations (± 95% confidence interval) in the Waipawa and
Tukituki Rivers upstream and downstream of the Waipawa and Waipukurau oxidation pond discharges.
*** indicates statistically significant differences (p<0.001) using the Wilcoxon paired rank test. ............ 32
Figure 12: Median faecal coliforms concentration in the Waipawa and Tukituki Rivers upstream and
downstream of the Waipawa and Waipukurau oxidation pond discharges. Stars indicate statistically
significant differences (* for p<0.05 ; *** for p<0.001) on Wilcoxon paired rank test. ............................ 34
Figure 13: Mean suspended sediment (SS) concentrations (± 95% confidence interval) in the Waipawa
and Tukituki Rivers upstream and downstream of the Waipawa and Waipukurau oxidation pond
discharges. Stars indicate statistically significant differences (* for p<0.05 ; *** for p<0.001) on
Wilcoxon paired rank test. .......................................................................................................................... 34
Figure 14: Annual and summer (November-April inclusive) DRP loads (Tonnes) in the Tukituki
catchment, calculated with the “averaging” approach. Above SH50 refers to the sum of the loads
calculated at the SH50 monitoring sites (Tukituki, Waipawa, Makaretu and Tukipo Rivers). .................. 39
Figure 15: Annual and summer (November-April inclusive) SIN loads (Tonnes) in the Tukituki
catchment, calculated with the “averaging” approach. Above SH50 refers to the sum of the loads
calculated at the SH50 monitoring sites (Tukituki, Waipawa, Makaretu and Tukipo Rivers). .................. 39
Figure 16: DRP inputs (kg/day) to the Tukituki River catchment upstream of the Tukituki at Shagrock
monitoring station under three river flow conditions: median flow, lower quartile flow and 1-day Mean
Annual Low Flow (MALF). ....................................................................................................................... 41
Figure 17: DRP inputs (as percentage of total) to the Tukituki River catchment upstream of the Tukituki
at Shagrock monitoring station under three river flow conditions: median flow, lower quartile flow and 1-
day Mean Annual Low Flow (MALF). ....................................................................................................... 41
Figure 18: DRP inputs after the oxidation pond upgrade in 2014 (as percentage of total) to the Tukituki
River catchment upstream of the Tukituki at Shagrock monitoring station under three river flow
conditions: median flow, lower quartile flow and 1-day Mean Annual Low Flow (MALF). .................... 42
Figure 19: SIN inputs (kg/day) to the Tukituki River catchment upstream of the Tukituki at Shagrock
monitoring station under three river flow conditions: median flow, lower quartile flow and 1-day Mean
Annual Low Flow (MALF). ....................................................................................................................... 43

vii
Figure 20: SIN inputs (as percentage of total) to the Tukituki River catchment upstream of the Tukituki at
Shagrock monitoring station under three river flow conditions: median flow, lower quartile flow and 1-
day Mean Annual Low Flow (MALF). ....................................................................................................... 43
Figure 21: Estimated non-point source catchment yields for DRP (mg/ha/day) under different river flow
conditions. ................................................................................................................................................... 45
Figure 22: Estimated non-point source catchment yields for SIN (g/ha/day) under different river flow
conditions. ................................................................................................................................................... 45
Tables
Table 1: Flow statistics calculated from data collected at the different flow recorder sites in the Tukituki
catchment. ..................................................................................................................................................... 3
Table 2: Flow statistics calculated from synthetic flow records in the Tukituki catchment. ........................ 3
Table 3: Summary of the water quality and flow data used in this study on the Tukituki catchment. Phy-
Chem: Physico-chemical parameters (temperature, pH, conductivity and dissolved oxygen). Nutrients
comprise dissolved reactive phosphorus (DRP) and soluble inorganic nitrogen (SIN). Bacto:
bacteriological data (E.coli and faecal coliforms). Biom: Biomonitoring (macroinvertebrate and
periphyton data.............................................................................................................................................. 5
Table 4: Maximum total ammonia-nitrogen (NH4-N) concentration recommended by the 2000 ANZECC
guidelines for the protection of 95% of aquatic species. Calculations based on ANZECC Guidelines table
8.3.6, 95% protection level (0.035 mg/l un-ionised ammonia),. and 95th
percentile of water temperature
and pH data recorded at monitoring sites in the Tukituki catchment. ........................................................ 13
Table 5: Summary of recommended guidelines for the Tukituki catchment for physical, chemical and
biological parameters. ................................................................................................................................. 15
Table 6: Summary of biomonitoring results at five monitoring sites on the Tukituki River. Sites are
presented in the upstream to downstream order. ......................................................................................... 16
Table 7: Summary of dissolved Reactive phosphorus (DRP) and soluble inorganic nitrogen (SIN) at five
monitoring sites on the Tukituki River. Sites are presented in the upstream to downstream order. ........... 17
Table 8: Summary of water quality state at five monitoring sites on the Tukituki River. pH: two guideline
ranges have been used, corresponding to (a) tolerable and (b) optimal range for trout. Water clarity: two
guideline ranges have been used 3.5m (c) and 5m (d) corresponding to different levels of protection of the
trout fishery values. ID: Insufficient data. .................................................................................................. 18
Table 9: Comparison of water quality statistics for the Tukituki catchment sites with national figures
(1997-2002). The upper Tukituki catchment sites are compared with upland pastoral category and the
middle and lower Tukituki catchments are compared with lowland pastoral category in (NIWA 2008).
Green shading indicates better water quality than the national median, red shading indicate worse water
quality than the national median. ................................................................................................................ 28
Table 10: Summary of macroinvertebrate community index score a different monitoring sites in the
Tukituki catchment. .................................................................................................................................... 35
Table 11: Summary of temporal trends at different monitoring sites in the Tukituki catchment. Seasonal
Kendall Test, Flow adjusted data, covariate adjustment method is LOWESS. NS: Not significant; N.D.;
no data. ........................................................................................................................................................ 36
Table 13: Annual average daily flow t Tukituki at Shagrock for the 2004-2008 period. ........................... 37
viii
Table 14: Annual and summer (November to April inclusive) DRP load in tonnes per year (T/Y). (a)
provisional estimate based on 9 months of data. (b) estimate based on 6 months (January-June) data. N.D.
:no data; I.D.: Insufficient data. .................................................................................................................. 23
Table 15: Annual and summer (November to April inclusive) SIN load in tonnes per year (T/Y). (a)
provisional estimate based on 9 months of data. (b) estimate based on 6 months (January-June) data. N.D.
:no data; I.D.: Insufficient data. .................................................................................................................. 24

Water Quality in the Tukituki Catchment
State, trends and contaminant loads
1
1. Context
1.1. Introduction
Hawke’s Bay Regional Council (HBRC) monitors water quality and river flow at a number of points
across the Tukituki catchment and has produced a comprehensive report on the state and trends of water
quality across the region, based on data collected between 1998 and 2003 (Stansfield 2004).
The present report was commissioned by HBRC to obtain an up-to-date and independent analysis of the
state of the water quality in the Tukituki River catchment.
1.2. Aim and scope of the study
The aim of this study is to analyse the water quality and biomonitoring data collected by Hawke’s Bay
Regional Council in the Tukituki catchment until March 2008. In particular, the study aims at
investigating the following points:
- the state of the Tukituki River and its main tributaries;
- temporal trends, i.e. are the water quality or the ecological indicators getting better or
worse over time?;
- the annual contaminant loadings in the Tukituki River;
- the contribution of the different point source discharges and main tributaries to the
measured contaminant loads in the catchment.
This report also makes recommendation for future water quality monitoring and management in the
Tukituki catchment.
2. Methods
2.1. Original dataset
A complete extract of HBRC’s water quality database for the Tukituki catchment was obtained from
HBRC’s Water Quality and Ecology teams. Since 1977, water quality has been monitored at 60 sites
across the Tukituki catchment. The dataset available at each site greatly varied: some sites had extensive
datasets spanning more than 30 years; other sites had only a few samples.
As part of its State of the Environment (SOE) and contact recreation monitoring programmes, HBRC
regularly monitors water quality at 11 sites across the Tukituki catchment. Because of the amount of data,
and the regularity of the sampling regime, these sites were used as the core dataset for the water quality
state and trends analysis presented in this report. Average daily flow at each site for each day of sampling
was obtained, either by direct measurement or by correlation with a flow recorder site (Table 1, Table 2).
A further two sites, located at the bottom of the Tukipo (Tukipo at Ashcott Rd) and Waipawa (Waipawa
at RDS) catchments are not part of the current monitoring programme, but have a significant amount of
usable historical data. These sites were used in the contaminant load analysis presented in section 6 of this
report.
In addition to the sites described above, NIWA has monitored water quality and river flow at two sites in
the Tukituki catchment since 1989, the Tukituki River at Red Bridge, and the Makaroro River at Burnt
Bridge. The Makaroro River site is considered a reference (i.e. un-impacted) site, and the data collected at
this site is used in this report. For Tukituki at red Bridge, the NIWA data was used to assess consistency
with HBRC data (refer to section 2.1), then HBRC data was used in this report.
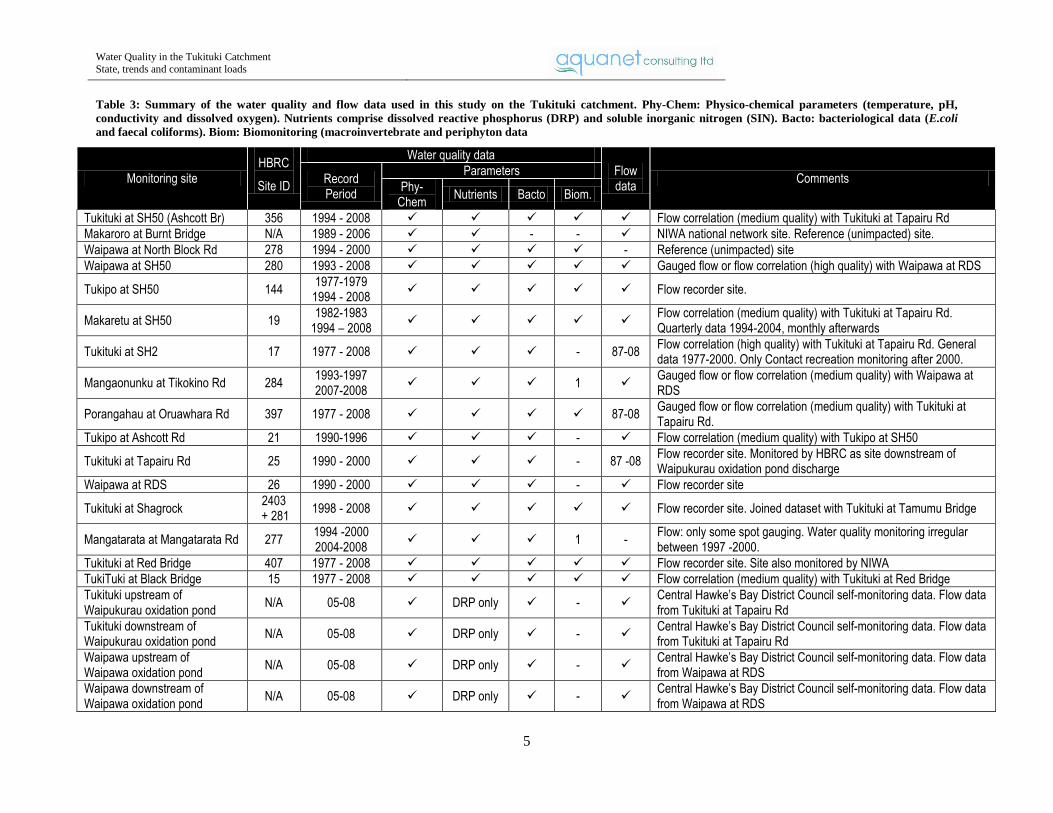
Table 3 provides a summary of the data used in this study.
Water Quality in the Tukituki Catchment
State, trends and contaminant loads
2
2.2. Water quality data preparation
The dataset contained a small proportion of “less than detection limit” results. To conduct statistical
analysis, such “censored” data should be replaced by numerical values. The “less than” values represented
less than 10% of the total dataset for each parameter and were replaced by half of the detection limit,
which is consistent with the recommendations of Scarsbrook and McBride (2007).
On few occasions, two samples were taken at the same site, on the same day, with different results
obtained. The sample with results closest to the median for the site was kept, and the other one not used
for further analysis. If the two samples were equally distributed around the median, the mean of the two
samples’ results was calculated and used in the analysis.
Dissolved Oxygen (DO) Saturation calculated from DO concentration and Temperature data.
Atmospheric pressure and elevation not being part of the dataset, it was considered that all samples were
taken at sea level and normal atmospheric pressure (1013 mBa)
The dataset contains two indicators of bacteriological water quality: faecal coliforms (FC) and
Escherichia coli (E. coli). Generally speaking, FC has been used in the SOE monitoring programme since
1990, and to test compliance with the provisions of the RRMP. E.coli was generally used from 1998 in
the contact recreation monitoring programme, to test compliance with the Ministry for the Environment
microbiological water quality guidelines (MfE, 2002). Typically, E.coli comprise 85-90 % of faecal
coliforms in natural waters over several orders of magnitude (Wilcock, 2008), and good, site-specific
correlations can be obtained between the two parameters. At each given monitoring site, there generally
are a significant number of samples which have been tested for both indicators. These were used to
calculate site-specific correlations between the two indicators. To obtain a more consistent dataset,
covering a longer period of time, a synthetic E.coli data series (correltd E.coli) was created for each
monitoring site. This dataset was used in particular in the time trends analysis.
2.2.1. Joined Monitoring sites
Two sites have been monitored on the Mangaonuku Stream (Mangaonuku at Tikokino Rd and
Mangaonuku at Argyll Rd). The two sites are only a few kilometres apart. The Argyll Rd site dataset
covers the 1994-2006 period, and the Tikokino Rd site covers 1994-1996 and 2007-2008. Joining the two
sites to obtain a longer dataset allowing a more powerful temporal trend analysis was considered as an
option. Samples were collected at the same dates at both sites during the 1994-1996 period. These
samples were used to test differences between the two sites. A series of Wilcoxon paired rank test
indicated significant differences between the two sites for DRP (p<0.05) and TP (p<0.001)1, thus the two
datasets could not be joined. The downstream-most site (Tikokino Rd) was considered to provide the
better information about the Mangaonuku catchment as a whole, and was used in the analysis presented in
this report.
Regular monitoring was undertaken at two close-by sites on the Tukituki River as part of HBRC’s state of
the environment monitoring programme. Between 1993 and 1998, water quality was monitored at
Tamumu Bridge. In 1998, the monitoring site was shifted to the Shagrock flow recorder, located only a
couple of kilometres downstream. To my knowledge, there are no major tributaries or point source
discharges, or major land use change between the two sites, i.e. there is no reason to believe the water
quality would be different between the two sites. For the purpose of the analysis presented in this report,
the datasets from the two sites have been joined under a unique site, “Tukituki at Shagrock”.
1 The Argyll Rd site had higher median DRP (0.003 vs. 0.002 g/m
3) and TP (0.022 vs. 0.016 mg/m
3) concentrations.
Water Quality in the Tukituki Catchment
State, trends and contaminant loads
3
2.2.2. Monthly series
The results used in this study were obtained as part of a number of monitoring programmes conducted by
Hawke’s Bay Regional Council, such as state of the environment (SOE), contact recreation, compliance
or incidents monitoring programmes. As a result, the monitoring frequency differs from site to site, with
time, and depending on the parameter. For example, SOE monitoring is done monthly, but has been
quarterly for a period (1999 – 2004) in the past, and contact recreation monitoring for bacteriological
water quality is done weekly, but only during summer. To conduct temporal trends analysis, regular time
series (e.g. one monthly sample) are required, and a number of adjustments were made to prepare the
dataset for this analysis:
- when several results were available for a parameter in one given month, the result taken on the
day the river flow was closest to the average flow for that month was used in the analysis;
- on rare occasions, some sites had two samples in 1 month, but none the preceding or following
month. When considered appropriate (e.g. when one sample was taken very close to the
beginning or end of the month), and for the temporal trends analysis only, one of the samples was
considered taken a few days earlier or later (i.e. in a different month), to obtain a more consistent
dataset.
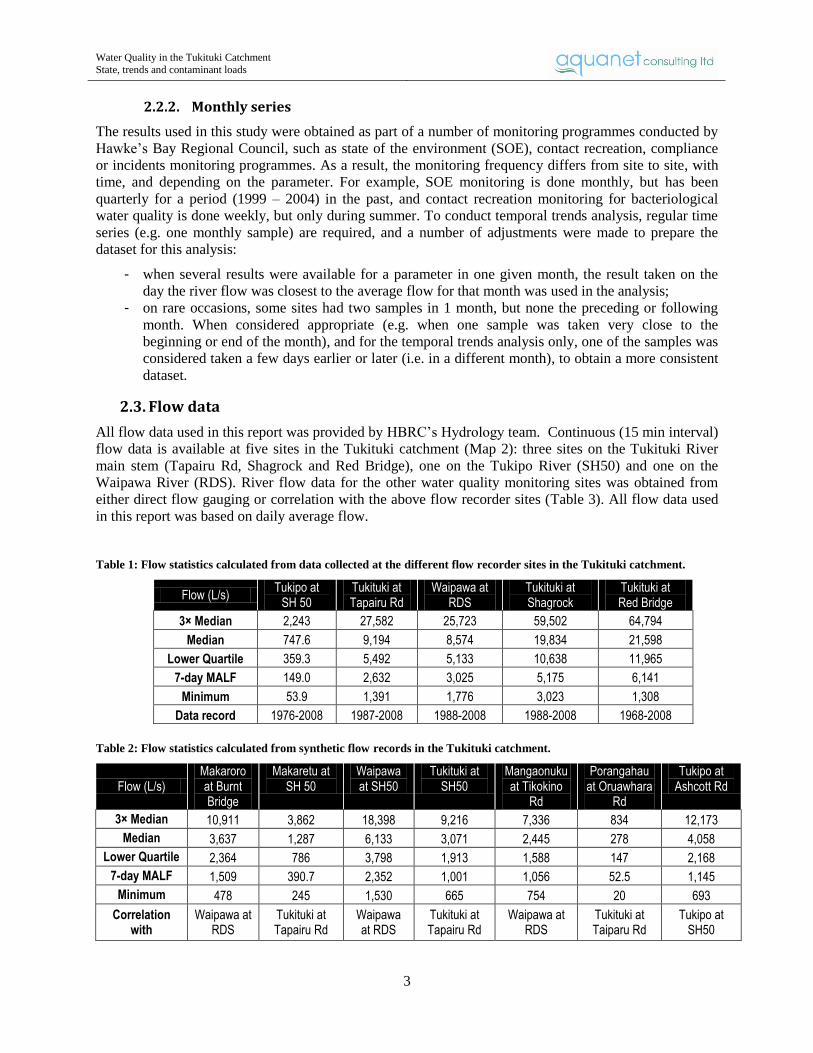
2.3. Flow data
All flow data used in this report was provided by HBRC’s Hydrology team. Continuous (15 min interval)
flow data is available at five sites in the Tukituki catchment (Map 2): three sites on the Tukituki River
main stem (Tapairu Rd, Shagrock and Red Bridge), one on the Tukipo River (SH50) and one on the
Waipawa River (RDS). River flow data for the other water quality monitoring sites was obtained from
either direct flow gauging or correlation with the above flow recorder sites (Table 3). All flow data used
in this report was based on daily average flow.
Table 1: Flow statistics calculated from data collected at the different flow recorder sites in the Tukituki catchment.
Flow (L/s) Tukipo at
SH 50 Tukituki at Tapairu Rd
Waipawa at RDS
Tukituki at Shagrock
Tukituki at Red Bridge
3× Median 2,243 27,582 25,723 59,502 64,794
Median 747.6 9,194 8,574 19,834 21,598
Lower Quartile 359.3 5,492 5,133 10,638 11,965
7-day MALF 149.0 2,632 3,025 5,175 6,141
Minimum 53.9 1,391 1,776 3,023 1,308
Data record 1976-2008 1987-2008 1988-2008 1988-2008 1968-2008
Table 2: Flow statistics calculated from synthetic flow records in the Tukituki catchment.
Flow (L/s) Makaroro at Burnt Bridge
Makaretu at SH 50
Waipawa at SH50
Tukituki at SH50
Mangaonuku at Tikokino
Rd
Porangahau at Oruawhara
Rd
Tukipo at Ashcott Rd
3× Median 10,911 3,862 18,398 9,216 7,336 834 12,173
Median 3,637 1,287 6,133 3,071 2,445 278 4,058
Lower Quartile 2,364 786 3,798 1,913 1,588 147 2,168
7-day MALF 1,509 390.7 2,352 1,001 1,056 52.5 1,145
Minimum 478 245 1,530 665 754 20 693
Correlation with
Waipawa at RDS
Tukituki at Tapairu Rd
Waipawa at RDS
Tukituki at Tapairu Rd
Waipawa at RDS
Tukituki at Taiparu Rd
Tukipo at SH50

Water Quality in the Tukituki Catchment
State, trends and contaminant loads
4
Map 1: Main water quality monitoring sites in the Tukituki catchment.
Map 2: Flow recorders in the Tukituki catchment.
Water Quality in the Tukituki Catchment
State, trends and contaminant loads
5
Table 3: Summary of the water quality and flow data used in this study on the Tukituki catchment. Phy-Chem: Physico-chemical parameters (temperature, pH,
conductivity and dissolved oxygen). Nutrients comprise dissolved reactive phosphorus (DRP) and soluble inorganic nitrogen (SIN). Bacto: bacteriological data (E.coli
and faecal coliforms). Biom: Biomonitoring (macroinvertebrate and periphyton data
Monitoring site HBRC
Site ID
Water quality data
Flow data
Comments Record Period
Parameters
Phy-Chem
Nutrients Bacto Biom.
Tukituki at SH50 (Ashcott Br) 356 1994 - 2008 Flow correlation (medium quality) with Tukituki at Tapairu Rd
Makaroro at Burnt Bridge N/A 1989 - 2006 - - NIWA national network site. Reference (unimpacted) site.
Waipawa at North Block Rd 278 1994 - 2000 - Reference (unimpacted) site
Waipawa at SH50 280 1993 - 2008 Gauged flow or flow correlation (high quality) with Waipawa at RDS
Tukipo at SH50 144 1977-1979
1994 - 2008 Flow recorder site.
Makaretu at SH50 19 1982-1983
1994 – 2008
Flow correlation (medium quality) with Tukituki at Tapairu Rd. Quarterly data 1994-2004, monthly afterwards
Tukituki at SH2 17 1977 - 2008 - 87-08 Flow correlation (high quality) with Tukituki at Tapairu Rd. General data 1977-2000. Only Contact recreation monitoring after 2000.
Mangaonunku at Tikokino Rd 284 1993-1997 2007-2008
1 Gauged flow or flow correlation (medium quality) with Waipawa at RDS
Porangahau at Oruawhara Rd 397 1977 - 2008 87-08 Gauged flow or flow correlation (medium quality) with Tukituki at Tapairu Rd.
Tukipo at Ashcott Rd 21 1990-1996 - Flow correlation (medium quality) with Tukipo at SH50
Tukituki at Tapairu Rd 25 1990 - 2000 - 87 -08 Flow recorder site. Monitored by HBRC as site downstream of Waipukurau oxidation pond discharge
Waipawa at RDS 26 1990 - 2000 - Flow recorder site
Tukituki at Shagrock 2403
+ 281 1998 - 2008 Flow recorder site. Joined dataset with Tukituki at Tamumu Bridge
Mangatarata at Mangatarata Rd 277 1994 -2000 2004-2008
1 - Flow: only some spot gauging. Water quality monitoring irregular between 1997 -2000.
Tukituki at Red Bridge 407 1977 - 2008 Flow recorder site. Site also monitored by NIWA
TukiTuki at Black Bridge 15 1977 - 2008 Flow correlation (medium quality) with Tukituki at Red Bridge
Tukituki upstream of Waipukurau oxidation pond
N/A 05-08 DRP only - Central Hawke’s Bay District Council self-monitoring data. Flow data from Tukituki at Tapairu Rd
Tukituki downstream of Waipukurau oxidation pond
N/A 05-08 DRP only - Central Hawke’s Bay District Council self-monitoring data. Flow data from Tukituki at Tapairu Rd
Waipawa upstream of Waipawa oxidation pond
N/A 05-08 DRP only - Central Hawke’s Bay District Council self-monitoring data. Flow data from Waipawa at RDS
Waipawa downstream of Waipawa oxidation pond
N/A 05-08 DRP only - Central Hawke’s Bay District Council self-monitoring data. Flow data from Waipawa at RDS

Water Quality in the Tukituki Catchment
State, trends and contaminant loads
6
2.4. Data analysis
Descriptive statistics (mean, percentiles, confidence intervals), such as those provided in Appendix A and
showed in different tables and figures in this report were calculated with a number of macros developed
for Microsoft® Office Excel 2007.
To provide more in-depth analysis, water quality data was generally analysed:
- year-round at all flows (i.e. all data available),
- under 3* median flow, to remove the potential influence of flood flows;
- under the lower quartile (25th percentile) flow, to reflect low river flow conditions;
- during and outside the main bathing season (November to April inclusive) to tease out
any difference in water quality between these two periods.
Mann-Whitney tests were used to compare two groups of unpaired data (e.g. winter/summer
comparisons). Wilcoxon paired rank tests were used to compare two groups of paired data (e.g.
comparing contaminant concentration at two sites with the same sampling dates).
Temporal trend analysis (including Kendall seasonal test) was carried out using NIWA’s water quality
trends software.
2.5. Annual Contaminant loads
Contaminant loads are the amount of contaminant carried by the river through one point, or more
correctly one transversal section of the river in a given length of time. Calculation methods generally
assume that the contaminant concentration is homogenous across the section of river. Annual loads were
calculated for water years spanning 1 July-30 June.
When both continuous river flow and contaminant concentration data are available, instantaneous
contaminant flux can be calculated at any point in time, and an estimate of the contaminant load during a
given period of time can be calculated by simply summing up the instantaneous flux:
dttFlowtPollutyearLoadi
i
year
year
i /12/31
/01/01
When contaminant concentrations are known only at regular time intervals (e.g. monthly), the above
formula can be approximated using a number of approaches. Two approximations methods were used in
this report.
2.5.1. Averaging approach
This method uses the monthly average river flow and the monthly average contaminant concentration to
estimate monthly loads. The annual load is then calculated by summing up the monthly loads. This
method is particularly applicable when the contaminant concentration and river flow are independent
variables (Richards, 1998).
Monthly load: dttFlowmonthPollutmonthLoad
i
i
month
month
ii /31
/01
Annual load:
12
1i
ii monthLoadyearLoad

Water Quality in the Tukituki Catchment
State, trends and contaminant loads
7
2.5.2. Ratio approach: The Beale ratio estimator
Ratio estimators use the year’s data to calculate a mean daily load, then use the mean flow from days
lacking concentration data to adjust the mean daily load. The annual load is obtained by multiplying the
mean daily load by 365 (Richards, 1998). Ratio estimators assume that there is a positive linear
relationship between river flow and contaminant load.
The basic assumption of a ratio estimator is that the ratio contaminant load/river flow for the entire year is
the same as on days the contaminant concentration was measured.
o
o
year
year
flowdailyAverage
loaddailyAverage
flowdailyAverage
loaddailyAverage
__
__
__
__
where the subscript “year” refers to an average for the year, and the subscript “o” refers to an average
over the days on which concentration was observed.
However, as daily load and daily flow are correlated variables, this ratio estimator is biased and a bias
correction factor must be used. The Beale Ratio estimator is one way to correct the bias:
2
111
111
__
______
o
oo
lq
o
year
oyear
q
s
Nn
ql
s
Nn
flowdailyAverage
flowdailyAverageloaddailyAverageloaddailyAverage
Where: Slq is the covariance between flow and pollutant flux, sqq is the variance of the flow based on the
days on which concentration was measured. N is the expected population size (365), and n is the number
of concentration measures (generally 12, as we have one measure for each month). lo and qo represent the
average daily flux and flow respectively on the days concentrations were measured.
The square root of the mean square error of the daily load (RMSE) provides an estimate of the standard
deviation, and is given by:
𝑅𝑀𝑆𝐸 = 𝑙𝑜2
1
𝑛−
1
𝑁
𝑆𝑞𝑞
𝑞 𝑜2 +
𝑆𝑙𝑙
𝑙 𝑜2− 2
𝑆𝑙𝑞
𝑙 𝑜 𝑞𝑜 +
1
𝑛−
1
𝑁
2
2𝑆𝑞𝑞
2
𝑞 𝑜4 − 4
𝑆𝑞𝑞
𝑞 𝑜2
𝑆𝑙𝑞
𝑙 𝑜 𝑞𝑜 +
𝑆𝑙𝑞2
𝑙 𝑜 𝑞𝑜 2 +
𝑆𝑞𝑞
𝑞 𝑜2
𝑆𝑙𝑙
𝑙 𝑜2
2.1. Tukituki at Red Bridge: comparison between NIWA and HBRC data
Water quality in the Tukituki River at red bridge is monitored by both Hawke’s Bay regional Council
(1977-2008) and NIWA (1989 – 2006). For “quality assurance” purposes, a statistical comparison of the
data collected by the two agencies was undertaken. The methodology and results are presented in
Appendix G. Although the monitoring programmes are not synchronised (i.e. the HBRC and NIWA
samples are collected on different days), no significant differences were found, indicating that the results
independently obtained by the two agencies are consistent.

Water Quality in the Tukituki Catchment
State, trends and contaminant loads
8
Photo 1: Mangaonuku Stream at Tikokino Road.
Photo 2: Tukipo River at SH50.
Water Quality in the Tukituki Catchment
State, trends and contaminant loads
9
3. Water quality in the Tukituki catchment
3.1. The Tukituki Catchment
The Tukituki River and its largest tributary, the Waipawa River, take their sources high in the Ruahine
Ranges. The other major tributaries take their sources in the foothills of the Ruahine Ranges (Tukipo
River and the Makaretu Stream), the Argyll Ranges bordering the catchment to the north (Mangaonuku
Stream) and the Two Peaks Ranges, to the south of the catchment (Porangahau Stream, Mangatarata
Stream). The Tukituki River flows into the Pacific Ocean on the East Coast of Hawke’s Bay.
3.1.1. Geology and topography
The Tukituki headwaters are in the Ruahine Ranges, dominated by Triassic-Jurassic greywacke, a hard
sedimentary rock. The Ruahine ranges foothills have an underlying geology of tertiary mudstone and
sandstone, with deposited gravel, making the transition to an extensive sedimentary basin, the Ruataniwha
Plains. This basin is bounded to the south, north and east by medium elevation hill ranges, dominated by
sandstones and mudstones, but with significant outcrops of limestone, particularly in the middle
catchment. More detailed information and maps can be found in two HBRC reports (Ludecke, 1988;
HBRC, 2003).
3.1.2. Values
The Tukituki catchment supports a regionally significant brown and rainbow trout fishery. The angling
activity is spread throughout the catchment, with the Tukituki River mainstem, and a number of its
tributaries, including the Waipawa and Tukipo Rivers, and the Makaretu and Mangaonuku Streams the
most sought after fisheries. The trout populations in the catchment are self sustaining, with trout spawning
occurring in a number of tributaries.
Recreational activities, such as swimming canoeing/kayaking and fishing occur throughout the catchment.
The Tukituki catchment also supports significant ecological values associated with the aquatic and
riparian ecosystems and significant habitats of indigenous fauna and flora (HBRC, 2003).
3.1.3. Landcover and landuse
The catchment headwaters, within the Ruahine Forest Park have predominantly native vegetation
assemblages, dominated by native forest, with native shrubland and tussock associations above the tree
line. Apart from some areas of exotic forestry, largely confined to the upper parts of the catchment, the
rest of the catchment is largely deforested. Landuse in the catchment’s hill country (northern, southern
and eastern catchment boundaries) is predominantly low to medium intensity dry stock farming. The
plains are dominated by intensive dairy farming, and horticulture, viticulture and cropping.
3.2. Water quality Standards and Guidelines
Hawke’s Bay Regional Council’s Regional Resource Management Plan (RRMP) defines a number of
surface water quality guidelines applying to the Tukituki catchment. These have primarily a regulatory
purpose, particularly in relation to resource consents for activities having a potential or actual effect on
water quality.
Although they may not be directly applicable to a regulatory context, environmental guidelines are
commonly used in describing the general state of a natural resource. In particular, this report makes
extensive use of indicators based on the percentage of samples which comply with environmental
guidelines or standards. The 2000 ANZECC Guidelines, the 2002 MfE guidelines for microbiological
water quality and the NZ periphyton guidelines (Biggs, 2000) are three documents to consider in relation
to surface water quality.
Water Quality in the Tukituki Catchment
State, trends and contaminant loads
10
The paragraphs below briefly discuss water quality guidelines and standards for the main physical,
chemical, microbiological and biological parameters commonly used in assessing the “health” of a river
system, and their appropriateness for the Tukituki river system. Table 4 summarises the reference values
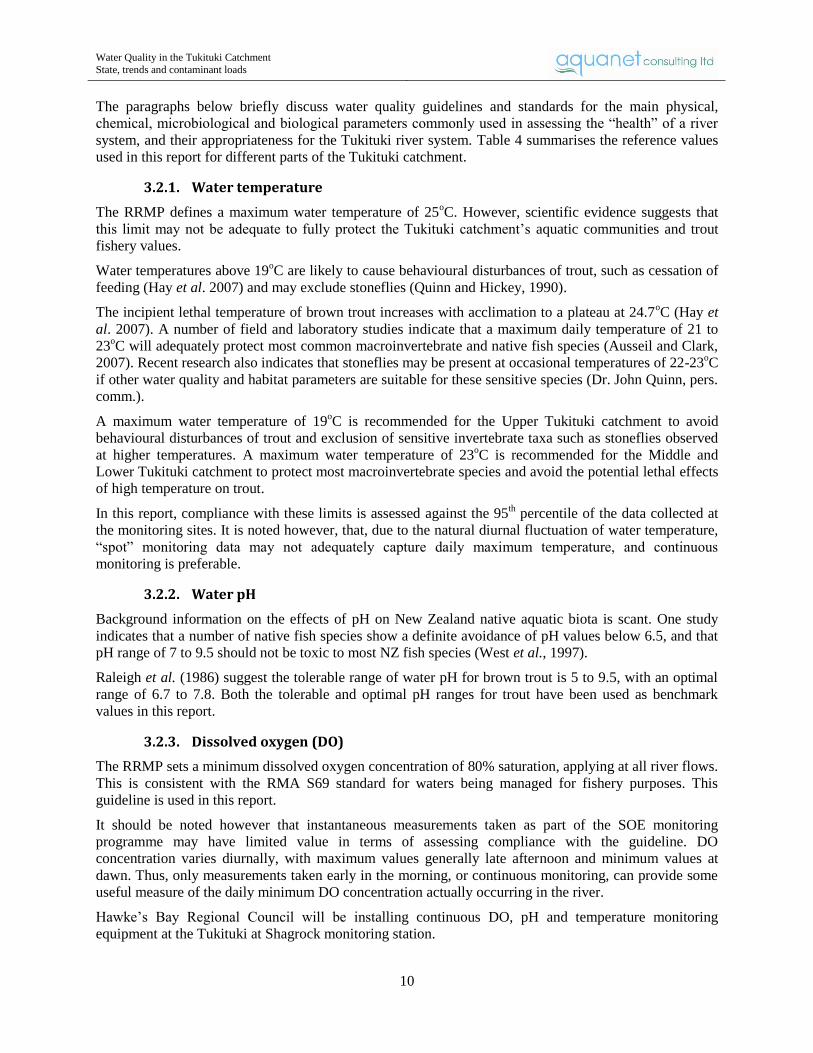
used in this report for different parts of the Tukituki catchment.
3.2.1. Water temperature
The RRMP defines a maximum water temperature of 25oC. However, scientific evidence suggests that
this limit may not be adequate to fully protect the Tukituki catchment’s aquatic communities and trout
fishery values.
Water temperatures above 19oC are likely to cause behavioural disturbances of trout, such as cessation of
feeding (Hay et al. 2007) and may exclude stoneflies (Quinn and Hickey, 1990).
The incipient lethal temperature of brown trout increases with acclimation to a plateau at 24.7oC (Hay et
al. 2007). A number of field and laboratory studies indicate that a maximum daily temperature of 21 to
23oC will adequately protect most common macroinvertebrate and native fish species (Ausseil and Clark,
2007). Recent research also indicates that stoneflies may be present at occasional temperatures of 22-23oC
if other water quality and habitat parameters are suitable for these sensitive species (Dr. John Quinn, pers.
comm.).
A maximum water temperature of 19oC is recommended for the Upper Tukituki catchment to avoid
behavioural disturbances of trout and exclusion of sensitive invertebrate taxa such as stoneflies observed
at higher temperatures. A maximum water temperature of 23oC is recommended for the Middle and
Lower Tukituki catchment to protect most macroinvertebrate species and avoid the potential lethal effects
of high temperature on trout.
In this report, compliance with these limits is assessed against the 95th percentile of the data collected at
the monitoring sites. It is noted however, that, due to the natural diurnal fluctuation of water temperature,
“spot” monitoring data may not adequately capture daily maximum temperature, and continuous
monitoring is preferable.
3.2.2. Water pH
Background information on the effects of pH on New Zealand native aquatic biota is scant. One study
indicates that a number of native fish species show a definite avoidance of pH values below 6.5, and that
pH range of 7 to 9.5 should not be toxic to most NZ fish species (West et al., 1997).
Raleigh et al. (1986) suggest the tolerable range of water pH for brown trout is 5 to 9.5, with an optimal
range of 6.7 to 7.8. Both the tolerable and optimal pH ranges for trout have been used as benchmark
values in this report.
3.2.3. Dissolved oxygen (DO)
The RRMP sets a minimum dissolved oxygen concentration of 80% saturation, applying at all river flows.
This is consistent with the RMA S69 standard for waters being managed for fishery purposes. This
guideline is used in this report.
It should be noted however that instantaneous measurements taken as part of the SOE monitoring
programme may have limited value in terms of assessing compliance with the guideline. DO
concentration varies diurnally, with maximum values generally late afternoon and minimum values at
dawn. Thus, only measurements taken early in the morning, or continuous monitoring, can provide some
useful measure of the daily minimum DO concentration actually occurring in the river.
Hawke’s Bay Regional Council will be installing continuous DO, pH and temperature monitoring
equipment at the Tukituki at Shagrock monitoring station.
Water Quality in the Tukituki Catchment
State, trends and contaminant loads
11
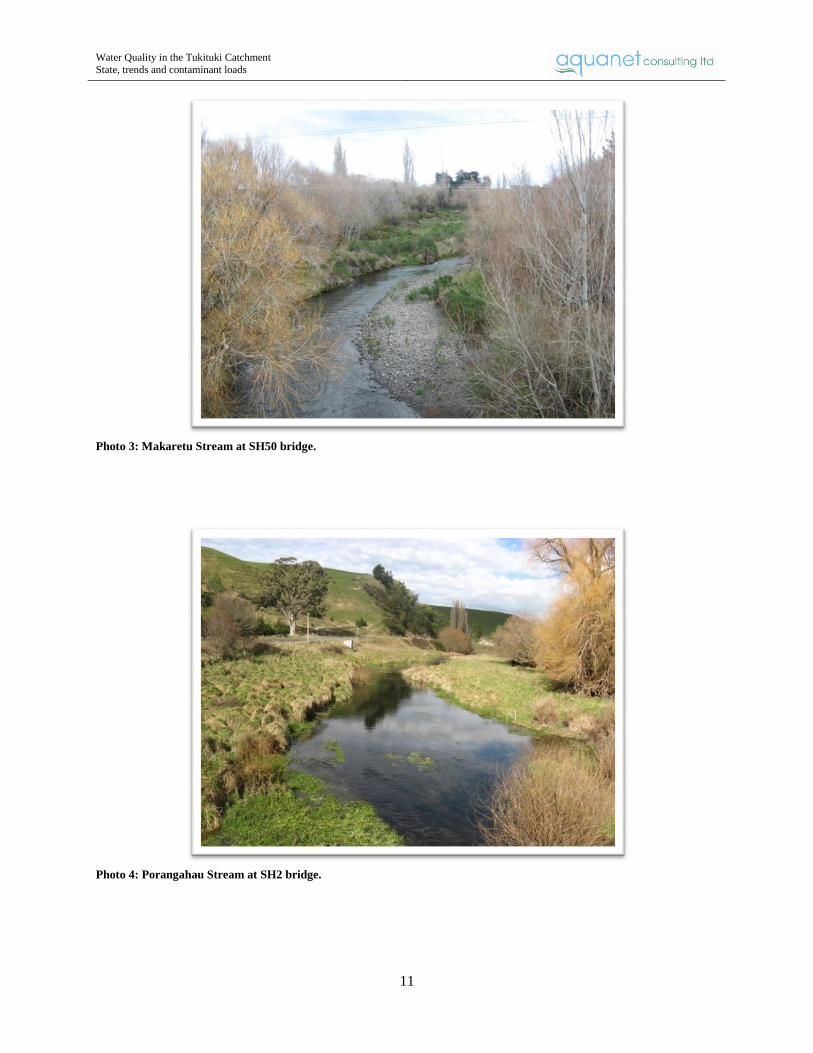
Photo 3: Makaretu Stream at SH50 bridge.
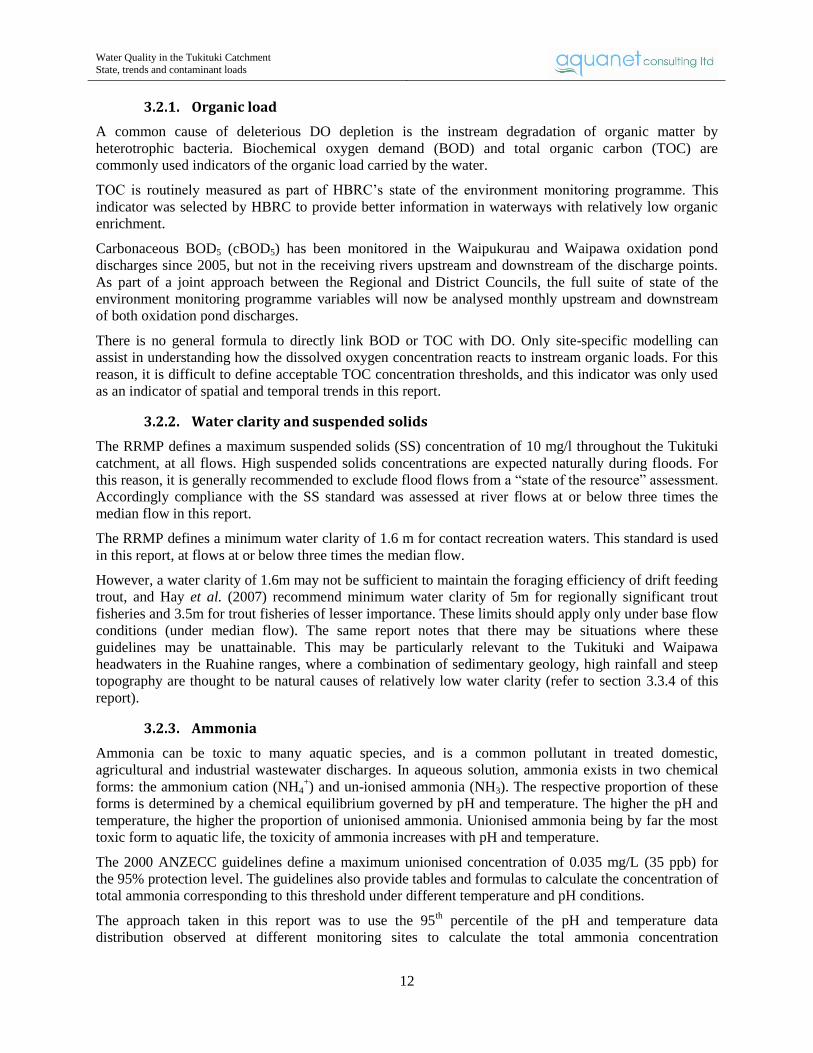
Photo 4: Porangahau Stream at SH2 bridge.
Water Quality in the Tukituki Catchment
State, trends and contaminant loads
12
3.2.1. Organic load
A common cause of deleterious DO depletion is the instream degradation of organic matter by
heterotrophic bacteria. Biochemical oxygen demand (BOD) and total organic carbon (TOC) are
commonly used indicators of the organic load carried by the water.
TOC is routinely measured as part of HBRC’s state of the environment monitoring programme. This
indicator was selected by HBRC to provide better information in waterways with relatively low organic
enrichment.
Carbonaceous BOD5 (cBOD5) has been monitored in the Waipukurau and Waipawa oxidation pond
discharges since 2005, but not in the receiving rivers upstream and downstream of the discharge points.
As part of a joint approach between the Regional and District Councils, the full suite of state of the
environment monitoring programme variables will now be analysed monthly upstream and downstream
of both oxidation pond discharges.
There is no general formula to directly link BOD or TOC with DO. Only site-specific modelling can
assist in understanding how the dissolved oxygen concentration reacts to instream organic loads. For this
reason, it is difficult to define acceptable TOC concentration thresholds, and this indicator was only used
as an indicator of spatial and temporal trends in this report.
3.2.2. Water clarity and suspended solids
The RRMP defines a maximum suspended solids (SS) concentration of 10 mg/l throughout the Tukituki
catchment, at all flows. High suspended solids concentrations are expected naturally during floods. For
this reason, it is generally recommended to exclude flood flows from a “state of the resource” assessment.
Accordingly compliance with the SS standard was assessed at river flows at or below three times the
median flow in this report.
The RRMP defines a minimum water clarity of 1.6 m for contact recreation waters. This standard is used
in this report, at flows at or below three times the median flow.
However, a water clarity of 1.6m may not be sufficient to maintain the foraging efficiency of drift feeding
trout, and Hay et al. (2007) recommend minimum water clarity of 5m for regionally significant trout
fisheries and 3.5m for trout fisheries of lesser importance. These limits should apply only under base flow
conditions (under median flow). The same report notes that there may be situations where these
guidelines may be unattainable. This may be particularly relevant to the Tukituki and Waipawa
headwaters in the Ruahine ranges, where a combination of sedimentary geology, high rainfall and steep
topography are thought to be natural causes of relatively low water clarity (refer to section 3.3.4 of this
report).
3.2.3. Ammonia
Ammonia can be toxic to many aquatic species, and is a common pollutant in treated domestic,
agricultural and industrial wastewater discharges. In aqueous solution, ammonia exists in two chemical
forms: the ammonium cation (NH4+) and un-ionised ammonia (NH3). The respective proportion of these
forms is determined by a chemical equilibrium governed by pH and temperature. The higher the pH and
temperature, the higher the proportion of unionised ammonia. Unionised ammonia being by far the most
toxic form to aquatic life, the toxicity of ammonia increases with pH and temperature.
The 2000 ANZECC guidelines define a maximum unionised concentration of 0.035 mg/L (35 ppb) for
the 95% protection level. The guidelines also provide tables and formulas to calculate the concentration of
total ammonia corresponding to this threshold under different temperature and pH conditions.
The approach taken in this report was to use the 95th percentile of the pH and temperature data
distribution observed at different monitoring sites to calculate the total ammonia concentration
Water Quality in the Tukituki Catchment
State, trends and contaminant loads
13
corresponding to the ANZECC 95% protection level (35 ppb unionised ammonia). The results are
summarised in Table 4. The lowest value obtained was retained as the recommended overall guideline for
each part of the catchment. For consistency with the upper catchment, a guideline value of 0.4g/m3 was
recommended for the middle catchment. It is noted that the low ammonia threshold value recommended
for the lower catchment is due to the high pH commonly recorded, in turn likely caused by high algal
biomass.
Table 4: Maximum total ammonia-nitrogen (NH4-N) concentration recommended by the 2000 ANZECC guidelines for
the protection of 95% of aquatic species. Calculations based on ANZECC Guidelines table 8.3.6, 95% protection level
(0.035 mg/l un-ionised ammonia),. and 95th percentile of water temperature and pH data recorded at monitoring sites in
the Tukituki catchment.
Section of catchment
Site Temperature (oC) 95th %ile
pH 95th %ile
Recommended Total NH4-N guideline (mg/l)
Upper catchment
Tukituki at SH50 19 8.0 0.9
0.4 Tukipo at SH50 19 8.5 0.4
Makaretu at SH50 20 8.0 0.9
Waipawa at SH50 18 7.8 1.7
Middle catchment
Tukituki at SH2 22 7.9 0.8
0.4 Porangahauat Oruawhara Rd 20 8.5 0.5
Mangatarata 20 7.9 1.2
Tukituki at Shagrock 23 ND 22
Lower catchment
Tukituki at Red Br 23 9.4 <0.18 0.18
Tukituki at Black Br 23 9.3 <0.18
3.2.4. Bacteriological water quality
Two indicators of the microbiological water quality have been routinely monitored in the Tukituki
catchment, faecal coliforms (FC) and Escherichia coli (E.coli). Both are used as indicators of the presence
of pathogens of faecal origin in the water, in turn linked with the level of health risk to water users.
The RRMP defines guideline values of 50 faecal coliforms/100mL in the upper Tukituki catchment, 200
in the middle catchment and 100 in the lower catchment. This guideline applies at river flows at or below
median flow.
The 2002 microbiological water quality guidelines (MfE, 2002) define a three-mode management system
for recreational freshwaters: Acceptable/green (E.coli < 260/100mL); Alert/Amber (E.coli < 550/100mL)
and Red/Action (E.coli >550/100mL). The red mode indicates an unacceptable level of health risks to
contact recreation users (e.g. swimmers). These are single-value criteria, designed to trigger further
investigation and additional sampling (amber mode) and positive action to identify the source(s) of
contamination and warn recreational users (red mode).
The 550 E.coli/100mL has been used in this report to assess suitability for swimming at all river flows.
As E.coli are a subset of total faecal coliforms, the RRMP guideline is more stringent than the MfE
guideline.
Water Quality in the Tukituki Catchment
State, trends and contaminant loads
14
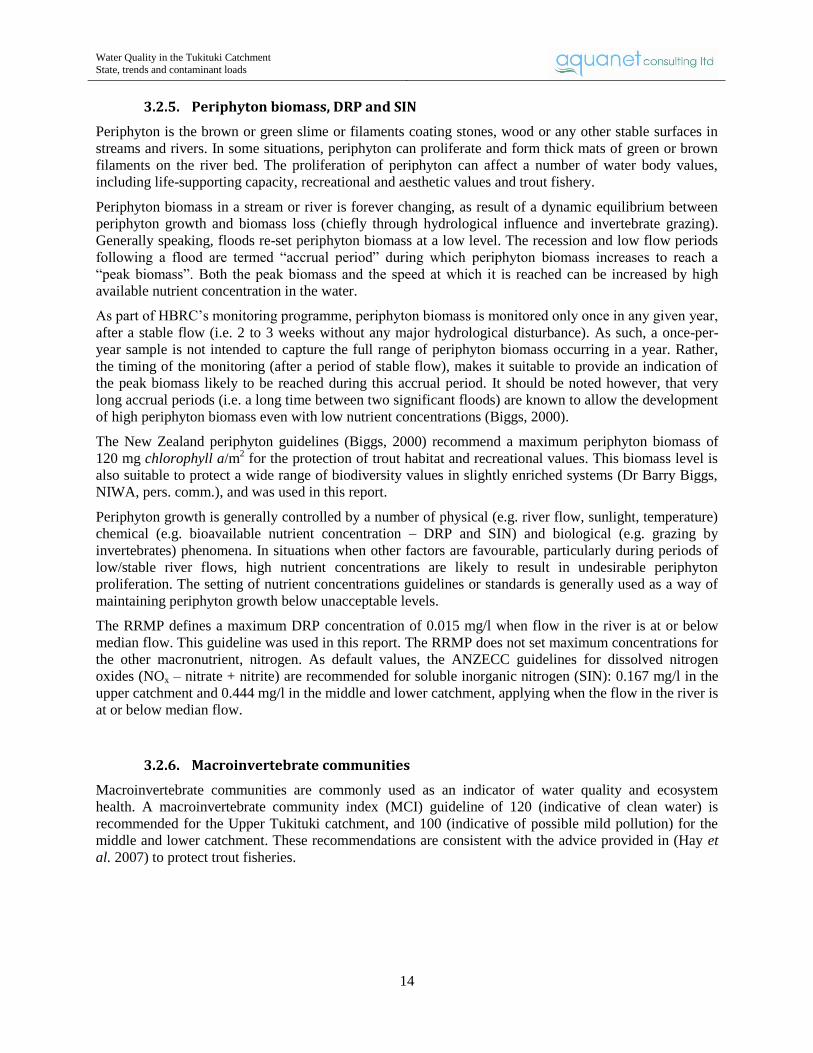
3.2.5. Periphyton biomass, DRP and SIN
Periphyton is the brown or green slime or filaments coating stones, wood or any other stable surfaces in
streams and rivers. In some situations, periphyton can proliferate and form thick mats of green or brown
filaments on the river bed. The proliferation of periphyton can affect a number of water body values,
including life-supporting capacity, recreational and aesthetic values and trout fishery.
Periphyton biomass in a stream or river is forever changing, as result of a dynamic equilibrium between
periphyton growth and biomass loss (chiefly through hydrological influence and invertebrate grazing).
Generally speaking, floods re-set periphyton biomass at a low level. The recession and low flow periods
following a flood are termed “accrual period” during which periphyton biomass increases to reach a
“peak biomass”. Both the peak biomass and the speed at which it is reached can be increased by high
available nutrient concentration in the water.
As part of HBRC’s monitoring programme, periphyton biomass is monitored only once in any given year,
after a stable flow (i.e. 2 to 3 weeks without any major hydrological disturbance). As such, a once-per-
year sample is not intended to capture the full range of periphyton biomass occurring in a year. Rather,
the timing of the monitoring (after a period of stable flow), makes it suitable to provide an indication of
the peak biomass likely to be reached during this accrual period. It should be noted however, that very
long accrual periods (i.e. a long time between two significant floods) are known to allow the development
of high periphyton biomass even with low nutrient concentrations (Biggs, 2000).
The New Zealand periphyton guidelines (Biggs, 2000) recommend a maximum periphyton biomass of
120 mg chlorophyll a/m2 for the protection of trout habitat and recreational values. This biomass level is
also suitable to protect a wide range of biodiversity values in slightly enriched systems (Dr Barry Biggs,
NIWA, pers. comm.), and was used in this report.
Periphyton growth is generally controlled by a number of physical (e.g. river flow, sunlight, temperature)
chemical (e.g. bioavailable nutrient concentration – DRP and SIN) and biological (e.g. grazing by
invertebrates) phenomena. In situations when other factors are favourable, particularly during periods of
low/stable river flows, high nutrient concentrations are likely to result in undesirable periphyton
proliferation. The setting of nutrient concentrations guidelines or standards is generally used as a way of
maintaining periphyton growth below unacceptable levels.
The RRMP defines a maximum DRP concentration of 0.015 mg/l when flow in the river is at or below
median flow. This guideline was used in this report. The RRMP does not set maximum concentrations for
the other macronutrient, nitrogen. As default values, the ANZECC guidelines for dissolved nitrogen
oxides (NOx – nitrate + nitrite) are recommended for soluble inorganic nitrogen (SIN): 0.167 mg/l in the
upper catchment and 0.444 mg/l in the middle and lower catchment, applying when the flow in the river is
at or below median flow.
3.2.6. Macroinvertebrate communities
Macroinvertebrate communities are commonly used as an indicator of water quality and ecosystem
health. A macroinvertebrate community index (MCI) guideline of 120 (indicative of clean water) is
recommended for the Upper Tukituki catchment, and 100 (indicative of possible mild pollution) for the
middle and lower catchment. These recommendations are consistent with the advice provided in (Hay et
al. 2007) to protect trout fisheries.
Water Quality in the Tukituki Catchment
State, trends and contaminant loads
15
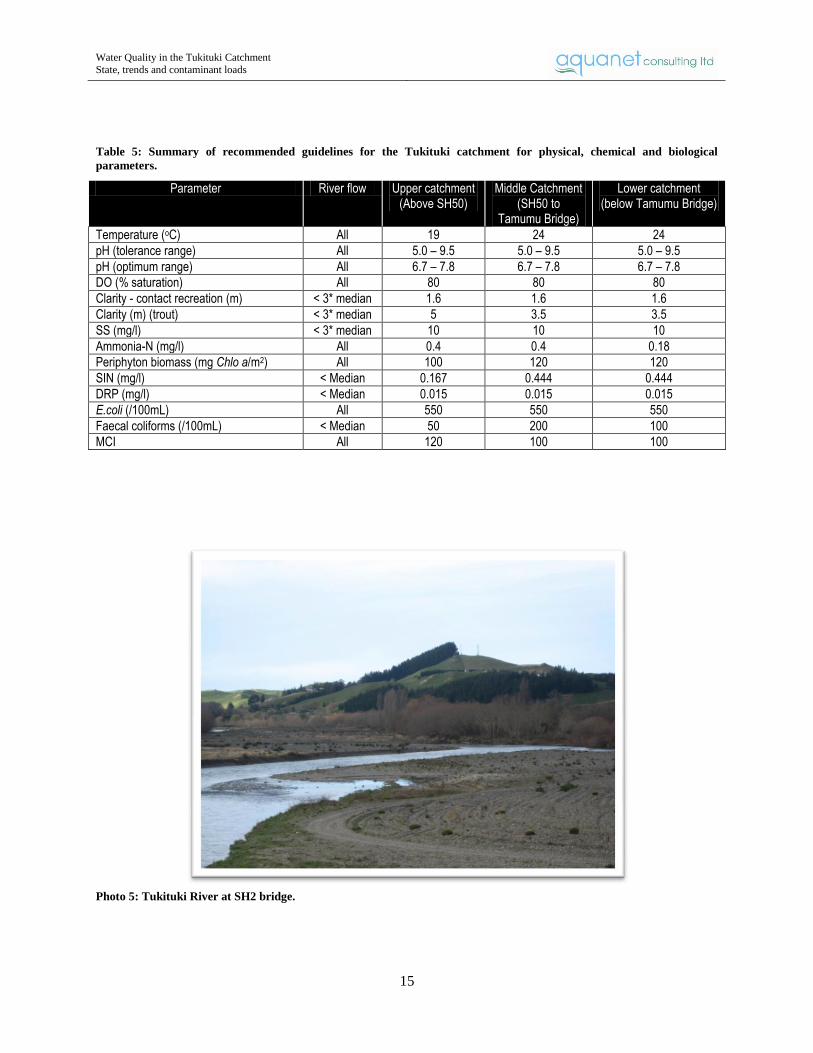
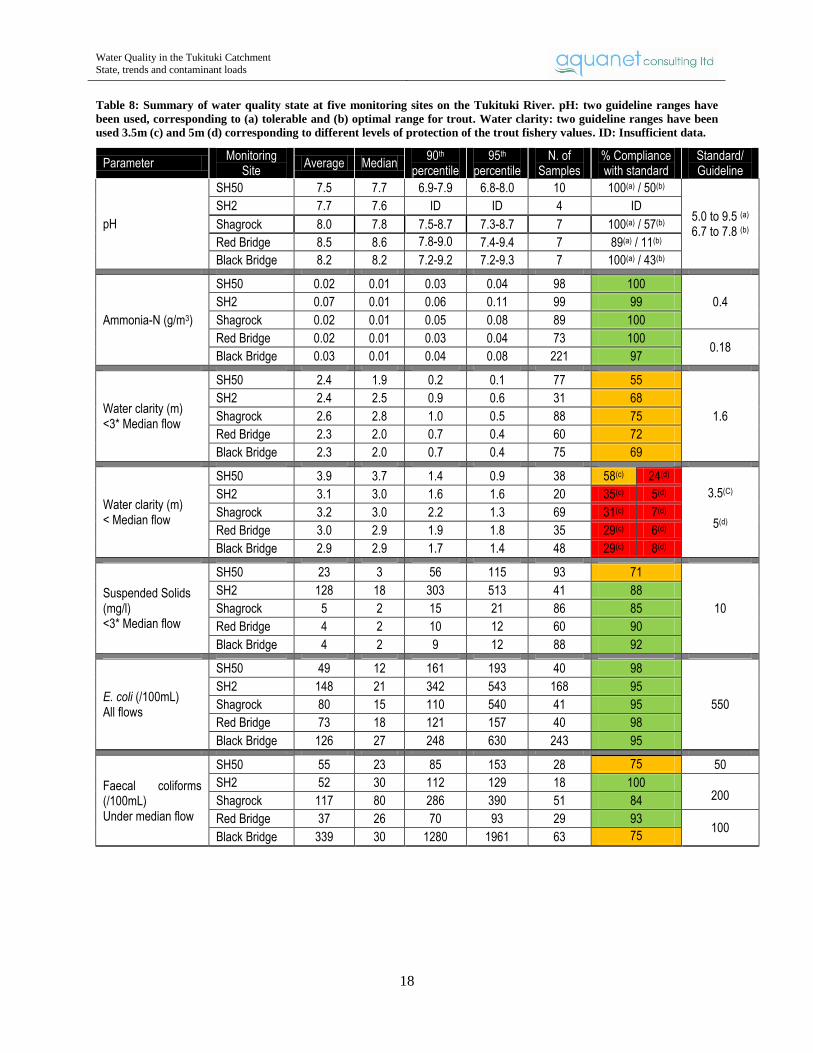
Table 5: Summary of recommended guidelines for the Tukituki catchment for physical, chemical and biological
parameters.
Parameter River flow Upper catchment (Above SH50)
Middle Catchment (SH50 to
Tamumu Bridge)
Lower catchment (below Tamumu Bridge)
Temperature (oC) All 19 24 24
pH (tolerance range) All 5.0 – 9.5 5.0 – 9.5 5.0 – 9.5
pH (optimum range) All 6.7 – 7.8 6.7 – 7.8 6.7 – 7.8
DO (% saturation) All 80 80 80
Clarity - contact recreation (m) < 3* median 1.6 1.6 1.6
Clarity (m) (trout) < 3* median 5 3.5 3.5
SS (mg/l) < 3* median 10 10 10
Ammonia-N (mg/l) All 0.4 0.4 0.18
Periphyton biomass (mg Chlo a/m2) All 100 120 120
SIN (mg/l) < Median 0.167 0.444 0.444
DRP (mg/l) < Median 0.015 0.015 0.015
E.coli (/100mL) All 550 550 550
Faecal coliforms (/100mL) < Median 50 200 100
MCI All 120 100 100
Photo 5: Tukituki River at SH2 bridge.

Water Quality in the Tukituki Catchment
State, trends and contaminant loads
16
3.3. Water Quality of the Tukituki River
Table 6 to Table 8 provide a summary of the water quality at the main monitoring sites on the main stem
of the Tukituki River.
3.3.1. Biological monitoring
There is a clear trend of increasing measured periphyton biomass (and decreasing rate of compliance with
the guideline) going downstream in the Tukituki River. Macroinvertebrate community index values
(MCI) values show the same pattern - a progressive degradation going downstream in the catchment.
Table 6: Summary of biomonitoring results at five monitoring sites on the Tukituki River. Sites are presented in the
upstream to downstream order.
Parameter Monitoring
Site Average Minimum Maximum
N. of Samples
% Compliance with standard
Standard/ Guideline
Periphyton biomass Chlorophyll a (mg/m2)
SH50 118 22 390 5 80 (4/5)
120
SH2 - - - - -
Shagrock 118 7 230 4 50 (2/4)
Red Bridge 264 20 660 5 40 (2/5)
Black Bridge 220 51 500 5 40 (2/5)
Macroinvertebrate Community Index (MCI)
SH50 122 103 144 11 55 (6/11) 120
SH2 - - - - -
100 Shagrock 112 90 129 7 86 (6/7)
Red Bridge 104 78 123 11 55 (6/11)
Black Bridge 86 75 118 7 14 (1/7)
3.3.2. Nutrients
Both DRP and SIN concentrations indicate very good water quality at SH50. However, both nutrient
concentrations increase rapidly between SH50 and SH2, where the level of compliance with the
recommended guideline is relatively poor for DRP (61%) and very poor for SIN (9%). The level of
compliance remains relatively stable between SH2 and Shagrock, in spite of the confluence with the
Tukituki’s largest tributary, the Waipawa River. The nutrient concentrations improve significantly in the
lower catchment (Red Bridge and Black Bridge).
Although the nutrient concentrations at SH50 are generally acceptable, the periphyton biomass exceeded
the guideline on 1 out of 5 sampling occasions. This could be caused by the very extended periods of low
which occur in some summer seasons
The decrease in nutrients concentrations observed in the lower catchment may be due to increased
consumption by the algal biomass – an hypothesis corroborated by the increased periphyton biomass in
the lower catchment.
3.3.3. Microbiological water quality
E.coli concentrations recorded at the 5 monitoring sites along the Tukituki River have nearly always been
below the MfE guideline (at least 95% compliance), indicating water of a swimmable standard most of
the time.
The more stringent RRMP guideline is also generally complied with below median flow, although the
levels of compliance at Shagrock and Black Bridge are marginally lower. The lower level of compliance
with the RRMP guideline observed at SH50 is due to the lower guideline value (50/100 ml) rather than
degraded water quality.
Water Quality in the Tukituki Catchment
State, trends and contaminant loads
17
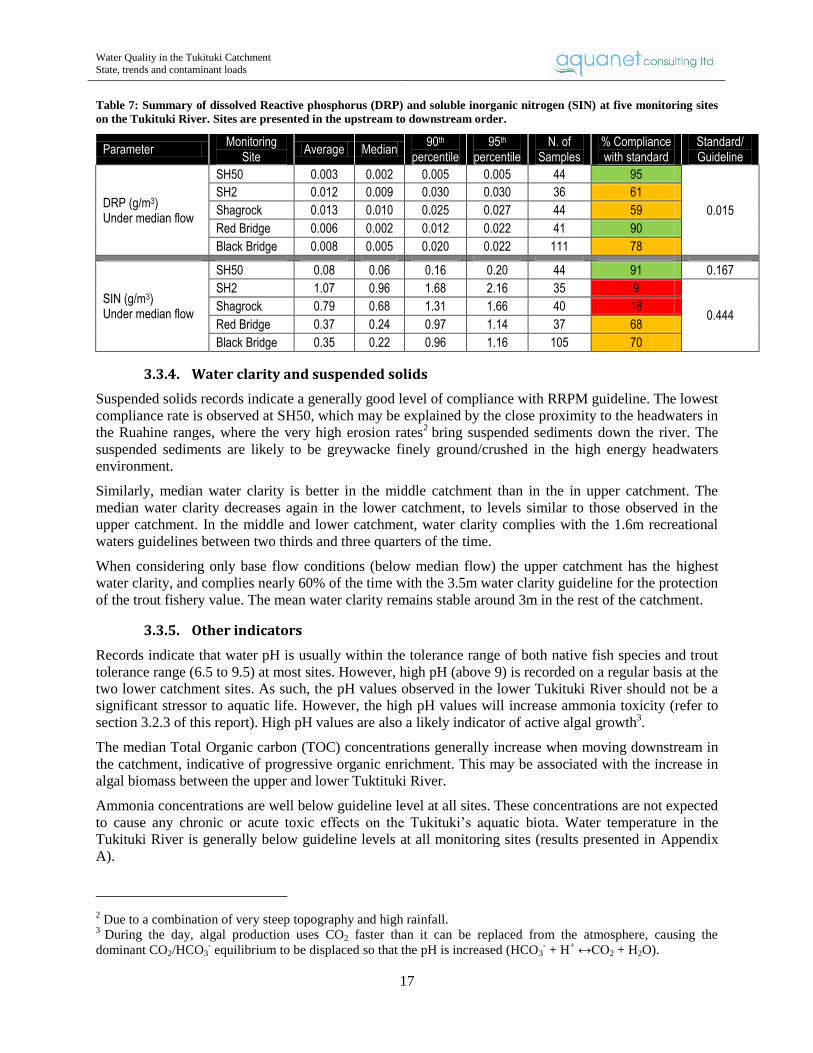
Table 7: Summary of dissolved Reactive phosphorus (DRP) and soluble inorganic nitrogen (SIN) at five monitoring sites
on the Tukituki River. Sites are presented in the upstream to downstream order.
Parameter Monitoring
Site Average Median
90th percentile
95th percentile
N. of Samples
% Compliance with standard
Standard/ Guideline
DRP (g/m3) Under median flow
SH50 0.003 0.002 0.005 0.005 44 95
0.015
SH2 0.012 0.009 0.030 0.030 36 61
Shagrock 0.013 0.010 0.025 0.027 44 59
Red Bridge 0.006 0.002 0.012 0.022 41 90
Black Bridge 0.008 0.005 0.020 0.022 111 78
SIN (g/m3) Under median flow
SH50 0.08 0.06 0.16 0.20 44 91 0.167
SH2 1.07 0.96 1.68 2.16 35 9
0.444 Shagrock 0.79 0.68 1.31 1.66 40 18
Red Bridge 0.37 0.24 0.97 1.14 37 68
Black Bridge 0.35 0.22 0.96 1.16 105 70
3.3.4. Water clarity and suspended solids
Suspended solids records indicate a generally good level of compliance with RRPM guideline. The lowest
compliance rate is observed at SH50, which may be explained by the close proximity to the headwaters in
the Ruahine ranges, where the very high erosion rates2 bring suspended sediments down the river. The
suspended sediments are likely to be greywacke finely ground/crushed in the high energy headwaters
environment.
Similarly, median water clarity is better in the middle catchment than in the in upper catchment. The
median water clarity decreases again in the lower catchment, to levels similar to those observed in the
upper catchment. In the middle and lower catchment, water clarity complies with the 1.6m recreational
waters guidelines between two thirds and three quarters of the time.
When considering only base flow conditions (below median flow) the upper catchment has the highest
water clarity, and complies nearly 60% of the time with the 3.5m water clarity guideline for the protection
of the trout fishery value. The mean water clarity remains stable around 3m in the rest of the catchment.
3.3.5. Other indicators
Records indicate that water pH is usually within the tolerance range of both native fish species and trout
tolerance range (6.5 to 9.5) at most sites. However, high pH (above 9) is recorded on a regular basis at the
two lower catchment sites. As such, the pH values observed in the lower Tukituki River should not be a
significant stressor to aquatic life. However, the high pH values will increase ammonia toxicity (refer to
section 3.2.3 of this report). High pH values are also a likely indicator of active algal growth3.
The median Total Organic carbon (TOC) concentrations generally increase when moving downstream in
the catchment, indicative of progressive organic enrichment. This may be associated with the increase in
algal biomass between the upper and lower Tuktituki River.
Ammonia concentrations are well below guideline level at all sites. These concentrations are not expected
to cause any chronic or acute toxic effects on the Tukituki’s aquatic biota. Water temperature in the
Tukituki River is generally below guideline levels at all monitoring sites (results presented in Appendix
A).
2 Due to a combination of very steep topography and high rainfall.
3 During the day, algal production uses CO2 faster than it can be replaced from the atmosphere, causing the
dominant CO2/HCO3- equilibrium to be displaced so that the pH is increased (HCO3
- + H
+ ↔CO2 + H2O).
Water Quality in the Tukituki Catchment
State, trends and contaminant loads
18
Table 8: Summary of water quality state at five monitoring sites on the Tukituki River. pH: two guideline ranges have
been used, corresponding to (a) tolerable and (b) optimal range for trout. Water clarity: two guideline ranges have been
used 3.5m (c) and 5m (d) corresponding to different levels of protection of the trout fishery values. ID: Insufficient data.
Parameter Monitoring
Site Average Median
90th percentile
95th percentile
N. of Samples
% Compliance with standard
Standard/ Guideline
pH
SH50 7.5 7.7 6.9-7.9 6.8-8.0 10 100(a) / 50(b)
5.0 to 9.5 (a) 6.7 to 7.8 (b)
SH2 7.7 7.6 ID ID 4 ID
Shagrock 8.0 7.8 7.5-8.7 7.3-8.7 7 100(a) / 57(b)
Red Bridge 8.5 8.6 7.8-9.0 89.0
7.4-9.4 7 89(a) / 11(b)
Black Bridge 8.2 8.2 7.2-9.2 7.2-9.3 7 100(a) / 43(b)
Ammonia-N (g/m3)
SH50 0.02 0.01 0.03 0.04 98 100
0.4 SH2 0.07 0.01 0.06 0.11 99 99
Shagrock 0.02 0.01 0.05 0.08 89 100
Red Bridge 0.02 0.01 0.03 0.04 73 100 0.18
Black Bridge 0.03 0.01 0.04 0.08 221 97
Water clarity (m) <3* Median flow
SH50 2.4 1.9 0.2 0.1 77 55
1.6
SH2 2.4 2.5 0.9 0.6 31 68
Shagrock 2.6 2.8 1.0 0.5 88 75
Red Bridge 2.3 2.0 0.7 0.4 60 72
Black Bridge 2.3 2.0 0.7 0.4 75 69
Water clarity (m) < Median flow
SH50 3.9 3.7 1.4 0.9 38 58(c) 24(d) 3.5(C)
5(d)
SH2 3.1 3.0 1.6 1.6 20 35(c) 5(d)
Shagrock 3.2 3.0 2.2 1.3 69 31(c) 7(d)
Red Bridge 3.0 2.9 1.9 1.8 35 29(c) 6(d)
Black Bridge 2.9 2.9 1.7 1.4 48 29(c) 8(d)
Suspended Solids (mg/l) <3* Median flow
SH50 23 3 56 115 93 71
10
SH2 128 18 303 513 41 88
Shagrock 5 2 15 21 86 85
Red Bridge 4 2 10 12 60 90
Black Bridge 4 2 9 12 88 92
E. coli (/100mL) All flows
SH50 49 12 161 193 40 98
550
SH2 148 21 342 543 168 95
Shagrock 80 15 110 540 41 95
Red Bridge 73 18 121 157 40 98
Black Bridge 126 27 248 630 243 95
Faecal coliforms (/100mL) Under median flow
SH50 55 23 85 153 28 75
50
SH2 52 30 112 129 18 100 200 Shagrock 117 80 286 390 51 84
Red Bridge 37 26 70 93 29 93 100
Black Bridge 339 30 1280 1961 63 75
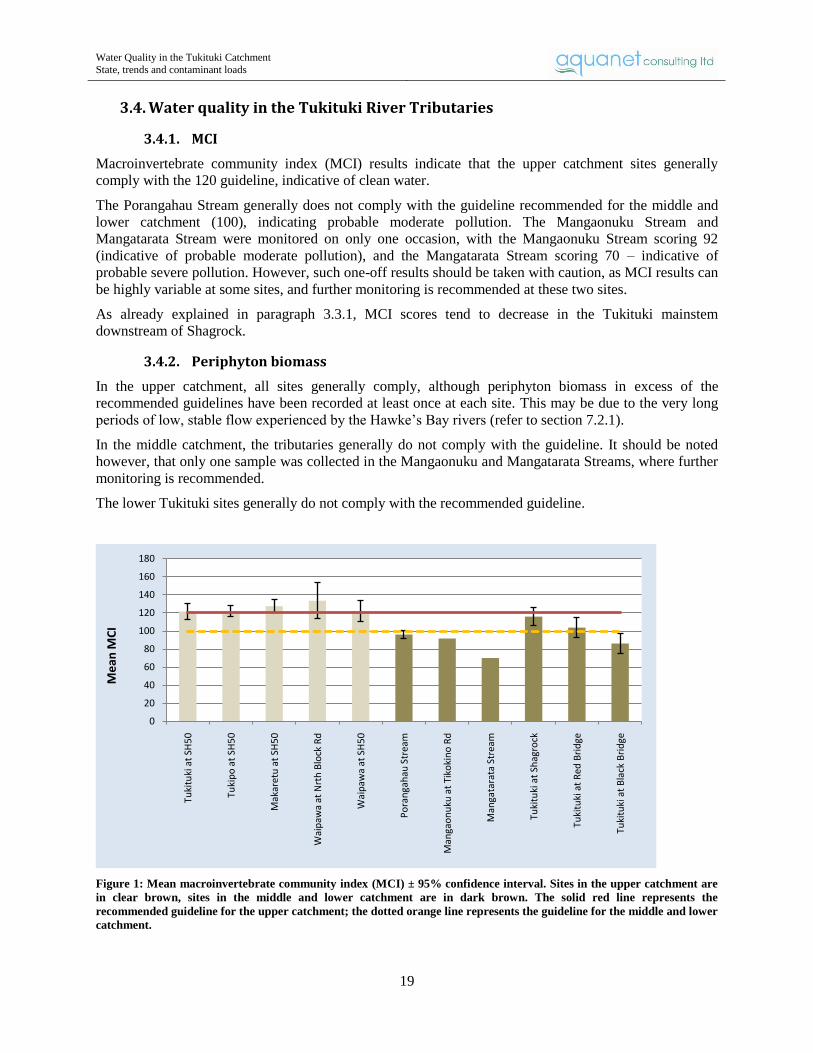
Water Quality in the Tukituki Catchment
State, trends and contaminant loads
19
3.4. Water quality in the Tukituki River Tributaries
3.4.1. MCI
Macroinvertebrate community index (MCI) results indicate that the upper catchment sites generally
comply with the 120 guideline, indicative of clean water.
The Porangahau Stream generally does not comply with the guideline recommended for the middle and
lower catchment (100), indicating probable moderate pollution. The Mangaonuku Stream and
Mangatarata Stream were monitored on only one occasion, with the Mangaonuku Stream scoring 92
(indicative of probable moderate pollution), and the Mangatarata Stream scoring 70 – indicative of
probable severe pollution. However, such one-off results should be taken with caution, as MCI results can
be highly variable at some sites, and further monitoring is recommended at these two sites.
As already explained in paragraph 3.3.1, MCI scores tend to decrease in the Tukituki mainstem
downstream of Shagrock.
3.4.2. Periphyton biomass
In the upper catchment, all sites generally comply, although periphyton biomass in excess of the
recommended guidelines have been recorded at least once at each site. This may be due to the very long
periods of low, stable flow experienced by the Hawke’s Bay rivers (refer to section 7.2.1).
In the middle catchment, the tributaries generally do not comply with the guideline. It should be noted
however, that only one sample was collected in the Mangaonuku and Mangatarata Streams, where further
monitoring is recommended.
The lower Tukituki sites generally do not comply with the recommended guideline.
Figure 1: Mean macroinvertebrate community index (MCI) ± 95% confidence interval. Sites in the upper catchment are
in clear brown, sites in the middle and lower catchment are in dark brown. The solid red line represents the
recommended guideline for the upper catchment; the dotted orange line represents the guideline for the middle and lower
catchment.
0
20
40
60
80
100
120
140
160
180
Tuki
tuki
at
SH5
0
Tuki
po
at
SH5
0
Mak
aret
u a
t SH
50
Wai
paw
a at
Nrt
h B
lock
Rd
Wai
paw
a at
SH
50
Po
ran
gah
au S
trea
m
Man
gao
nu
ku a
t Ti
koki
no
Rd
Man
gata
rata
Str
eam
Tuki
tuki
at
Shag
rock
Tuki
tuki
at
Red
Bri
dge
Tuki
tuki
at
Bla
ck B
rid
ge
Me
an M
CI
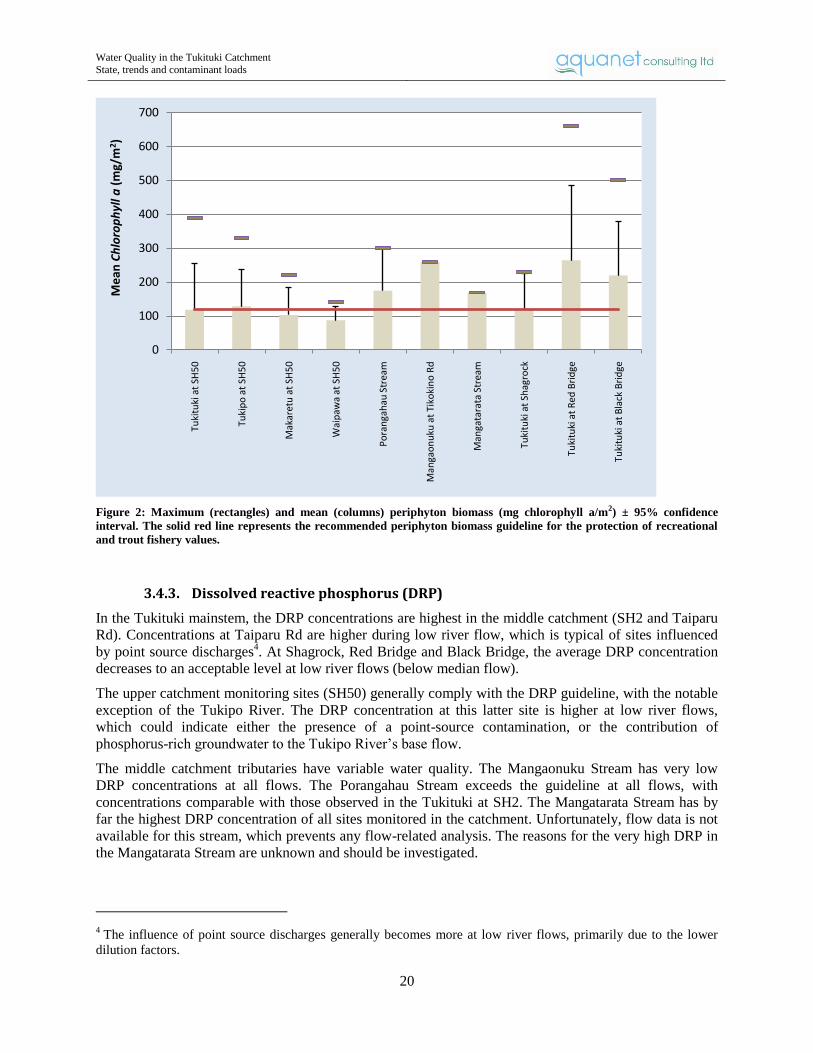
Water Quality in the Tukituki Catchment
State, trends and contaminant loads
20
Figure 2: Maximum (rectangles) and mean (columns) periphyton biomass (mg chlorophyll a/m2) ± 95% confidence
interval. The solid red line represents the recommended periphyton biomass guideline for the protection of recreational
and trout fishery values.
3.4.3. Dissolved reactive phosphorus (DRP)
In the Tukituki mainstem, the DRP concentrations are highest in the middle catchment (SH2 and Taiparu
Rd). Concentrations at Taiparu Rd are higher during low river flow, which is typical of sites influenced
by point source discharges4. At Shagrock, Red Bridge and Black Bridge, the average DRP concentration
decreases to an acceptable level at low river flows (below median flow).
The upper catchment monitoring sites (SH50) generally comply with the DRP guideline, with the notable
exception of the Tukipo River. The DRP concentration at this latter site is higher at low river flows,
which could indicate either the presence of a point-source contamination, or the contribution of
phosphorus-rich groundwater to the Tukipo River’s base flow.
The middle catchment tributaries have variable water quality. The Mangaonuku Stream has very low
DRP concentrations at all flows. The Porangahau Stream exceeds the guideline at all flows, with
concentrations comparable with those observed in the Tukituki at SH2. The Mangatarata Stream has by
far the highest DRP concentration of all sites monitored in the catchment. Unfortunately, flow data is not
available for this stream, which prevents any flow-related analysis. The reasons for the very high DRP in
the Mangatarata Stream are unknown and should be investigated.
4 The influence of point source discharges generally becomes more at low river flows, primarily due to the lower
dilution factors.
0
100
200
300
400
500
600
700
Tuki
tuki
at
SH5
0
Tuki
po
at
SH5
0
Mak
aret
u a
t SH
50
Wai
paw
a at
SH
50
Po
ran
gah
au S
trea
m
Man
gao
nu
ku a
t Ti
koki
no
Rd
Man
gata
rata
Str
eam
Tuki
tuki
at
Shag
rock
Tuki
tuki
at
Red
Bri
dge
Tuki
tuki
at
Bla
ck B
rid
ge
Me
an C
hlo
rop
hyl
l a(m
g/m
2 )
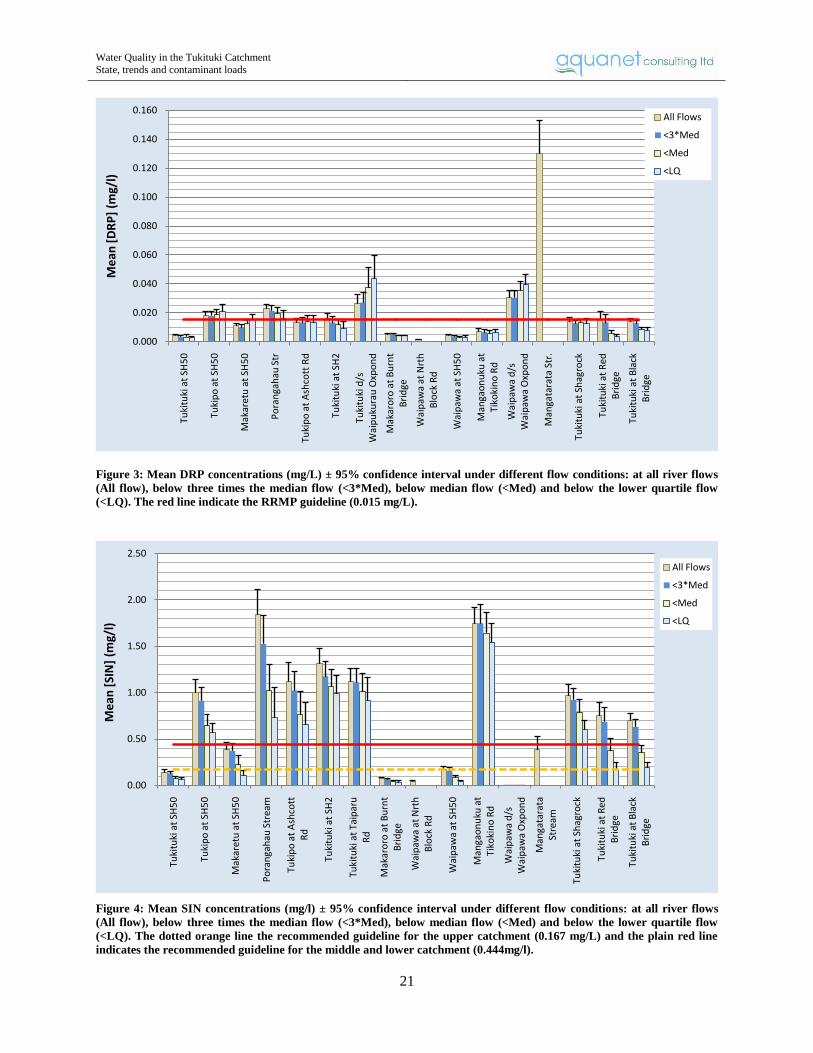
Water Quality in the Tukituki Catchment
State, trends and contaminant loads
21
Figure 3: Mean DRP concentrations (mg/L) ± 95% confidence interval under different flow conditions: at all river flows
(All flow), below three times the median flow (<3*Med), below median flow (<Med) and below the lower quartile flow
(<LQ). The red line indicate the RRMP guideline (0.015 mg/L).
Figure 4: Mean SIN concentrations (mg/l) ± 95% confidence interval under different flow conditions: at all river flows
(All flow), below three times the median flow (<3*Med), below median flow (<Med) and below the lower quartile flow
(<LQ). The dotted orange line the recommended guideline for the upper catchment (0.167 mg/L) and the plain red line
indicates the recommended guideline for the middle and lower catchment (0.444mg/l).
0.000
0.020
0.040
0.060
0.080
0.100
0.120
0.140
0.160
Tuki
tuki
at
SH5
0
Tuki
po
at
SH5
0
Mak
aret
u a
t SH
50
Po
ran
gah
au S
tr
Tuki
po
at
Ash
cott
Rd
Tuki
tuki
at
SH2
Tuki
tuki
d/s
W
aip
uku
rau
Oxp
on
d
Mak
aro
ro a
t B
urn
t B
rid
ge
Wai
paw
a at
Nrt
h
Blo
ck R
d
Wai
paw
a at
SH
50
Man
gao
nu
ku a
t Ti
koki
no
Rd
Wai
paw
a d
/s
Wai
paw
a O
xpo
nd
Man
gata
rata
Str
.
Tuki
tuki
at
Shag
rock
Tuki
tuki
at
Red
B
rid
ge
Tuki
tuki
at
Bla
ck
Bri
dge
Me
an [
DR
P]
(mg/
l)All Flows
<3*Med
<Med
<LQ
0.00
0.50
1.00
1.50
2.00
2.50
Tuki
tuki
at
SH5
0
Tuki
po
at
SH5
0
Mak
aret
u a
t SH
50
Po
ran
gah
au S
trea
m
Tuki
po
at
Ash
cott
R
d
Tuki
tuki
at
SH2
Tuki
tuki
at
Taip
aru
R
d
Mak
aro
ro a
t B
urn
t B
rid
ge
Wai
paw
a at
Nrt
h
Blo
ck R
d
Wai
paw
a at
SH
50
Man
gao
nu
ku a
t Ti
koki
no
Rd
Wai
paw
a d
/s
Wai
paw
a O
xpo
nd
Man
gata
rata
St
ream
Tuki
tuki
at
Shag
rock
Tuki
tuki
at
Red
B
rid
ge
Tuki
tuki
at
Bla
ck
Bri
dge
Me
an [
SIN
] (m
g/l)
All Flows
<3*Med
<Med
<LQ
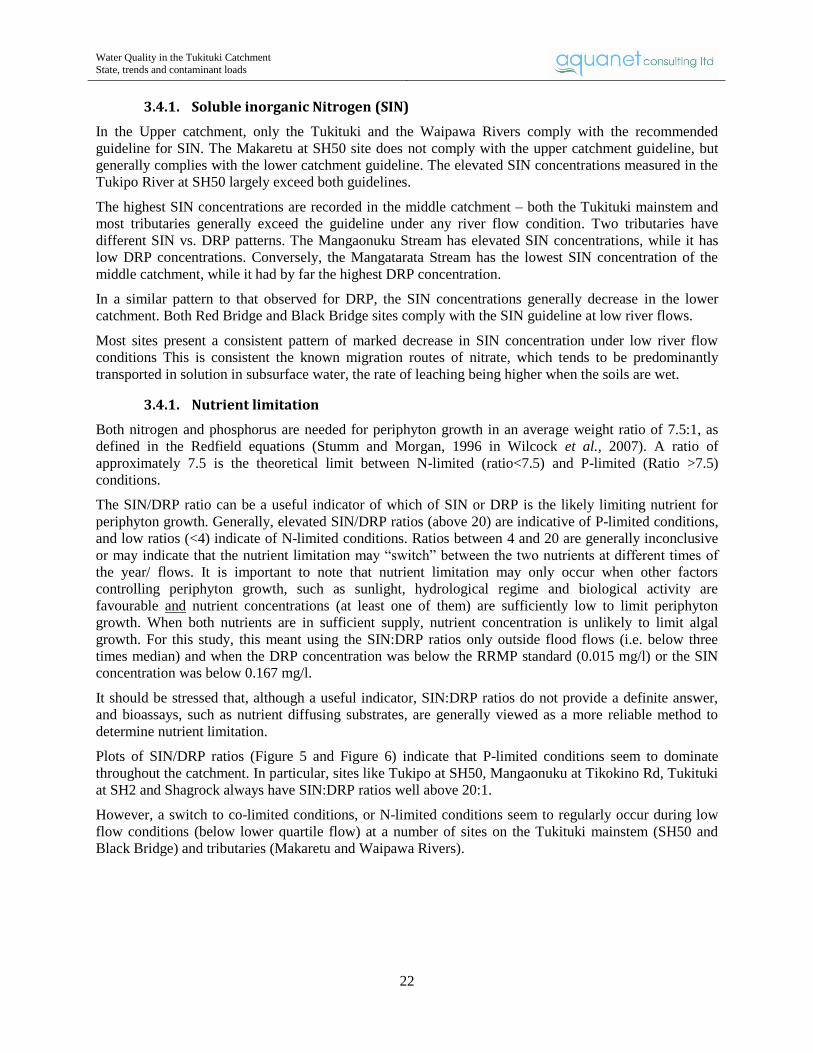
Water Quality in the Tukituki Catchment
State, trends and contaminant loads
22
3.4.1. Soluble inorganic Nitrogen (SIN)
In the Upper catchment, only the Tukituki and the Waipawa Rivers comply with the recommended
guideline for SIN. The Makaretu at SH50 site does not comply with the upper catchment guideline, but
generally complies with the lower catchment guideline. The elevated SIN concentrations measured in the
Tukipo River at SH50 largely exceed both guidelines.
The highest SIN concentrations are recorded in the middle catchment – both the Tukituki mainstem and
most tributaries generally exceed the guideline under any river flow condition. Two tributaries have
different SIN vs. DRP patterns. The Mangaonuku Stream has elevated SIN concentrations, while it has
low DRP concentrations. Conversely, the Mangatarata Stream has the lowest SIN concentration of the
middle catchment, while it had by far the highest DRP concentration.
In a similar pattern to that observed for DRP, the SIN concentrations generally decrease in the lower
catchment. Both Red Bridge and Black Bridge sites comply with the SIN guideline at low river flows.
Most sites present a consistent pattern of marked decrease in SIN concentration under low river flow
conditions This is consistent the known migration routes of nitrate, which tends to be predominantly
transported in solution in subsurface water, the rate of leaching being higher when the soils are wet.
3.4.1. Nutrient limitation
Both nitrogen and phosphorus are needed for periphyton growth in an average weight ratio of 7.5:1, as
defined in the Redfield equations (Stumm and Morgan, 1996 in Wilcock et al., 2007). A ratio of
approximately 7.5 is the theoretical limit between N-limited (ratio<7.5) and P-limited (Ratio >7.5)
conditions.
The SIN/DRP ratio can be a useful indicator of which of SIN or DRP is the likely limiting nutrient for
periphyton growth. Generally, elevated SIN/DRP ratios (above 20) are indicative of P-limited conditions,
and low ratios (<4) indicate of N-limited conditions. Ratios between 4 and 20 are generally inconclusive
or may indicate that the nutrient limitation may “switch” between the two nutrients at different times of
the year/ flows. It is important to note that nutrient limitation may only occur when other factors
controlling periphyton growth, such as sunlight, hydrological regime and biological activity are
favourable and nutrient concentrations (at least one of them) are sufficiently low to limit periphyton
growth. When both nutrients are in sufficient supply, nutrient concentration is unlikely to limit algal
growth. For this study, this meant using the SIN:DRP ratios only outside flood flows (i.e. below three
times median) and when the DRP concentration was below the RRMP standard (0.015 mg/l) or the SIN
concentration was below 0.167 mg/l.
It should be stressed that, although a useful indicator, SIN:DRP ratios do not provide a definite answer,
and bioassays, such as nutrient diffusing substrates, are generally viewed as a more reliable method to
determine nutrient limitation.
Plots of SIN/DRP ratios (Figure 5 and Figure 6) indicate that P-limited conditions seem to dominate
throughout the catchment. In particular, sites like Tukipo at SH50, Mangaonuku at Tikokino Rd, Tukituki
at SH2 and Shagrock always have SIN:DRP ratios well above 20:1.
However, a switch to co-limited conditions, or N-limited conditions seem to regularly occur during low
flow conditions (below lower quartile flow) at a number of sites on the Tukituki mainstem (SH50 and
Black Bridge) and tributaries (Makaretu and Waipawa Rivers).

Water Quality in the Tukituki Catchment
State, trends and contaminant loads
23
Figure 5: SIN:DRP ratio at monitoring sites in the upper Tukituki catchment. Data for river flows below 3* median flow
and when either or both SIN and DRP concentrations are below guideline level (0.015 mg/l for DRP and 0.167 mg/l for
SIN. The vertical blue line indicates the Lower quartile flow. Points above the top dashed horizontal red line are
indicative of P- limited conditions. Points below the bottom red dashed line are indicative of N-limited conditions.
0.1
1
10
100
1000
0 2000 4000 6000 8000 10000
SIN
/DR
P
River flow (l/s)
Tukituki at SH50
0.1
1
10
100
1000
10000
0 500 1000 1500 2000 2500 3000 3500 4000
SIN
/DR
P
River flow (l/s)
Makaretu at SH50
0.1
1
10
100
1000
10000
0 5000 10000 15000
SIN
/DR
P
River flow (l/s)
Waipawa at SH50
0.1
1
10
100
1000
10000
0 1000 2000 3000
SIN
/DR
P
River flow (l/s)
Tukipo at SH50
0.1
1
10
100
1000
10000
0 2000 4000 6000 8000
SIN
/DR
P
River flow (l/s)
Mangaonuku at Tikokino Rd
0.1
1
10
100
1000
10000
0 250 500 750
SIN
/DR
P
River flow (l/s)
Porangahau at Oruawhara Rd

Water Quality in the Tukituki Catchment
State, trends and contaminant loads
24
Figure 6: SIN:DRP ratio at monitoring sites in the middle and lower Tukituki catchment. Data for river flows below 3*
median flow and when either or both SIN and DRP concentrations are below guideline level (0.015 mg/l for DRP and
0.167 mg/l for SIN. The vertical blue line indicates the Lower quartile flow. Points above the top dashed horizontal red
line are indicative of P- limited conditions. Points below the bottom red dashed line are indicative of N-limited conditions.
0.1
1
10
100
1000
10000
0 5000 10000 15000 20000 25000
SIN
/DR
P
River flow (l/s)
Tukituki at SH2
0.1
1
10
100
1000
10000
0 10000 20000 30000 40000 50000 60000
SIN
/DR
P
River flow (l/s)
Tukituki at Shagrock
0.1
1
10
100
1000
10000
0 10000 20000 30000 40000 50000 60000
SIN
/DR
P
River flow (l/s)
Tukituki at Red Bridge
0.1
1
10
100
1000
10000
0 10000 20000 30000 40000 50000 60000 70000
SIN
/DR
P
River flow (l/s)
Tukituki at Black Bridge

Water Quality in the Tukituki Catchment
State, trends and contaminant loads
25
3.4.2. Microbiological water quality
Figure 7 presents a summary of the dataset obtained by correlating and merging the E.coli and faecal
coliforms results, as explained in section 2.2 of this report.
The microbiological water quality is generally good across the Tukituki catchment, in both the mainstem
and the tributaries. Most sites have a rate of compliance with the guideline (550 E.coli/100mL) in excess
of 90%. A few sites have lower compliance rates:
Two relatively small tributaries, the Porangahau and Mangatarata Streams (respectively 82 % and
84 % compliance); and
Two sites downstream of oxidation pond discharges: Tukituki at Tapairu Rd and Waipawa
downstream of Waipawa oxidation pond (respectively 82 % and 44% compliance).
Figure 7: Median E.coli concentrations (/100mL) ± 95% confidence interval under different flow conditions: at all river
flows (All flow), below three times the median flow (<3*Med), below median flow (<Med) and below the lower quartile
flow (<LQ). The dotted orange line represents the recommended guideline for the threshold between Green and Amber
modes (260 E.coli/100 mL); the solid red line represents the threshold between Amber and Red modes (260 E.coli/100 mL)
as defined in the MfE microbiological water quality guidelines (2002).
10
100
1000
Tuki
tuki
at
SH5
0
Tuki
po
at
SH5
0
Mak
aret
u a
t SH
50
Po
ran
gah
au S
trea
m
Tuki
po
at
Ash
cott
Rd
Tuki
tuki
at
SH2
Tuki
tuki
at
Taip
aru
R
d
Mak
aro
ro a
t B
urn
t B
rid
ge
Wai
paw
a at
Nrt
h
Blo
ck R
d
Wai
paw
a at
SH
50
Man
gao
nu
ku a
t Ti
koki
no
Rd
Wai
paw
a d
/s
Wai
paw
a O
xpo
nd
Man
gata
rata
Str
eam
Tuki
tuki
at
Shag
rock
Tuki
tuki
at
Red
B
rid
ge
Tuki
tuki
at
Bla
ck
Bri
dge
E. c
oli
(/1
00
mL)
All Flows
<3*Med
<Med
<LQ
Water Quality in the Tukituki Catchment
State, trends and contaminant loads
26
3.4.1. Water Clarity
Water clarity records indicate that all sites largely comply with the guideline for recreational waters
(1.6m), with the exception of the Mangatarata Stream (Figure 8).
Water clarity generally improves at lower river flows, and the average water clarity at all sites in the
upper catchment and most sites in the middle catchment complies with the 3.5m guideline for the
protection of trout fishery. The best average water clarity at low river flows is recorded in the
Mangaonuku Stream, followed by the Makaroro River at Burnt Bridge, the Waipawa River at SH50 and
the Tukituki River at SH50.
The Mangaonuku Stream is the only site where average water clarity at river flows below median
complies with the very stringent 5m clarity. It should be noted that the 5m guideline corresponds to an
idealised situation, and may not be realistic in the context of a catchment containing a large proportion of
tertiary soft sedimentary rocks – such as the Tukituiki catchment.
Figure 8: Mean water clarity (m) ± 95% confidence interval under different flow conditions: at all river flows (All flow),
below three times the median flow (<3*Med), below median flow (<Med) and below the lower quartile flow (<LQ).The
dotted yellow line represents the minimum clarity guideline for recreational waters (1.6m). The red lines represent the
recommended water clarity guidelines for the protection of the trout fishery value: 3.5m (solid red line) and 5 m (dotted
red line).
0.0
1.0
2.0
3.0
4.0
5.0
6.0
7.0
Tuki
tuki
at
SH5
0
Tuki
po
at
SH5
0
Mak
aret
u a
t SH
50
Po
ran
gah
au S
trea
m
Tuki
po
at
Ash
cott
R
d
Tuki
tuki
at
SH2
Tuki
tuki
at
Tap
airu
R
d
Mak
aro
ro a
t B
urn
t B
rid
ge
Wai
paw
a at
Nrt
h
Blo
ck R
d
Wai
paw
a at
SH
50
Man
gao
nu
ku a
t Ti
koki
no
Rd
Wai
paw
a d
/s
Wai
paw
a O
xpo
nd
Man
gata
rata
St
ream
Tuki
tuki
at
Shag
rock
Tuki
tuki
at
Red
B
rid
ge
Tuki
tuki
at
Bla
ck
Bri
dge
Me
an W
ate
r C
lari
ty (
m)
All Flows
<3*Med
<Med
<LQ
Water Quality in the Tukituki Catchment
State, trends and contaminant loads
27
3.4.2. Total Organic Carbon (TOC) and Dissolved oxygen
TOC provides an indication of the amount of organic matter in the water column. Whilst relatively low
levels are a normal, natural part of the ecosystem, elevated levels are a likely indicator of organic
enrichment, either as a result of direct input of organic input (e.g. from a discharge) or as a result of
accelerated primary production (e.g. algal growth).
In the upper catchment, the Tukipo River has the highest concentrations of TOC, around 3mg/L.
In the Tuktuki River main stem, the TOC concentrations generally increase between SH2 and Shagrock,
and increase again at Red Bridge.
The Porangahau Stream has elevated TOC concentrations compared to the rest of the catchment.
However, by far the highest TOC are to be found in the Mangatarata Stream – more than twice the
concentrations found at any other monitoring site in the catchment.
Compliance with the 80% DO saturation guideline is generally excellent across the catchment (above
90% compliance), except at two sites: the Mangatarata Stream (65% compliance) and the Mangaonuku
Stream (69% compliance). Further monitoring is recommended in these two streams, to investigate
whether daily minimum DO concentrations (to be measured at dawn) are low enough to cause detrimental
effects on aquatic life.
Figure 9: Mean total organic carbon (TOC) (mg/L) ± 95% confidence interval under different flow conditions: at all river
flows (All flow), below three times the median flow (<3*Med), below median flow (<Med) and below the lower quartile
flow (<LQ).
0.0
2.0
4.0
6.0
8.0
10.0
12.0
Tuki
tuki
at
SH5
0
Tuki
po
at
SH5
0
Mak
aret
u a
t SH
50
Po
ran
gah
au S
tr
Tuki
po
at
Ash
cott
R
d
Tuki
tuki
at
SH2
Tuki
tuki
at
Taip
aru
R
d
Wai
paw
a at
Nrt
h
Blo
ck R
d
Wai
paw
a at
SH
50
Man
gao
nu
ku a
t Ti
koki
no
Rd
Wai
paw
a d
/s
Wai
paw
a O
xpo
nd
Man
gata
rata
Str
.
Tuki
tuki
at
Shag
rock
Tuki
tuki
at
Red
B
rid
ge
Tuki
tuki
at
Bla
ck
Bri
dge
Me
an [
TOC
] (m
g/l)
All Flows
<3*Med
<Med
<LQ

Water Quality in the Tukituki Catchment
State, trends and contaminant loads
28
3.5. Comparison with national figures
A 2008 report prepared by NIWA for the ministry for the Environment to support the 2007 national state
of the environment report presents a national summary of regional council data. In particular, the report
provides national median values for some key water quality parameters, recorded at sites classified in 5
broad categories, based on the source of flow (upland/lowland) and the dominant land cover
(natural/pastoral), the fifth category being urban streams (NIWA 2008).
The results obtained in the Tukituki catchment were compared to national figures, to provide a national
perspective. Sites in the upper catchment were compared with national medians for upland rivers with a
dominant pastoral land cover, and sites in the middle and lower catchment were compared with
lowland/pastoral sites (NIWA 2008).
Across the whole catchment, water clarity was better than, or comparable with, the national medians.
Similarly, the bacteriological water quality was usually better than nationally, except in the Mangatarata
Stream.
In the upper catchment, nutrient concentrations in the Tukituki and Waipawa Rivers were comparable to
(SIN), or better than (DRP), national median for the upland pastoral category. Nutrient concentrations in
the Makaretu Stream are comparable with (DRP) or marginally above (SIN) national median. The Tukipo
River has higher nutrient (DRP and SIN) concentrations than the national median
In the middle catchment, the DRP concentrations in the Tukituki mainstem are consistent with the
national median, but the SIN concentrations are largely higher. In the Porangahau Stream, both SIN and
DRP were more elevated than the national average for upland rivers (NIWA 2008). As observed
previously, the Mangatarata Stream follows an unusual pattern, with very high DRP concentrations (8
times the national median), but very low SIN (1/3 of the national median).
Nutrient concentrations in the lower Tukituki River are marginally lower (DRP) or comparable with
(SIN) national figures.
Table 9: Comparison of water quality statistics for the Tukituki catchment sites with national figures (1997-2002). The
upper Tukituki catchment sites are compared with upland pastoral category and the middle and lower Tukituki
catchments are compared with lowland pastoral category in (NIWA 2008). Green shading indicates better water quality
than the national median, red shading indicate worse water quality than the national median.
Section of catchment
Site
DRP (mg/l, median)
SIN (mg/l, median)
E.coli (/100ml, 95th percentile)
Clarity (m, median)
National median
Tukituki Site
National median
Tukituki Site
National median
Tukituki Site
National median
Tukituki Site
Upper catchment
Tukituki at SH50
0.009
0.002
0.10
0.10
517
188
1.5
1.7
Tukipo at SH50 0.018 0.70 631 2.2
Makaretu at SH50 0.010 0.19 40 2.0
Waipawa at SH50 0.002 0.11 35 2.1
Middle catchment
Tukituki at SH2
0.014
0.011
0.55
1.16
1,542
513
1.2
2.5
Porangahau 0.020 1.58 1,700 2.6
Mangatarata 0.110 0.16 1,910 1.2
Tukituki at Shagrock 0.013 0.84 400 2.6
Lower catchment
Tukituki at Red Br 0.014
0.009 0.55
0.58 1,542
484 1.2
1.9
Tukituki at Black Br 0.010 0.56 1,506 1.9
Water Quality in the Tukituki Catchment
State, trends and contaminant loads
29
3.6. Conclusions
Most parameters indicate relatively good water quality in the Tukituki River, which is consistent with the
findings of the 2004 study (Stansfield, 2004). The microbiological water quality is generally good,
indicating a low health risk to river users from pathogens of faecal origin. The generally low ammonia
concentrations are unlikely to cause any acute or chronic toxic effects on the aquatic biota. The lower
water clarity in the upper Tukituki and Waipawa Rivers is likely caused by natural erosion processes.
Water clarity is generally good in the rest of the catchment, although there is a gradual degradation when
moving towards the lower Tukituki River reaches.
At the catchment scale, the main water quality issue for the Tukituki River appears to be the nutrient
enrichment and associated periphyton growth and degradation of the macroinvertebrate communities. The
middle catchment, including the main stem and tributaries between SH50 and Shagrock generally have
the highest nutrient concentrations. Nutrient concentrations generally decrease in the lower catchment,
although this is likely due to the consumption of the nutrients by the algal biomass, which often exceeds
acceptable levels. These results suggest that the middle catchment should be the priority for the analysis
conducted in this report, and for future monitoring and management.
Two monitoring sites indicate degraded water quality, either in absolute terms (Mangatarata Stream) or
relatively to similar sites (Tukipo at SH50).
Monitoring results for the Tukipo River at SH50 indicate that water quality is not as good as at other sites
in the upper catchment. Among the upper catchment sites, the Tukipo River has the highest SIN, DRP,
E.coli and TOC concentrations, as well as the highest mean periphyton biomass; all consistent with a
moderately enriched system.
The Mangatarata Stream highest mean DRP, TOC and lowest dissolved oxygen (DO) concentrations of
the whole Tukituki catchment. This degraded water quality is associated with the lowest MCI score in the
catchment. However, nitrogen species, (including nitrate and ammonia) are relatively low. Phosphorus-
rich rocks, such as limestone and mudstone, are well represented in the Mangatarata catchment, and could
be the source of moderately elevated DRP concentration in the stream, although not to the levels actually
measured. The very elevated DRP and TOC concentrations could suggest the influence of point source
discharges, although one would expect the ammonia to be also elevated in this case. A flow-related
analysis of the water quality data could have brought some clues as to the possible origin of the degraded
water quality; unfortunately flow data (direct or correlated) is not readily available for this tributary.
4. Effects of point source discharges
This section provides an analysis of the effects of the two largest point source discharges in the Tukituki
catchment:
- the discharge of treated domestic wastewater from the Waipukurau oxidation pond to the
Tukituki River, approximately 3.5 kilometres downstream of the SH2 Bridge;
- the discharge of treated domestic wastewater from the Waipawa oxidation pond to the Waipawa
River, approximately 4 kilometres upstream of its confluence with the Tukituki River.
The analysis presented in this section is based on the compliance data collected by the Central Hawke’s
Bay District Council as part of the conditions associated with the resource consents for these discharges.
The analysis was carried out at all river flows and at or below median flow, for consistency with the
RRMP (most RRMP guidelines apply only when the river is at or below median flow). There was
insufficient data to conduct a meaningful analysis at lower river flows (e.g. below lower quartile flow).
Water Quality in the Tukituki Catchment
State, trends and contaminant loads
30
4.1. Waipukurau oxidation pond
4.1.1. DRP
Based on compliance samples collected by Central Hawke’s Bay District Council, the Waipukurau
oxidation pond discharges an average of 9.1±0.8 kg DRP per day to the Tukituki River. There does not
appear to be any correlation between the flow in the Tukituki River and the quantity of DRP discharged
from the Waipukurau Oxidation pond5.
The average DRP concentration immediately upstream of the discharge is 0.037 ±0.009 mg/l, and 0.037
±0.008 downstream of the discharge. There is no statistically significant difference between upstream and
downstream of the discharge (Wilcoxon paired rank test). At river flows at or below median flow, the
average DRP concentration upstream of the discharge is 0.034 ±0.012, and 0.043 ±0.011 downstream of
the discharge. There is still no statistically significant difference between upstream and downstream of the
discharge (Wilcoxon paired rank test) (Figure 10).
It should be noted however, that the DRP concentrations measured at the upstream site appear unusually
high. The median DRP concentration at SH2, located only 3.5 km upstream of the Waipukurau oxidation
pond discharge was 0.011 mg/l for the period 1977 -2000. The reasons for the apparent DRP increase
between the two sites are unknown, and further investigations are recommended, including:
a paired monitoring programme, i.e. samples taken at the same time at both SH2 and the
“upstream of discharge” sites, for a set period of time (6-12 months), to clarify whether there is
any actual significant change in DRP concentration in the River;
a careful examination of the exact location where samples are taken,
an investigation of any potential significant source of DRP between the two sites.
The discharge of oxidation pond effluent from the Waipukurau wastewater treatment plant to the Tukituki
River is subject to a resource consent issued in 2007. The resource consent conditions impose an upgrade
of the treatment plant, and effluent quality limits after 2014. After this date, the DRP concentration in the
effluent will be limited to a median concentration of 0.25 mg/l and a 90th percentile of 0.5 mg/l. Based on
the median future concentration and the current average discharge volume, the average DRP load
discharged to the Tukituki River after 2014 should be approximately 0.6 kg/day.
4.1.2. Ammonia and SIN
The compliance monitoring programme undertaken by Central Hawke’s Bay District Council does not
include monitoring of SIN. It does include ammonia-nitrogen (NH4-N). SIN is the sum of ammonia,
nitrate and nitrite nitrogen. Generally, ammonia nitrogen represents more than 80% of the SIN in an
oxidation pond effluent, and can be used as a good indicator of the effect an oxidation pond discharge
may have on the SIN concentration in the river.
Based on compliance data, the Waipukurau oxidation pond discharges an average of 48 ± 5 kg NH4-N per
day to the Tukituki River.
The average NH4-N concentration immediately upstream of the discharge is 0.146 ± 0.082 mg/l, and
0.089 ±0.032 mg/l downstream of the discharge, both well below the ammonia guideline. There is no
statistically significant difference between upstream and downstream of the discharge (Wilcoxon paired
rank test) (Figure 11)
5 This can be observed in situations where there is high stormwater/groundwater infiltration into the sewerage
network, causing higher input volumes to the oxidation pond, causing in turn higher discharge volumes and higher
contaminant loads in the discharge at times of high river flow.
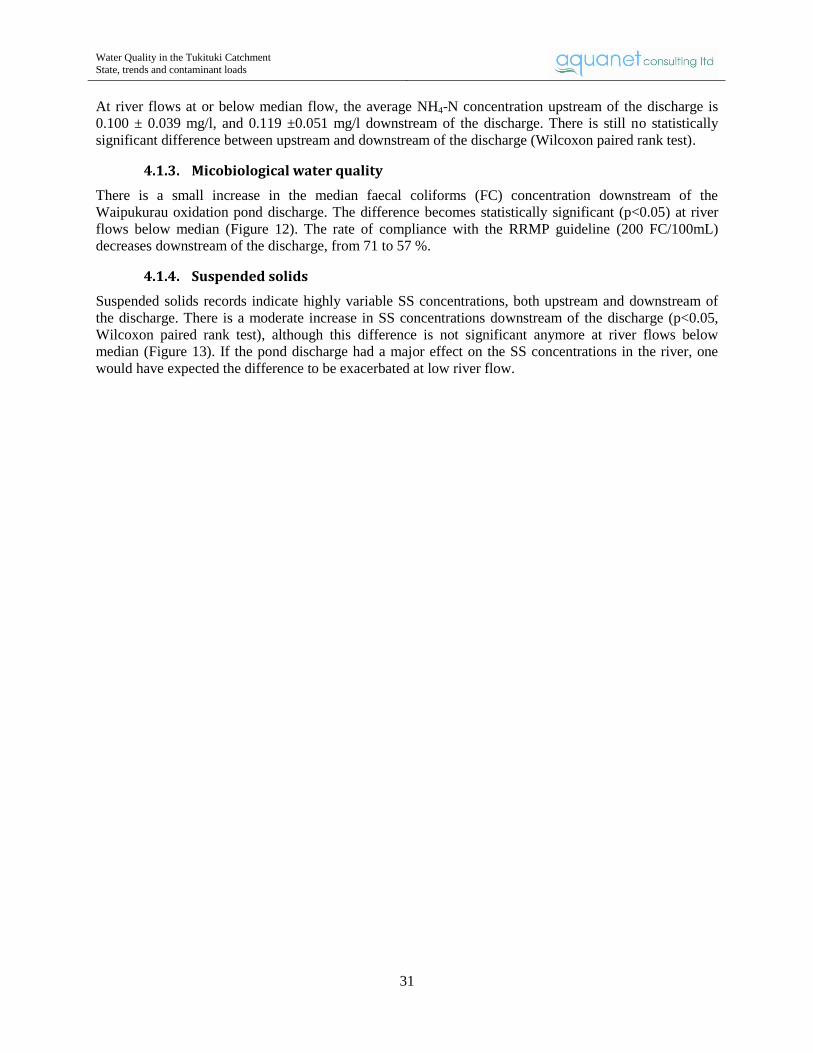
Water Quality in the Tukituki Catchment
State, trends and contaminant loads
31
At river flows at or below median flow, the average NH4-N concentration upstream of the discharge is
0.100 ± 0.039 mg/l, and 0.119 ±0.051 mg/l downstream of the discharge. There is still no statistically
significant difference between upstream and downstream of the discharge (Wilcoxon paired rank test).
4.1.3. Micobiological water quality
There is a small increase in the median faecal coliforms (FC) concentration downstream of the
Waipukurau oxidation pond discharge. The difference becomes statistically significant (p<0.05) at river
flows below median (Figure 12). The rate of compliance with the RRMP guideline (200 FC/100mL)
decreases downstream of the discharge, from 71 to 57 %.
4.1.4. Suspended solids
Suspended solids records indicate highly variable SS concentrations, both upstream and downstream of
the discharge. There is a moderate increase in SS concentrations downstream of the discharge (p<0.05,
Wilcoxon paired rank test), although this difference is not significant anymore at river flows below
median (Figure 13). If the pond discharge had a major effect on the SS concentrations in the river, one
would have expected the difference to be exacerbated at low river flow.
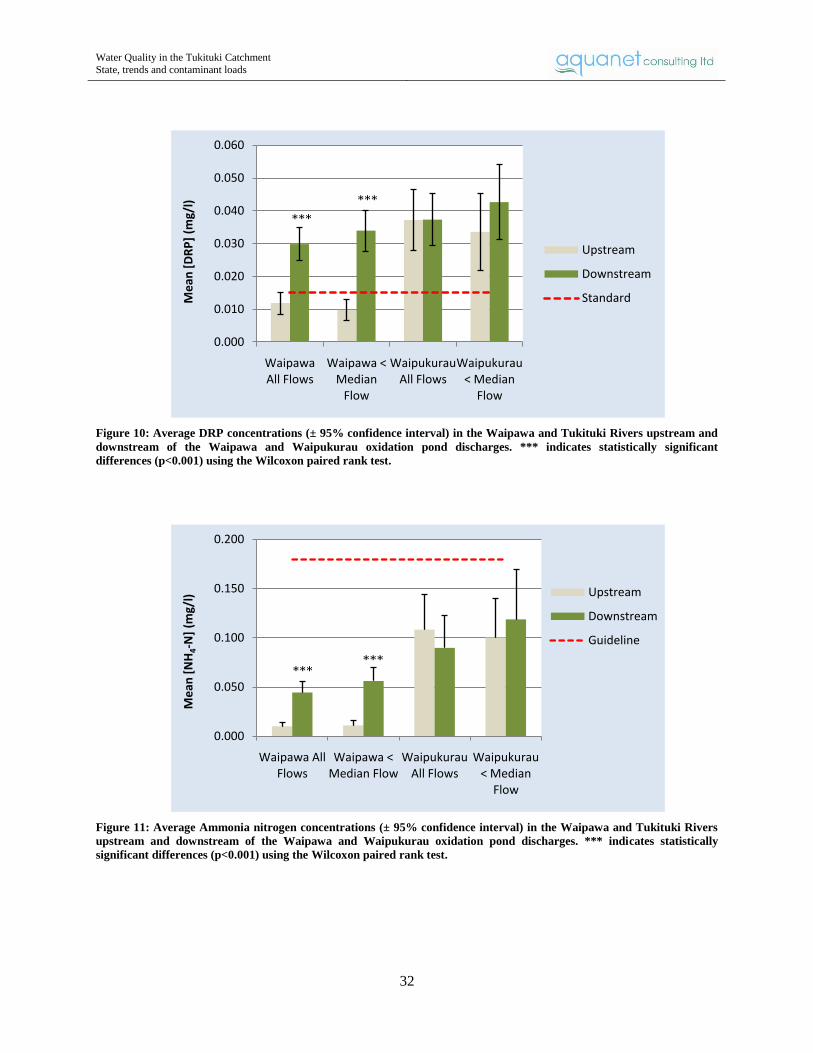
Water Quality in the Tukituki Catchment
State, trends and contaminant loads
32
Figure 10: Average DRP concentrations (± 95% confidence interval) in the Waipawa and Tukituki Rivers upstream and
downstream of the Waipawa and Waipukurau oxidation pond discharges. *** indicates statistically significant
differences (p<0.001) using the Wilcoxon paired rank test.
Figure 11: Average Ammonia nitrogen concentrations (± 95% confidence interval) in the Waipawa and Tukituki Rivers
upstream and downstream of the Waipawa and Waipukurau oxidation pond discharges. *** indicates statistically
significant differences (p<0.001) using the Wilcoxon paired rank test.
0.000
0.010
0.020
0.030
0.040
0.050
0.060
Waipawa All Flows
Waipawa < Median
Flow
Waipukurau All Flows
Waipukurau < Median
Flow
Me
an [
DR
P]
(mg/
l)
Upstream
Downstream
Standard
0.000
0.050
0.100
0.150
0.200
Waipawa All Flows
Waipawa < Median Flow
Waipukurau All Flows
Waipukurau < Median
Flow
Me
an [
NH
4-N
] (m
g/l) Upstream
Downstream
Guideline

Water Quality in the Tukituki Catchment
State, trends and contaminant loads
33
4.2. Waipawa oxidation pond
4.2.1. DRP
Based on compliance samples collected by Central Hawke’s Bay District Council, the Waipawa oxidation
pond discharges an average of 6.7 ± 0.9 kg DRP per day to the Waipawa River. As per the Waipukurau
Oxidation pond, there appears to be no correlation between the flow in the Waipawa River and the
quantity of DRP discharged from the oxidation pond.
The average DRP concentration in the Waipawa River immediately upstream of the discharge is 0.012
±0.003 mg/l (below the RRMP guideline), and 0.030 ±0.005 (twice the guideline) downstream of the
discharge. A Wilcoxon paired rank test indicates a statistically significant difference between upstream
and downstream of the discharge (p<0.001).
At river flows at or below median flow, the average DRP concentration upstream of the discharge is
0.010 ± 0.003, and 0.034± 0.006 downstream of the discharge. Again, a Wilcoxon paired rank test
indicates a statistically significant difference between upstream and downstream of the discharge
(p<0.001) (Figure 10).
4.2.2. Ammonia
Based on compliance data, the Waipawa oxidation pond discharges an average of 19 ±2.3 kg NH4-N per
day to the Waipawa River.
The average NH4-N concentration immediately upstream of the discharge is 0.010 ±0.003 mg/l, and 0.043
±0.011 mg/l downstream of the discharge. Although there is a statistically significant difference between
upstream and downstream of the discharge (p<0.001 Wilcoxon paired rank test), both upstream and
downstream concentrations are well below the guideline value (Figure 11).
At river flows at or below median flow, the average NH4-N concentration upstream of the discharge is
0.011 ± 0.005 mg/l, and 0.056 ±0.014 mg/l downstream of the discharge. Again, a Wilcoxon paired rank
test indicates a statistically significant difference between upstream and downstream of the discharge
(p<0.001).
4.2.3. Microbiological water quality
The median faecal coliforms (FC) concentrations significantly increases (p<0.001), Wilcoxon paired rank
test) downstream of the Waipawa oxidation pond discharge (Figure 12).
The rate of compliance with the RRMP guideline (200 FC/100mL) when the flow in the River is below
median) is lower downstream (45%) than upstream (76%) of the discharge.
4.2.4. Suspended solids
Similarly to the Waipukurau oxidation pond discharge, the data relating to Waipawa oxidation pond
discharge indicate highly variable suspended solids (SS) concentrations, both upstream and downstream
of the discharge. There is a moderate increase in SS concentrations downstream of the discharge (p<0.05,
Wilcoxon paired rank test), although this difference is not significant anymore at river flows below
median (Figure 13). If the pond discharge had a major effect on the SS concentrations in the river, one
would have expected the difference to be exacerbated at low river flow.
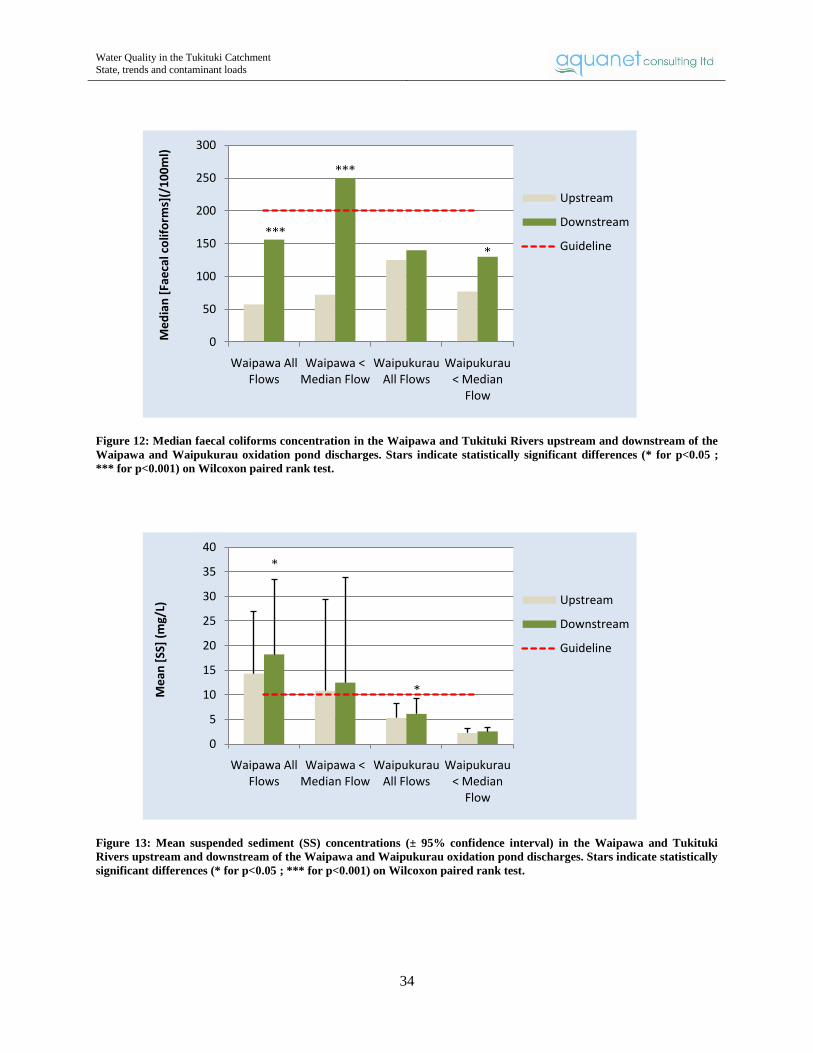
Water Quality in the Tukituki Catchment
State, trends and contaminant loads
34
Figure 12: Median faecal coliforms concentration in the Waipawa and Tukituki Rivers upstream and downstream of the
Waipawa and Waipukurau oxidation pond discharges. Stars indicate statistically significant differences (* for p<0.05 ;
*** for p<0.001) on Wilcoxon paired rank test.
Figure 13: Mean suspended sediment (SS) concentrations (± 95% confidence interval) in the Waipawa and Tukituki
Rivers upstream and downstream of the Waipawa and Waipukurau oxidation pond discharges. Stars indicate statistically
significant differences (* for p<0.05 ; *** for p<0.001) on Wilcoxon paired rank test.
0
50
100
150
200
250
300
Waipawa All Flows
Waipawa < Median Flow
Waipukurau All Flows
Waipukurau < Median
Flow
Me
dia
n [
Fae
cal c
olif
orm
s](/
10
0m
l)
Upstream
Downstream
Guideline
0
5
10
15
20
25
30
35
40
Waipawa All Flows
Waipawa < Median Flow
Waipukurau All Flows
Waipukurau < Median
Flow
Me
an [
SS]
(mg/
L)
Upstream
Downstream
Guideline
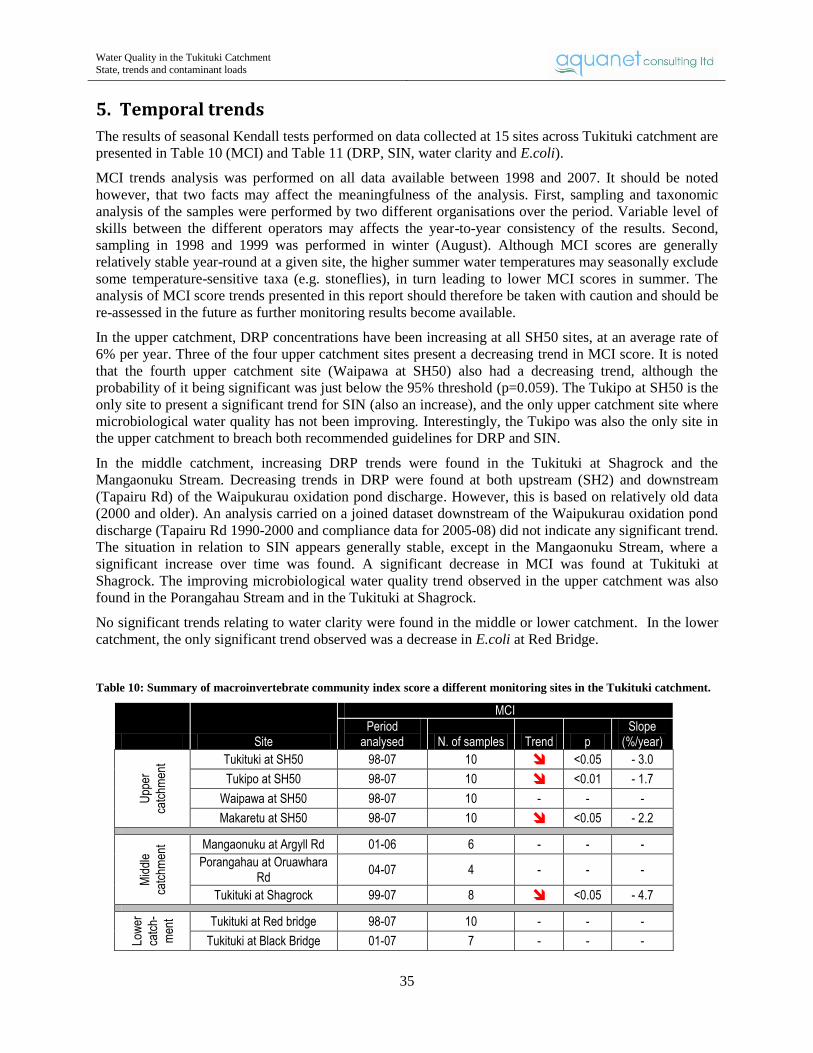
Water Quality in the Tukituki Catchment
State, trends and contaminant loads
35
5. Temporal trends
The results of seasonal Kendall tests performed on data collected at 15 sites across Tukituki catchment are
presented in Table 10 (MCI) and Table 11 (DRP, SIN, water clarity and E.coli).
MCI trends analysis was performed on all data available between 1998 and 2007. It should be noted
however, that two facts may affect the meaningfulness of the analysis. First, sampling and taxonomic
analysis of the samples were performed by two different organisations over the period. Variable level of
skills between the different operators may affects the year-to-year consistency of the results. Second,
sampling in 1998 and 1999 was performed in winter (August). Although MCI scores are generally
relatively stable year-round at a given site, the higher summer water temperatures may seasonally exclude
some temperature-sensitive taxa (e.g. stoneflies), in turn leading to lower MCI scores in summer. The
analysis of MCI score trends presented in this report should therefore be taken with caution and should be
re-assessed in the future as further monitoring results become available.
In the upper catchment, DRP concentrations have been increasing at all SH50 sites, at an average rate of
6% per year. Three of the four upper catchment sites present a decreasing trend in MCI score. It is noted
that the fourth upper catchment site (Waipawa at SH50) also had a decreasing trend, although the
probability of it being significant was just below the 95% threshold (p=0.059). The Tukipo at SH50 is the
only site to present a significant trend for SIN (also an increase), and the only upper catchment site where
microbiological water quality has not been improving. Interestingly, the Tukipo was also the only site in
the upper catchment to breach both recommended guidelines for DRP and SIN.
In the middle catchment, increasing DRP trends were found in the Tukituki at Shagrock and the
Mangaonuku Stream. Decreasing trends in DRP were found at both upstream (SH2) and downstream
(Tapairu Rd) of the Waipukurau oxidation pond discharge. However, this is based on relatively old data
(2000 and older). An analysis carried on a joined dataset downstream of the Waipukurau oxidation pond
discharge (Tapairu Rd 1990-2000 and compliance data for 2005-08) did not indicate any significant trend.
The situation in relation to SIN appears generally stable, except in the Mangaonuku Stream, where a
significant increase over time was found. A significant decrease in MCI was found at Tukituki at
Shagrock. The improving microbiological water quality trend observed in the upper catchment was also
found in the Porangahau Stream and in the Tukituki at Shagrock.
No significant trends relating to water clarity were found in the middle or lower catchment. In the lower
catchment, the only significant trend observed was a decrease in E.coli at Red Bridge.
Table 10: Summary of macroinvertebrate community index score a different monitoring sites in the Tukituki catchment.
Site
MCI
Period analysed N. of samples Trend p
Slope (%/year)
Upp
er
catc
hmen
t Tukituki at SH50 98-07 10 <0.05 - 3.0
Tukipo at SH50 98-07 10 <0.01 - 1.7
Waipawa at SH50 98-07 10 - - -
Makaretu at SH50 98-07 10 <0.05 - 2.2
Mid
dle
catc
hmen
t Mangaonuku at Argyll Rd 01-06 6 - - -
Porangahau at Oruawhara Rd
04-07 4 - - -
Tukituki at Shagrock 99-07 8 <0.05 - 4.7
Low
er
catc
h-
men
t Tukituki at Red bridge 98-07 10 - - -
Tukituki at Black Bridge 01-07 7 - - -

Water Quality in the Tukituki Catchment
State, trends and contaminant loads
36
Table 11: Summary of temporal trends at different monitoring sites in the Tukituki catchment. Seasonal Kendall Test, Flow adjusted data, covariate adjustment method
is LOWESS. NS: Not significant; N.D.; no data.
Site
DRP SIN Water Clarity E.coli
Period analysed
Trend p Slope
(%/year) Period
analysed Trend P
Slope (%/year)
Period analysed
Trend p Slope
(%/year) Period
analysed Trend p
Slope (%/year)
Upp
er c
atch
men
t Tukituki at SH50 94-08 <0.001 + 6.3 94-08 - NS - 95-08 - NS - 97-08 <0.01 - 12
Tukipo at SH50 94-08 <0.001 + 6.3 94-08 <0.001 + 5.6 95-08 - NS - 95-08 - NS -
Waipawa at SH50
93-08 <0.005 + 6.2 93-08 - NS - 93-08 - NS - 93-08 <0.05 - 10
Makaretu at SH50
94-08 <0.001 + 6.0 94-08 - NS - 94-08 <0.05 - 2.7 97-08 <0.005 - 11
Mid
dle
catc
hmen
t
Mangaonuku at Argyll Rd
00-05 - NS - 00-05 - NS - 00-05 - NS - 00-05 - NS -
Mangaonuku at Tikokino Rd
93-08 <0.05 + 9.6 93-08 <0.05 + 2.8 94-08 - NS - 94-08 - <0.005 NS
Tukituki at SH2 87-00 <0.001 - 15 87-00 - NS - 94-00 - NS - 94-00 - NS -
Tukituki D/S Waipuk. Oxpond
90-00 <0.001 -15.7 90-00 - NS - 90-08 - NS - 99-08 - NS -
Waipawa U/S Waipawa oxpond
05-08 - NS - N.D. - - - N.D. - - - N.D. - - -
Waipawa D/S Waipawa oxpond
05-08 - NS - N.D. - - - N.D. - - - N.D. - - -
Porangahau at Oruawhara Rd
87-08 - NS - 87-08 - NS - 87-08 - NS - 97-08 0.065 - 16
Mangatarata at Mangatarat Rd
98-07 - NS - 98-07 - NS - 98-06 - NS - 98-07 - NS -
Tukituki at Shagrock
94-08 <0.001 + 3.2 94-08 - NS - 94-08 - NS - 99-08 0.065 - 19
Low
er c
atch
t
Tukituki at Red bridge
97-08 - NS - 94-08 - NS - 97-08 - NS - 97-08 <0.05 - 13
Tukituki at Black Bridge
77-08 - NS - 79-08 - NS - 94-08 - NS - 90-08 - NS -

Water Quality in the Tukituki Catchment
State, trends and contaminant loads
37
6. Contaminant loads analysis
This section of the report presents the results of an analysis of the contaminant loads in the Tukituki
catchment. As identified in previous sections of this report, the key water quality issue in the Tukituki
catchment appears to be nutrient enrichment. Therefore, this section concentrates on dissolved reactive
phosphorus and soluble inorganic nitrogen.
The analysis presented in this section is three-fold.
Section 6.1 below presents the results of annual load estimates carried out at a number of sites in the
catchment. At equal contaminant concentrations, the higher the flow in the river, the higher the
contaminant load. Thus, the annual contaminant loads are very dependant upon each year’s hydrological
regime - a wet year will generally have a higher contaminant load than a dry year. Comparisons between
sites should therefore always be carried out within one given year.
Section 6.2 presents an analysis of the relative contribution of each tributary or part of the catchment to
the contaminant loads entering the River upstream of Shagrock (upper and middle catchment).
Section 6.3 presents an estimate of catchment yields, i.e. a sub-catchment by sub-catchment analysis of
the quantity of nutrient in the rivers coming from non-point sources per unit of surface area.
6.1. Annual Loads
The annual loads of DRP and SIN were calculated at 9 sites in the Tukituki catchment for the years 2004-
2005 to 2007-2008, following the methodologies described in section 2.5 of this report. The results are
presented in Appendix E.
Over the four years covered by the calculations, 2004-2005 and 2005-2006 were wet relative to 2006-
2007 and 2007-2008, which had long, dry summers (Table 12).
Table 12: Annual average daily flow t Tukituki at Shagrock for the 2004-2008 period.
2004-05 2005-06 2006-07 2007-08
Annual average daily flow at Tukituki at Shagrock (L/s) 54,059 56,592 30,753 34,616
6.1.1. Dissolved reactive phosphorus (DRP)
Overall, the two calculation methods used to estimate annual DRP loads provided very similar results,
except for years with incomplete datasets.
In the upper catchment (above SH50), the Waipawa River at SH50 has the highest annual DRP loads (1.2
to 3.2 T/Y), followed by the Tukipo at SH50 (0.8 – 1.9 T/Y), the Tukituki at SH50 (0.6 – 1.4 T/Y) and the
Makaretu at SH50 (0.7 to 1 T/Y).
The annual DRP load in the Tukituki River at Shagrock varies between 30 and 60 Tonnes per year over
the four years covered by the calculations. Similar numbers are obtained for the two lower catchment sites
(Red Bridge and Black Bridge). The combined upper catchment (above SH50) DRP loads represent
between 5 and 20% of the annual load estimated at Shagrock (Figure 14).
DRP loads in the lower catchment appear to be generally similar to those observed at Shagrock,
suggesting that DRP inputs to the lower catchment are either:
negligible by comparison with loads at Shagrock, or
compensated by the “outputs” (e.g. consumption by the algal biomass, absorption).
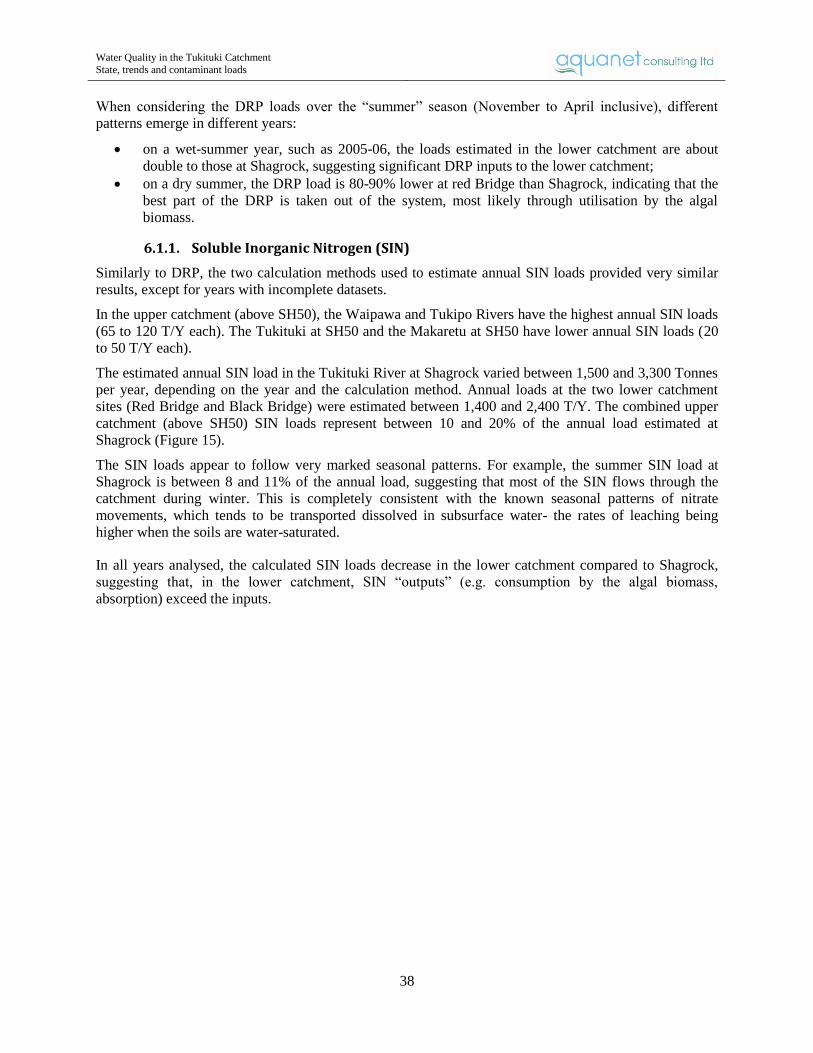
Water Quality in the Tukituki Catchment
State, trends and contaminant loads
38
When considering the DRP loads over the “summer” season (November to April inclusive), different
patterns emerge in different years:
on a wet-summer year, such as 2005-06, the loads estimated in the lower catchment are about
double to those at Shagrock, suggesting significant DRP inputs to the lower catchment;
on a dry summer, the DRP load is 80-90% lower at red Bridge than Shagrock, indicating that the
best part of the DRP is taken out of the system, most likely through utilisation by the algal
biomass.
6.1.1. Soluble Inorganic Nitrogen (SIN)
Similarly to DRP, the two calculation methods used to estimate annual SIN loads provided very similar
results, except for years with incomplete datasets.
In the upper catchment (above SH50), the Waipawa and Tukipo Rivers have the highest annual SIN loads
(65 to 120 T/Y each). The Tukituki at SH50 and the Makaretu at SH50 have lower annual SIN loads (20
to 50 T/Y each).
The estimated annual SIN load in the Tukituki River at Shagrock varied between 1,500 and 3,300 Tonnes
per year, depending on the year and the calculation method. Annual loads at the two lower catchment
sites (Red Bridge and Black Bridge) were estimated between 1,400 and 2,400 T/Y. The combined upper
catchment (above SH50) SIN loads represent between 10 and 20% of the annual load estimated at
Shagrock (Figure 15).
The SIN loads appear to follow very marked seasonal patterns. For example, the summer SIN load at
Shagrock is between 8 and 11% of the annual load, suggesting that most of the SIN flows through the
catchment during winter. This is completely consistent with the known seasonal patterns of nitrate
movements, which tends to be transported dissolved in subsurface water- the rates of leaching being
higher when the soils are water-saturated.
In all years analysed, the calculated SIN loads decrease in the lower catchment compared to Shagrock,
suggesting that, in the lower catchment, SIN “outputs” (e.g. consumption by the algal biomass,
absorption) exceed the inputs.

Water Quality in the Tukituki Catchment
State, trends and contaminant loads
39
Figure 14: Annual and summer (November-April inclusive) DRP loads (Tonnes) in the Tukituki catchment, calculated
with the “averaging” approach. Above SH50 refers to the sum of the loads calculated at the SH50 monitoring sites
(Tukituki, Waipawa, Makaretu and Tukipo Rivers).
Figure 15: Annual and summer (November-April inclusive) SIN loads (Tonnes) in the Tukituki catchment, calculated
with the “averaging” approach. Above SH50 refers to the sum of the loads calculated at the SH50 monitoring sites
(Tukituki, Waipawa, Makaretu and Tukipo Rivers).
0
10
20
30
40
50
60
Above SH50 Shagrock Red Bridge Black Bridge
DR
P L
oad
(to
nn
es)
05-06 year -round
05-06 summer
06-07 year round
06-07 summer
0
500
1000
1500
2000
2500
3000
3500
Above SH50 Shagrock Red Bridge Black Bridge
SIN
Lo
ad (
ton
ne
s)
05-06 year -round
05-06 summer
06-07 year round
06-07 summer

Water Quality in the Tukituki Catchment
State, trends and contaminant loads
40
6.2. Load contributions
As concluded in previous sections, the middle catchment (above Shagrock) appears to be the part of the
catchment where nutrient concentrations and loads increase rapidly. This section provides a scenario-
based estimate of the relative contribution from the different tributaries/subcatchments to the nutrient
loads at Shagrock.
6.2.1. Methodology
River sites: The approach taken was to estimate the DRP and SIN daily load at different points in the
middle and upper catchment under different river flow conditions: median flow, lower quartile flow and
mean annual low flow (MALF). The nutrient concentrations at the different monitoring sites under each
river flow condition were estimated from the actual dataset, as the average concentration recorded when
the flow is at or close to the flow in each scenario. For example, the DRP concentration at Tukituki at
SH50 at median flow was calculated as the average of the concentrations recorded at this site when the
flow in the River was between the 45th and the 55
th percentile of the flow distribution curve (refer to
Appendix F for details).
In Figure 16 to Figure 20, the sub-catchments are labelled as follows:
“Catchment upstream of SH50” is the sum of the inputs calculated at all four SH50 sites;
“Tukituki between SH2 and SH50” represent the inputs to the Tukituki catchment between SH50
and SH2, excluding the Tukipo catchment (SH2 – SH50 - Tukipo at Ashcott Rd);
“Tukipo d/s SH50” is the load inputs to the Tukipo catchment downstream of SH50 (Ashcott Rd
– (Tukipo SH50 + Makaretu SH50). It does includes inputs from the Porangahau Stream;
“Waipawa d/s SH50” ” is the load inputs to the Waipawa catchment downstream of SH50 (RDS-
SH50). It includes inputs from the Mangaonuku catchment, but excludes the Waipawa oxidation
pond discharge);
“Mangatarata” represents the calculated inputs from the Mangatarata Stream catchment.
Oxidation pond discharges: No correlations between the DRP or SIN loads and river flow were found.
The nutrient loads from the oxidation ponds were considered constant, and estimated as the average of the
daily loads provided by the compliance records (refer to Section 4 of this report). The daily SIN loads
from the oxidation pond discharges were taken as the average daily ammonia-N loads.
6.2.2. DRP
Current Situation: As expected, the total daily DRP inputs to the middle catchment decrease with the
river flow (Figure 16), primarily due to a diminution in the inputs from the different sub-catchments. The
catchment above SH50 (the sum of the Tukituki, Waipawa, Makaretu and Tukipo above SH50) contribute
just under 10% of the total at all flows. The part of the Tukituki catchment between SH50 and SH2 makes
a significant contribution (25%) at median flow, but it decreases greatly at low flows (3% at MALF). The
Waipawa catchment (excluding the oxidation pond discharge) between SH50 and the confluence
contribute between 7 and 14 % of the total at all flows (Figure 17).
The contribution of the oxidation pond discharges represents about 20% of the inputs at median flow, and
increases at low flow, to nearly 70% when the river is at mean annual low flow.
Predicted situation after the oxidation pond upgrades (2014): After the 2014 upgrade, imposed through
consent conditions, the oxidation pond discharges are expected to make a much smaller contribution than
currently: 11% of the total at MALF and 3% at median flow.
The Waipawa catchment below SH50 will then be the biggest contributor, with its relative contribution
increasing at low river flows. The Mangatarata Stream and upper catchment (above SH50) are the next
biggest contributors at low flow.
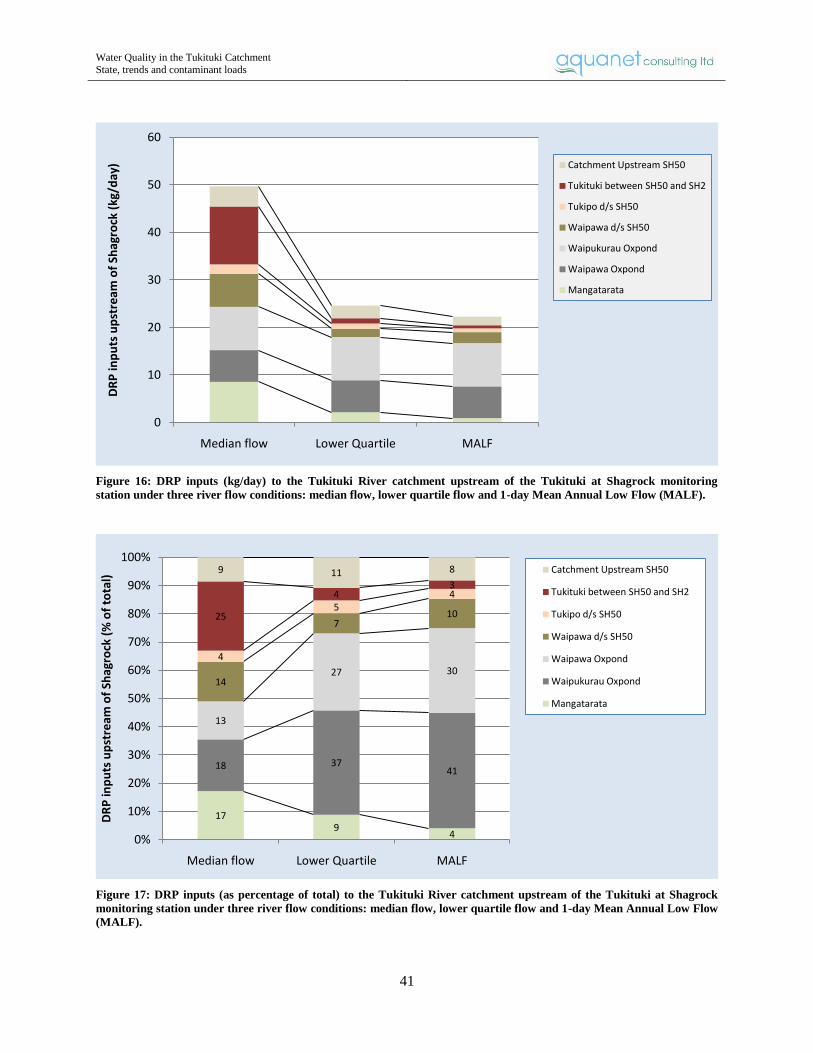
Water Quality in the Tukituki Catchment
State, trends and contaminant loads
41
Figure 16: DRP inputs (kg/day) to the Tukituki River catchment upstream of the Tukituki at Shagrock monitoring
station under three river flow conditions: median flow, lower quartile flow and 1-day Mean Annual Low Flow (MALF).
Figure 17: DRP inputs (as percentage of total) to the Tukituki River catchment upstream of the Tukituki at Shagrock
monitoring station under three river flow conditions: median flow, lower quartile flow and 1-day Mean Annual Low Flow
(MALF).
0
10
20
30
40
50
60
Median flow Lower Quartile MALF
DR
P in
pu
ts u
pst
ream
of
Shag
rock
(kg
/day
) Catchment Upstream SH50
Tukituki between SH50 and SH2
Tukipo d/s SH50
Waipawa d/s SH50
Waipukurau Oxpond
Waipawa Oxpond
Mangatarata
179
4
18 3741
13
27 3014
710
4
54
25
43
9 11 8
0%
10%
20%
30%
40%
50%
60%
70%
80%
90%
100%
Median flow Lower Quartile MALF
DR
P in
pu
ts u
pst
ream
of
Shag
rock
(%
of
tota
l)
Catchment Upstream SH50
Tukituki between SH50 and SH2
Tukipo d/s SH50
Waipawa d/s SH50
Waipawa Oxpond
Waipukurau Oxpond
Mangatarata
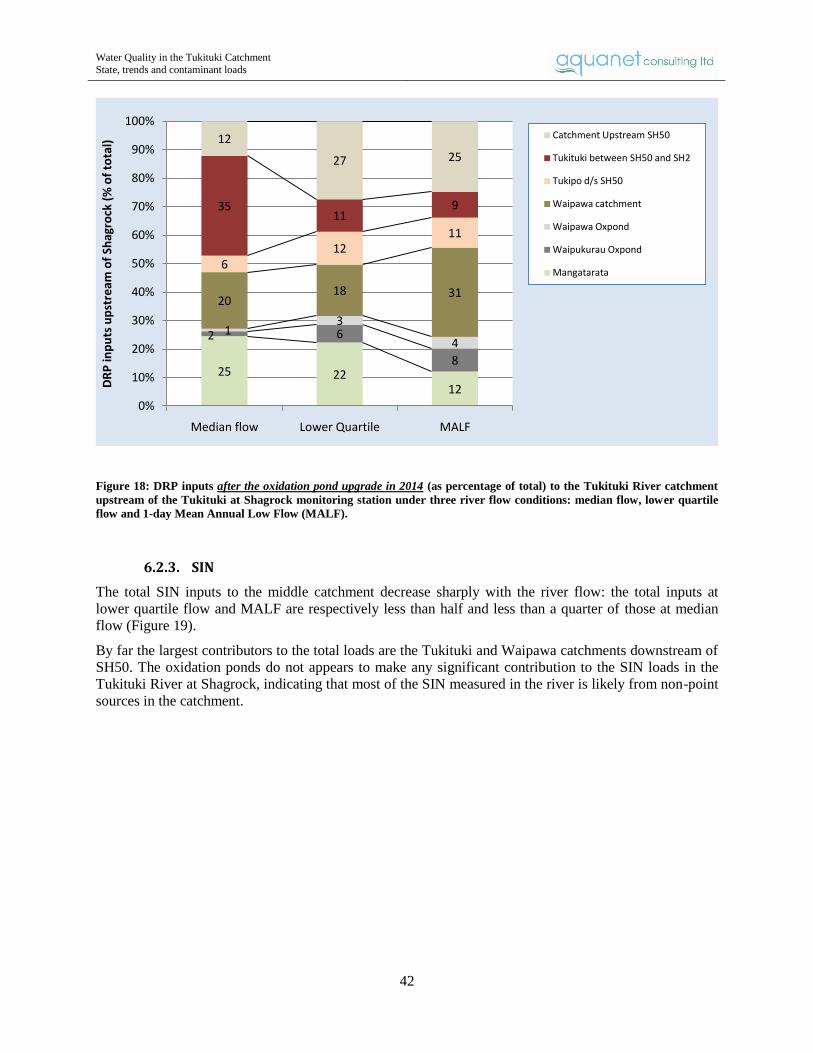
Water Quality in the Tukituki Catchment
State, trends and contaminant loads
42
Figure 18: DRP inputs after the oxidation pond upgrade in 2014 (as percentage of total) to the Tukituki River catchment
upstream of the Tukituki at Shagrock monitoring station under three river flow conditions: median flow, lower quartile
flow and 1-day Mean Annual Low Flow (MALF).
6.2.3. SIN
The total SIN inputs to the middle catchment decrease sharply with the river flow: the total inputs at
lower quartile flow and MALF are respectively less than half and less than a quarter of those at median
flow (Figure 19).
By far the largest contributors to the total loads are the Tukituki and Waipawa catchments downstream of
SH50. The oxidation ponds do not appears to make any significant contribution to the SIN loads in the
Tukituki River at Shagrock, indicating that most of the SIN measured in the river is likely from non-point
sources in the catchment.
25 2212
2 6
8
13
4
2018 31
612
11
3511
9
12
27 25
0%
10%
20%
30%
40%
50%
60%
70%
80%
90%
100%
Median flow Lower Quartile MALF
DR
P in
pu
ts u
pst
ream
of
Shag
rock
(%
of
tota
l)
Catchment Upstream SH50
Tukituki between SH50 and SH2
Tukipo d/s SH50
Waipawa catchment
Waipawa Oxpond
Waipukurau Oxpond
Mangatarata
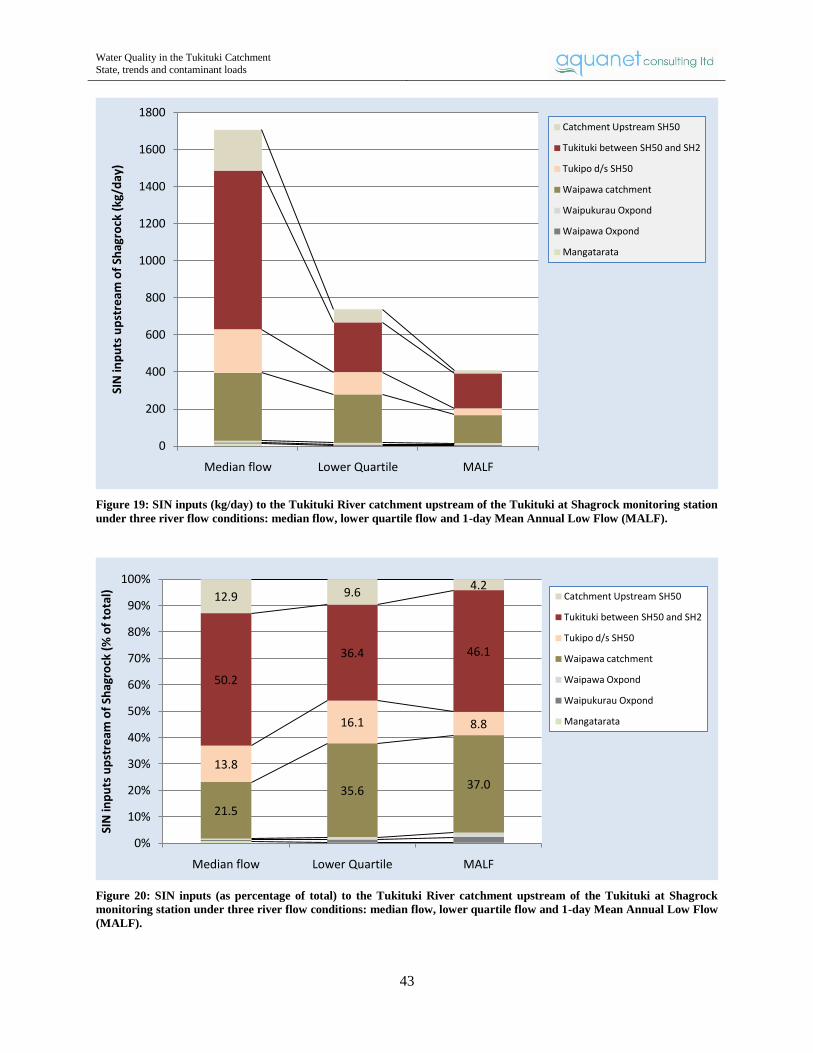
Water Quality in the Tukituki Catchment
State, trends and contaminant loads
43
Figure 19: SIN inputs (kg/day) to the Tukituki River catchment upstream of the Tukituki at Shagrock monitoring station
under three river flow conditions: median flow, lower quartile flow and 1-day Mean Annual Low Flow (MALF).
Figure 20: SIN inputs (as percentage of total) to the Tukituki River catchment upstream of the Tukituki at Shagrock
monitoring station under three river flow conditions: median flow, lower quartile flow and 1-day Mean Annual Low Flow
(MALF).
0
200
400
600
800
1000
1200
1400
1600
1800
Median flow Lower Quartile MALF
SIN
inp
uts
up
stre
am o
f Sh
agro
ck (
kg/d
ay)
Catchment Upstream SH50
Tukituki between SH50 and SH2
Tukipo d/s SH50
Waipawa catchment
Waipukurau Oxpond
Waipawa Oxpond
Mangatarata
21.5
35.6 37.0
13.8
16.1 8.8
50.2
36.4 46.1
12.9 9.64.2
0%
10%
20%
30%
40%
50%
60%
70%
80%
90%
100%
Median flow Lower Quartile MALF
SIN
inp
uts
up
stre
am o
f Sh
agro
ck (
% o
f to
tal) Catchment Upstream SH50
Tukituki between SH50 and SH2
Tukipo d/s SH50
Waipawa catchment
Waipawa Oxpond
Waipukurau Oxpond
Mangatarata
Water Quality in the Tukituki Catchment
State, trends and contaminant loads
44
6.3. Catchment yields
The previous section presented the nutrient loads coming from the different sub-catchments as absolute
numbers (i.e. kg per day). This section makes use of the same numbers (except the oxidation pond data,
not used here), but related back to each sub-catchment size. The aim is to provide a broad estimate of the
non-point source nutrient yield in each sub-catchment. The sub-catchments in Figure 21 and Figure 22 are
the same as used in the previous section (refer to 6.2.1 for details.
It should be noted that the figures presented here are based on the nutrient concentrations measured in the
water, and are expected to be significantly different from nutrient loss figures calculated at the paddock or
farm scale. Generally speaking, it is considered that an attenuation factor of approximately 2 should be
applied when trying to link nutrient loss from the land to nutrient in the waterways (i.e. only one third to
one half of the nutrients lost from the land are measured in the waterways) (Clothier et al. 2007).
6.3.1. DRP
When the rivers are at median flow, the Tukituki catchment below SH50, the Mangatarata Stream and the
Waipawa catchment below SH50 have the highest estimated daily yield of DRP (Figure 21). The
Mangaonuku Stream catchment itself has a low DRP yield, so the high yield in the Waipawa catchment is
probably due to inputs to the Waipawa mainstem and/or tributaries others than the Mangaonuku. The high
yields in both the Tukituki and Waipawa catchments correspond well with the areas of high landuse
intensity in the Ruataniwha Plains.
When considered as a whole, the upper catchment has a relatively moderate DRP yield, which decreases
at low river flows. Surprisingly, the highest estimated DRP yield is in the Makaretu Stream catchment.
6.3.2. SIN
The SIN yield in all sub-catchments appears to be highly flow-dependant, and decrease sharply with the
flow in the rivers.
The Tukituki catchment below SH50 has by far the highest estimated SIN yield, up to 45g/ha/day at
median flow. The Porangahau, Mangaonuku, and Waipawa downstream of SH50 sub-catchments all have
moderate SIN yields, in the vicinity of 10 g/ha/day at median flow (Figure 22).
Similarly to DRP, the Makaretu catchment above SH50 has the highest SIN yield of all upper catchment
sites. With an estimated 10 g/ha/day at median flow, the SIN yield of the Makaretu catchment above
SH50 is estimated to be about twice as much as the other SH50 sub-catchments (Figure 22).
Water Quality in the Tukituki Catchment
State, trends and contaminant loads
45
Figure 21: Estimated non-point source catchment yields for DRP (mg/ha/day) under different river flow conditions.
Figure 22: Estimated non-point source catchment yields for SIN (g/ha/day) under different river flow conditions.
0
100
200
300
400
500
600
700
Tuki
tuki
at
SH5
0
Wai
paw
a at
SH
50
Tuki
po
at
SH5
0
Mak
aret
u a
t SH
50
Cat
chm
ent
Up
stre
am
SH5
0
Po
ran
gah
au
Man
gao
nu
ku
Tuki
po
d/s
SH
50
Tuki
tuki
bet
wee
n S
H5
0
and
SH
2
Wai
paw
a d
/s S
H5
0
Man
gata
rata
Cat
chm
en
t yi
eld
for
DR
P (
mg/
ha/
day
)Median flow
Lower Quartile
MALF
0
5
10
15
20
25
30
35
40
45
50
Tuki
tuki
at
SH5
0
Wai
paw
a at
SH
50
Tuki
po
at
SH5
0
Mak
aret
u a
t SH
50
Cat
chm
ent
Up
stre
am
SH5
0
Po
ran
gah
au
Man
gao
nu
ku
Tuki
po
d/s
SH
50
Tuki
tuki
bet
wee
n S
H5
0
and
SH
2
Wai
paw
a d
/s S
H5
0
Man
gata
rata
Cat
chm
ne
t yi
eld
fo
r SI
N (
g/h
a/d
ay)
Median flow
Lower Quartile
MALF
Water Quality in the Tukituki Catchment
State, trends and contaminant loads
46
7. Discussion and Conclusions
7.1. Water quality of the Tukituki River
7.1.1. Upper catchment (upstream of SH50)
Generally, all sites in the upper Tukituki catchment exhibited very good water quality.
The lower – compared to the other upper catchment sites- water clarity observed in the upper Tukituki
and Waipawa Rivers are the likely result of natural causes.
Biological monitoring indicates healthy macroinvertebrate communities (MCI) and generally acceptable
periphyton biomass. However, it is interesting to note that all upper catchment sites have exceeded
periphyton biomass guideline at least once. This is possibly due to the very extended periods of low river
flows sometimes occurring in the Hawke’s Bay Region. The mean maximum annual accrual period6 for
Tukituki at Red Bridge is 123 days, or a little over 4 months. Such very long accrual periods (i.e. the time
between two significant floods) are known to allow the development of high periphyton biomass even
with low nutrient concentrations (Biggs, 2000).
Although water quality is generally satisfactory, some significant temporal trends have been detected,
indicating an increase in DRP concentrations and a decrease in MCI. The actual cause of the temporal
trends observed remains unknown and should be investigated.
One site in the upper catchment exhibits marked signs of degraded water quality in comparison with the
other upper catchment sites: the Tukipo River at SH50. It is the only site in the upper catchment which
breaches both the DRP and SIN guidelines, has increasing DRP and SIN and decreasing MCI trends. This
site also has the highest Total Organic Carbon (TOC) and E.coli concentrations. The causes of this
situation need to be investigated, including the presence and influence of intensive land use in the upper
Tukipo catchment.
7.1.2. Middle catchment (between SH50 and Shagrock)
Main Steam
A significant degradation of a number of water quality indicators (DRP, SIN, periphyton, MCI) is
observed between the upstream and the downstream boundaries of the middle catchment (SH50 and
Shagrock). Temporal trends also indicate DRP concentration increase and MCI degradation between 1998
and 2008 at Tukituki at Shagrock, whilst the bacteriological water quality was found to improve
significantly over the same period.
Contaminant load analysis indicates that most DRP and SIN come from this part of the catchment. A
significant increase in DRP concentration was also observed at Shagrock.
In the current situation, the DRP contribution from the Waipawa and Waipukurau oxidation ponds are the
single largest source of DRP in the middle catchment, particularly at low river flows. The contribution
from these two point source discharges is predicted to become relatively minor after the 2014 upgrade,
imposed by way of resource consent conditions. The priority catchments to control DRP inputs to the
Tukituki mainstem will then become the Waipawa and Tukituki catchments downstream of SH50, and the
Mangatarata Stream. Although a significant contributor, the potential of the catchment above SH50 as a
priority area for DRP management may require further investigations, as the sources of DRP may be
predominantly natural (due to erosion) and more difficult to control.
6 i.e. the average of the longest annual period between two significant floods
Water Quality in the Tukituki Catchment
State, trends and contaminant loads
47
The oxidation pond discharges do not appear to be significant contributors to the SIN loads in the middle
Tukituki catchments. The largest contributors are the Tukituki and Waipawa catchments downstream of
SH50.
The overall DRP and SIN patterns observed in the Tukituki catchment, i.e. SIN loads primarily of non-
point source origin and a significant contribution from point-source discharges to the DRP loads, are
consistent with the conclusions of studies undertaken in the neighbouring Upper Manawatu catchment,
located in the Manawatu-Wanganui Region (Ledein et al. 2007)
Tributaries:
The Mangatarata Stream has the most degraded water quality of all the sites monitored in the catchment.
Although the very elevated DRP and TOC concentrations could indicate direct contamination of the
water, the actual causes of water quality degradation are unknown and should be investigated. Although
the Mangatarata stream’s contribution to the DRP inputs to the middle catchment is currently relatively
minor, it is expected to represent 11 to 24 % of the total inputs after the oxidation pond upgrade – making
the Mangatarata Stream an obvious candidate for targeted management.
The Mangaonuku Stream has elevated SIN, but low DRP. However, both DRP and SIN have been found
to be increasing over time. Although they have been measured only once, periphyton biomass and
macroinvertebrate communities have been found to be relatively poor. Further investigations are
recommended to identify the causes of the increased SIN and DRP, and to confirm or otherwise the poor
biological monitoring results in this valued trout fishery.
The Porangahau Stream also has relatively degraded water quality. However, it contributes only a small
proportion of the middle catchment DRP loads (less than 1%), and may be a lesser priority than the two
previous tributaries. I should also be noted that for at least parts of its course, the Porangahau Stream bed
is dominated by fine sediments, making this stream relatively less sensitive to excessive periphyton
growth.
7.1.3. Lower catchment
Only two sites have regularly been monitored in the lower Tukituki catchment, both on the main stem.
The microbiological water quality and water clarity are generally good for a lowland river. No significant
temporal trends were detected, except an improvement to the already good microbiological water quality.
Biological monitoring generally indicates high periphyton biomass and decreased MCI in the lower
catchment - a degradation compared to the middle catchment.
A possible factor is the presence of more stable and slower flow conditions in the lower catchment,
allowing algal proliferation and increased water temperatures, in turn affecting the macroinvertebrate
communities. This explanation is somewhat supported by the contaminant loads analysis. During a dry
summer year, nutrient concentration and annual and summer load decrease in the lower catchment,
suggesting that a large part of the nutrients is consumed by the prolific algae biomass.
It is noted that no tributaries are monitored in the lower Tukituki catchment, therefore water quality in
these tributaries and their possible influence on the Tukituki mainstem cannot be discussed.
7.1.4. Conclusions
Generally, the microbiological water quality is good (and improving), and water clarity is acceptable
across the Tukituki catchment.
The largest single issue in the catchment appears to be nutrient enrichment and associated periphyton
growth, with a general degradation from upstream to downstream in the catchment. It should be noted
however, that all the sites across the catchment (including those with low levels of nutrients) do exceed
Water Quality in the Tukituki Catchment
State, trends and contaminant loads
48
the periphyton guideline from time to time, which is probably due to the extended periods of low flows
sometimes occurring in the region.
Significant temporal trends indicating an increase of DRP concentration and a degradation of
macroinvertebrate communities over time have been found at a number of sites in the Tukituki mainstem
and in tributaries in the upper and middle catchment. Significant increasing trends of the SIN
concentration have also been found in two tributaries, the Tukipo and Mangaonuku Rivers. When
considering medium term water quality trends, one should not discount the possible influence of El
Nino/la Nina global weather patterns, which have an average return frequency of 6 years. La Nina years
generally have long dry summers, which can affect key parameters such as water temperature and
periphyton biomass (through the reduction in the frequency of floods), which in turn can affect
macroinvertebrate communities. Notwithstanding the possible influence of global weather patterns, the
causes of the temporal trends observed in the Tukituki catchment remain unknown and should be
investigated.
Ratios between nitrogen and phosphorus indicate that DRP is the nutrient most likely to limit periphyton
growth in most of the Tukituki system, making DRP the obvious priority management target.
The middle catchment, between SH50 and Shagrock appears to receive the largest sources of nutrients,
particularly at low river flows. In the current situation, the point-source discharges from the Waipawa and
Waipukurau oxidation ponds are the largest source of DRP. After the oxidation pond upgrades in 2014,
non-point source pollution in the Waipawa and Mangatarata catchments are expected to become the
dominant inputs of DRP to the middle catchment.
SIN loads appear to be predominantly from non-point sources in the Tukituki and Waipawa catchments
between SH50 and Shagrock.
The analysis has revealed concerns about to tributaries:
the upper Tukipo, which still has relatively good water quality, although not as good as the other
upper catchment sites, and where significant increases of DRP and SIN and MCI decrease have
been detected over the last 10 years;
the Mangatarata Stream, where most parameters except ammonia and SIN indicate the most
degraded water quality of all monitored sites.
7.2. Recommendations
7.2.1. Management implications
If a management objective is to reduce the frequency and duration of algal blooms, managing DRP inputs
to the system is an obvious priority target – this is consistent with the RRMP which puts emphasis on P
management. It should be noted however, that managing only one nutrient is fraught with risk (Wilcock et
al. 2007), particularly as some sites in the catchment appear to switch to SIN-limited conditions during
periods of low river flow.
In terms of achieving a reduction in the DRP loads to the Tukituki catchment, the oxidation ponds are the
number one target- which has already been addressed through consent conditions. The next largest
contributors, the Waipawa and Mangatarata catchments should become the target of active investigation
and management. The sources of DRP in the upper catchment (above SH50) could be natural/ - i.e.
associated with natural erosion processes- and may be much more difficult to manage.
An important consideration to bear in mind is the fact that even a drastic reduction in nutrient
concentrations in the Tukituki River is unlikely to totally prevent algal proliferations. As demonstrated in
the upper catchment, even sites with low nutrient concentrations have exceeded the periphyton biomass
guideline at least once. These occasional exceedances are likely associated with the natural characteristics

Water Quality in the Tukituki Catchment
State, trends and contaminant loads
49
of the catchment and its climate – particularly the extended periods of low flow the Hawke’s Bay is
renowned for. A reduction in nutrient concentrations is more likely to result in reduced algal growth rates
and peak biomass, i.e. how fast and how often high algal biomass will occur, and how large to the algal
biomass and cover will be.
It should be noted that the conclusions proposed in this report are based on the data available only. Some
areas in the catchment are not monitored regularly and no conclusion can be drawn as to their water
quality. Further, the scale of the conclusion is by necessity the same as the monitoring network, and
can/should be refined by targeted monitoring and investigations. It is suggested that superimposing water
quality and landuse information using modern GIS tools may be useful in identifying hotspots/priority
areas for detailed instigations and/or management.
7.2.2. Further monitoring
Regular monitoring in the Tukituki at SH2 appears essential to better qualify water quality downstream of
the Tukipo confluence and upstream of the Waipukurau oxidation pond discharges. It is noted that it is a
contact recreation site, i.e. water samples are taken weekly for microbiological water quality monitoring.
It is recommended that an additional sample be taken and analysed for the same suite of water quality
parameters as SOE sites7.
High DRP concentrations have been observed upstream of the Waipukurau oxidation pond discharge,
which requires further investigation, as detailed in section 4.1.1. It is recommended that monitoring be
undertaken in parallel at SH2 and immediately upstream of the discharge, to attempt to understand the
reasons for the apparent water quality differences between the two sites. For this reason, as well as for
consistency of data across the catchment, it is recommended that monitoring at compliance sites be (i.e.
upstream and downstream of the discharges) be monitored for the same parameters as the SOE sites –
ideally synchronously.
If/when the discrepancies between SH2 and the upstream compliance site are clarified, it may then be
possible to use only one site for both SOE and compliance purposes.
Biomonitoring was undertaken only once in the Mangaonuku and Mangatarata Streams, indicating poor
MCI and high periphyton biomass. Additional monitoring is highly recommended to confirm or otherwise
these results.
It is recommended that the sources of the degraded water quality in the upper Tukipo River and the
Mangatarata Stream be investigated. The causes for relatively elevated nutrient yields in the upper
Makaretu Stream catchment may also need to be investigated.
There appears to be no regular monitoring of the lower catchment tributaries, which prevents any analysis
of the water quality in these waterways and the effect they may have on the Tukituki mainstem.
Additional monitoring appears essential to be able to identify any significant sources of nutrients in the
lower catchment.
7 This recommendation has been implemented since March 2008 (Graham Sevicke-Jones, pers. comm.)
Water Quality in the Tukituki Catchment
State, trends and contaminant loads
50
REFERENCES
1. ANZECC. (2000). Australia and New Zealand Guidelines for Fresh and Marine Water Quality.
Australian and New Zealand Environment and Conservation Council. Agriculture and Resource
Management Council of Australia and New Zealand. ISBN 09578245 0 5.
2. Ausseil O. M. and Clark M. (2007). Recommended water quality standards for the Manawatu-
Wanganui region: Technical report to support policy development. Manawatu-Wanganui
Regional Council report N. 2007/EXT/806. ISBN: 978-1-87743-89-5.
3. Biggs B. (2000). New Zealand Periphyton Guidelines: Detecting, Monitoring and Managing
Enrichment of Streams. Prepared for the Ministry for the Environment by the National Institute
for Water and Atmospheric Research (NIWA).
4. Clothier B., McKay A., Carran A., Gray R., Parfitt R., Francis G, Manning M., Duerer M.
and Green S. (2007). Farm Strategies for Contaminant Management. A report by SLURI, the
Sustainable Land Use Research Initiative, for Horizons Regional Council.
5. HBRC (2003). Ruataniwha Plains Water Resources investigations. Environmental Monitoring
Group Technical Report. HBRC Plan Number 3254. ISBN 1-877174-49-1.
6. Hay J., Hayes J. and Young R. (2007). Water quality guidelines to protect trout fisheries values.
Report prepared by Cawthron Institute for Horizons Regional Council.
7. Ledein E, Ausseil O. and Roygard J. (2007). Identifying point source and non-point source
contributions to nutrient loadings in waterways in three catchments in the Manawatu-Wanganui
Region: technical report to support policy development. Horizons Regional Council Report No:
2007/EXT/771. ISBN: 1-877413-65-8.
8. Ludecke JE. (1988). The Tukituki River Catchment water and soil resource management plan.
Hawke’s Bay catchment board and regional water board. ISBN 0-908698-02-X.
9. MfE (2002). Microbiological Water Quality Guidelines for Marine and Freshwater Recreational
Areas. Ministry of Health and Ministry for the Environment. Updated in June 2003. MfE Number
474. ISBN 0-478-24091-0.
10. NIWA (2008). An assessment of regional council water quality data (1996-2002) in support of
national state of the environment reporting (ENZ07). Report to the Ministry for the Environment.
11. Quinn J. and Hickey, C. (1990). Characterisation and classification of benthic invertebrate
communities in 88 New Zealand rivers in relation to environmental factors. New Zealand Journal
of Marine and Freshwater Research, 1990, Vol. 24: 387 – 409.
12. Raleigh R.F., Zuckerman L.D. and Nelson P.C. (1986). Habitat suitability index models and
instream flow suitability curves: brown trout, revised. U.S. Fish and Wildlife Service Biological
Report 82 (10.124).
13. Richards R.P. (1998). Estimation of pollutant loads in rivers and streams: a guidance document
for NPS programs. Prepared for the U.S. Environmental Protection Agency Region VIII, under
Grant X998397-01-0.
14. Scarsbrook M. R. and McBride G. B. (2007). Best practice guidelines for the statistical analysis
of freshwater quality data. Prepared for the Ministry for the Environment by the National Institute
for Water and Atmospheric Research (NIWA). NIWA client report: HAM2007-088.

Water Quality in the Tukituki Catchment
State, trends and contaminant loads
51
15. Stansfield B. (2004). State of the Environment surface water quality/ ecology. Long term trend
analysis 1998-2003. Hawke’s Bay Regional Council – Environmental Management Group
technical Report.
16. West D. W., Boubée J. A., Barrier R. F. (1997). Responses to pH of nine fishes and one shrimp
native to New Zealand freshwaters. New Zealand Journal of Marine and Freshwater Research
31: 461-468.
17. Wilcock B., Biggs B., Death R., Hickey C., Larned S. and Quinn J. (2007). Limiting nutrients
for controlling undesirable periphyton growth. Prepared for Horizons Regional Council. NIWA
Client Report HAM2007-006.
18. Wilcock R. J. (2008). Land–water interactions: Impacts on the aquatic environment. In:
McDowell, R.W. (ed.) Environmental Impacts of Pasture-based Farming. Chapter 3, pp75-97.
CAB International, Wallingford, UK.

Water Quality in the Tukituki Catchment
State, trends and contaminant loads
52

Water Quality in the Tukituki Catchment
State, trends and contaminant loads
1
APPENDICES

2
Appendix A: Summary of data – all river flows/year round
pH
TEMP (oC)
DO (mg/L)
SDO (%)
BD (m)
TURB (NTU)
SS (mg/L)
TN (mg/L)
NH3-N (mg/L)
SIN (mg/L)
DRP (mg/L)
TP (mg/L)
SIN/ DRP
SIN Ld (kg/day)
DRP Ld (kg/day)
FC (/100mL)
Coreltd Ecoli
TOC (mg/L)
MCI (Unit)
Chlo a (mg/m2)
TukiTuki at SH50
Average 7.5 13 10 96 2.2 31.6 46 0.32 0.02 0.14 0.004 0.040 70 83 1.8 71 54 1.1 122 118
Min 6.6 6 7 67 0.0 0.3 0 0.04 0.00 0.01 0.001 0.002 1 0.5 0.1 1 0 0.3 103 22
5%ile 6.8 7 8 80 0.1 0.5 1 0.11 0.01 0.02 0.001 0.002 9 2 0.1 5 1 0.3 103 23
ALL DATA 10%ile 6.9 8 8 85 0.2 0.6 1 0.12 0.01 0.02 0.001 0.003 10 3 0.2 9 1 0.5 103 23
25%ile 7.4 10 9 90 0.4 1.1 2 0.14 0.01 0.06 0.001 0.005 17 10 0.3 16 7 0.6 108 25
Median 7.7 12 10 95 1.7 3.4 4 0.25 0.01 0.10 0.002 0.011 40 28 0.6 24 16 0.9 120 45
75%ile 7.9 16 11 100 3.6 19.5 23 0.40 0.02 0.21 0.005 0.032 97 97 1.3 56 37 1.4 135 110
90%ile 7.9 18 12 108 5.1 87.4 114 0.59 0.03 0.33 0.008 0.111 177 192 5.2 200 163 1.9 141 278
95%ile 8.0 19 12 114 6.8 121.2 234 0.75 0.04 0.37 0.010 0.230 220 307 6.9 272 188 2.2 143 334
Max 8.1 21 15 133 8.0 650.0 930 1.81 0.20 0.48 0.040 0.430 473 1412 26 640 587 4.1 144 390
StDev 0.5 4.0 1.4 11 2.1 87 133 0.286 0.02 0.116 0.006 0.07 79 166 3.5 122 108 0.7 15 156
95% C.I. 0.3 0.7 0.3 2.1 0.5 18 26 0.069 0.00 0.023 0.001 0.01 16 33 0.7 31 26 0.1 9 137
Guideline 5 - 9.5 19 8 80 1.6 15 10 0.295 0.4 0.167 0.015 0.026 7 100 550 120 120
%compliance 100 95 96 95 51 69 67 61 100 68 95 70 4 81 97 55 80
N. of Samples 10 116 97 96 82 93 99 67 98 97 109 99 97 97 99 59 68 94 11 5
Tukipo at SH50 Average 7.8 13 10 97 2.3 8.2 12 1.34 0.018 1.00 0.018 0.037 178 148 1.8 588 192 3.0 122 129
Min 7.3 6 7 65 0.1 0.2 0 0.47 0.003 0.13 0.001 0.010 7 3 0.0 22 9 0.7 103 29
5%ile 7.4 7 8 79 0.3 0.4 1 0.54 0.005 0.24 0.001 0.016 14 6 0.1 37 13 1.5 107 32
ALL DATA 10%ile 7.4 8 8 80 0.6 0.5 1 0.62 0.005 0.36 0.001 0.020 19 8 0.1 44 26 1.6 111 34
25%ile 7.6 10 9 89 1.1 0.6 2 0.73 0.005 0.50 0.007 0.024 28 16 0.3 100 38 2.0 117 42
Median 7.7 13 10 96 2.2 1.3 2 1.01 0.010 0.70 0.018 0.031 60 49 0.7 170 64 2.8 122 84
75%ile 7.9 16 11 103 3.3 3.0 5 1.80 0.022 1.45 0.023 0.038 119 193 1.9 305 132 3.9 130 160
90%ile 8.2 19 12 114 4.1 10.0 11 2.45 0.036 2.05 0.030 0.061 395 322 5.9 822 299 4.4 131 262
95%ile 8.5 19 13 121 4.7 32.5 39 2.87 0.044 2.40 0.047 0.077 706 571 7.8 1490 631 4.8 133 296
Max 8.7 21 15 135 9.0 240 440 3.54 0.180 3.35 0.066 0.195 2374 1682 13 16000 4900 10.6 136 330
StDev 0.4 4.0 1.6 13 1.5 29 49 0.778 0.022 0.710 0.014 0.03 377 250 2.7 2096 604 1.5 10 123
95% C.I. 0.3 0.7 0.3 2.6 0.3 6 10 0.186 0.004 0.140 0.003 0.01 75 50 0.5 535 144 0.3 6 108
Guideline 5 - 9.5 19 8 80 1.6 15 10 0.295 0.4 0.167 0.015 0.026 7 100 550 120 120
%compliance 100 95 93 90 62 91 90 0 100 1 41 32 1 29 94 50 60
N. of Samples 8 114 95 94 84 91 98 67 98 98 108 99 98 98 107 59 68 94 10 5
Makaroro at Burnt Bridge
Average 7.8 11 11 100 2.2 16.8 0.12 0.004 0.08 0.005 0.033 14 61 3.3 473
Min 7.4 4 9 90 0.0 0.2 0.02 0.001 0.00 0.001 0.000 1.0 0.4 0.2 66
5%ile 7.6 6 9 96 0.1 0.4 0.03 0.001 0.01 0.002 0.005 2.4 1.3 0.4 85
ALL DATA 10%ile 7.6 6 9 97 0.1 0.5 0.04 0.001 0.01 0.003 0.005 3.4 1.9 0.5 100
25%ile 7.7 8 10 98 0.4 0.9 0.06 0.001 0.03 0.003 0.006 6.9 7.0 1.0 226
Median 7.8 11 11 99 1.6 2.5 0.10 0.003 0.07 0.005 0.010 12 25 1.7 289
75%ile 7.9 14 11 100 3.7 9.4 0.15 0.005 0.11 0.006 0.020 20 51 3.2 537
90%ile 7.9 17 12 102 5.4 38.6 0.22 0.007 0.17 0.008 0.066 28 131 5.6 753
95%ile 8.0 18 12 103 6.3 83.6 0.31 0.009 0.21 0.009 0.144 33 178 7.9 1475
Max 8.6 19 13 121 10.2 480 0.60 0.033 0.32 0.018 0.907 44 1520 69 2419
StDev 0.1 3.9 1.0 3 2.1 48 0.091 0.004 0.067 0.002 0.09 10 152 7.3 532
95% C.I. 0.0 0.5 0.1 0.4 0.3 6 0.013 0.000 0.009 0.000 0.01 1.4 21 1.0 217
Guideline 5 - 9.5 19 8 80 1.6 15 10 0.295 0.4 0.167 0.015 0.026 7 100 550 120 120
%compliance 100 100 100 100 50 80 94 100 88 99 80 26 13
N. of Samples 212 213 209 209 210 213 0 199 199 199 212 213 199 199 200 23 0 0 0 0
Makaretu at SH50
Average 7.7 13 10 96 2.3 21.7 24 0.59 0.020 0.38 0.011 0.045 102 81 1.3 163 75 1.4 127 103
Min 6.7 6 7 68 0.0 0.4 1 0.08 0.003 0.01 0.001 0.002 1 0 0.1 6 2 0.3 113 9

3
pH
TEMP (oC)
DO (mg/L)
SDO (%)
BD (m)
TURB (NTU)
SS (mg/L)
TN (mg/L)
NH3-N (mg/L)
SIN (mg/L)
DRP (mg/L)
TP (mg/L)
SIN/ DRP
SIN Ld (kg/day)
DRP Ld (kg/day)
FC (/100mL)
Coreltd Ecoli
TOC (mg/L)
MCI (Unit)
Chlo a (mg/m2)
5%ile 7.4 7 8 79 0.2 0.5 1 0.11 0.005 0.03 0.001 0.009 1 1 0.1 18 4 0.4 115 10
ALL DATA 10%ile 7.4 8 8 81 0.3 0.6 1 0.11 0.005 0.03 0.001 0.011 2 1 0.2 27 10 0.7 117 11
25%ile 7.6 10 9 88 0.9 1.0 2 0.20 0.005 0.07 0.004 0.015 7 6 0.3 42 17 1.0 120 13
Median 7.8 12 10 96 2.0 2.4 2 0.34 0.010 0.19 0.010 0.020 33 22 0.9 76 40 1.2 120 114
75%ile 7.9 16 11 104 3.6 5.4 6 0.89 0.020 0.70 0.015 0.031 94 119 1.5 114 68 1.5 133 160
90%ile 8.0 19 12 113 4.9 28.2 33 1.31 0.034 0.98 0.022 0.059 203 253 3.1 544 181 2.1 138 196
95%ile 8.1 20 12 118 5.4 68.3 98 1.54 0.061 1.15 0.029 0.100 494 300 4.4 664 303 2.4 148 208
Max 8.4 24 15 132 6.0 944.0 923 2.55 0.270 1.70 0.038 0.970 1240 600 7.1 1300 860 8.2 157 220
StDev 0.3 4.2 1.5 13 1.7 102 100 0.516 0.039 0.401 0.009 0.11 205 112 1.4 257 126 0.9 13 92
95% C.I. 0.1 0.8 0.3 2.4 0.4 21 20 0.124 0.007 0.076 0.002 0.02 39 22 0.3 63 29 0.2 8 81
Guideline 5 - 9.5 19 8 80 1.6 15 10 0.295 0.4 0.167 0.015 0.026 7 100 550 120 120
%compliance 100 92 97 91 57 87 80 45 100 47 76 65 24 65 99 73 60
N. of Samples 20 115 104 104 82 92 97 67 106 106 109 107 106 96 98 63 71 90 11 5
Porangahau at Oruawhara Rd
Average 7.8 14 11 104 2.7 6.7 5 2.12 0.020 1.84 0.023 0.051 258 93 1.3 1268 1062 5.1 96 175
Min 6.8 6 7 66 0.2 0.2 1 0.26 0.003 0.05 0.001 0.006 2 0 0.0 25 1 1.8 90 58
5%ile 6.9 8 7 71 0.6 0.3 1 0.34 0.005 0.09 0.001 0.020 4 0 0.0 45 13 2.3 91 60
ALL DATA 10%ile 6.9 9 8 82 1.0 0.4 2 0.38 0.005 0.16 0.001 0.020 7 1 0.0 55 22 2.7 92 62
25%ile 7.2 11 9 91 1.6 0.7 2 0.81 0.005 0.45 0.010 0.030 23 5 0.1 94 48 3.3 95 69
Median 8.0 15 10 101 2.6 1.4 2 1.95 0.010 1.58 0.020 0.040 70 32 0.3 225 100 4.3 98 171
75%ile 8.4 18 12 117 3.7 3.1 5 2.95 0.030 2.86 0.031 0.060 147 99 1.4 605 329 5.9 99 278
90%ile 8.5 20 13 128 4.3 8.8 14 4.29 0.040 4.15 0.043 0.075 321 261 2.2 2250 1500 8.5 99 292
95%ile 8.5 20 14 136 4.6 21.6 26 4.78 0.061 4.40 0.050 0.114 667 328 4.7 4950 5175 9.2 99 296
Max 8.5 22 16 173 6.3 156.0 60 5.90 0.130 6.03 0.089 0.570 7282 1405 25.3 18000 22000 15.1 99 301
StDev 0.7 4.0 2.1 21 1.4 23 9 1.440 0.022 1.479 0.017 0.06 842 183 3.3 3536 3495 2.5 4 128
95% C.I. 0.6 0.7 0.4 4.4 0.4 5 2 0.395 0.004 0.271 0.003 0.01 155 41 0.7 1022 924 0.6 4 125
Guideline 5 - 9.5 24 6 80 1.6 15 10 0.614 0.4 0.444 0.015 0.033 7 200 550 100 120
%compliance 100 100 92 92 75 93 88 20 100 25 31 37 11 50 82 0 50
N. of Samples 6 136 90 90 60 92 73 51 118 114 135 124 113 77 89 46 55 65 4 4
Tukipo at Ashcott Rd
Average 13.5 9.6 91.4 1.8 9.5 23 2 0.032 1.12 0.013 0.041 412 831 7.9 146 2.4
Min 6.0 7.3 69.2 0.1 0.3 0 0.001 0.14 0.001 0.001 9 22 0.1 4 0.9
5%ile 7.3 8.0 75.5 0.3 0.5 1 0.005 0.23 0.001 0.009 12 46 0.3 19 1.1
ALL DATA 10%ile 8.0 8.2 79.5 0.4 0.6 1 0.010 0.26 0.001 0.012 21 69 0.4 33 1.1
25%ile 11.0 8.7 85.9 1.0 1.0 2 0.010 0.46 0.003 0.020 45 149 1.3 60 1.4
Median 13.5 9.3 90.5 1.6 2.0 4 2 0.010 0.85 0.010 0.028 130 398 3.3 80 1.7
75%ile 17.0 10.4 96.3 2.8 4.5 9 0.030 1.47 0.020 0.040 267 965 7.8 166 3.2
90%ile 18.4 11.0 102 3.0 29.8 45 0.086 2.53 0.030 0.099 1098 2461 13 381 3.6
95%ile 18.8 11.6 107 3.3 52.9 105 0.150 2.77 0.030 0.128 2181 3251 31 400 4.9
Max 22.0 13.2 129 3.9 150.0 280 0.220 3.66 0.060 0.236 3660 5115 104 885 5.5
StDev 3.9 1.2 11 1.1 23 56 0.05 1 0 0.04 749 1132 15 168 1.3
95% C.I. 0.9 0.3 2.8 0.6 5 19 0.01 0 0.003 0.01 193 273 4 55 0.5
Guideline 5 - 9.5 24 8 80 1.6 15 10 0.4 0.444 0.015 0.033 7 200 100 120
%compliance 100 95 87 53 87 78 100 24 55 70 0 81
N. of Samples 0 73 60 60 15 67 32 1 66 66 65 66 58 66 64 36 0 23 0 0
Tukituki at SH2 Average 7.7 17 10 99 2.3 21.5 16 1.48 0.07 1.32 0.016 0.046 306 1571 15 83 128 1.6
Min 7.6 7 7 66 0.1 0.3 1 0.66 0.00 0.18 0.001 0.003 22 123 0.1 2 0 0.6
5%ile 7.6 9 8 81 0.4 0.5 1 0.69 0.01 0.41 0.001 0.005 26 211 0.4 4 1 0.8
ALL DATA 10%ile 7.6 11 8 84 0.7 0.8 1 0.73 0.01 0.51 0.001 0.014 29 241 0.8 13 2 0.9
25%ile 7.6 15 9 90 1.1 1.3 2 1.03 0.01 0.76 0.003 0.020 43 391 1.9 21 5 1.0
Median 7.6 18 10 96 2.5 2.0 3 1.27 0.01 1.16 0.011 0.028 92 756 7 37 18 1.3
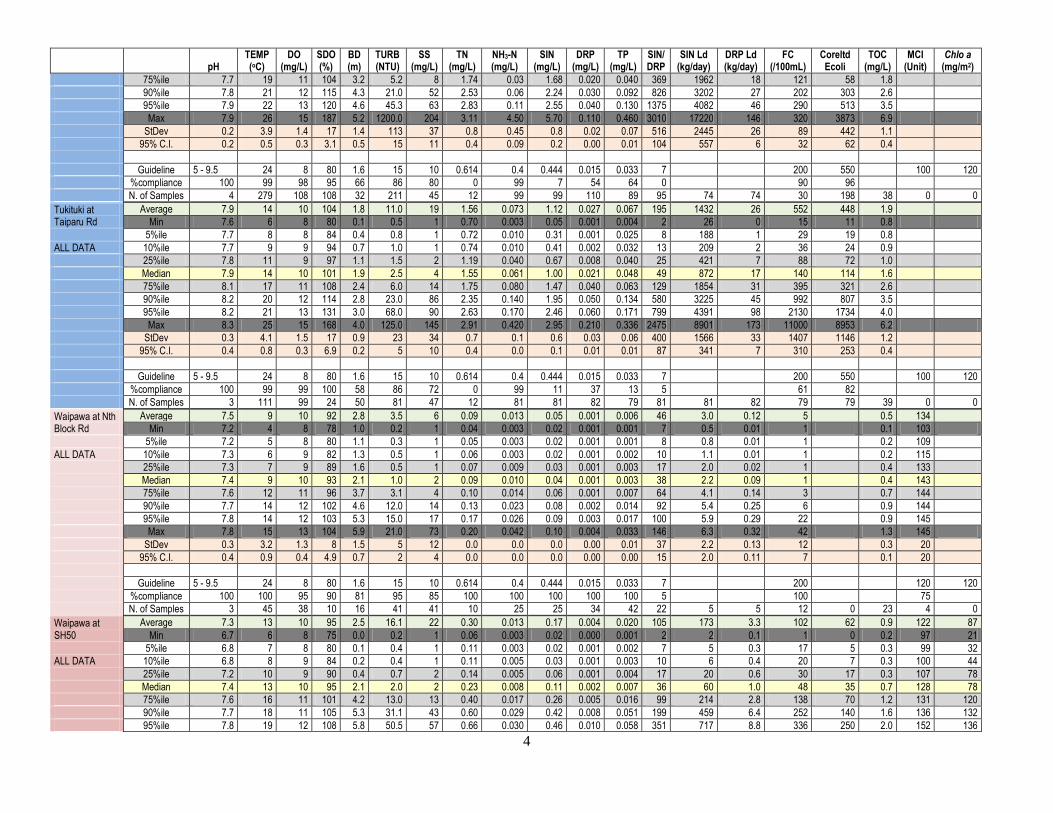
4
pH
TEMP (oC)
DO (mg/L)
SDO (%)
BD (m)
TURB (NTU)
SS (mg/L)
TN (mg/L)
NH3-N (mg/L)
SIN (mg/L)
DRP (mg/L)
TP (mg/L)
SIN/ DRP
SIN Ld (kg/day)
DRP Ld (kg/day)
FC (/100mL)
Coreltd Ecoli
TOC (mg/L)
MCI (Unit)
Chlo a (mg/m2)
75%ile 7.7 19 11 104 3.2 5.2 8 1.74 0.03 1.68 0.020 0.040 369 1962 18 121 58 1.8
90%ile 7.8 21 12 115 4.3 21.0 52 2.53 0.06 2.24 0.030 0.092 826 3202 27 202 303 2.6
95%ile 7.9 22 13 120 4.6 45.3 63 2.83 0.11 2.55 0.040 0.130 1375 4082 46 290 513 3.5
Max 7.9 26 15 187 5.2 1200.0 204 3.11 4.50 5.70 0.110 0.460 3010 17220 146 320 3873 6.9
StDev 0.2 3.9 1.4 17 1.4 113 37 0.8 0.45 0.8 0.02 0.07 516 2445 26 89 442 1.1
95% C.I. 0.2 0.5 0.3 3.1 0.5 15 11 0.4 0.09 0.2 0.00 0.01 104 557 6 32 62 0.4
Guideline 5 - 9.5 24 8 80 1.6 15 10 0.614 0.4 0.444 0.015 0.033 7 200 550 100 120
%compliance 100 99 98 95 66 86 80 0 99 7 54 64 0 90 96
N. of Samples 4 279 108 108 32 211 45 12 99 99 110 89 95 74 74 30 198 38 0 0
Tukituki at Taiparu Rd
Average 7.9 14 10 104 1.8 11.0 19 1.56 0.073 1.12 0.027 0.067 195 1432 26 552 448 1.9
Min 7.6 6 8 80 0.1 0.5 1 0.70 0.003 0.05 0.001 0.004 2 26 0 15 11 0.8
5%ile 7.7 8 8 84 0.4 0.8 1 0.72 0.010 0.31 0.001 0.025 8 188 1 29 19 0.8
ALL DATA 10%ile 7.7 9 9 94 0.7 1.0 1 0.74 0.010 0.41 0.002 0.032 13 209 2 36 24 0.9
25%ile 7.8 11 9 97 1.1 1.5 2 1.19 0.040 0.67 0.008 0.040 25 421 7 88 72 1.0
Median 7.9 14 10 101 1.9 2.5 4 1.55 0.061 1.00 0.021 0.048 49 872 17 140 114 1.6
75%ile 8.1 17 11 108 2.4 6.0 14 1.75 0.080 1.47 0.040 0.063 129 1854 31 395 321 2.6
90%ile 8.2 20 12 114 2.8 23.0 86 2.35 0.140 1.95 0.050 0.134 580 3225 45 992 807 3.5
95%ile 8.2 21 13 131 3.0 68.0 90 2.63 0.170 2.46 0.060 0.171 799 4391 98 2130 1734 4.0
Max 8.3 25 15 168 4.0 125.0 145 2.91 0.420 2.95 0.210 0.336 2475 8901 173 11000 8953 6.2
StDev 0.3 4.1 1.5 17 0.9 23 34 0.7 0.1 0.6 0.03 0.06 400 1566 33 1407 1146 1.2
95% C.I. 0.4 0.8 0.3 6.9 0.2 5 10 0.4 0.0 0.1 0.01 0.01 87 341 7 310 253 0.4
Guideline 5 - 9.5 24 8 80 1.6 15 10 0.614 0.4 0.444 0.015 0.033 7 200 550 100 120
%compliance 100 99 99 100 58 86 72 0 99 11 37 13 5 61 82
N. of Samples 3 111 99 24 50 81 47 12 81 81 82 79 81 81 82 79 79 39 0 0
Waipawa at Nth Block Rd
Average 7.5 9 10 92 2.8 3.5 6 0.09 0.013 0.05 0.001 0.006 46 3.0 0.12 5 0.5 134
Min 7.2 4 8 78 1.0 0.2 1 0.04 0.003 0.02 0.001 0.001 7 0.5 0.01 1 0.1 103
5%ile 7.2 5 8 80 1.1 0.3 1 0.05 0.003 0.02 0.001 0.001 8 0.8 0.01 1 0.2 109
ALL DATA 10%ile 7.3 6 9 82 1.3 0.5 1 0.06 0.003 0.02 0.001 0.002 10 1.1 0.01 1 0.2 115
25%ile 7.3 7 9 89 1.6 0.5 1 0.07 0.009 0.03 0.001 0.003 17 2.0 0.02 1 0.4 133
Median 7.4 9 10 93 2.1 1.0 2 0.09 0.010 0.04 0.001 0.003 38 2.2 0.09 1 0.4 143
75%ile 7.6 12 11 96 3.7 3.1 4 0.10 0.014 0.06 0.001 0.007 64 4.1 0.14 3 0.7 144
90%ile 7.7 14 12 102 4.6 12.0 14 0.13 0.023 0.08 0.002 0.014 92 5.4 0.25 6 0.9 144
95%ile 7.8 14 12 103 5.3 15.0 17 0.17 0.026 0.09 0.003 0.017 100 5.9 0.29 22 0.9 145
Max 7.8 15 13 104 5.9 21.0 73 0.20 0.042 0.10 0.004 0.033 146 6.3 0.32 42 1.3 145
StDev 0.3 3.2 1.3 8 1.5 5 12 0.0 0.0 0.0 0.00 0.01 37 2.2 0.13 12 0.3 20
95% C.I. 0.4 0.9 0.4 4.9 0.7 2 4 0.0 0.0 0.0 0.00 0.00 15 2.0 0.11 7 0.1 20
Guideline 5 - 9.5 24 8 80 1.6 15 10 0.614 0.4 0.444 0.015 0.033 7 200 120 120
%compliance 100 100 95 90 81 95 85 100 100 100 100 100 5 100 75
N. of Samples 3 45 38 10 16 41 41 10 25 25 34 42 22 5 5 12 0 23 4 0
Waipawa at SH50
Average 7.3 13 10 95 2.5 16.1 22 0.30 0.013 0.17 0.004 0.020 105 173 3.3 102 62 0.9 122 87
Min 6.7 6 8 75 0.0 0.2 1 0.06 0.003 0.02 0.000 0.001 2 2 0.1 1 0 0.2 97 21
5%ile 6.8 7 8 80 0.1 0.4 1 0.11 0.003 0.02 0.001 0.002 7 5 0.3 17 5 0.3 99 32
ALL DATA 10%ile 6.8 8 9 84 0.2 0.4 1 0.11 0.005 0.03 0.001 0.003 10 6 0.4 20 7 0.3 100 44
25%ile 7.2 10 9 90 0.4 0.7 2 0.14 0.005 0.06 0.001 0.004 17 20 0.6 30 17 0.3 107 78
Median 7.4 13 10 95 2.1 2.0 2 0.23 0.008 0.11 0.002 0.007 36 60 1.0 48 35 0.7 128 78
75%ile 7.6 16 11 101 4.2 13.0 13 0.40 0.017 0.26 0.005 0.016 99 214 2.8 138 70 1.2 131 120
90%ile 7.7 18 11 105 5.3 31.1 43 0.60 0.029 0.42 0.008 0.051 199 459 6.4 252 140 1.6 136 132
95%ile 7.8 19 12 108 5.8 50.5 57 0.66 0.030 0.46 0.010 0.058 351 717 8.8 336 250 2.0 152 136
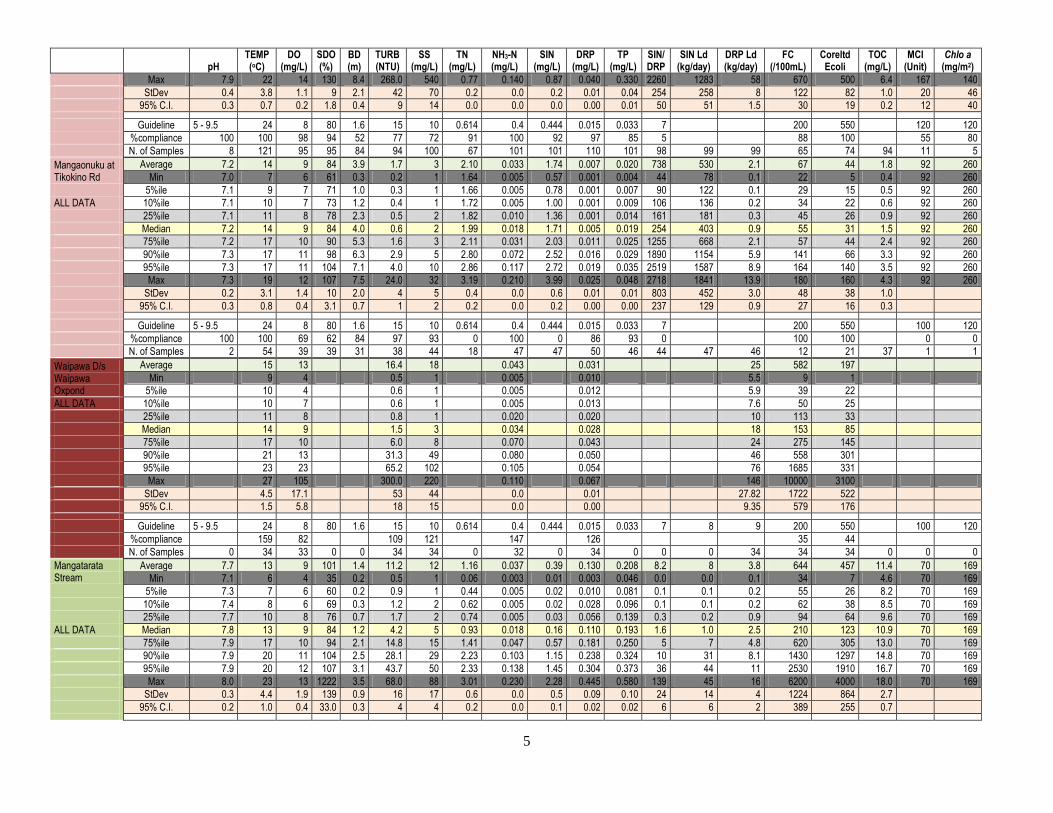
5
pH
TEMP (oC)
DO (mg/L)
SDO (%)
BD (m)
TURB (NTU)
SS (mg/L)
TN (mg/L)
NH3-N (mg/L)
SIN (mg/L)
DRP (mg/L)
TP (mg/L)
SIN/ DRP
SIN Ld (kg/day)
DRP Ld (kg/day)
FC (/100mL)
Coreltd Ecoli
TOC (mg/L)
MCI (Unit)
Chlo a (mg/m2)
Max 7.9 22 14 130 8.4 268.0 540 0.77 0.140 0.87 0.040 0.330 2260 1283 58 670 500 6.4 167 140
StDev 0.4 3.8 1.1 9 2.1 42 70 0.2 0.0 0.2 0.01 0.04 254 258 8 122 82 1.0 20 46
95% C.I. 0.3 0.7 0.2 1.8 0.4 9 14 0.0 0.0 0.0 0.00 0.01 50 51 1.5 30 19 0.2 12 40
Guideline 5 - 9.5 24 8 80 1.6 15 10 0.614 0.4 0.444 0.015 0.033 7 200 550 120 120
%compliance 100 100 98 94 52 77 72 91 100 92 97 85 5 88 100 55 80
N. of Samples 8 121 95 95 84 94 100 67 101 101 110 101 98 99 99 65 74 94 11 5
Mangaonuku at Tikokino Rd
Average 7.2 14 9 84 3.9 1.7 3 2.10 0.033 1.74 0.007 0.020 738 530 2.1 67 44 1.8 92 260
Min 7.0 7 6 61 0.3 0.2 1 1.64 0.005 0.57 0.001 0.004 44 78 0.1 22 5 0.4 92 260
5%ile 7.1 9 7 71 1.0 0.3 1 1.66 0.005 0.78 0.001 0.007 90 122 0.1 29 15 0.5 92 260
ALL DATA 10%ile 7.1 10 7 73 1.2 0.4 1 1.72 0.005 1.00 0.001 0.009 106 136 0.2 34 22 0.6 92 260
25%ile 7.1 11 8 78 2.3 0.5 2 1.82 0.010 1.36 0.001 0.014 161 181 0.3 45 26 0.9 92 260
Median 7.2 14 9 84 4.0 0.6 2 1.99 0.018 1.71 0.005 0.019 254 403 0.9 55 31 1.5 92 260
75%ile 7.2 17 10 90 5.3 1.6 3 2.11 0.031 2.03 0.011 0.025 1255 668 2.1 57 44 2.4 92 260
90%ile 7.3 17 11 98 6.3 2.9 5 2.80 0.072 2.52 0.016 0.029 1890 1154 5.9 141 66 3.3 92 260
95%ile 7.3 17 11 104 7.1 4.0 10 2.86 0.117 2.72 0.019 0.035 2519 1587 8.9 164 140 3.5 92 260
Max 7.3 19 12 107 7.5 24.0 32 3.19 0.210 3.99 0.025 0.048 2718 1841 13.9 180 160 4.3 92 260
StDev 0.2 3.1 1.4 10 2.0 4 5 0.4 0.0 0.6 0.01 0.01 803 452 3.0 48 38 1.0
95% C.I. 0.3 0.8 0.4 3.1 0.7 1 2 0.2 0.0 0.2 0.00 0.00 237 129 0.9 27 16 0.3
Guideline 5 - 9.5 24 8 80 1.6 15 10 0.614 0.4 0.444 0.015 0.033 7 200 550 100 120
%compliance 100 100 69 62 84 97 93 0 100 0 86 93 0 100 100 0 0
N. of Samples 2 54 39 39 31 38 44 18 47 47 50 46 44 47 46 12 21 37 1 1
Waipawa D/s Waipawa Oxpond
Average 15 13 16.4 18 0.043 0.031 25 582 197
Min 9 4 0.5 1 0.005 0.010 5.5 9 1
5%ile 10 4 0.6 1 0.005 0.012 5.9 39 22
ALL DATA 10%ile 10 7 0.6 1 0.005 0.013 7.6 50 25
25%ile 11 8 0.8 1 0.020 0.020 10 113 33
Median 14 9 1.5 3 0.034 0.028 18 153 85
75%ile 17 10 6.0 8 0.070 0.043 24 275 145
90%ile 21 13 31.3 49 0.080 0.050 46 558 301
95%ile 23 23 65.2 102 0.105 0.054 76 1685 331
Max 27 105 300.0 220 0.110 0.067 146 10000 3100
StDev 4.5 17.1 53 44 0.0 0.01 27.82 1722 522
95% C.I. 1.5 5.8 18 15 0.0 0.00 9.35 579 176
Guideline 5 - 9.5 24 8 80 1.6 15 10 0.614 0.4 0.444 0.015 0.033 7 8 9 200 550 100 120
%compliance 159 82 109 121 147 126 35 44
N. of Samples 0 34 33 0 0 34 34 0 32 0 34 0 0 0 34 34 34 0 0 0
Mangatarata Stream
Average 7.7 13 9 101 1.4 11.2 12 1.16 0.037 0.39 0.130 0.208 8.2 8 3.8 644 457 11.4 70 169
Min 7.1 6 4 35 0.2 0.5 1 0.06 0.003 0.01 0.003 0.046 0.0 0.0 0.1 34 7 4.6 70 169
5%ile 7.3 7 6 60 0.2 0.9 1 0.44 0.005 0.02 0.010 0.081 0.1 0.1 0.2 55 26 8.2 70 169
10%ile 7.4 8 6 69 0.3 1.2 2 0.62 0.005 0.02 0.028 0.096 0.1 0.1 0.2 62 38 8.5 70 169
25%ile 7.7 10 8 76 0.7 1.7 2 0.74 0.005 0.03 0.056 0.139 0.3 0.2 0.9 94 64 9.6 70 169
ALL DATA Median 7.8 13 9 84 1.2 4.2 5 0.93 0.018 0.16 0.110 0.193 1.6 1.0 2.5 210 123 10.9 70 169
75%ile 7.9 17 10 94 2.1 14.8 15 1.41 0.047 0.57 0.181 0.250 5 7 4.8 620 305 13.0 70 169
90%ile 7.9 20 11 104 2.5 28.1 29 2.23 0.103 1.15 0.238 0.324 10 31 8.1 1430 1297 14.8 70 169
95%ile 7.9 20 12 107 3.1 43.7 50 2.33 0.138 1.45 0.304 0.373 36 44 11 2530 1910 16.7 70 169
Max 8.0 23 13 1222 3.5 68.0 88 3.01 0.230 2.28 0.445 0.580 139 45 16 6200 4000 18.0 70 169
StDev 0.3 4.4 1.9 139 0.9 16 17 0.6 0.0 0.5 0.09 0.10 24 14 4 1224 864 2.7
95% C.I. 0.2 1.0 0.4 33.0 0.3 4 4 0.2 0.0 0.1 0.02 0.02 6 6 2 389 255 0.7

6
pH
TEMP (oC)
DO (mg/L)
SDO (%)
BD (m)
TURB (NTU)
SS (mg/L)
TN (mg/L)
NH3-N (mg/L)
SIN (mg/L)
DRP (mg/L)
TP (mg/L)
SIN/ DRP
SIN Ld (kg/day)
DRP Ld (kg/day)
FC (/100mL)
Coreltd Ecoli
TOC (mg/L)
MCI (Unit)
Chlo a (mg/m2)
Guideline 5 - 9.5 24 8 80 1.6 15 10 0.614 0.4 0.444 0.015 0.033 7 200 550 100 120
%compliance 100 71 65 37 76 64 12 100 71 7 0 85 47 84 0 0
N. of Samples 6 75 69 68 46 70 73 42 58 58 67 74 55 19 19 38 44 56 1 1
Tukituki at Shagrock + Tamumu
Average 8.0 15 11 104 2.3 16.2 20 1.24 0.02 0.97 0.014 0.042 141 2791 40 194 91 2.5 116 118
Min 7.1 7 8 82 0.0 0.2 1 0.25 0.00 0.12 0.001 0.006 17 59 1 1 0 0.4 90 7
5%ile 7.3 9 8 84 0.2 0.5 1 0.52 0.00 0.26 0.001 0.012 21 166 2 9 1 0.7 95 13
10%ile 7.5 9 9 87 0.4 0.5 1 0.61 0.01 0.37 0.002 0.017 24 279 2 25 1 0.9 99 18
25%ile 7.7 12 9 91 1.2 0.8 2 0.71 0.01 0.51 0.005 0.022 32 569 6 42 6 1.3 105 36
ALL DATA Median 7.8 15 10 100 2.6 1.9 2 1.11 0.01 0.84 0.013 0.029 60 1450 17 81 39 2.6 116 118
75%ile 8.5 18 12 114 3.1 8.0 9 1.55 0.03 1.28 0.021 0.040 134 3790 39 160 78 3.5 126 200
90%ile 8.7 20 12 130 3.8 26.5 22 2.17 0.05 1.78 0.025 0.069 385 6654 86 448 269 4.0 131 218
95%ile 8.7 21 13 138 4.2 50.8 48 2.28 0.08 2.11 0.032 0.102 677 11667 164 588 400 4.7 138 224
Max 8.7 25 15 168 6.8 471.0 760 2.56 0.21 2.37 0.074 0.430 950 16460 398 2500 920 6.7 145 230
StDev 0.6 4.1 1.5 17 1.4 58 88 0.6 0.03 0.6 0.01 0.05 206 3528 68 364 166 1.3 16 109
95% C.I. 0.4 0.7 0.3 3.1 0.3 12 17 0.1 0.01 0.1 0.00 0.01 44 755 14 78 41 0.3 10 106
Guideline 5 to 9.5 24 8 80 1.6 15 10 0.614 0.4 0.444 0.015 0.033 7 200 550 100 120
%compliance 100 98 98 100 68 84 78 10 100 15 56 60 0 80 97 90 50
N. of Samples 7 130 118 118 98 94 100 67 89 87 99 100 86 84 96 84 63 83 10 4
Tukituki at Red Bridge
Average 8.4 16 11 111 2.1 60.2 50 1.02 0.02 0.75 0.016 0.062 119 2888 70 170 94 3.3 104 264
Min 7.1 8 7 69 0.0 0.2 1 0.11 0.00 0.02 0.001 0.003 3 8 0 1 1 0.5 78 20
5%ile 7.4 9 9 85 0.2 0.4 1 0.16 0.00 0.03 0.001 0.006 9 12 0 4 1 1.0 80 33
ALL DATA 10%ile 7.7 10 9 86 0.3 0.5 2 0.21 0.01 0.04 0.001 0.007 17 18 1 8 2 1.2 82 46
25%ile 8.1 12 10 94 1.1 0.7 2 0.40 0.01 0.24 0.002 0.011 27 217 2 18 8 2.2 86 84
Median 8.4 16 11 108 1.9 1.6 2 0.89 0.01 0.58 0.009 0.020 49 1334 14 39 31 3.0 116 228
75%ile 8.8 20 12 121 2.8 3.4 7 1.57 0.02 1.20 0.022 0.037 119 3962 91 104 84 3.9 120 330
90%ile 9.1 22 13 137 3.9 24.6 23 1.93 0.03 1.70 0.035 0.067 250 7902 172 268 133 5.5 121 528
95%ile 9.5 23 14 146 4.6 44.2 48 2.18 0.04 1.82 0.045 0.100 409 10357 329 620 484 6.1 122 594
Max 9.8 27 16 170 6.1 3240.0 2670 3.29 0.10 2.11 0.170 2.140 1257 22374 658 3600 1200 14.9 123 660
StDev 0.8 4.5 1.6 21 1.4 402 318 0.7 0.02 0.6 0.02 0.25 199 4162 129 500 200 2.1 19 252
95% C.I. 0.6 1.0 0.4 4.8 0.3 98 74 0.2 0.00 0.1 0.00 0.06 46 961 29 128 47 0.5 11 221
Guideline 5 - 9.5 24 8 80 1.6 15 10 0.614 0.18 0.444 0.015 0.033 7 100 550 100 120
%compliance 88 99 99 96 64 85 79 34 100 38 63 70 4 75 96 55 40
N. of Samples 8 85 73 73 67 65 71 65 73 73 79 73 71 72 78 59 68 71 11 5
Tukituki at Black Bridge Average 8.2 17 11 110 2.0 13.6 31 0.94 0.03 0.70 0.014 0.040 178 2459 53 442 205 3.2 86 220
Min 7.2 7 6 61 0.0 0.2 1 0.11 0.00 0.01 0.001 0.001 0 3 0 1 0 0.3 75 51
5%ile 7.2 9 8 78 0.1 0.5 1 0.15 0.01 0.03 0.001 0.003 6 15 1 5 1 0.9 75 56
ALL DATA 10%ile 7.2 11 8 87 0.3 0.6 1 0.17 0.01 0.04 0.001 0.009 11 35 1 8 3 1.0 76 62
25%ile 7.4 14 10 96 1.0 1.0 2 0.30 0.01 0.20 0.002 0.013 27 213 2 22 14 1.4 78 78
Median 8.2 18 11 107 1.8 1.9 2 0.77 0.01 0.56 0.010 0.020 48 1144 14 51 31 3.0 81 200
75%ile 9.0 20 12 121 3.0 3.4 7 1.48 0.02 1.11 0.020 0.040 139 3528 59 327 81 4.1 86 271
90%ile 9.2 22 13 139 3.9 10.2 24 1.90 0.04 1.59 0.030 0.070 515 5804 144 1885 661 5.3 102 408
95%ile 9.3 23 15 149 4.4 24.4 54 2.14 0.08 1.79 0.041 0.097 1015 9624 198 2419 1506 5.7 110 454
Max 9.4 27 19 183 6.0 2160.0 1840 2.49 1.16 2.22 0.068 1.520 2215 24871 807 3300 3000 21.0 118 500
StDev 0.9 4.2 2.2 22 1.4 120 186 0.7 0.09 0.6 0.01 0.11 342 3705 97 791 476 2.5 15 180
95% C.I. 0.7 0.4 0.3 3.3 0.3 13 36 0.2 0.01 0.1 0.00 0.01 46 496 13 145 54 0.5 11 158
Guideline 5 - 9.5 24 8 80 1.6 15 10 0.614 0.18 0.444 0.015 0.033 7 100 550 100 120
%compliance 100 99 93 95 60 93 81 100 97 42 57 68 6 64 89 14 40
N. of Samples 7 434 166 166 86 337 102 67 221 219 232 220 216 214 227 115 298 91 7 5

7

8
Appendix B: Summary of data – river flows under 3* median flow (<3*med)
pH
TEMP (oC)
DO (mg/L)
SDO (%)
BD (m)
TURB (NTU)
SS (mg/L)
TN (mg/L)
NH3-N (mg/L)
SIN (mg/L)
DRP (mg/L)
SIN/ DRP
SIN Ld (kg/day)
DRP Ld (kg/day)
TP (mg/L)
FC (/100mL)
Coreltd Ecoli
TOC (mg/L)
MCI (Unit)
Chlo a (mg/m2)
TukiTuki at SH50
Average 7.5 13 10 97 2.4 15.6 23 0.27 0.017 0.13 0.003 70 54 1.1 0.032 57 42 1.0 122 118
Min 6.6 6 7 73 0.0 0.3 0 0.04 0.003 0.01 0.001 1 0 0.1 0.002 1 0 0.3 103 22
5%ile 6.7 7 8 82 0.1 0.5 1 0.11 0.005 0.02 0.001 8 2 0.1 0.002 4 1 0.3 103 23
<3*Med 10%ile 6.9 8 9 85 0.2 0.6 1 0.12 0.005 0.02 0.001 10 2 0.2 0.003 7 1 0.4 103 23
25%ile 7.4 10 9 92 0.4 1.1 2 0.14 0.005 0.05 0.001 17 9 0.3 0.004 15 6 0.6 108 25
Median 7.7 12 10 96 1.9 2.7 3 0.23 0.010 0.10 0.002 38 24 0.5 0.010 22 15 0.9 120 45
75%ile 7.8 16 11 102 3.6 16.0 17 0.35 0.020 0.19 0.004 99 67 1.1 0.028 51 29 1.2 135 110
90%ile 7.9 18 12 109 5.4 44.4 56 0.50 0.031 0.29 0.007 174 144 2.8 0.072 160 118 1.7 141 278
95%ile 8.0 19 12 116 6.8 86.0 115 0.73 0.043 0.34 0.008 225 185 5.2 0.166 200 170 2.0 143 334
Max 8.1 21 15 133 8.0 125.0 274 0.86 0.200 0.47 0.031 473 366 8 0.286 640 587 4.1 144 390
StDev 0.5 4.0 1.4 10 2.1 28 50 0.180 0.025 0.104 0.004 80 68 1.6 0.06 100 85 0.6 15 156
95% C.I. 0.3 0.8 0.3 2.1 0.5 6 10 0.045 0.005 0.021 0.001 17 14 0.3 0.01 27 21 0.1 9 137
Guideline 6.5 to 9.0 19 8 80 1.6 15 10 0.295 0.4 0.167 0.015 7 0.026 100 550 120 120
%compliance 100 94 97 97 55 73 71 67 100 71 98 4 73 85 98 55 80
N. of Samples 9 98 90 89 77 86 92 61 92 91 93 91 91 93 93 53 62 88 11 5
Tukipo at SH50 Average 7.8 13 10 97 2.6 2.1 3 1.22 0.018 0.91 0.018 164 83 1.2 0.032 248 99 2.9 122 129
Min 7.3 6 7 65 0.1 0.2 0 0.47 0.003 0.13 0.001 7 3 0.0 0.010 22 9 0.7 103 29
5%ile 7.4 8 8 80 0.7 0.4 1 0.54 0.005 0.24 0.001 14 6 0.1 0.016 33 11 1.5 107 32
<3*Med 10%ile 7.4 8 8 82 1.0 0.4 1 0.58 0.005 0.31 0.001 16 7 0.1 0.020 52 22 1.6 111 34
25%ile 7.6 10 9 90 1.5 0.5 2 0.69 0.005 0.47 0.006 26 13 0.2 0.024 100 38 2.0 117 42
Median 7.7 13 10 96 2.8 1.0 2 0.90 0.010 0.64 0.018 52 36 0.6 0.030 165 60 2.6 122 84
75%ile 7.9 17 11 104 3.5 2.1 2 1.65 0.020 1.39 0.023 112 110 1.2 0.037 298 122 3.8 130 160
90%ile 8.2 19 12 112 4.2 3.3 6 2.20 0.033 1.85 0.031 417 236 2.9 0.044 475 156 4.3 131 262
95%ile 8.5 20 13 120 4.8 5.4 9 2.63 0.042 2.17 0.051 669 257 3.5 0.058 797 292 4.4 133 296
Max 8.7 21 15 135 9.0 35 54 3.54 0.180 3.35 0.066 1980 527 9 0.087 1400 870 6.0 136 330
StDev 0.4 4.0 1.6 13 1.4 4 6 0.713 0.022 0.657 0.014 324 106 1.6 0.01 264 127 1.1 10 123
95% C.I. 0.3 0.8 0.3 2.7 0.3 1 1 0.185 0.005 0.140 0.003 69 22 0.3 0.00 73 32 0.2 6 108
Guideline 6.5 to 9.0 19 8 80 1.6 15 10 0.295 0.4 0.167 0.015 7 0.026 100 550 120 120
%compliance 100 94 94 91 71 99 96 0 100 1 41 1 36 28 98 50 60
N. of Samples 8 100 83 82 73 78 85 57 85 85 94 85 85 94 86 50 59 81 10 5
Makaroro at Burnt Bridge
Average 7.8 11 11 100 2.4 8.8 0.11 0.003 0.07 0.005 14 34 2.1 0.019 484
Min 7.5 4 9 90 0.1 0.2 0.02 0.001 0.00 0.001 1 0 0.2 0.000 66
5%ile 7.6 6 9 96 0.1 0.4 0.03 0.001 0.01 0.002 2 1 0.4 0.004 84
<3*Med 10%ile 7.6 6 9 97 0.2 0.5 0.04 0.001 0.01 0.003 3 2 0.5 0.005 99
25%ile 7.7 8 10 98 0.5 0.8 0.06 0.001 0.02 0.003 6 6 0.9 0.006 233
Median 7.8 11 11 99 1.7 2.0 0.10 0.003 0.06 0.005 11 22 1.6 0.009 290
75%ile 7.9 15 11 100 3.9 6.1 0.15 0.005 0.11 0.006 20 43 2.7 0.016 575
90%ile 7.9 17 12 102 5.5 24.3 0.20 0.007 0.15 0.008 27 84 4.6 0.038 762
95%ile 8.0 18 12 103 6.5 43.0 0.24 0.009 0.19 0.009 32 132 5.6 0.073 1514
Max 8.6 20 13 121 10.2 110 0.41 0.033 0.32 0.016 44 258 7 0.277 2419
StDev 0.1 3.9 1.0 3 2.1 18 0.074 0.003 0.063 0.002 10 43 1.6 0.03 541
95% C.I. 0.0 0.5 0.1 0.4 0.3 3 0.011 0.001 0.009 0.000 1 6 0.2 0.00 226
Guideline 6.5 to 9.0 19 8 80 1.6 15 10 0.295 0.4 0.167 0.015 7 0.026 100 550 120 120
%compliance 100 99 100 100 55 85 96 100 91 99 28 86 14
N. of Samples 198 198 195 195 195 198 0 186 186 186 197 186 186 187 198 22 0 0 0 0
Makaretu at SH50
Average 7.7 13 10 96 2.5 8.0 10 0.56 0.021 0.37 0.010 104 63 1.1 0.035 153 63 1.3 127 103
Min 6.7 6 7 68 0.1 0.4 1 0.08 0.003 0.01 0.001 1 1 0.1 0.002 16 2 0.3 113 9
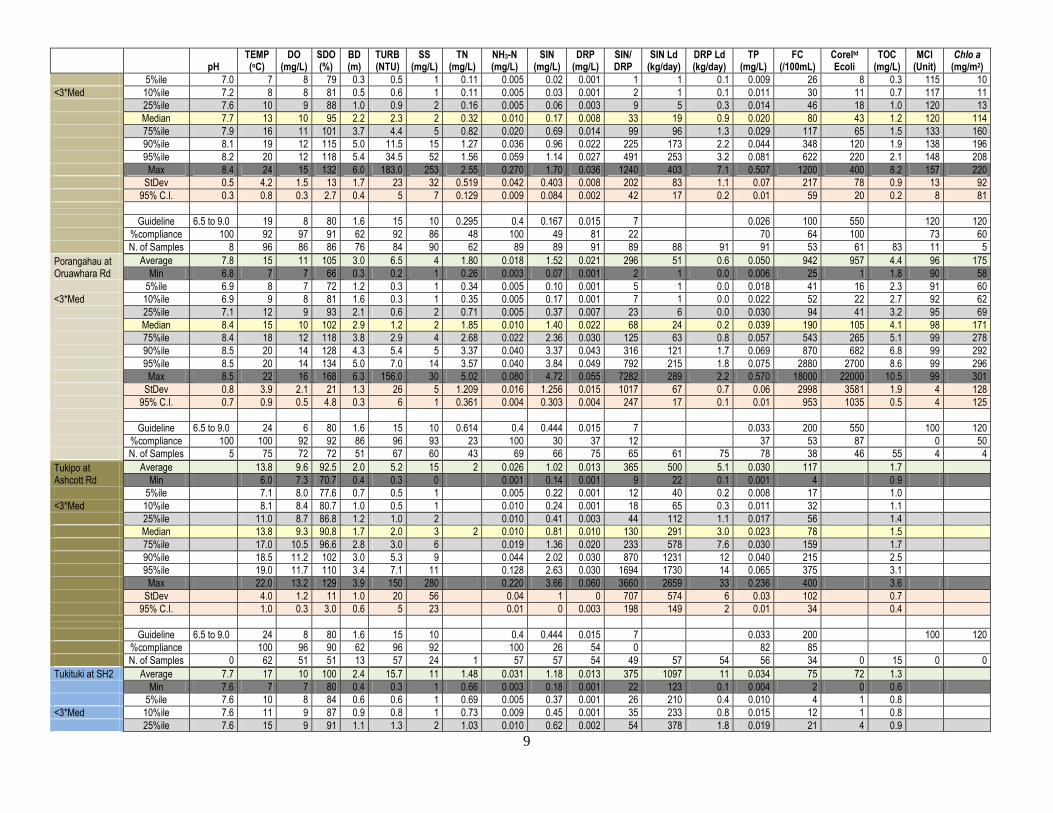
9
pH
TEMP (oC)
DO (mg/L)
SDO (%)
BD (m)
TURB (NTU)
SS (mg/L)
TN (mg/L)
NH3-N (mg/L)
SIN (mg/L)
DRP (mg/L)
SIN/ DRP
SIN Ld (kg/day)
DRP Ld (kg/day)
TP (mg/L)
FC (/100mL)
Coreltd Ecoli
TOC (mg/L)
MCI (Unit)
Chlo a (mg/m2)
5%ile 7.0 7 8 79 0.3 0.5 1 0.11 0.005 0.02 0.001 1 1 0.1 0.009 26 8 0.3 115 10
<3*Med 10%ile 7.2 8 8 81 0.5 0.6 1 0.11 0.005 0.03 0.001 2 1 0.1 0.011 30 11 0.7 117 11
25%ile 7.6 10 9 88 1.0 0.9 2 0.16 0.005 0.06 0.003 9 5 0.3 0.014 46 18 1.0 120 13
Median 7.7 13 10 95 2.2 2.3 2 0.32 0.010 0.17 0.008 33 19 0.9 0.020 80 43 1.2 120 114
75%ile 7.9 16 11 101 3.7 4.4 5 0.82 0.020 0.69 0.014 99 96 1.3 0.029 117 65 1.5 133 160
90%ile 8.1 19 12 115 5.0 11.5 15 1.27 0.036 0.96 0.022 225 173 2.2 0.044 348 120 1.9 138 196
95%ile 8.2 20 12 118 5.4 34.5 52 1.56 0.059 1.14 0.027 491 253 3.2 0.081 622 220 2.1 148 208
Max 8.4 24 15 132 6.0 183.0 253 2.55 0.270 1.70 0.036 1240 403 7.1 0.507 1200 400 8.2 157 220
StDev 0.5 4.2 1.5 13 1.7 23 32 0.519 0.042 0.403 0.008 202 83 1.1 0.07 217 78 0.9 13 92
95% C.I. 0.3 0.8 0.3 2.7 0.4 5 7 0.129 0.009 0.084 0.002 42 17 0.2 0.01 59 20 0.2 8 81
Guideline 6.5 to 9.0 19 8 80 1.6 15 10 0.295 0.4 0.167 0.015 7 0.026 100 550 120 120
%compliance 100 92 97 91 62 92 86 48 100 49 81 22 70 64 100 73 60
N. of Samples 8 96 86 86 76 84 90 62 89 89 91 89 88 91 91 53 61 83 11 5
Porangahau at Oruawhara Rd
Average 7.8 15 11 105 3.0 6.5 4 1.80 0.018 1.52 0.021 296 51 0.6 0.050 942 957 4.4 96 175
Min 6.8 7 7 66 0.3 0.2 1 0.26 0.003 0.07 0.001 2 1 0.0 0.006 25 1 1.8 90 58
5%ile 6.9 8 7 72 1.2 0.3 1 0.34 0.005 0.10 0.001 5 1 0.0 0.018 41 16 2.3 91 60
<3*Med 10%ile 6.9 9 8 81 1.6 0.3 1 0.35 0.005 0.17 0.001 7 1 0.0 0.022 52 22 2.7 92 62
25%ile 7.1 12 9 93 2.1 0.6 2 0.71 0.005 0.37 0.007 23 6 0.0 0.030 94 41 3.2 95 69
Median 8.4 15 10 102 2.9 1.2 2 1.85 0.010 1.40 0.022 68 24 0.2 0.039 190 105 4.1 98 171
75%ile 8.4 18 12 118 3.8 2.9 4 2.68 0.022 2.36 0.030 125 63 0.8 0.057 543 265 5.1 99 278
90%ile 8.5 20 14 128 4.3 5.4 5 3.37 0.040 3.37 0.043 316 121 1.7 0.069 870 682 6.8 99 292
95%ile 8.5 20 14 134 5.0 7.0 14 3.57 0.040 3.84 0.049 792 215 1.8 0.075 2880 2700 8.6 99 296
Max 8.5 22 16 168 6.3 156.0 30 5.02 0.080 4.72 0.055 7282 289 2.2 0.570 18000 22000 10.5 99 301
StDev 0.8 3.9 2.1 21 1.3 26 5 1.209 0.016 1.256 0.015 1017 67 0.7 0.06 2998 3581 1.9 4 128
95% C.I. 0.7 0.9 0.5 4.8 0.3 6 1 0.361 0.004 0.303 0.004 247 17 0.1 0.01 953 1035 0.5 4 125
Guideline 6.5 to 9.0 24 6 80 1.6 15 10 0.614 0.4 0.444 0.015 7 0.033 200 550 100 120
%compliance 100 100 92 92 86 96 93 23 100 30 37 12 37 53 87 0 50
N. of Samples 5 75 72 72 51 67 60 43 69 66 75 65 61 75 78 38 46 55 4 4
Tukipo at Ashcott Rd
Average 13.8 9.6 92.5 2.0 5.2 15 2 0.026 1.02 0.013 365 500 5.1 0.030 117 1.7
Min 6.0 7.3 70.7 0.4 0.3 0 0.001 0.14 0.001 9 22 0.1 0.001 4 0.9
5%ile 7.1 8.0 77.6 0.7 0.5 1 0.005 0.22 0.001 12 40 0.2 0.008 17 1.0
<3*Med 10%ile 8.1 8.4 80.7 1.0 0.5 1 0.010 0.24 0.001 18 65 0.3 0.011 32 1.1
25%ile 11.0 8.7 86.8 1.2 1.0 2 0.010 0.41 0.003 44 112 1.1 0.017 56 1.4
Median 13.8 9.3 90.8 1.7 2.0 3 2 0.010 0.81 0.010 130 291 3.0 0.023 78 1.5
75%ile 17.0 10.5 96.6 2.8 3.0 6 0.019 1.36 0.020 233 578 7.6 0.030 159 1.7
90%ile 18.5 11.2 102 3.0 5.3 9 0.044 2.02 0.030 870 1231 12 0.040 215 2.5
95%ile 19.0 11.7 110 3.4 7.1 11 0.128 2.63 0.030 1694 1730 14 0.065 375 3.1
Max 22.0 13.2 129 3.9 150 280 0.220 3.66 0.060 3660 2659 33 0.236 400 3.6
StDev 4.0 1.2 11 1.0 20 56 0.04 1 0 707 574 6 0.03 102 0.7
95% C.I. 1.0 0.3 3.0 0.6 5 23 0.01 0 0.003 198 149 2 0.01 34 0.4
Guideline 6.5 to 9.0 24 8 80 1.6 15 10 0.4 0.444 0.015 7 0.033 200 100 120
%compliance 100 96 90 62 96 92 100 26 54 0 82 85
N. of Samples 0 62 51 51 13 57 24 1 57 57 54 49 57 54 56 34 0 15 0 0
Tukituki at SH2 Average 7.7 17 10 100 2.4 15.7 11 1.48 0.031 1.18 0.013 375 1097 11 0.034 75 72 1.3
Min 7.6 7 7 80 0.4 0.3 1 0.66 0.003 0.18 0.001 22 123 0.1 0.004 2 0 0.6
5%ile 7.6 10 8 84 0.6 0.6 1 0.69 0.005 0.37 0.001 26 210 0.4 0.010 4 1 0.8
<3*Med 10%ile 7.6 11 9 87 0.9 0.8 1 0.73 0.009 0.45 0.001 35 233 0.8 0.015 12 1 0.8
25%ile 7.6 15 9 91 1.1 1.3 2 1.03 0.010 0.62 0.002 54 378 1.8 0.019 21 4 0.9

10
pH
TEMP (oC)
DO (mg/L)
SDO (%)
BD (m)
TURB (NTU)
SS (mg/L)
TN (mg/L)
NH3-N (mg/L)
SIN (mg/L)
DRP (mg/L)
SIN/ DRP
SIN Ld (kg/day)
DRP Ld (kg/day)
TP (mg/L)
FC (/100mL)
Coreltd Ecoli
TOC (mg/L)
MCI (Unit)
Chlo a (mg/m2)
Median 7.6 18 10 96 2.5 2.0 2 1.27 0.017 1.05 0.010 118 656 6 0.027 32 15 1.2
75%ile 7.7 20 11 104 3.3 4.7 6 1.74 0.032 1.61 0.020 418 1603 17 0.040 107 50 1.7
90%ile 7.8 21 12 115 4.4 13.6 16 2.53 0.053 2.22 0.030 1186 2663 25 0.061 160 151 2.0
95%ile 7.9 22 13 120 4.6 26.3 33 2.83 0.100 2.29 0.030 1665 3445 27 0.089 240 416 2.3
Max 7.9 26 15 187 5.2 1200.0 204 3.11 0.240 3.00 0.110 3010 4247 141 0.168 320 1710 2.7
StDev 0.2 3.9 1.4 16 1.3 97 32 0.8 0.0 0.7 0.02 589 1040 18 0.03 80 179 0.5
95% C.I. 0.2 0.5 0.3 3.2 0.5 14 10 0.4 0.0 0.2 0.00 142 247 4 0.01 29 26 0.2
Guideline 6.5 to 9.0 24 8 80 1.6 15 10 0.614 0.4 0.444 0.015 7 0.033 200 100 120
%compliance 100 99 99 99 68 90 88 0 100 10 61 0 68 93
N. of Samples 4 227 95 95 31 188 41 12 68 68 69 66 68 69 68 29 188 34 0 0
Tukituki at Taiparu Rd
Average 7.9 14 10 105 1.8 4.8 8 1.56 0.069 1.11 0.027 197 1133 21 0.057 549 446 1.6
Min 7.6 6 8 80 0.2 0.5 1 0.70 0.003 0.05 0.001 2 26 0 0.004 15 11 0.8
5%ile 7.7 8 8 84 0.5 0.7 1 0.72 0.010 0.29 0.001 7 187 1 0.023 28 19 0.8
<3*Med 10%ile 7.7 9 9 94 0.8 1.0 1 0.74 0.010 0.40 0.002 12 208 2 0.030 35 24 0.8
25%ile 7.8 11 9 97 1.1 1.2 2 1.19 0.040 0.65 0.008 24 404 7 0.040 86 70 1.0
Median 7.9 15 10 101 1.9 2.0 3 1.55 0.060 0.98 0.021 49 808 17 0.046 138 112 1.4
75%ile 8.1 17 11 108 2.5 4.7 7 1.75 0.080 1.46 0.040 127 1459 29 0.053 320 260 1.9
90%ile 8.2 20 13 114 2.8 9.9 17 2.35 0.137 1.95 0.050 572 2491 41 0.103 1038 845 3.0
95%ile 8.2 21 13 132 3.0 17.1 23 2.63 0.164 2.47 0.063 904 3264 46 0.119 2160 1758 3.3
Max 8.3 25 15 168 4.0 59.0 84 2.91 0.320 2.95 0.210 2475 5087 166 0.336 11000 8953 3.8
StDev 0.3 4.2 1.5 18 0.9 8 14 0.7 0.1 0.6 0.03 411 1073 23 0.04 1425 1160 0.9
95% C.I. 0.4 0.8 0.3 7.2 0.2 2 4 0.4 0.0 0.1 0.01 94 245 5 0.01 318 259 0.3
Guideline 6.5 to 9.0 24 8 80 1.6 15 10 0.614 0.4 0.444 0.015 7 0.033 200 550 100 120
%compliance 100 99 99 100 59 95 81 0 100 12 36 5 14 62 83
N. of Samples 3 103 92 23 49 74 42 12 74 74 75 74 74 75 72 77 77 34 0 0
Waipawa at SH50
Average 7.3 13 10 95 2.6 8.0 10 0.27 0.013 0.16 0.004 102 123 2.3 0.014 99 57 0.8 121 87
Min 6.7 6 8 78 0.1 0.2 1 0.06 0.003 0.02 0.000 2 2 0.1 0.001 1 0 0.2 97 21
5%ile 6.8 7 8 80 0.1 0.4 1 0.11 0.003 0.02 0.001 7 5 0.3 0.002 17 4 0.3 98 32
<3*Med 10%ile 6.8 7 9 85 0.2 0.4 1 0.11 0.005 0.03 0.001 10 6 0.4 0.002 20 7 0.3 100 44
25%ile 7.2 9 9 90 0.8 0.7 2 0.14 0.005 0.06 0.001 17 19 0.5 0.004 31 17 0.3 104 78
Median 7.4 13 10 95 2.5 1.7 2 0.20 0.009 0.10 0.002 36 48 1.0 0.007 48 34 0.7 120 78
75%ile 7.6 16 11 101 4.2 10.2 9 0.39 0.017 0.21 0.005 99 189 2.3 0.014 139 67 1.1 131 120
90%ile 7.7 18 11 105 5.4 26.2 37 0.54 0.029 0.36 0.007 178 329 4.8 0.044 244 132 1.5 139 132
95%ile 7.8 19 12 107 5.9 37.6 49 0.61 0.030 0.44 0.009 331 444 7.5 0.054 322 229 1.8 153 136
Max 7.9 22 14 130 8.4 53.9 70 0.73 0.140 0.87 0.039 2260 707 42 0.096 670 300 3.7 167 140
StDev 0.4 3.9 1.1 9 2.1 13 16 0.2 0.0 0.2 0.00 257 156 5 0.02 115 66 0.6 21 46
95% C.I. 0.3 0.8 0.2 1.9 0.5 3 3 0.0 0.0 0.0 0.00 53 32 1.0 0.00 29 16 0.1 13 40
Guideline 6.5 to 9.0 24 8 80 1.6 15 10 0.614 0.4 0.444 0.015 7 0.033 200 550 120 120
%compliance 100 100 98 94 55 81 77 95 100 95 99 5 87 88 100 50 80
N. of Samples 8 100 87 87 78 85 91 62 93 93 93 91 93 93 93 59 68 86 10 5
Mangaonuku at Tikokino Rd
Average 7.2 14 9 85 3.9 1.6 2 2.10 0.033 1.75 0.007 759 464 1.9 0.019 69 45 1.8 92 260
Min 7.0 7 6 61 0.3 0.2 1 1.64 0.005 0.57 0.001 44 78 0.1 0.004 22 5 0.4 92 260
5%ile 7.1 9 7 71 1.0 0.3 1 1.66 0.005 0.78 0.001 89 121 0.1 0.007 28 14 0.5 92 260
<3*Med 10%ile 7.1 9 8 73 1.2 0.4 1 1.72 0.005 0.99 0.001 114 135 0.2 0.008 34 21 0.5 92 260
25%ile 7.1 11 8 79 2.3 0.5 2 1.82 0.007 1.36 0.001 162 174 0.3 0.014 46 26 0.9 92 260
Median 7.2 14 9 84 4.0 0.5 2 1.99 0.018 1.71 0.004 248 342 0.9 0.019 55 33 1.5 92 260
75%ile 7.2 16 10 90 5.3 1.1 2 2.11 0.031 2.03 0.010 1330 623 1.8 0.025 58 45 2.4 92 260
90%ile 7.3 17 11 98 6.3 2.4 5 2.80 0.077 2.52 0.015 1915 868 5.4 0.029 150 73 3.4 92 260
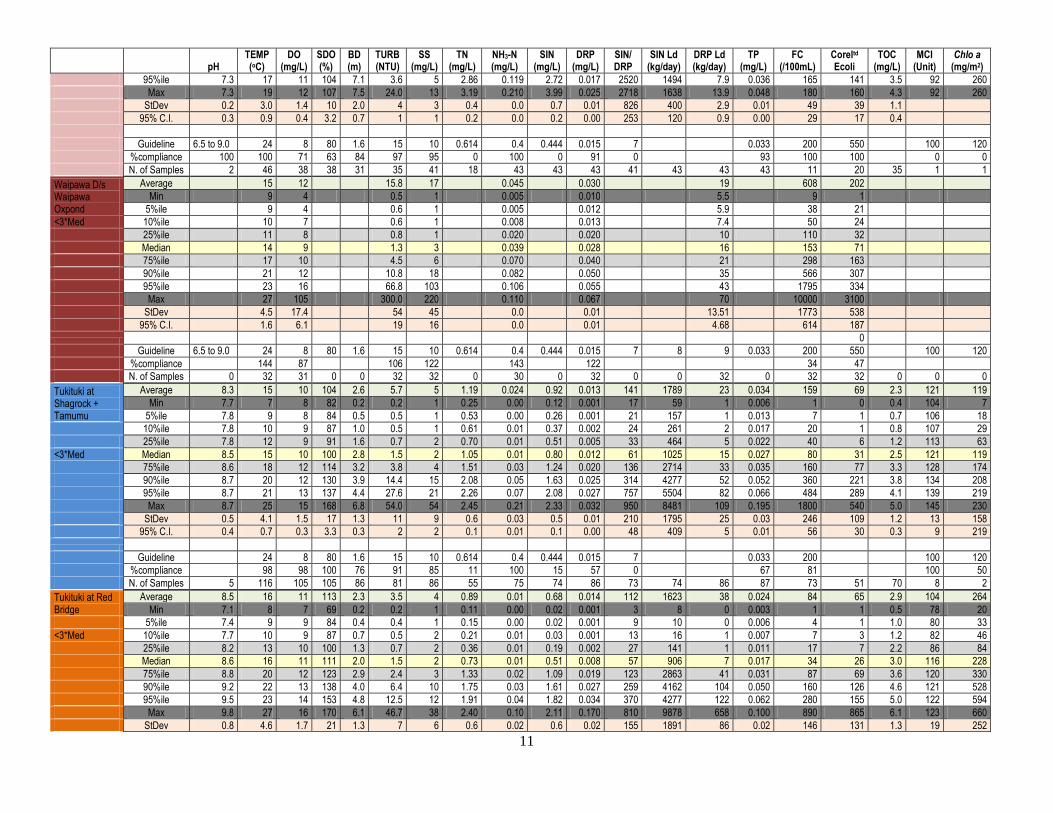
11
pH
TEMP (oC)
DO (mg/L)
SDO (%)
BD (m)
TURB (NTU)
SS (mg/L)
TN (mg/L)
NH3-N (mg/L)
SIN (mg/L)
DRP (mg/L)
SIN/ DRP
SIN Ld (kg/day)
DRP Ld (kg/day)
TP (mg/L)
FC (/100mL)
Coreltd Ecoli
TOC (mg/L)
MCI (Unit)
Chlo a (mg/m2)
95%ile 7.3 17 11 104 7.1 3.6 5 2.86 0.119 2.72 0.017 2520 1494 7.9 0.036 165 141 3.5 92 260
Max 7.3 19 12 107 7.5 24.0 13 3.19 0.210 3.99 0.025 2718 1638 13.9 0.048 180 160 4.3 92 260
StDev 0.2 3.0 1.4 10 2.0 4 3 0.4 0.0 0.7 0.01 826 400 2.9 0.01 49 39 1.1
95% C.I. 0.3 0.9 0.4 3.2 0.7 1 1 0.2 0.0 0.2 0.00 253 120 0.9 0.00 29 17 0.4
Guideline 6.5 to 9.0 24 8 80 1.6 15 10 0.614 0.4 0.444 0.015 7 0.033 200 550 100 120
%compliance 100 100 71 63 84 97 95 0 100 0 91 0 93 100 100 0 0
N. of Samples 2 46 38 38 31 35 41 18 43 43 43 41 43 43 43 11 20 35 1 1
Waipawa D/s Waipawa Oxpond
Average 15 12 15.8 17 0.045 0.030 19 608 202
Min 9 4 0.5 1 0.005 0.010 5.5 9 1
5%ile 9 4 0.6 1 0.005 0.012 5.9 38 21
<3*Med 10%ile 10 7 0.6 1 0.008 0.013 7.4 50 24
25%ile 11 8 0.8 1 0.020 0.020 10 110 32
Median 14 9 1.3 3 0.039 0.028 16 153 71
75%ile 17 10 4.5 6 0.070 0.040 21 298 163
90%ile 21 12 10.8 18 0.082 0.050 35 566 307
95%ile 23 16 66.8 103 0.106 0.055 43 1795 334
Max 27 105 300.0 220 0.110 0.067 70 10000 3100
StDev 4.5 17.4 54 45 0.0 0.01 13.51 1773 538
95% C.I. 1.6 6.1 19 16 0.0 0.01 4.68 614 187
0
Guideline 6.5 to 9.0 24 8 80 1.6 15 10 0.614 0.4 0.444 0.015 7 8 9 0.033 200 550 100 120
%compliance 144 87 106 122 143 122 34 47
N. of Samples 0 32 31 0 0 32 32 0 30 0 32 0 0 32 0 32 32 0 0 0
Tukituki at Shagrock + Tamumu
Average 8.3 15 10 104 2.6 5.7 5 1.19 0.024 0.92 0.013 141 1789 23 0.034 159 69 2.3 121 119
Min 7.7 7 8 82 0.2 0.2 1 0.25 0.00 0.12 0.001 17 59 1 0.006 1 0 0.4 104 7
5%ile 7.8 9 8 84 0.5 0.5 1 0.53 0.00 0.26 0.001 21 157 1 0.013 7 1 0.7 106 18
10%ile 7.8 10 9 87 1.0 0.5 1 0.61 0.01 0.37 0.002 24 261 2 0.017 20 1 0.8 107 29
25%ile 7.8 12 9 91 1.6 0.7 2 0.70 0.01 0.51 0.005 33 464 5 0.022 40 6 1.2 113 63
<3*Med Median 8.5 15 10 100 2.8 1.5 2 1.05 0.01 0.80 0.012 61 1025 15 0.027 80 31 2.5 121 119
75%ile 8.6 18 12 114 3.2 3.8 4 1.51 0.03 1.24 0.020 136 2714 33 0.035 160 77 3.3 128 174
90%ile 8.7 20 12 130 3.9 14.4 15 2.08 0.05 1.63 0.025 314 4277 52 0.052 360 221 3.8 134 208
95%ile 8.7 21 13 137 4.4 27.6 21 2.26 0.07 2.08 0.027 757 5504 82 0.066 484 289 4.1 139 219
Max 8.7 25 15 168 6.8 54.0 54 2.45 0.21 2.33 0.032 950 8481 109 0.195 1800 540 5.0 145 230
StDev 0.5 4.1 1.5 17 1.3 11 9 0.6 0.03 0.5 0.01 210 1795 25 0.03 246 109 1.2 13 158
95% C.I. 0.4 0.7 0.3 3.3 0.3 2 2 0.1 0.01 0.1 0.00 48 409 5 0.01 56 30 0.3 9 219
Guideline 24 8 80 1.6 15 10 0.614 0.4 0.444 0.015 7 0.033 200 100 120
%compliance 98 98 100 76 91 85 11 100 15 57 0 67 81 100 50
N. of Samples 5 116 105 105 86 81 86 55 75 74 86 73 74 86 87 73 51 70 8 2
Tukituki at Red Bridge
Average 8.5 16 11 113 2.3 3.5 4 0.89 0.01 0.68 0.014 112 1623 38 0.024 84 65 2.9 104 264
Min 7.1 8 7 69 0.2 0.2 1 0.11 0.00 0.02 0.001 3 8 0 0.003 1 1 0.5 78 20
5%ile 7.4 9 9 84 0.4 0.4 1 0.15 0.00 0.02 0.001 9 10 0 0.006 4 1 1.0 80 33
<3*Med 10%ile 7.7 10 9 87 0.7 0.5 2 0.21 0.01 0.03 0.001 13 16 1 0.007 7 3 1.2 82 46
25%ile 8.2 13 10 100 1.3 0.7 2 0.36 0.01 0.19 0.002 27 141 1 0.011 17 7 2.2 86 84
Median 8.6 16 11 111 2.0 1.5 2 0.73 0.01 0.51 0.008 57 906 7 0.017 34 26 3.0 116 228
75%ile 8.8 20 12 123 2.9 2.4 3 1.33 0.02 1.09 0.019 123 2863 41 0.031 87 69 3.6 120 330
90%ile 9.2 22 13 138 4.0 6.4 10 1.75 0.03 1.61 0.027 259 4162 104 0.050 160 126 4.6 121 528
95%ile 9.5 23 14 153 4.8 12.5 12 1.91 0.04 1.82 0.034 370 4277 122 0.062 280 155 5.0 122 594
Max 9.8 27 16 170 6.1 46.7 38 2.40 0.10 2.11 0.170 810 9878 658 0.100 890 865 6.1 123 660
StDev 0.8 4.6 1.7 21 1.3 7 6 0.6 0.02 0.6 0.02 155 1891 86 0.02 146 131 1.3 19 252
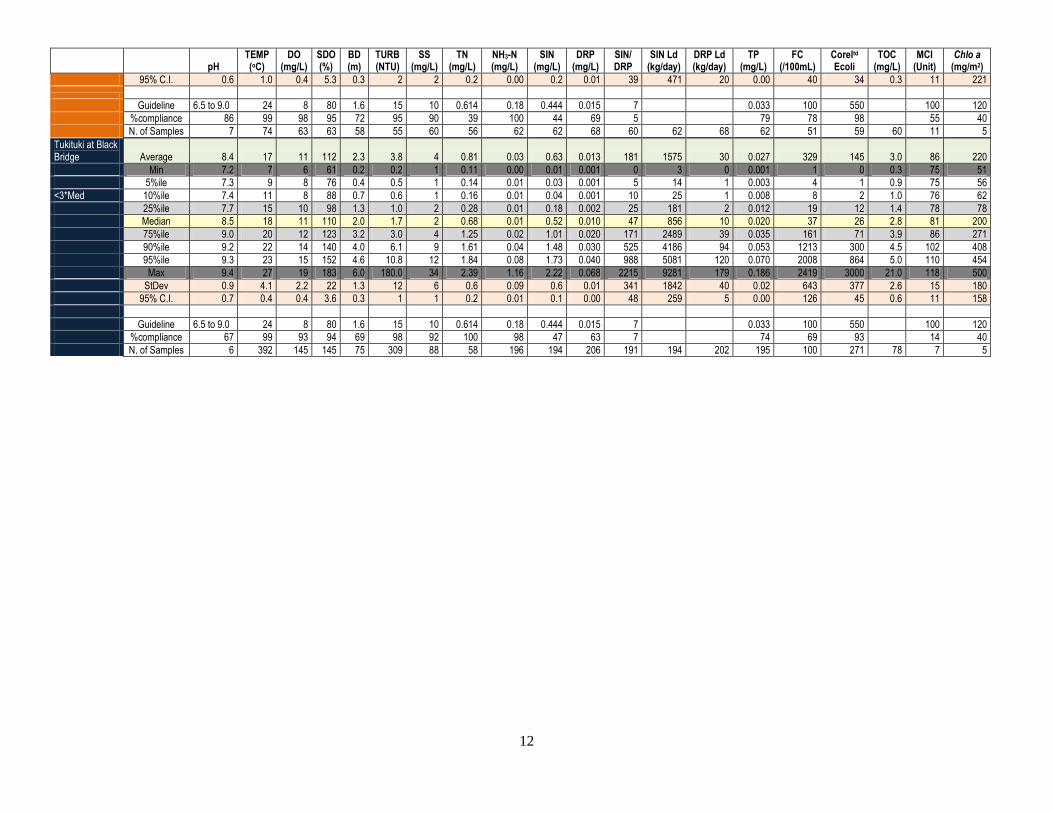
12
pH
TEMP (oC)
DO (mg/L)
SDO (%)
BD (m)
TURB (NTU)
SS (mg/L)
TN (mg/L)
NH3-N (mg/L)
SIN (mg/L)
DRP (mg/L)
SIN/ DRP
SIN Ld (kg/day)
DRP Ld (kg/day)
TP (mg/L)
FC (/100mL)
Coreltd Ecoli
TOC (mg/L)
MCI (Unit)
Chlo a (mg/m2)
95% C.I. 0.6 1.0 0.4 5.3 0.3 2 2 0.2 0.00 0.2 0.01 39 471 20 0.00 40 34 0.3 11 221
Guideline 6.5 to 9.0 24 8 80 1.6 15 10 0.614 0.18 0.444 0.015 7 0.033 100 550 100 120
%compliance 86 99 98 95 72 95 90 39 100 44 69 5 79 78 98 55 40
N. of Samples 7 74 63 63 58 55 60 56 62 62 68 60 62 68 62 51 59 60 11 5
Tukituki at Black Bridge Average 8.4 17 11 112 2.3 3.8 4 0.81 0.03 0.63 0.013 181 1575 30 0.027 329 145 3.0 86 220
Min 7.2 7 6 61 0.2 0.2 1 0.11 0.00 0.01 0.001 0 3 0 0.001 1 0 0.3 75 51
5%ile 7.3 9 8 76 0.4 0.5 1 0.14 0.01 0.03 0.001 5 14 1 0.003 4 1 0.9 75 56
<3*Med 10%ile 7.4 11 8 88 0.7 0.6 1 0.16 0.01 0.04 0.001 10 25 1 0.008 8 2 1.0 76 62
25%ile 7.7 15 10 98 1.3 1.0 2 0.28 0.01 0.18 0.002 25 181 2 0.012 19 12 1.4 78 78
Median 8.5 18 11 110 2.0 1.7 2 0.68 0.01 0.52 0.010 47 856 10 0.020 37 26 2.8 81 200
75%ile 9.0 20 12 123 3.2 3.0 4 1.25 0.02 1.01 0.020 171 2489 39 0.035 161 71 3.9 86 271
90%ile 9.2 22 14 140 4.0 6.1 9 1.61 0.04 1.48 0.030 525 4186 94 0.053 1213 300 4.5 102 408
95%ile 9.3 23 15 152 4.6 10.8 12 1.84 0.08 1.73 0.040 988 5081 120 0.070 2008 864 5.0 110 454
Max 9.4 27 19 183 6.0 180.0 34 2.39 1.16 2.22 0.068 2215 9281 179 0.186 2419 3000 21.0 118 500
StDev 0.9 4.1 2.2 22 1.3 12 6 0.6 0.09 0.6 0.01 341 1842 40 0.02 643 377 2.6 15 180
95% C.I. 0.7 0.4 0.4 3.6 0.3 1 1 0.2 0.01 0.1 0.00 48 259 5 0.00 126 45 0.6 11 158
Guideline 6.5 to 9.0 24 8 80 1.6 15 10 0.614 0.18 0.444 0.015 7 0.033 100 550 100 120
%compliance 67 99 93 94 69 98 92 100 98 47 63 7 74 69 93 14 40
N. of Samples 6 392 145 145 75 309 88 58 196 194 206 191 194 202 195 100 271 78 7 5
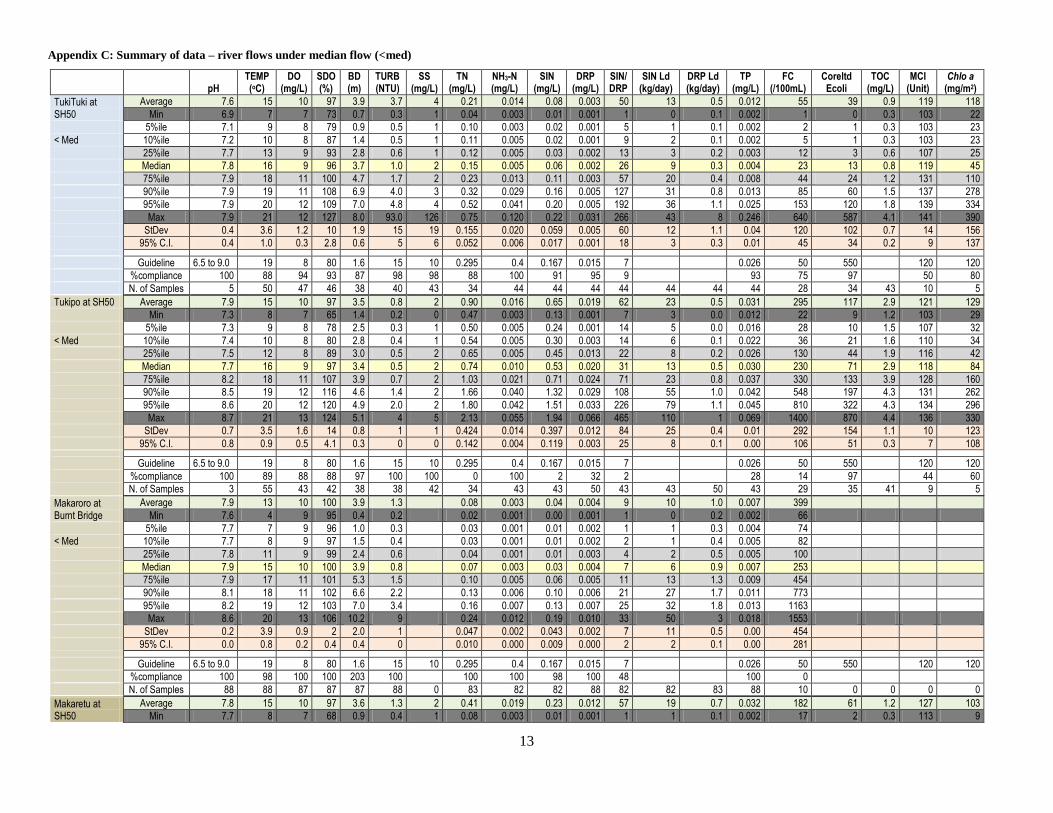
13
Appendix C: Summary of data – river flows under median flow (<med)
pH
TEMP (oC)
DO (mg/L)
SDO (%)
BD (m)
TURB (NTU)
SS (mg/L)
TN (mg/L)
NH3-N (mg/L)
SIN (mg/L)
DRP (mg/L)
SIN/ DRP
SIN Ld (kg/day)
DRP Ld (kg/day)
TP (mg/L)
FC (/100mL)
Coreltd Ecoli
TOC (mg/L)
MCI (Unit)
Chlo a (mg/m2)
TukiTuki at SH50
Average 7.6 15 10 97 3.9 3.7 4 0.21 0.014 0.08 0.003 50 13 0.5 0.012 55 39 0.9 119 118
Min 6.9 7 7 73 0.7 0.3 1 0.04 0.003 0.01 0.001 1 0 0.1 0.002 1 0 0.3 103 22
5%ile 7.1 9 8 79 0.9 0.5 1 0.10 0.003 0.02 0.001 5 1 0.1 0.002 2 1 0.3 103 23
< Med 10%ile 7.2 10 8 87 1.4 0.5 1 0.11 0.005 0.02 0.001 9 2 0.1 0.002 5 1 0.3 103 23
25%ile 7.7 13 9 93 2.8 0.6 1 0.12 0.005 0.03 0.002 13 3 0.2 0.003 12 3 0.6 107 25
Median 7.8 16 9 96 3.7 1.0 2 0.15 0.005 0.06 0.002 26 9 0.3 0.004 23 13 0.8 119 45
75%ile 7.9 18 11 100 4.7 1.7 2 0.23 0.013 0.11 0.003 57 20 0.4 0.008 44 24 1.2 131 110
90%ile 7.9 19 11 108 6.9 4.0 3 0.32 0.029 0.16 0.005 127 31 0.8 0.013 85 60 1.5 137 278
95%ile 7.9 20 12 109 7.0 4.8 4 0.52 0.041 0.20 0.005 192 36 1.1 0.025 153 120 1.8 139 334
Max 7.9 21 12 127 8.0 93.0 126 0.75 0.120 0.22 0.031 266 43 8 0.246 640 587 4.1 141 390
StDev 0.4 3.6 1.2 10 1.9 15 19 0.155 0.020 0.059 0.005 60 12 1.1 0.04 120 102 0.7 14 156
95% C.I. 0.4 1.0 0.3 2.8 0.6 5 6 0.052 0.006 0.017 0.001 18 3 0.3 0.01 45 34 0.2 9 137
Guideline 6.5 to 9.0 19 8 80 1.6 15 10 0.295 0.4 0.167 0.015 7 0.026 50 550 120 120
%compliance 100 88 94 93 87 98 98 88 100 91 95 9 93 75 97 50 80
N. of Samples 5 50 47 46 38 40 43 34 44 44 44 44 44 44 44 28 34 43 10 5
Tukipo at SH50 Average 7.9 15 10 97 3.5 0.8 2 0.90 0.016 0.65 0.019 62 23 0.5 0.031 295 117 2.9 121 129
Min 7.3 8 7 65 1.4 0.2 0 0.47 0.003 0.13 0.001 7 3 0.0 0.012 22 9 1.2 103 29
5%ile 7.3 9 8 78 2.5 0.3 1 0.50 0.005 0.24 0.001 14 5 0.0 0.016 28 10 1.5 107 32
< Med 10%ile 7.4 10 8 80 2.8 0.4 1 0.54 0.005 0.30 0.003 14 6 0.1 0.022 36 21 1.6 110 34
25%ile 7.5 12 8 89 3.0 0.5 2 0.65 0.005 0.45 0.013 22 8 0.2 0.026 130 44 1.9 116 42
Median 7.7 16 9 97 3.4 0.5 2 0.74 0.010 0.53 0.020 31 13 0.5 0.030 230 71 2.9 118 84
75%ile 8.2 18 11 107 3.9 0.7 2 1.03 0.021 0.71 0.024 71 23 0.8 0.037 330 133 3.9 128 160
90%ile 8.5 19 12 116 4.6 1.4 2 1.66 0.040 1.32 0.029 108 55 1.0 0.042 548 197 4.3 131 262
95%ile 8.6 20 12 120 4.9 2.0 2 1.80 0.042 1.51 0.033 226 79 1.1 0.045 810 322 4.3 134 296
Max 8.7 21 13 124 5.1 4 5 2.13 0.055 1.94 0.066 465 110 1 0.069 1400 870 4.4 136 330
StDev 0.7 3.5 1.6 14 0.8 1 1 0.424 0.014 0.397 0.012 84 25 0.4 0.01 292 154 1.1 10 123
95% C.I. 0.8 0.9 0.5 4.1 0.3 0 0 0.142 0.004 0.119 0.003 25 8 0.1 0.00 106 51 0.3 7 108
Guideline 6.5 to 9.0 19 8 80 1.6 15 10 0.295 0.4 0.167 0.015 7 0.026 50 550 120 120
%compliance 100 89 88 88 97 100 100 0 100 2 32 2 28 14 97 44 60
N. of Samples 3 55 43 42 38 38 42 34 43 43 50 43 43 50 43 29 35 41 9 5
Makaroro at Burnt Bridge
Average 7.9 13 10 100 3.9 1.3 0.08 0.003 0.04 0.004 9 10 1.0 0.007 399
Min 7.6 4 9 95 0.4 0.2 0.02 0.001 0.00 0.001 1 0 0.2 0.002 66
5%ile 7.7 7 9 96 1.0 0.3 0.03 0.001 0.01 0.002 1 1 0.3 0.004 74
< Med 10%ile 7.7 8 9 97 1.5 0.4 0.03 0.001 0.01 0.002 2 1 0.4 0.005 82
25%ile 7.8 11 9 99 2.4 0.6 0.04 0.001 0.01 0.003 4 2 0.5 0.005 100
Median 7.9 15 10 100 3.9 0.8 0.07 0.003 0.03 0.004 7 6 0.9 0.007 253
75%ile 7.9 17 11 101 5.3 1.5 0.10 0.005 0.06 0.005 11 13 1.3 0.009 454
90%ile 8.1 18 11 102 6.6 2.2 0.13 0.006 0.10 0.006 21 27 1.7 0.011 773
95%ile 8.2 19 12 103 7.0 3.4 0.16 0.007 0.13 0.007 25 32 1.8 0.013 1163
Max 8.6 20 13 106 10.2 9 0.24 0.012 0.19 0.010 33 50 3 0.018 1553
StDev 0.2 3.9 0.9 2 2.0 1 0.047 0.002 0.043 0.002 7 11 0.5 0.00 454
95% C.I. 0.0 0.8 0.2 0.4 0.4 0 0.010 0.000 0.009 0.000 2 2 0.1 0.00 281
Guideline 6.5 to 9.0 19 8 80 1.6 15 10 0.295 0.4 0.167 0.015 7 0.026 50 550 120 120
%compliance 100 98 100 100 203 100 100 100 98 100 48 100 0
N. of Samples 88 88 87 87 87 88 0 83 82 82 88 82 82 83 88 10 0 0 0 0
Makaretu at SH50
Average 7.8 15 10 97 3.6 1.3 2 0.41 0.019 0.23 0.012 57 19 0.7 0.032 182 61 1.2 127 103
Min 7.7 8 7 68 0.9 0.4 1 0.08 0.003 0.01 0.001 1 1 0.1 0.002 17 2 0.3 113 9
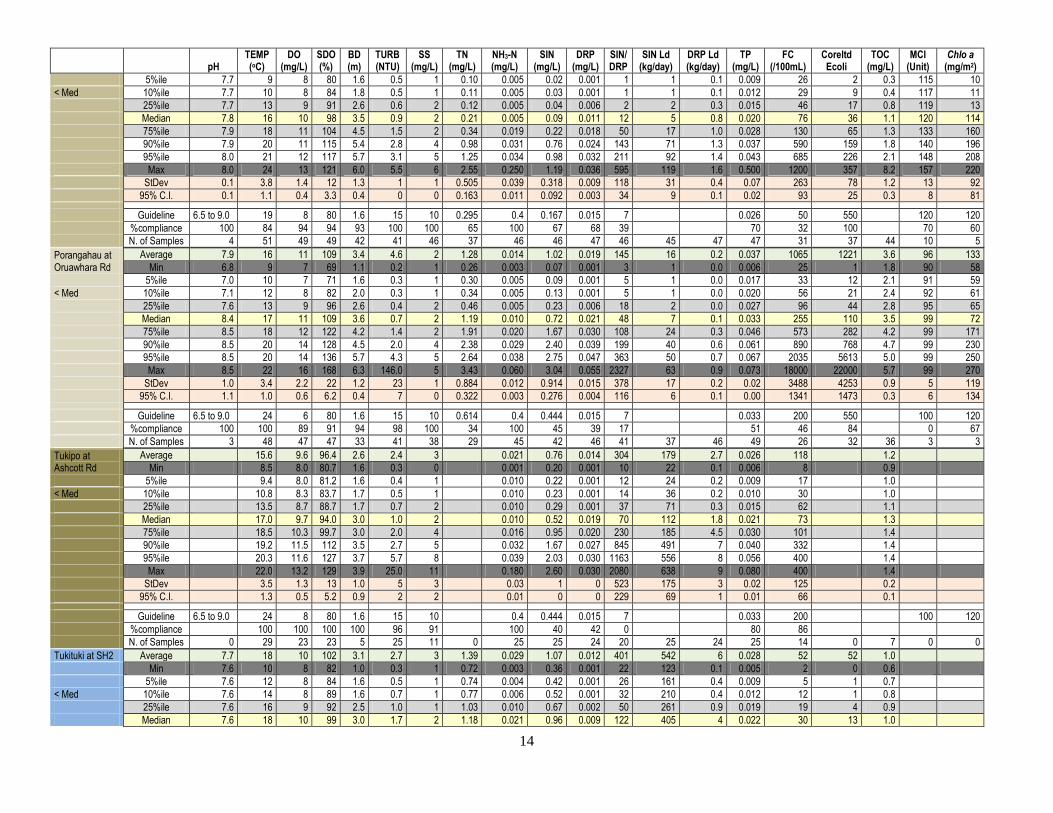
14
pH
TEMP (oC)
DO (mg/L)
SDO (%)
BD (m)
TURB (NTU)
SS (mg/L)
TN (mg/L)
NH3-N (mg/L)
SIN (mg/L)
DRP (mg/L)
SIN/ DRP
SIN Ld (kg/day)
DRP Ld (kg/day)
TP (mg/L)
FC (/100mL)
Coreltd Ecoli
TOC (mg/L)
MCI (Unit)
Chlo a (mg/m2)
5%ile 7.7 9 8 80 1.6 0.5 1 0.10 0.005 0.02 0.001 1 1 0.1 0.009 26 2 0.3 115 10
< Med 10%ile 7.7 10 8 84 1.8 0.5 1 0.11 0.005 0.03 0.001 1 1 0.1 0.012 29 9 0.4 117 11
25%ile 7.7 13 9 91 2.6 0.6 2 0.12 0.005 0.04 0.006 2 2 0.3 0.015 46 17 0.8 119 13
Median 7.8 16 10 98 3.5 0.9 2 0.21 0.005 0.09 0.011 12 5 0.8 0.020 76 36 1.1 120 114
75%ile 7.9 18 11 104 4.5 1.5 2 0.34 0.019 0.22 0.018 50 17 1.0 0.028 130 65 1.3 133 160
90%ile 7.9 20 11 115 5.4 2.8 4 0.98 0.031 0.76 0.024 143 71 1.3 0.037 590 159 1.8 140 196
95%ile 8.0 21 12 117 5.7 3.1 5 1.25 0.034 0.98 0.032 211 92 1.4 0.043 685 226 2.1 148 208
Max 8.0 24 13 121 6.0 5.5 6 2.55 0.250 1.19 0.036 595 119 1.6 0.500 1200 357 8.2 157 220
StDev 0.1 3.8 1.4 12 1.3 1 1 0.505 0.039 0.318 0.009 118 31 0.4 0.07 263 78 1.2 13 92
95% C.I. 0.1 1.1 0.4 3.3 0.4 0 0 0.163 0.011 0.092 0.003 34 9 0.1 0.02 93 25 0.3 8 81
Guideline 6.5 to 9.0 19 8 80 1.6 15 10 0.295 0.4 0.167 0.015 7 0.026 50 550 120 120
%compliance 100 84 94 94 93 100 100 65 100 67 68 39 70 32 100 70 60
N. of Samples 4 51 49 49 42 41 46 37 46 46 47 46 45 47 47 31 37 44 10 5
Porangahau at Oruawhara Rd
Average 7.9 16 11 109 3.4 4.6 2 1.28 0.014 1.02 0.019 145 16 0.2 0.037 1065 1221 3.6 96 133
Min 6.8 9 7 69 1.1 0.2 1 0.26 0.003 0.07 0.001 3 1 0.0 0.006 25 1 1.8 90 58
5%ile 7.0 10 7 71 1.6 0.3 1 0.30 0.005 0.09 0.001 5 1 0.0 0.017 33 12 2.1 91 59
< Med 10%ile 7.1 12 8 82 2.0 0.3 1 0.34 0.005 0.13 0.001 5 1 0.0 0.020 56 21 2.4 92 61
25%ile 7.6 13 9 96 2.6 0.4 2 0.46 0.005 0.23 0.006 18 2 0.0 0.027 96 44 2.8 95 65
Median 8.4 17 11 109 3.6 0.7 2 1.19 0.010 0.72 0.021 48 7 0.1 0.033 255 110 3.5 99 72
75%ile 8.5 18 12 122 4.2 1.4 2 1.91 0.020 1.67 0.030 108 24 0.3 0.046 573 282 4.2 99 171
90%ile 8.5 20 14 128 4.5 2.0 4 2.38 0.029 2.40 0.039 199 40 0.6 0.061 890 768 4.7 99 230
95%ile 8.5 20 14 136 5.7 4.3 5 2.64 0.038 2.75 0.047 363 50 0.7 0.067 2035 5613 5.0 99 250
Max 8.5 22 16 168 6.3 146.0 5 3.43 0.060 3.04 0.055 2327 63 0.9 0.073 18000 22000 5.7 99 270
StDev 1.0 3.4 2.2 22 1.2 23 1 0.884 0.012 0.914 0.015 378 17 0.2 0.02 3488 4253 0.9 5 119
95% C.I. 1.1 1.0 0.6 6.2 0.4 7 0 0.322 0.003 0.276 0.004 116 6 0.1 0.00 1341 1473 0.3 6 134
Guideline 6.5 to 9.0 24 6 80 1.6 15 10 0.614 0.4 0.444 0.015 7 0.033 200 550 100 120
%compliance 100 100 89 91 94 98 100 34 100 45 39 17 51 46 84 0 67
N. of Samples 3 48 47 47 33 41 38 29 45 42 46 41 37 46 49 26 32 36 3 3
Tukipo at Ashcott Rd
Average 15.6 9.6 96.4 2.6 2.4 3 0.021 0.76 0.014 304 179 2.7 0.026 118 1.2
Min 8.5 8.0 80.7 1.6 0.3 0 0.001 0.20 0.001 10 22 0.1 0.006 8 0.9
5%ile 9.4 8.0 81.2 1.6 0.4 1 0.010 0.22 0.001 12 24 0.2 0.009 17 1.0
< Med 10%ile 10.8 8.3 83.7 1.7 0.5 1 0.010 0.23 0.001 14 36 0.2 0.010 30 1.0
25%ile 13.5 8.7 88.7 1.7 0.7 2 0.010 0.29 0.001 37 71 0.3 0.015 62 1.1
Median 17.0 9.7 94.0 3.0 1.0 2 0.010 0.52 0.019 70 112 1.8 0.021 73 1.3
75%ile 18.5 10.3 99.7 3.0 2.0 4 0.016 0.95 0.020 230 185 4.5 0.030 101 1.4
90%ile 19.2 11.5 112 3.5 2.7 5 0.032 1.67 0.027 845 491 7 0.040 332 1.4
95%ile 20.3 11.6 127 3.7 5.7 8 0.039 2.03 0.030 1163 556 8 0.056 400 1.4
Max 22.0 13.2 129 3.9 25.0 11 0.180 2.60 0.030 2080 638 9 0.080 400 1.4
StDev 3.5 1.3 13 1.0 5 3 0.03 1 0 523 175 3 0.02 125 0.2
95% C.I. 1.3 0.5 5.2 0.9 2 2 0.01 0 0 229 69 1 0.01 66 0.1
Guideline 6.5 to 9.0 24 8 80 1.6 15 10 0.4 0.444 0.015 7 0.033 200 100 120
%compliance 100 100 100 100 96 91 100 40 42 0 80 86
N. of Samples 0 29 23 23 5 25 11 0 25 25 24 20 25 24 25 14 0 7 0 0
Tukituki at SH2 Average 7.7 18 10 102 3.1 2.7 3 1.39 0.029 1.07 0.012 401 542 6 0.028 52 52 1.0
Min 7.6 10 8 82 1.0 0.3 1 0.72 0.003 0.36 0.001 22 123 0.1 0.005 2 0 0.6
5%ile 7.6 12 8 84 1.6 0.5 1 0.74 0.004 0.42 0.001 26 161 0.4 0.009 5 1 0.7
< Med 10%ile 7.6 14 8 89 1.6 0.7 1 0.77 0.006 0.52 0.001 32 210 0.4 0.012 12 1 0.8
25%ile 7.6 16 9 92 2.5 1.0 1 1.03 0.010 0.67 0.002 50 261 0.9 0.019 19 4 0.9
Median 7.6 18 10 99 3.0 1.7 2 1.18 0.021 0.96 0.009 122 405 4 0.022 30 13 1.0
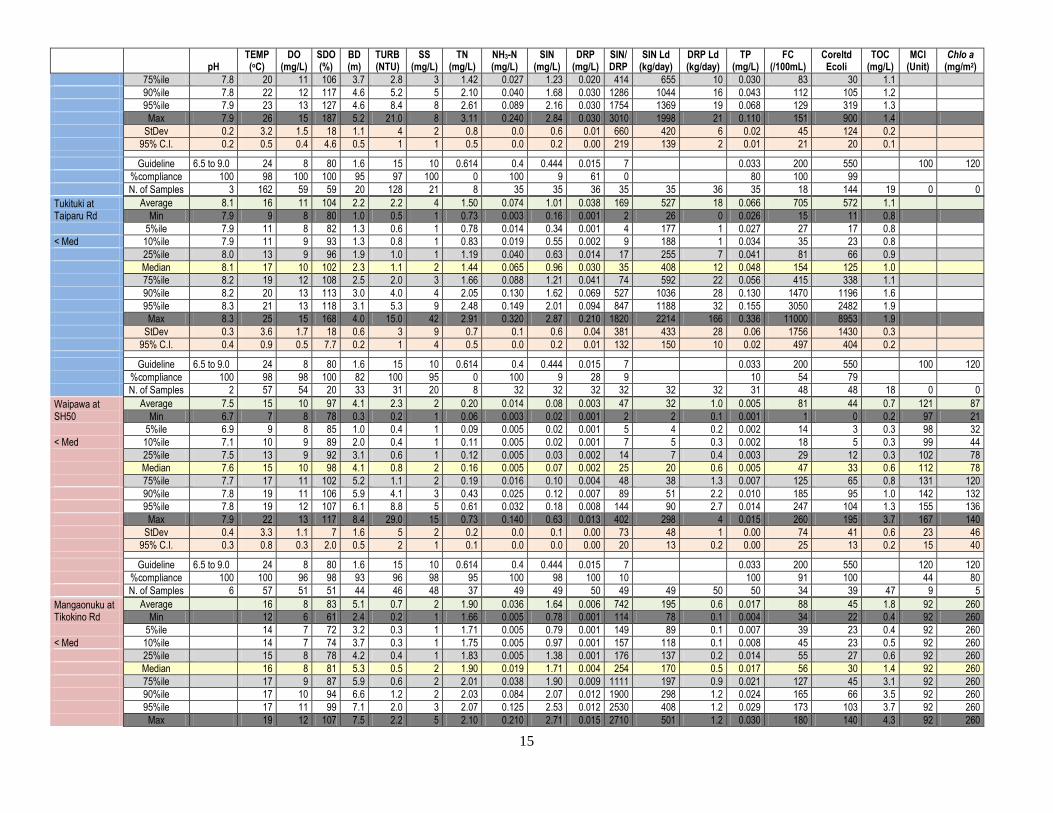
15
pH
TEMP (oC)
DO (mg/L)
SDO (%)
BD (m)
TURB (NTU)
SS (mg/L)
TN (mg/L)
NH3-N (mg/L)
SIN (mg/L)
DRP (mg/L)
SIN/ DRP
SIN Ld (kg/day)
DRP Ld (kg/day)
TP (mg/L)
FC (/100mL)
Coreltd Ecoli
TOC (mg/L)
MCI (Unit)
Chlo a (mg/m2)
75%ile 7.8 20 11 106 3.7 2.8 3 1.42 0.027 1.23 0.020 414 655 10 0.030 83 30 1.1
90%ile 7.8 22 12 117 4.6 5.2 5 2.10 0.040 1.68 0.030 1286 1044 16 0.043 112 105 1.2
95%ile 7.9 23 13 127 4.6 8.4 8 2.61 0.089 2.16 0.030 1754 1369 19 0.068 129 319 1.3
Max 7.9 26 15 187 5.2 21.0 8 3.11 0.240 2.84 0.030 3010 1998 21 0.110 151 900 1.4
StDev 0.2 3.2 1.5 18 1.1 4 2 0.8 0.0 0.6 0.01 660 420 6 0.02 45 124 0.2
95% C.I. 0.2 0.5 0.4 4.6 0.5 1 1 0.5 0.0 0.2 0.00 219 139 2 0.01 21 20 0.1
Guideline 6.5 to 9.0 24 8 80 1.6 15 10 0.614 0.4 0.444 0.015 7 0.033 200 550 100 120
%compliance 100 98 100 100 95 97 100 0 100 9 61 0 80 100 99
N. of Samples 3 162 59 59 20 128 21 8 35 35 36 35 35 36 35 18 144 19 0 0
Tukituki at Taiparu Rd
Average 8.1 16 11 104 2.2 2.2 4 1.50 0.074 1.01 0.038 169 527 18 0.066 705 572 1.1
Min 7.9 9 8 80 1.0 0.5 1 0.73 0.003 0.16 0.001 2 26 0 0.026 15 11 0.8
5%ile 7.9 11 8 82 1.3 0.6 1 0.78 0.014 0.34 0.001 4 177 1 0.027 27 17 0.8
< Med 10%ile 7.9 11 9 93 1.3 0.8 1 0.83 0.019 0.55 0.002 9 188 1 0.034 35 23 0.8
25%ile 8.0 13 9 96 1.9 1.0 1 1.19 0.040 0.63 0.014 17 255 7 0.041 81 66 0.9
Median 8.1 17 10 102 2.3 1.1 2 1.44 0.065 0.96 0.030 35 408 12 0.048 154 125 1.0
75%ile 8.2 19 12 108 2.5 2.0 3 1.66 0.088 1.21 0.041 74 592 22 0.056 415 338 1.1
90%ile 8.2 20 13 113 3.0 4.0 4 2.05 0.130 1.62 0.069 527 1036 28 0.130 1470 1196 1.6
95%ile 8.3 21 13 118 3.1 5.3 9 2.48 0.149 2.01 0.094 847 1188 32 0.155 3050 2482 1.9
Max 8.3 25 15 168 4.0 15.0 42 2.91 0.320 2.87 0.210 1820 2214 166 0.336 11000 8953 1.9
StDev 0.3 3.6 1.7 18 0.6 3 9 0.7 0.1 0.6 0.04 381 433 28 0.06 1756 1430 0.3
95% C.I. 0.4 0.9 0.5 7.7 0.2 1 4 0.5 0.0 0.2 0.01 132 150 10 0.02 497 404 0.2
Guideline 6.5 to 9.0 24 8 80 1.6 15 10 0.614 0.4 0.444 0.015 7 0.033 200 550 100 120
%compliance 100 98 98 100 82 100 95 0 100 9 28 9 10 54 79
N. of Samples 2 57 54 20 33 31 20 8 32 32 32 32 32 32 31 48 48 18 0 0
Waipawa at SH50
Average 7.5 15 10 97 4.1 2.3 2 0.20 0.014 0.08 0.003 47 32 1.0 0.005 81 44 0.7 121 87
Min 6.7 7 8 78 0.3 0.2 1 0.06 0.003 0.02 0.001 2 2 0.1 0.001 1 0 0.2 97 21
5%ile 6.9 9 8 85 1.0 0.4 1 0.09 0.005 0.02 0.001 5 4 0.2 0.002 14 3 0.3 98 32
< Med 10%ile 7.1 10 9 89 2.0 0.4 1 0.11 0.005 0.02 0.001 7 5 0.3 0.002 18 5 0.3 99 44
25%ile 7.5 13 9 92 3.1 0.6 1 0.12 0.005 0.03 0.002 14 7 0.4 0.003 29 12 0.3 102 78
Median 7.6 15 10 98 4.1 0.8 2 0.16 0.005 0.07 0.002 25 20 0.6 0.005 47 33 0.6 112 78
75%ile 7.7 17 11 102 5.2 1.1 2 0.19 0.016 0.10 0.004 48 38 1.3 0.007 125 65 0.8 131 120
90%ile 7.8 19 11 106 5.9 4.1 3 0.43 0.025 0.12 0.007 89 51 2.2 0.010 185 95 1.0 142 132
95%ile 7.8 19 12 107 6.1 8.8 5 0.61 0.032 0.18 0.008 144 90 2.7 0.014 247 104 1.3 155 136
Max 7.9 22 13 117 8.4 29.0 15 0.73 0.140 0.63 0.013 402 298 4 0.015 260 195 3.7 167 140
StDev 0.4 3.3 1.1 7 1.6 5 2 0.2 0.0 0.1 0.00 73 48 1 0.00 74 41 0.6 23 46
95% C.I. 0.3 0.8 0.3 2.0 0.5 2 1 0.1 0.0 0.0 0.00 20 13 0.2 0.00 25 13 0.2 15 40
Guideline 6.5 to 9.0 24 8 80 1.6 15 10 0.614 0.4 0.444 0.015 7 0.033 200 550 120 120
%compliance 100 100 96 98 93 96 98 95 100 98 100 10 100 91 100 44 80
N. of Samples 6 57 51 51 44 46 48 37 49 49 50 49 49 50 50 34 39 47 9 5
Mangaonuku at Tikokino Rd
Average 16 8 83 5.1 0.7 2 1.90 0.036 1.64 0.006 742 195 0.6 0.017 88 45 1.8 92 260
Min 12 6 61 2.4 0.2 1 1.66 0.005 0.78 0.001 114 78 0.1 0.004 34 22 0.4 92 260
5%ile 14 7 72 3.2 0.3 1 1.71 0.005 0.79 0.001 149 89 0.1 0.007 39 23 0.4 92 260
< Med 10%ile 14 7 74 3.7 0.3 1 1.75 0.005 0.97 0.001 157 118 0.1 0.008 45 23 0.5 92 260
25%ile 15 8 78 4.2 0.4 1 1.83 0.005 1.38 0.001 176 137 0.2 0.014 55 27 0.6 92 260
Median 16 8 81 5.3 0.5 2 1.90 0.019 1.71 0.004 254 170 0.5 0.017 56 30 1.4 92 260
75%ile 17 9 87 5.9 0.6 2 2.01 0.038 1.90 0.009 1111 197 0.9 0.021 127 45 3.1 92 260
90%ile 17 10 94 6.6 1.2 2 2.03 0.084 2.07 0.012 1900 298 1.2 0.024 165 66 3.5 92 260
95%ile 17 11 99 7.1 2.0 3 2.07 0.125 2.53 0.012 2530 408 1.2 0.029 173 103 3.7 92 260
Max 19 12 107 7.5 2.2 5 2.10 0.210 2.71 0.015 2710 501 1.2 0.030 180 140 4.3 92 260

16
pH
TEMP (oC)
DO (mg/L)
SDO (%)
BD (m)
TURB (NTU)
SS (mg/L)
TN (mg/L)
NH3-N (mg/L)
SIN (mg/L)
DRP (mg/L)
SIN/ DRP
SIN Ld (kg/day)
DRP Ld (kg/day)
TP (mg/L)
FC (/100mL)
Coreltd Ecoli
TOC (mg/L)
MCI (Unit)
Chlo a (mg/m2)
StDev 1.4 1.4 10 1.3 1 1 0.1 0.1 0.5 0.00 828 102 0.4 0.01 61 34 1.3
95% C.I. 0.6 0.6 4.4 0.6 0 0 0.1 0.0 0.2 0.00 363 45 0.2 0.00 49 20 0.6
Guideline 24 8 80 1.6 15 10 0.614 0.4 0.444 0.015 7 0.033 200 550 100 120
%compliance 100 55 50 100 100 100 0 100 0 100 0 100 100 100 0 0
N. of Samples 0 22 20 20 16 17 19 11 20 20 21 20 20 21 21 6 11 17 1 1
Waipawa D/s Waipawa Oxpond
Average 17 13 16.0 13 0.056 0.035 13 851 291
Min 10 4 0.5 1 0.005 0.010 5.5 9 1
5%ile 11 4 0.6 1 0.011 0.019 5.7 48 22
10%ile 12 4 0.6 1 0.016 0.019 6.0 140 31
25%ile 14 8 0.7 1 0.032 0.023 9 150 55
< Med Median 17 9 0.9 1 0.060 0.035 11 250 110
75%ile 19 10 1.1 2 0.070 0.046 17 480 280
90%ile 22 11 1.8 3 0.086 0.051 20 753 323
95%ile 24 22 18.3 15 0.102 0.060 21 2780 488
Max 27 105 300.0 220 0.110 0.067 26 10000 3100
StDev 4.3 22.3 67 49 0.0 0.01 5.74 2211 670
95% C.I. 1.9 10.0 29 21 0.0 0.01 2.52 969 294 0
Guideline 6.5 to 9.0 24 8 80 1.6 15 10 0.614 0.4 0.444 0.015 7 8 9 0.033 200 550 100 120
%compliance 110 58 85 95 111 105 30 50
N. of Samples 0 20 19 0 0 20 20 0 18 0 20 0 0 20 0 20 20 0 0 0
Tukituki at Shagrock + Tamumu
Average 8.6 17 11 109 3.2 1.0 2 1.02 0.017 0.79 0.013 144 767 11 0.027 117 45 2.1 123 230
Min 8.5 10 8 82 1.1 0.2 1 0.25 0.00 0.16 0.001 20 59 1 0.006 1 0 0.4 104 230
5%ile 8.5 11 8 86 1.3 0.4 1 0.51 0.00 0.30 0.001 21 133 1 0.011 7 1 0.6 106 230
10%ile 8.5 12 8 88 2.2 0.5 1 0.59 0.00 0.38 0.002 22 161 1 0.015 17 1 0.7 109 230
25%ile 8.5 14 9 95 2.7 0.6 2 0.65 0.01 0.48 0.005 28 319 3 0.021 39 2 1.1 115 230
< Med Median 8.6 17 10 102 3.0 0.8 2 0.97 0.01 0.68 0.010 61 597 7 0.027 80 15 1.8 123 230
75%ile 8.7 19 12 121 3.6 1.2 2 1.24 0.02 0.97 0.021 136 822 16 0.031 145 44 3.0 129 230
90%ile 8.7 20 13 135 4.2 1.7 2 1.52 0.04 1.31 0.025 320 1646 22 0.038 286 92 3.8 137 230
95%ile 8.7 23 13 141 5.2 2.2 3 2.06 0.05 1.66 0.027 821 2380 30 0.047 390 252 3.9 141 230
Max 8.7 25 15 168 6.8 3.2 5 2.41 0.10 2.24 0.032 950 3192 39 0.057 460 300 4.2 145 230
StDev 0.1 3.6 1.6 19 1.1 1 1 0.5 0.02 0.5 0.01 225 739 10 0.01 118 79 1.2 14 #DIV/0!
95% C.I. 0.2 0.8 0.4 4.5 0.3 0 0 0.2 0.01 0.1 0.00 70 229 3 0.00 32 28 0.4 11 #DIV/0!
Guideline 24 8 80 1.6 15 10 0.614 0.4 0.444 0.015 7 0.033 200 100 120
%compliance 97 99 100 93 100 100 15 100 18 59 0 77 84 100 0
N. of Samples 3 72 68 68 58 39 43 33 41 40 44 40 40 44 44 51 30 39 6 1
Tukituki at Red Bridge
Average 9.1 18 11 117 3.0 1.2 2 0.61 0.01 0.37 0.006 127 456 6 0.013 37 23 2.6 102 326
Min 8.6 9 7 74 1.6 0.2 1 0.11 0.00 0.02 0.001 3 8 0 0.003 1 1 0.5 78 84
5%ile 8.6 12 8 86 1.8 0.3 1 0.13 0.00 0.02 0.001 6 9 0 0.005 4 1 1.0 80 106
< Med 10%ile 8.6 13 9 93 1.9 0.4 1 0.17 0.01 0.03 0.001 9 12 0 0.006 6 1 1.1 82 127
25%ile 8.7 15 10 106 2.1 0.6 2 0.25 0.01 0.06 0.002 21 25 1 0.008 14 3 1.6 87 192
Median 8.9 20 11 116 2.9 0.8 2 0.42 0.01 0.24 0.002 73 218 2 0.012 26 11 2.8 103 279
75%ile 9.3 21 12 129 3.7 1.4 2 0.93 0.01 0.51 0.008 131 473 5 0.016 39 30 3.4 119 413
90%ile 9.6 23 14 138 4.5 1.9 2 1.33 0.03 0.97 0.012 346 1444 16 0.024 70 65 3.9 120 561
95%ile 9.7 23 14 155 5.0 2.2 3 1.61 0.03 1.14 0.022 387 1775 36 0.027 93 80 4.3 121 611
Max 9.8 27 16 170 6.1 7.3 7 1.81 0.04 1.62 0.028 810 2300 40 0.032 260 110 5.5 121 660
StDev 0.7 3.9 1.8 20 1.1 1 1 0.5 0.01 0.4 0.01 165 621 10 0.01 49 29 1.2 18 245
95% C.I. 0.7 1.1 0.6 6.4 0.4 0 0 0.2 0.00 0.1 0.00 54 200 3 0.00 18 10 0.4 13 240
Guideline 6.5 to 9.0 24 8 80 1.6 15 10 0.614 0.18 0.444 0.015 7 0.033 100 550 100 120

17
pH
TEMP (oC)
DO (mg/L)
SDO (%)
BD (m)
TURB (NTU)
SS (mg/L)
TN (mg/L)
NH3-N (mg/L)
SIN (mg/L)
DRP (mg/L)
SIN/ DRP
SIN Ld (kg/day)
DRP Ld (kg/day)
TP (mg/L)
FC (/100mL)
Coreltd Ecoli
TOC (mg/L)
MCI (Unit)
Chlo a (mg/m2)
%compliance 67 98 97 97 100 100 100 62 100 68 90 8 100 93 100 50 25
N. of Samples 3 46 39 39 35 32 36 34 37 37 41 36 37 41 37 29 35 36 8 4
BD 3.5 29
Tukituki at Black Bridge Average 8.6 19 11 115 2.9 1.7 2 0.55 0.03 0.35 0.008 122 437 9 0.020 339 133 2.4 86 220
Min 7.5 9 6 61 1.1 0.2 1 0.11 0.00 0.01 0.001 0 3 0 0.003 2 0 0.5 75 51
5%ile 7.6 12 7 76 1.4 0.4 1 0.13 0.01 0.02 0.001 3 7 1 0.003 4 1 0.8 75 56
< Med 10%ile 7.8 14 8 88 1.7 0.5 1 0.15 0.01 0.03 0.001 5 15 1 0.007 6 1 1.0 76 62
25%ile 8.2 17 10 100 1.9 0.9 2 0.19 0.01 0.05 0.001 15 45 1 0.010 13 9 1.2 78 78
Median 8.8 19 11 115 2.9 1.3 2 0.37 0.01 0.22 0.005 40 217 3 0.016 30 22 1.8 81 200
75%ile 9.1 21 12 131 3.7 2.0 2 0.73 0.02 0.53 0.011 136 561 12 0.020 97 53 3.4 86 271
90%ile 9.3 23 13 142 4.3 3.0 4 1.37 0.03 0.96 0.020 263 1253 29 0.030 1280 246 4.2 102 408
95%ile 9.3 24 14 150 5.3 4.2 6 1.54 0.05 1.16 0.022 491 1532 33 0.041 1961 821 4.8 110 454
Max 9.4 27 17 174 6.0 15.0 7 1.80 1.16 1.61 0.048 1540 2206 52 0.186 2419 3000 9.3 118 500
StDev 1.0 3.3 2.2 22 1.2 2 2 0.5 0.11 0.4 0.01 231 535 11 0.02 669 379 1.6 15 180
95% C.I. 1.1 0.4 0.5 4.8 0.3 0 0 0.1 0.02 0.1 0.00 45 103 2 0.00 165 51 0.5 11 158
Guideline 6.5 to 9.0 24 8 80 1.6 15 10 0.614 0.18 0.444 0.015 7 0.033 100 550 100 120
%compliance 67 98 89 94 92 100 100 100 98 70 78 13 91 75 93 14 40
N. of Samples 3 264 84 84 48 213 53 38 108 105 111 103 104 108 107 63 209 49 7 5

18
Appendix D: Summary of data – river flows under lower quartile flow (<LQ)
pH
TEMP (oC)
DO (mg/L)
SDO (%)
BD (m)
TURB (NTU)
SS (mg/L)
TN (mg/L)
NH3-N (mg/L)
SIN (mg/L)
DRP (mg/L)
SIN/ DRP
SIN Ld (kg/day)
DRP Ld (kg/day)
TP (mg/L)
FC (/100mL)
Coreltd Ecoli
TOC (mg/L)
MCI (Unit)
Chlo a (mg/m2)
TukiTuki at SH50
Average 6.9 16 9 98 4.3 4.9 6 0.20 0.013 0.06 0.003 46 8 0.3 0.016 71 48 1.0 119 118
Min 6.9 10 7 77 0.8 0.3 1 0.10 0.003 0.01 0.001 1 0 0.1 0.002 3 1 0.3 103 22
5%ile 6.9 10 8 85 1.5 0.5 1 0.11 0.003 0.02 0.001 4 1 0.1 0.002 6 1 0.3 104 23
< LQ 10%ile 6.9 12 8 90 2.3 0.5 1 0.12 0.004 0.02 0.001 8 1 0.1 0.002 8 1 0.4 104 23
25%ile 6.9 14 9 94 3.1 0.5 1 0.12 0.005 0.02 0.002 11 2 0.1 0.003 13 3 0.6 110 25
Median 6.9 17 9 96 4.2 0.7 2 0.14 0.005 0.04 0.002 16 4 0.2 0.004 27 11 0.8 119 45
75%ile 6.9 19 10 100 5.8 1.4 2 0.23 0.010 0.09 0.003 54 12 0.3 0.010 41 26 1.4 126 110
90%ile 6.9 19 11 109 6.9 1.7 2 0.33 0.024 0.14 0.004 123 22 0.6 0.018 135 90 1.6 136 278
95%ile 6.9 20 12 109 7.3 8.0 4 0.40 0.038 0.17 0.005 180 24 0.6 0.032 240 150 2.1 139 334
Max 6.9 21 12 127 8.0 93.0 126 0.73 0.120 0.20 0.017 266 27 1 0.246 640 587 4.1 141 390
StDev 3.2 1.2 9 1.9 18 24 0.147 0.023 0.055 0.003 63 8 0.2 0.05 148 123 0.8 13 156
95% C.I. 1.1 0.4 3.4 0.7 7 9 0.063 0.008 0.020 0.001 23 3 0.1 0.02 69 50 0.3 9 137
Guideline 6.5 to 9.0 19 8 80 1.6 15 10 0.295 0.4 0.167 0.015 7 0.026 100 550 120 120
%compliance 100 84 93 97 92 96 96 86 100 93 96 11 89 83 96 50 80
N. of Samples 1 31 30 29 25 25 27 21 28 28 28 28 28 28 28 18 23 27 8 5
Tukipo at SH50 Average 7.5 16 9 96 3.6 0.6 1 0.82 0.016 0.57 0.021 59 12 0.4 0.034 287 105 2.7 118 79
Min 7.3 9 7 73 2.6 0.2 1 0.48 0.005 0.18 0.001 7 3 0.0 0.012 38 11 1.2 103 29
5%ile 7.3 10 8 80 2.8 0.2 1 0.51 0.005 0.25 0.001 14 5 0.0 0.022 81 27 1.3 105 31
< LQ 10%ile 7.3 11 8 80 2.8 0.3 1 0.55 0.005 0.36 0.003 15 6 0.1 0.023 118 32 1.5 108 33
25%ile 7.4 15 8 89 3.1 0.4 1 0.63 0.005 0.47 0.014 21 7 0.2 0.029 190 56 1.7 113 39
Median 7.5 17 9 93 3.4 0.5 2 0.70 0.010 0.55 0.020 28 10 0.4 0.034 260 86 2.5 117 63
75%ile 7.6 18 11 107 4.0 0.7 2 0.83 0.019 0.61 0.026 52 13 0.6 0.038 350 132 3.9 124 103
90%ile 7.6 20 12 112 4.6 0.9 2 1.19 0.039 0.73 0.031 90 18 0.7 0.044 484 156 4.3 128 137
95%ile 7.7 20 12 112 4.7 1.4 2 1.69 0.053 0.93 0.043 167 20 0.9 0.045 562 219 4.4 129 149
Max 7.7 21 12 116 4.9 3 2 1.80 0.055 1.39 0.066 465 42 1 0.069 660 400 4.4 130 160
StDev 0.3 3.3 1.5 12 0.7 1 0 0.354 0.015 0.237 0.014 94 8 0.3 0.01 162 85 1.1 10 59
95% C.I. 0.4 1.1 0.6 4.8 0.3 0 0 0.155 0.006 0.095 0.005 38 3 0.1 0.00 82 37 0.5 8 58
Guideline 6.5 to 9.0 19 8 80 1.6 15 10 0.295 0.4 0.167 0.015 7 0.026 100 550 120 120
%compliance 100 88 85 88 100 100 100 0 100 0 28 4 21 13 100 33 75
N. of Samples 2 32 26 25 22 20 23 20 24 24 29 24 24 29 24 15 20 23 6 4
Makaroro at Burnt Bridge
Average 7.9 16 10 101 4.9 0.6 0.07 0.004 0.03 0.004 7 6 0.7 0.006 84
Min 7.7 7 9 96 1.9 0.2 0.02 0.001 0.00 0.002 1 0 0.3 0.002 84
5%ile 7.7 10 9 96 2.5 0.3 0.03 0.001 0.01 0.002 1 1 0.3 0.003 84
< LQ 10%ile 7.8 11 9 98 3.3 0.3 0.03 0.001 0.01 0.002 2 1 0.3 0.004 84
25%ile 7.8 14 9 100 4.1 0.4 0.04 0.002 0.01 0.003 3 1 0.4 0.005 84
Median 7.9 16 10 100 4.9 0.6 0.05 0.004 0.02 0.004 4 2 0.5 0.006 84
75%ile 8.0 18 10 102 5.7 0.8 0.08 0.005 0.03 0.005 9 5 0.9 0.007 84
90%ile 8.2 19 11 104 6.9 1.0 0.13 0.006 0.09 0.006 15 15 1.1 0.009 84
95%ile 8.3 19 11 105 7.1 1.2 0.20 0.006 0.14 0.007 23 28 1.2 0.010 84
Max 8.6 20 12 106 8.0 2 0.24 0.007 0.19 0.009 28 35 2 0.014 84
StDev 0.2 3.0 0.7 2 1.4 0 0.055 0.002 0.047 0.002 7 9 0.3 0.00
95% C.I. 0.1 1.0 0.2 0.8 0.5 0 0.019 0.001 0.017 0.001 2 3 0.1 0.00
Guideline 6.5 to 9.0 19 8 80 1.6 15 10 0.295 0.4 0.167 0.015 7 0.026 100 550 120 120
%compliance 100 94 100 100 100 100 100 100 97 100 63 100 100
N. of Samples 35 35 34 34 35 35 0 31 30 30 35 30 30 31 35 1 0 0 0 0
Makaretu at SH50
Average 17 9 97 4.1 1.1 2 0.31 0.015 0.10 0.015 27 6 0.6 0.043 168 69 1.3 125 89
Min 9 8 81 2.0 0.4 1 0.08 0.005 0.01 0.001 1 1 0.1 0.012 17 2 0.3 113 9
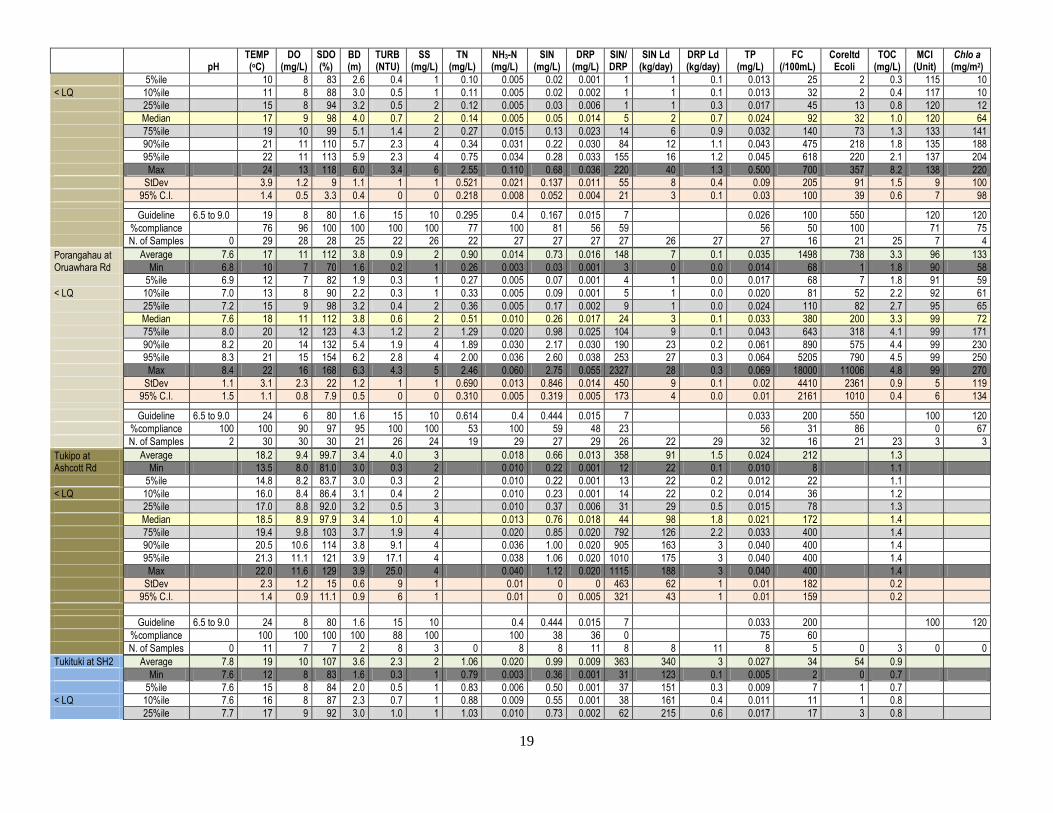
19
pH
TEMP (oC)
DO (mg/L)
SDO (%)
BD (m)
TURB (NTU)
SS (mg/L)
TN (mg/L)
NH3-N (mg/L)
SIN (mg/L)
DRP (mg/L)
SIN/ DRP
SIN Ld (kg/day)
DRP Ld (kg/day)
TP (mg/L)
FC (/100mL)
Coreltd Ecoli
TOC (mg/L)
MCI (Unit)
Chlo a (mg/m2)
5%ile 10 8 83 2.6 0.4 1 0.10 0.005 0.02 0.001 1 1 0.1 0.013 25 2 0.3 115 10
< LQ 10%ile 11 8 88 3.0 0.5 1 0.11 0.005 0.02 0.002 1 1 0.1 0.013 32 2 0.4 117 10
25%ile 15 8 94 3.2 0.5 2 0.12 0.005 0.03 0.006 1 1 0.3 0.017 45 13 0.8 120 12
Median 17 9 98 4.0 0.7 2 0.14 0.005 0.05 0.014 5 2 0.7 0.024 92 32 1.0 120 64
75%ile 19 10 99 5.1 1.4 2 0.27 0.015 0.13 0.023 14 6 0.9 0.032 140 73 1.3 133 141
90%ile 21 11 110 5.7 2.3 4 0.34 0.031 0.22 0.030 84 12 1.1 0.043 475 218 1.8 135 188
95%ile 22 11 113 5.9 2.3 4 0.75 0.034 0.28 0.033 155 16 1.2 0.045 618 220 2.1 137 204
Max 24 13 118 6.0 3.4 6 2.55 0.110 0.68 0.036 220 40 1.3 0.500 700 357 8.2 138 220
StDev 3.9 1.2 9 1.1 1 1 0.521 0.021 0.137 0.011 55 8 0.4 0.09 205 91 1.5 9 100
95% C.I. 1.4 0.5 3.3 0.4 0 0 0.218 0.008 0.052 0.004 21 3 0.1 0.03 100 39 0.6 7 98
Guideline 6.5 to 9.0 19 8 80 1.6 15 10 0.295 0.4 0.167 0.015 7 0.026 100 550 120 120
%compliance 76 96 100 100 100 100 77 100 81 56 59 56 50 100 71 75
N. of Samples 0 29 28 28 25 22 26 22 27 27 27 27 26 27 27 16 21 25 7 4
Porangahau at Oruawhara Rd
Average 7.6 17 11 112 3.8 0.9 2 0.90 0.014 0.73 0.016 148 7 0.1 0.035 1498 738 3.3 96 133
Min 6.8 10 7 70 1.6 0.2 1 0.26 0.003 0.03 0.001 3 0 0.0 0.014 68 1 1.8 90 58
5%ile 6.9 12 7 82 1.9 0.3 1 0.27 0.005 0.07 0.001 4 1 0.0 0.017 68 7 1.8 91 59
< LQ 10%ile 7.0 13 8 90 2.2 0.3 1 0.33 0.005 0.09 0.001 5 1 0.0 0.020 81 52 2.2 92 61
25%ile 7.2 15 9 98 3.2 0.4 2 0.36 0.005 0.17 0.002 9 1 0.0 0.024 110 82 2.7 95 65
Median 7.6 18 11 112 3.8 0.6 2 0.51 0.010 0.26 0.017 24 3 0.1 0.033 380 200 3.3 99 72
75%ile 8.0 20 12 123 4.3 1.2 2 1.29 0.020 0.98 0.025 104 9 0.1 0.043 643 318 4.1 99 171
90%ile 8.2 20 14 132 5.4 1.9 4 1.89 0.030 2.17 0.030 190 23 0.2 0.061 890 575 4.4 99 230
95%ile 8.3 21 15 154 6.2 2.8 4 2.00 0.036 2.60 0.038 253 27 0.3 0.064 5205 790 4.5 99 250
Max 8.4 22 16 168 6.3 4.3 5 2.46 0.060 2.75 0.055 2327 28 0.3 0.069 18000 11006 4.8 99 270
StDev 1.1 3.1 2.3 22 1.2 1 1 0.690 0.013 0.846 0.014 450 9 0.1 0.02 4410 2361 0.9 5 119
95% C.I. 1.5 1.1 0.8 7.9 0.5 0 0 0.310 0.005 0.319 0.005 173 4 0.0 0.01 2161 1010 0.4 6 134
Guideline 6.5 to 9.0 24 6 80 1.6 15 10 0.614 0.4 0.444 0.015 7 0.033 200 550 100 120
%compliance 100 100 90 97 95 100 100 53 100 59 48 23 56 31 86 0 67
N. of Samples 2 30 30 30 21 26 24 19 29 27 29 26 22 29 32 16 21 23 3 3
Tukipo at Ashcott Rd
Average 18.2 9.4 99.7 3.4 4.0 3
0.018 0.66 0.013 358 91 1.5 0.024 212 1.3
Min 13.5 8.0 81.0 3.0 0.3 2 0.010 0.22 0.001 12 22 0.1 0.010 8 1.1
5%ile 14.8 8.2 83.7 3.0 0.3 2 0.010 0.22 0.001 13 22 0.2 0.012 22 1.1
< LQ 10%ile 16.0 8.4 86.4 3.1 0.4 2 0.010 0.23 0.001 14 22 0.2 0.014 36 1.2
25%ile 17.0 8.8 92.0 3.2 0.5 3 0.010 0.37 0.006 31 29 0.5 0.015 78 1.3
Median 18.5 8.9 97.9 3.4 1.0 4
0.013 0.76 0.018 44 98 1.8 0.021 172 1.4
75%ile 19.4 9.8 103 3.7 1.9 4 0.020 0.85 0.020 792 126 2.2 0.033 400 1.4
90%ile 20.5 10.6 114 3.8 9.1 4 0.036 1.00 0.020 905 163 3 0.040 400 1.4
95%ile 21.3 11.1 121 3.9 17.1 4 0.038 1.06 0.020 1010 175 3 0.040 400 1.4
Max 22.0 11.6 129 3.9 25.0 4 0.040 1.12 0.020 1115 188 3 0.040 400 1.4
StDev 2.3 1.2 15 0.6 9 1 0.01 0 0 463 62 1 0.01 182 0.2
95% C.I. 1.4 0.9 11.1 0.9 6 1 0.01 0 0.005 321 43 1 0.01 159 0.2
Guideline 6.5 to 9.0 24 8 80 1.6 15 10 0.4 0.444 0.015 7 0.033 200 100 120
%compliance 100 100 100 100 88 100 100 38 36 0 75 60
N. of Samples 0 11 7 7 2 8 3 0 8 8 11 8 8 11 8 5 0 3 0 0
Tukituki at SH2 Average 7.8 19 10 107 3.6 2.3 2 1.06 0.020 0.99 0.009 363 340 3 0.027 34 54 0.9
Min 7.6 12 8 83 1.6 0.3 1 0.79 0.003 0.36 0.001 31 123 0.1 0.005 2 0 0.7
5%ile 7.6 15 8 84 2.0 0.5 1 0.83 0.006 0.50 0.001 37 151 0.3 0.009 7 1 0.7
< LQ 10%ile 7.6 16 8 87 2.3 0.7 1 0.88 0.009 0.55 0.001 38 161 0.4 0.011 11 1 0.8
25%ile 7.7 17 9 92 3.0 1.0 1 1.03 0.010 0.73 0.002 62 215 0.6 0.017 17 3 0.8
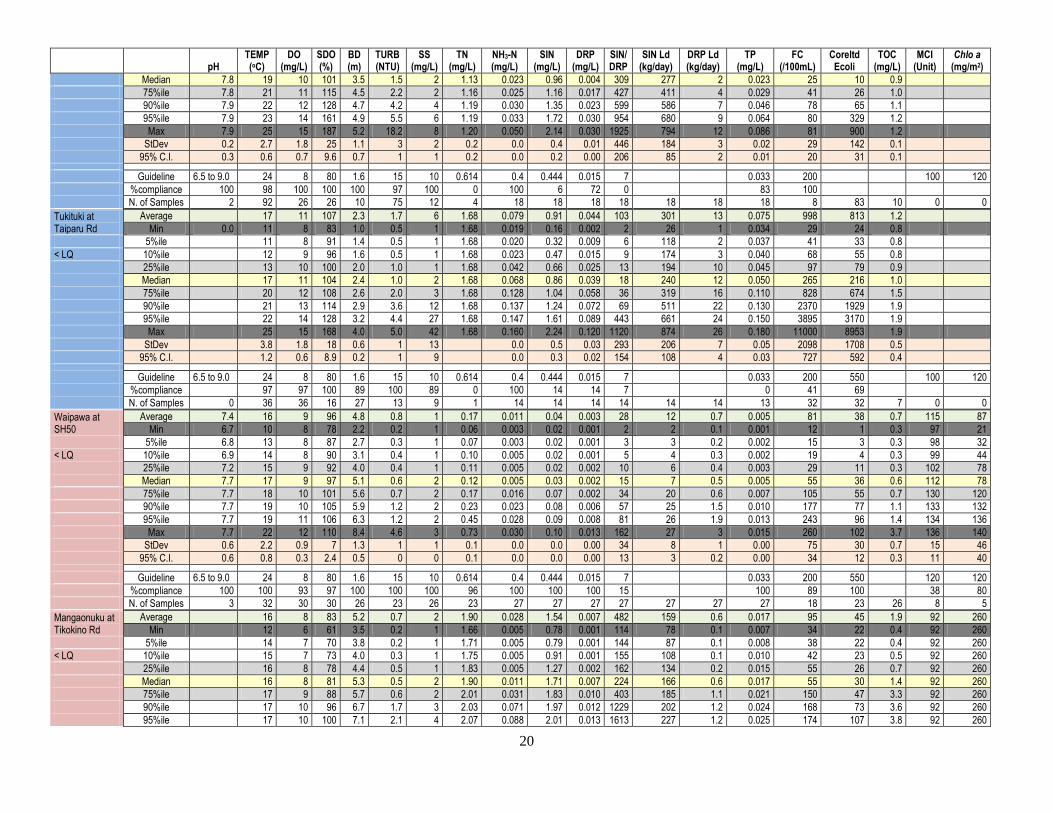
20
pH
TEMP (oC)
DO (mg/L)
SDO (%)
BD (m)
TURB (NTU)
SS (mg/L)
TN (mg/L)
NH3-N (mg/L)
SIN (mg/L)
DRP (mg/L)
SIN/ DRP
SIN Ld (kg/day)
DRP Ld (kg/day)
TP (mg/L)
FC (/100mL)
Coreltd Ecoli
TOC (mg/L)
MCI (Unit)
Chlo a (mg/m2)
Median 7.8 19 10 101 3.5 1.5 2 1.13 0.023 0.96 0.004 309 277 2 0.023 25 10 0.9
75%ile 7.8 21 11 115 4.5 2.2 2 1.16 0.025 1.16 0.017 427 411 4 0.029 41 26 1.0
90%ile 7.9 22 12 128 4.7 4.2 4 1.19 0.030 1.35 0.023 599 586 7 0.046 78 65 1.1
95%ile 7.9 23 14 161 4.9 5.5 6 1.19 0.033 1.72 0.030 954 680 9 0.064 80 329 1.2
Max 7.9 25 15 187 5.2 18.2 8 1.20 0.050 2.14 0.030 1925 794 12 0.086 81 900 1.2
StDev 0.2 2.7 1.8 25 1.1 3 2 0.2 0.0 0.4 0.01 446 184 3 0.02 29 142 0.1
95% C.I. 0.3 0.6 0.7 9.6 0.7 1 1 0.2 0.0 0.2 0.00 206 85 2 0.01 20 31 0.1
Guideline 6.5 to 9.0 24 8 80 1.6 15 10 0.614 0.4 0.444 0.015 7 0.033 200 100 120
%compliance 100 98 100 100 100 97 100 0 100 6 72 0 83 100
N. of Samples 2 92 26 26 10 75 12 4 18 18 18 18 18 18 18 8 83 10 0 0
Tukituki at Taiparu Rd
Average 17 11 107 2.3 1.7 6 1.68 0.079 0.91 0.044 103 301 13 0.075 998 813 1.2
Min 0.0 11 8 83 1.0 0.5 1 1.68 0.019 0.16 0.002 2 26 1 0.034 29 24 0.8
5%ile 11 8 91 1.4 0.5 1 1.68 0.020 0.32 0.009 6 118 2 0.037 41 33 0.8
< LQ 10%ile 12 9 96 1.6 0.5 1 1.68 0.023 0.47 0.015 9 174 3 0.040 68 55 0.8
25%ile 13 10 100 2.0 1.0 1 1.68 0.042 0.66 0.025 13 194 10 0.045 97 79 0.9
Median 17 11 104 2.4 1.0 2 1.68 0.068 0.86 0.039 18 240 12 0.050 265 216 1.0
75%ile 20 12 108 2.6 2.0 3 1.68 0.128 1.04 0.058 36 319 16 0.110 828 674 1.5
90%ile 21 13 114 2.9 3.6 12 1.68 0.137 1.24 0.072 69 511 22 0.130 2370 1929 1.9
95%ile 22 14 128 3.2 4.4 27 1.68 0.147 1.61 0.089 443 661 24 0.150 3895 3170 1.9
Max 25 15 168 4.0 5.0 42 1.68 0.160 2.24 0.120 1120 874 26 0.180 11000 8953 1.9
StDev 3.8 1.8 18 0.6 1 13 0.0 0.5 0.03 293 206 7 0.05 2098 1708 0.5
95% C.I. 1.2 0.6 8.9 0.2 1 9 0.0 0.3 0.02 154 108 4 0.03 727 592 0.4
Guideline 6.5 to 9.0 24 8 80 1.6 15 10 0.614 0.4 0.444 0.015 7 0.033 200 550 100 120
%compliance 97 97 100 89 100 89 0 100 14 14 7 0 41 69
N. of Samples 0 36 36 16 27 13 9 1 14 14 14 14 14 14 13 32 32 7 0 0
Waipawa at SH50
Average 7.4 16 9 96 4.8 0.8 1 0.17 0.011 0.04 0.003 28 12 0.7 0.005 81 38 0.7 115 87
Min 6.7 10 8 78 2.2 0.2 1 0.06 0.003 0.02 0.001 2 2 0.1 0.001 12 1 0.3 97 21
5%ile 6.8 13 8 87 2.7 0.3 1 0.07 0.003 0.02 0.001 3 3 0.2 0.002 15 3 0.3 98 32
< LQ 10%ile 6.9 14 8 90 3.1 0.4 1 0.10 0.005 0.02 0.001 5 4 0.3 0.002 19 4 0.3 99 44
25%ile 7.2 15 9 92 4.0 0.4 1 0.11 0.005 0.02 0.002 10 6 0.4 0.003 29 11 0.3 102 78
Median 7.7 17 9 97 5.1 0.6 2 0.12 0.005 0.03 0.002 15 7 0.5 0.005 55 36 0.6 112 78
75%ile 7.7 18 10 101 5.6 0.7 2 0.17 0.016 0.07 0.002 34 20 0.6 0.007 105 55 0.7 130 120
90%ile 7.7 19 10 105 5.9 1.2 2 0.23 0.023 0.08 0.006 57 25 1.5 0.010 177 77 1.1 133 132
95%ile 7.7 19 11 106 6.3 1.2 2 0.45 0.028 0.09 0.008 81 26 1.9 0.013 243 96 1.4 134 136
Max 7.7 22 12 110 8.4 4.6 3 0.73 0.030 0.10 0.013 162 27 3 0.015 260 102 3.7 136 140
StDev 0.6 2.2 0.9 7 1.3 1 1 0.1 0.0 0.0 0.00 34 8 1 0.00 75 30 0.7 15 46
95% C.I. 0.6 0.8 0.3 2.4 0.5 0 0 0.1 0.0 0.0 0.00 13 3 0.2 0.00 34 12 0.3 11 40
Guideline 6.5 to 9.0 24 8 80 1.6 15 10 0.614 0.4 0.444 0.015 7 0.033 200 550 120 120
%compliance 100 100 93 97 100 100 100 96 100 100 100 15 100 89 100 38 80
N. of Samples 3 32 30 30 26 23 26 23 27 27 27 27 27 27 27 18 23 26 8 5
Mangaonuku at Tikokino Rd
Average 16 8 83 5.2 0.7 2 1.90 0.028 1.54 0.007 482 159 0.6 0.017 95 45 1.9 92 260
Min 12 6 61 3.5 0.2 1 1.66 0.005 0.78 0.001 114 78 0.1 0.007 34 22 0.4 92 260
5%ile 14 7 70 3.8 0.2 1 1.71 0.005 0.79 0.001 144 87 0.1 0.008 38 22 0.4 92 260
< LQ 10%ile 15 7 73 4.0 0.3 1 1.75 0.005 0.91 0.001 155 108 0.1 0.010 42 23 0.5 92 260
25%ile 16 8 78 4.4 0.5 1 1.83 0.005 1.27 0.002 162 134 0.2 0.015 55 26 0.7 92 260
Median 16 8 81 5.3 0.5 2 1.90 0.011 1.71 0.007 224 166 0.6 0.017 55 30 1.4 92 260
75%ile 17 9 88 5.7 0.6 2 2.01 0.031 1.83 0.010 403 185 1.1 0.021 150 47 3.3 92 260
90%ile 17 10 96 6.7 1.7 3 2.03 0.071 1.97 0.012 1229 202 1.2 0.024 168 73 3.6 92 260
95%ile 17 10 100 7.1 2.1 4 2.07 0.088 2.01 0.013 1613 227 1.2 0.025 174 107 3.8 92 260

21
pH
TEMP (oC)
DO (mg/L)
SDO (%)
BD (m)
TURB (NTU)
SS (mg/L)
TN (mg/L)
NH3-N (mg/L)
SIN (mg/L)
DRP (mg/L)
SIN/ DRP
SIN Ld (kg/day)
DRP Ld (kg/day)
TP (mg/L)
FC (/100mL)
Coreltd Ecoli
TOC (mg/L)
MCI (Unit)
Chlo a (mg/m2)
Max 19 11 107 7.5 2.2 5 2.10 0.120 2.02 0.015 1831 258 1.2 0.029 180 140 4.3 92 260
StDev 1.3 1.2 11 1.1 1 1 0.1 0.0 0.4 0.00 525 45 0.4 0.01 66 36 1.4
95% C.I. 0.6 0.6 5.1 0.6 0 1 0.1 0.0 0.2 0.00 249 21 0.2 0.00 57 22 0.7
Guideline 6.5 to 9.0 24 8 80 1.6 15 10 0.614 0.4 0.444 0.015 7 0.033 200 550 100 120
%compliance 100 53 53 100 100 100 0 100 0 100 0 100 100 100 0 0
N. of Samples 0 17 17 17 14 13 16 11 17 17 17 17 17 17 17 5 10 15 1 1
Waipawa D/s Waipawa Oxpond
Average 17 15 1.0 1 0.063 0.039 12 925 343
Min 10 4 0.5 1 0.018 0.019 5.7 50 23
5%ile 12 4 0.6 1 0.024 0.021 6.0 120 29
10%ile 13 4 0.6 1 0.028 0.022 6.6 150 34
25%ile 15 8 0.6 1 0.037 0.029 9 150 52
< LQ Median 17 9 0.8 1 0.070 0.038 12 250 110
75%ile 19 10 1.0 2 0.080 0.047 15 490 295
90%ile 23 12 1.5 3 0.096 0.056 19 554 338
95%ile 25 45 2.2 3 0.104 0.062 19 3399 1175
Max 27 105 3.5 3 0.110 0.067 20 10000 3100
StDev 4.5 26.0 1 1 0.0 0.01 4.71 2516 771
95% C.I. 2.3 13.6 0 0 0.0 0.01 2.38 1273 390 0
Guideline 6.5 to 9.0 24 8 80 1.6 15 10 0.614 0.4 0.444 0.015 7 8 9 0.033 200 550 100 120
%compliance 113 64 87 107 131 113 33 67
N. of Samples 0 15 14 0 0 15 15 0 13 0 15 0 0 15 0 15 15 0 0 0
Tukituki at Shagrock + Tamumu
Average 8.6 17 11 109 3.4 0.8 2 0.79 0.017 0.61 0.013 136 388 7 0.027 117 29 1.9 115 230
Min 8.5 11 8 82 1.3 0.2 1 0.25 0.00 0.16 0.001 20 59 1 0.008 1 0 0.4 104 230
5%ile 8.5 12 8 86 2.3 0.3 1 0.49 0.00 0.27 0.001 20 131 1 0.011 8 0 0.6 105 230
10%ile 8.5 12 8 88 2.5 0.4 1 0.51 0.00 0.33 0.002 21 140 1 0.013 17 1 0.6 106 230
25%ile 8.5 15 9 95 2.8 0.5 2 0.63 0.01 0.45 0.005 25 203 2 0.021 39 1 0.9 109 230
< LQ Median 8.6 18 10 102 3.1 0.7 2 0.68 0.01 0.60 0.010 57 358 6 0.027 80 12 1.7 114 230
75%ile 8.7 19 12 122 3.7 0.9 2 0.99 0.02 0.80 0.022 106 517 12 0.031 150 27 2.8 121 230
90%ile 8.7 21 13 138 4.4 1.2 2 1.24 0.03 0.93 0.023 263 711 16 0.038 282 43 3.4 124 230
95%ile 8.7 23 13 145 5.2 1.5 4 1.37 0.04 1.00 0.029 731 713 18 0.046 370 79 3.8 126 230
Max 8.7 25 15 168 6.8 3.2 5 1.47 0.10 1.14 0.032 950 795 19 0.052 460 278 3.9 127 230
StDev 0.2 3.4 1.7 20 1.0 1 1 0.3 0.02 0.2 0.01 238 214 6 0.01 118 64 1.1 12 95% C.I. 0.3 0.9 0.5 5.6 0.3 0 0 0.1 0.01 0.1 0.00 93 84 2 0.00 37 30 0.5 13
Guideline 24 8 80 1.6 15 10 0.614 0.4 0.444 0.015 7 0.033 200 100 120
%compliance 96 98 100 98 100 100 20 100 24 64 0 79 85 100 0
N. of Samples 2 55 51 51 44 24 27 20 26 25 28 25 25 28 28 39 18 24 3 1
Tukituki at Red Bridge
Average 9.1 20 11 122 3.3 1.1 2 0.36 0.01 0.18 0.003 90 125 2 0.011 38 19 2.7 99 326
Min 8.6 11 7 74 1.7 0.2 1 0.11 0.00 0.02 0.001 3 8 0 0.003 1 1 1.0 78 84
5%ile 8.6 13 8 95 1.8 0.2 1 0.12 0.00 0.02 0.001 5 9 0 0.003 3 1 1.1 80 106
< LQ 10%ile 8.6 15 9 101 1.9 0.3 2 0.14 0.01 0.02 0.001 7 9 0 0.005 6 1 1.2 82 127
25%ile 8.7 19 10 108 2.7 0.5 2 0.21 0.01 0.03 0.002 12 16 1 0.008 14 3 2.0 86 192
Median 8.9 20 11 121 3.1 0.7 2 0.31 0.01 0.10 0.002 71 42 1 0.012 23 9 2.8 89 279
75%ile 9.3 21 12 133 4.0 1.0 2 0.44 0.01 0.26 0.003 125 222 2 0.015 31 17 3.4 117 413
90%ile 9.6 23 14 146 4.9 1.7 2 0.64 0.02 0.48 0.007 218 304 3 0.016 56 55 3.8 119 561
95%ile 9.7 23 14 163 5.0 2.2 2 0.69 0.03 0.50 0.010 243 338 4 0.017 98 61 3.9 119 611
Max 9.8 27 16 170 6.1 7.3 2 0.93 0.04 0.51 0.020 354 437 8 0.026 260 110 5.0 120 660
StDev 0.7 3.3 2.0 21 1.2 2 0 0.2 0.01 0.2 0.00 94 132 2 0.01 60 27 1.0 18 245
95% C.I. 0.7 1.2 0.8 8.1 0.5 1 0 0.1 0.00 0.1 0.00 38 53 1 0.00 28 11 0.4 13 240

22
pH
TEMP (oC)
DO (mg/L)
SDO (%)
BD (m)
TURB (NTU)
SS (mg/L)
TN (mg/L)
NH3-N (mg/L)
SIN (mg/L)
DRP (mg/L)
SIN/ DRP
SIN Ld (kg/day)
DRP Ld (kg/day)
TP (mg/L)
FC (/100mL)
Coreltd Ecoli
TOC (mg/L)
MCI (Unit)
Chlo a (mg/m2)
Guideline 6.5 to 9.0 24 8 80 1.6 15 10 0.614 0.18 0.444 0.015 7 0.033 100 550 100 120
%compliance 67 97 96 96 100 100 100 82 100 88 96 13 100 94 100 43 25
N. of Samples 3 32 26 26 23 20 23 22 24 24 27 23 24 27 24 17 22 23 7 4
Tukituki at Black Bridge Average 9.1 20 10 112 3.3 1.4 2 0.33 0.01 0.19 0.008 74 147 5 0.019 475 138 2.6 82 262
Min 8.8 10 7 73 1.4 0.2 1 0.11 0.00 0.01 0.001 0 3 0 0.003 2 0 0.8 75 78
5%ile 8.9 14 7 76 1.6 0.5 1 0.12 0.01 0.01 0.001 1 4 0 0.003 6 1 0.9 76 96
< LQ 10%ile 8.9 16 8 88 1.8 0.5 1 0.13 0.01 0.02 0.001 3 7 1 0.007 9 1 1.0 77 115
25%ile 9.0 18 9 97 2.2 0.8 2 0.17 0.01 0.03 0.001 9 16 1 0.012 16 7 1.2 80 170
Median 9.1 20 10 114 3.3 1.2 2 0.24 0.01 0.08 0.002 29 45 2 0.016 29 20 2.4 81 236
75%ile 9.2 22 12 127 4.0 1.9 2 0.47 0.01 0.27 0.010 75 207 6 0.020 365 45 3.3 82 328
90%ile 9.3 23 12 139 5.2 2.3 3 0.64 0.03 0.53 0.020 175 402 14 0.030 1960 147 3.9 87 431
95%ile 9.3 24 13 142 5.4 3.1 5 0.68 0.03 0.60 0.020 277 460 17 0.040 2419 1000 4.8 89 466
Max 9.4 27 13 159 6.0 8.0 6 0.75 0.09 1.11 0.048 617 1096 34 0.088 2419 1874 9.3 91 500
StDev 0.4 3.0 1.8 20 1.3 1 1 0.2 0.01 0.2 0.01 121 214 7 0.02 831 384 1.8 6 177
95% C.I. 0.5 0.5 0.5 6.0 0.5 0 1 0.1 0.00 0.1 0.00 33 59 2 0.00 288 68 0.7 5 174
Guideline 6.5 to 9.0 24 8 80 1.6 15 10 0.614 0.18 0.444 0.015 7 0.033 100 550 100 120
%compliance 50 98 84 93 93 100 100 100 100 87 84 24 90 72 93 0 25
N. of Samples 2 145 43 43 28 114 27 23 52 52 56 51 51 52 52 32 122 25 5 4
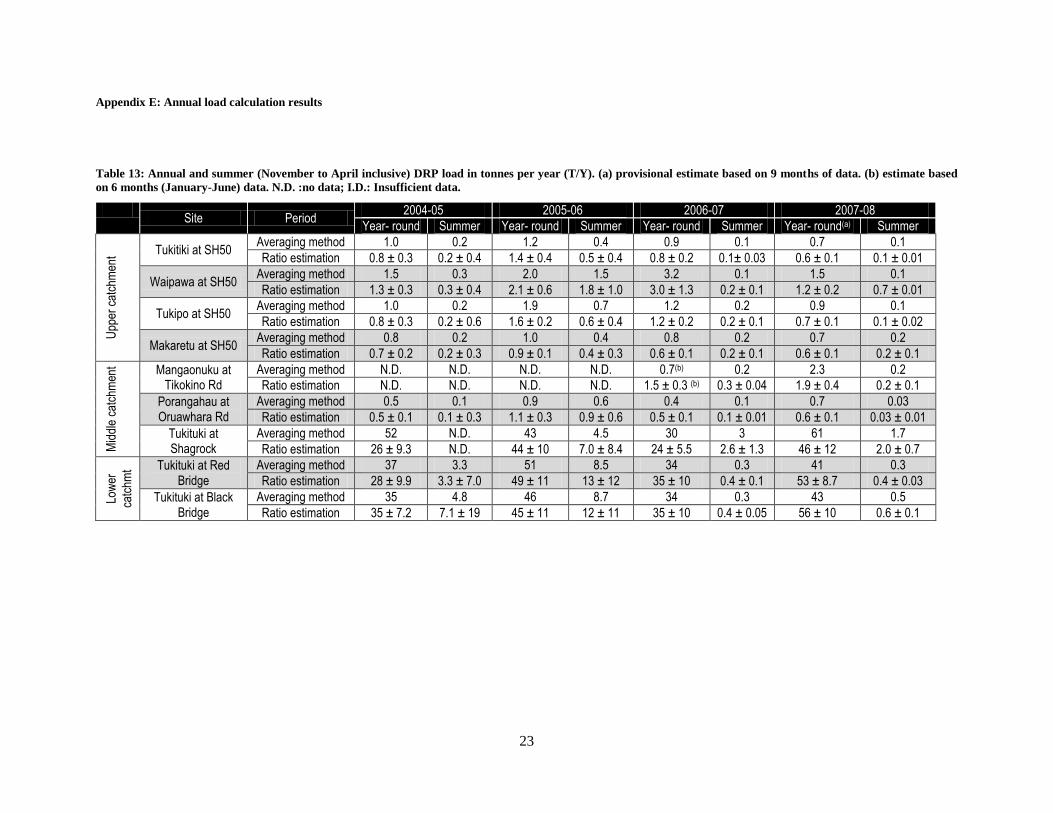
23
Appendix E: Annual load calculation results
Table 13: Annual and summer (November to April inclusive) DRP load in tonnes per year (T/Y). (a) provisional estimate based on 9 months of data. (b) estimate based
on 6 months (January-June) data. N.D. :no data; I.D.: Insufficient data.
Site Period
2004-05 2005-06 2006-07 2007-08
Year- round Summer Year- round Summer Year- round Summer Year- round(a) Summer
Upp
er c
atch
men
t Tukitiki at SH50 Averaging method 1.0 0.2 1.2 0.4 0.9 0.1 0.7 0.1
Ratio estimation 0.8 ± 0.3 0.2 ± 0.4 1.4 ± 0.4 0.5 ± 0.4 0.8 ± 0.2 0.1± 0.03 0.6 ± 0.1 0.1 ± 0.01
Waipawa at SH50 Averaging method 1.5 0.3 2.0 1.5 3.2 0.1 1.5 0.1
Ratio estimation 1.3 ± 0.3 0.3 ± 0.4 2.1 ± 0.6 1.8 ± 1.0 3.0 ± 1.3 0.2 ± 0.1 1.2 ± 0.2 0.7 ± 0.01
Tukipo at SH50 Averaging method 1.0 0.2 1.9 0.7 1.2 0.2 0.9 0.1
Ratio estimation 0.8 ± 0.3 0.2 ± 0.6 1.6 ± 0.2 0.6 ± 0.4 1.2 ± 0.2 0.2 ± 0.1 0.7 ± 0.1 0.1 ± 0.02
Makaretu at SH50 Averaging method 0.8 0.2 1.0 0.4 0.8 0.2 0.7 0.2
Ratio estimation 0.7 ± 0.2 0.2 ± 0.3 0.9 ± 0.1 0.4 ± 0.3 0.6 ± 0.1 0.2 ± 0.1 0.6 ± 0.1 0.2 ± 0.1
Mid
dle
catc
hmen
t
Mangaonuku at Tikokino Rd
Averaging method N.D. N.D. N.D. N.D. 0.7(b) 0.2 2.3 0.2
Ratio estimation N.D. N.D. N.D. N.D. 1.5 ± 0.3 (b) 0.3 ± 0.04 1.9 ± 0.4 0.2 ± 0.1
Porangahau at Oruawhara Rd
Averaging method 0.5 0.1 0.9 0.6 0.4 0.1 0.7 0.03
Ratio estimation 0.5 ± 0.1 0.1 ± 0.3 1.1 ± 0.3 0.9 ± 0.6 0.5 ± 0.1 0.1 ± 0.01 0.6 ± 0.1 0.03 ± 0.01
Tukituki at Shagrock
Averaging method 52 N.D. 43 4.5 30 3 61 1.7
Ratio estimation 26 ± 9.3 N.D. 44 ± 10 7.0 ± 8.4 24 ± 5.5 2.6 ± 1.3 46 ± 12 2.0 ± 0.7
Low
er
catc
hmt Tukituki at Red
Bridge
Averaging method 37 3.3 51 8.5 34 0.3 41 0.3
Ratio estimation 28 ± 9.9 3.3 ± 7.0 49 ± 11 13 ± 12 35 ± 10 0.4 ± 0.1 53 ± 8.7 0.4 ± 0.03
Tukituki at Black Bridge
Averaging method 35 4.8 46 8.7 34 0.3 43 0.5
Ratio estimation 35 ± 7.2 7.1 ± 19 45 ± 11 12 ± 11 35 ± 10 0.4 ± 0.05 56 ± 10 0.6 ± 0.1

24
Table 14: Annual and summer (November to April inclusive) SIN load in tonnes per year (T/Y). (a) provisional estimate based on 9 months of data. (b) estimate based on
6 months (January-June) data. N.D. :no data; I.D.: Insufficient data.
Site Period
2004-05 2005-06 2006-07 2007-08
Year- round Summer Year- round Summer Year- round Summer Year- round(a) Summer
Upp
er c
atch
men
t Tukitiki at SH50 Averaging method 41 4.4 47 8.9 35 1.8 33 1.0
Ratio estimation 37 ± 15 8.8 ± 22 39 ± 8 11 ± 8.8 35 ± 10 1.9 ± 0.7 31 ± 7 1.1 ± 0.3
Waipawa at SH50 Averaging method 68 8.1 120 36 69 2.9 101 2.5
Ratio estimation 65 ± 18 14 ± 18 119 ± 22 52 ± 28 68 ± 19 3.4 ± 1.1 81 ± 18 2.8 ± 0.8
Tukipo at SH50 Averaging method 84 11 100 16 81 4.5 101 3.2
Ratio estimation 78 ± 28 17 ± 52 87 ± 17 18 ± 11 68 ± 21 4.8 ± 1.2 87 ± 13 3.8 ± 0.9
Makaretu at SH50 Averaging method 38 4.1 64 7.0 40 1.6 25 0.9
Ratio estimation 35 ± 12 6 ± 10 50 ± 14 8 ± 6 38 ± 14 1.8 ± 0.9 23 ± 4 1.0 ± 0.6
Mid
dle
catc
hmen
t
Mangaonuku at Tikokino Rd
Averaging method N.D. N.D. N.D. N.D. 95(b) 39 317 43
Ratio estimation N.D. N.D. N.D. N.D. 169 ± 24b) 52 ± 6 279 ± 33 50 ± 4
Porangahau at Oruawhara Rd
Averaging method 47 2.1 56 9.3 34 2.3 55 2.7
Ratio estimation 45 ± 12 7.5 ± 18 43 ± 9 13 ± 9 33 ± 9 2.8 ± 1.0 47 ± 8 3.0 ± 0.5
Tukituki at Shagrock
Averaging method 3,075 I.D. 3,300 284 1,601 119 1,824 107
Ratio estimation 1,933 ± 481 I.D. 2,328 ± 495 195 ± 256 1,263 ± 257 143 ± 34 1,503 ± 217 127 ± 35
Low
er
catc
hmt Tukituki at Red
Bridge Averaging method 1,556 109 2,134 242 1,538 39 1,895 25
Ratio estimation 1,379 ± 408 200 ± 416 1,588 ± 433 248 ± 229 1,480 ± 351 41 ± 15 2361 ± 398 28± 23
Tukituki at Black Bridge
Averaging method 1,515 97 2,018 192 1,451 23 1834 19
Ratio estimation 1,297 ± 430 184 ± 522 1,514 ± 416 228 ± 212 1,381 ± 346 24 ± 16 2,283 ± 407 22 ± 17
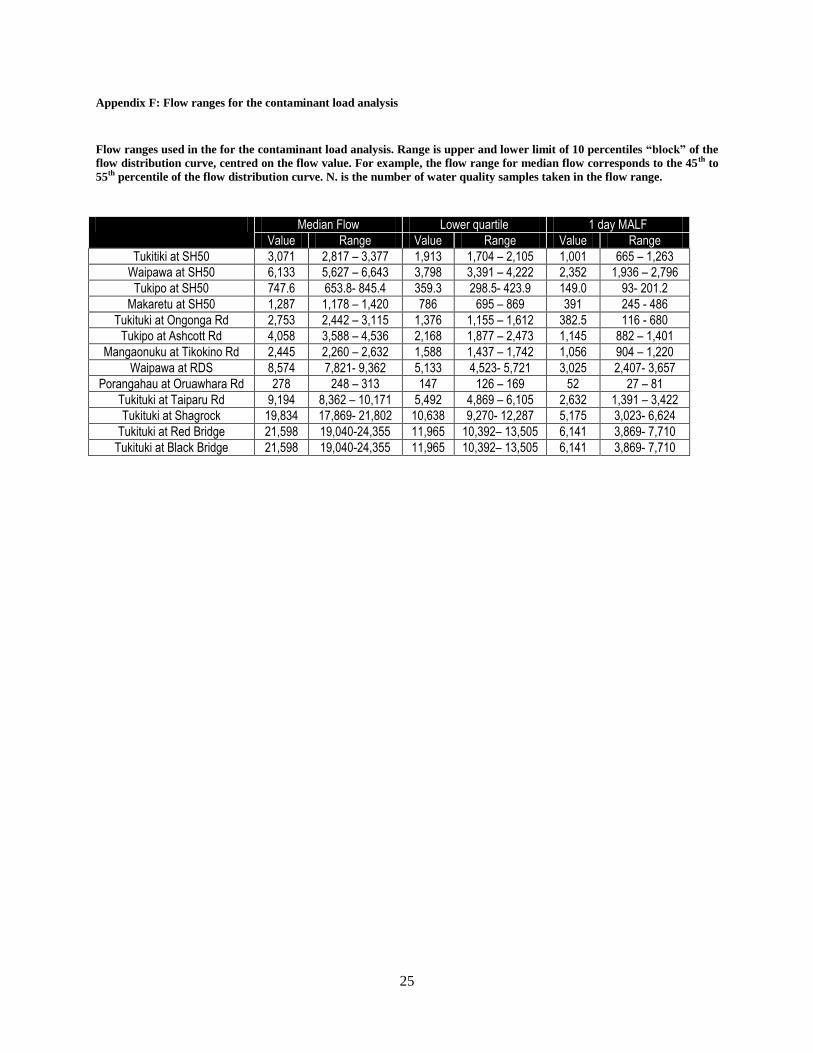
25
Appendix F: Flow ranges for the contaminant load analysis
Flow ranges used in the for the contaminant load analysis. Range is upper and lower limit of 10 percentiles “block” of the
flow distribution curve, centred on the flow value. For example, the flow range for median flow corresponds to the 45th to
55th percentile of the flow distribution curve. N. is the number of water quality samples taken in the flow range.
Median Flow Lower quartile 1 day MALF
Value Range Value Range Value Range
Tukitiki at SH50 3,071 2,817 – 3,377 1,913 1,704 – 2,105 1,001 665 – 1,263
Waipawa at SH50 6,133 5,627 – 6,643 3,798 3,391 – 4,222 2,352 1,936 – 2,796
Tukipo at SH50 747.6 653.8- 845.4 359.3 298.5- 423.9 149.0 93- 201.2
Makaretu at SH50 1,287 1,178 – 1,420 786 695 – 869 391 245 - 486
Tukituki at Ongonga Rd 2,753 2,442 – 3,115 1,376 1,155 – 1,612 382.5 116 - 680
Tukipo at Ashcott Rd 4,058 3,588 – 4,536 2,168 1,877 – 2,473 1,145 882 – 1,401
Mangaonuku at Tikokino Rd 2,445 2,260 – 2,632 1,588 1,437 – 1,742 1,056 904 – 1,220
Waipawa at RDS 8,574 7,821- 9,362 5,133 4,523- 5,721 3,025 2,407- 3,657
Porangahau at Oruawhara Rd 278 248 – 313 147 126 – 169 52 27 – 81
Tukituki at Taiparu Rd 9,194 8,362 – 10,171 5,492 4,869 – 6,105 2,632 1,391 – 3,422
Tukituki at Shagrock 19,834 17,869- 21,802 10,638 9,270- 12,287 5,175 3,023- 6,624
Tukituki at Red Bridge 21,598 19,040-24,355 11,965 10,392– 13,505 6,141 3,869- 7,710
Tukituki at Black Bridge 21,598 19,040-24,355 11,965 10,392– 13,505 6,141 3,869- 7,710

26
Appendix G: Comparison between HBRC and NIWA data at Tukituki at Red Bridge
Tukituki at Redbridge - comparison of monitoring results obtained by NIWA and HBRC
Period analysed: Oct96 to Dec06 (period in common for the two sites).
NIWA monitoring is monthly,
HBRC monitoring is quarterly till Jan 05, then monthly
Sampling dates by the two agencies were different, thus a paired-sample statistical analysis was
not possible.
All data analysis
Agency N. of samples Average Median SD Mann-Whitney test
DRP (mg/m3)
HBRC 56 15.47 10.00 15.03 p= 0.41
NIWA 122 13.61 10.01 15.18
SIN (g/m3)
HBRC 57 0.807 0.685 0.59 p= 0.36
NIWA 122 0.712 0.657 0.52
NH4-N (mg/m3)
HBRC 57 0.015 0.007 0.017 p=0.03
NIWA 122 0.010 0.006 0.011
Clarity (m)
HBRC 53 1.80 1.9 1.06 p= 0.91
NIWA 123 1.92 1.78 1.34
Turb (NTU)
HBRC 56 11.0 1.7 39 p= 0.92
NIWA 123 28.9 1.6 106
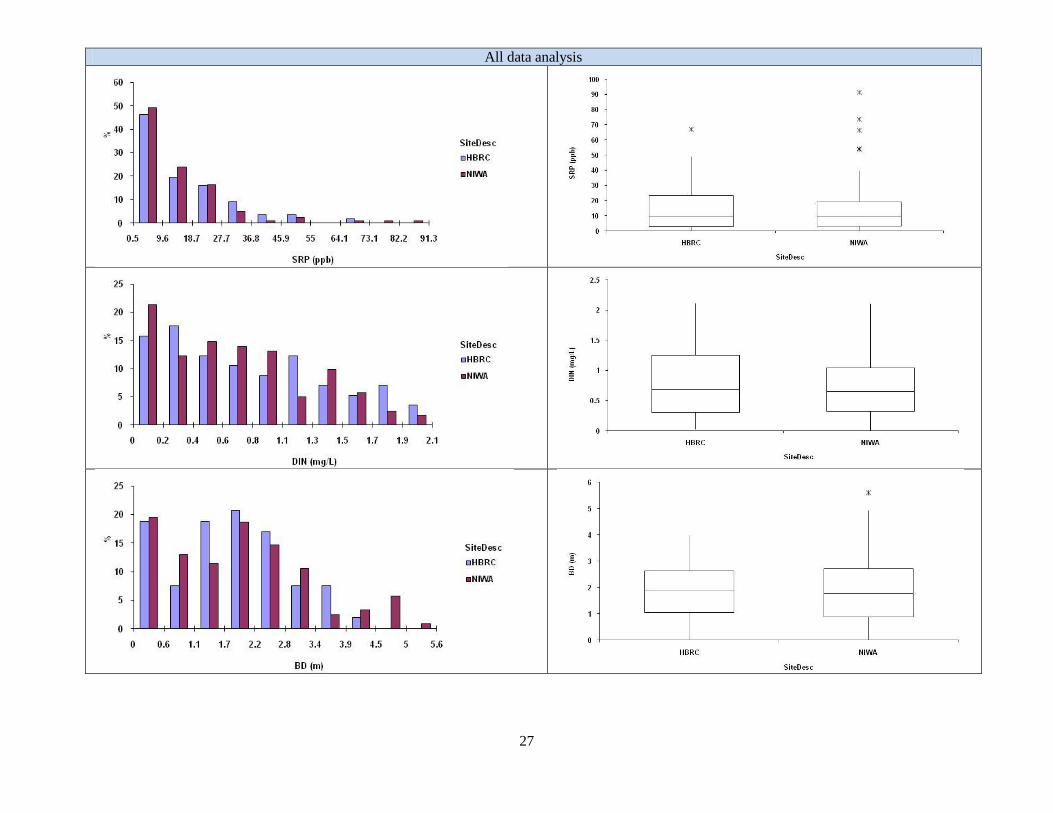
27
All data analysis

28
Analysis by season
Agency N. of samples
Average Median SD Mann-Whitney test
DRP (mg/m3) 1st quarter
HBRC 13 8.0 5.0 8.7 p= 0.73
NIWA 30 7.5 3.2 9.5
DRP (mg/m3) 2nd quarter
HBRC 14 17.7 12 16.4 P= 0.53
NIWA 30 14.7 12.8 16.0
DRP (mg/m3) 3rd quarter
HBRC 14 21.3 17.5 18.0 P= 0.87
NIWA 29 21.5 18.5 21.2
DRP (mg/m3) 4th quarter
HBRC 15 14.5 12.0 13.5 P= 0.74
NIWA 33 11.2 10.0 8.0
SIN (g/m3) 1st Quarter
HBRC 13 0.292 0.248 0.29 P= 0.28
NIWA 30 0.250 0.162 0.29
SIN (g/m3) 2nd Quarter
HBRC 14 0.788 0.613 0.57 P= 0.50
NIWA 30 0.636 0.543 0.46
SIN (g/m3) 3rd Quarter
HBRC 14 1.435 1.458 0.49 P= 0.15
NIWA 29 1.227 1.280 0.47
SIN (g/m3) 4th Quarter
HBRC 16 0.693 0.690 0.38 P= 0.58
NIWA 33 0.749 0.777 0.36
BD (g/m3) 1st Quarter
HBRC 13 1.9 1.9 1.2 P= 0.15
NIWA 30 2.6 2.5 1.3
BD (g/m3) 2nd Quarter
HBRC 13 1.8 1.93 1.2 P= 0.83
NIWA 30 2.0 1.94 1.6
BD (g/m3) 3rd Quarter
HBRC 15 1.5 1.6 0.8 P= 0.12
NIWA 30 1.2 1.0 0.9
BD (g/m3) 4th Quarter
HBRC 12 2.0 2.0 1.2 P= 0.65
NIWA 33 1.8 1.8 1.1
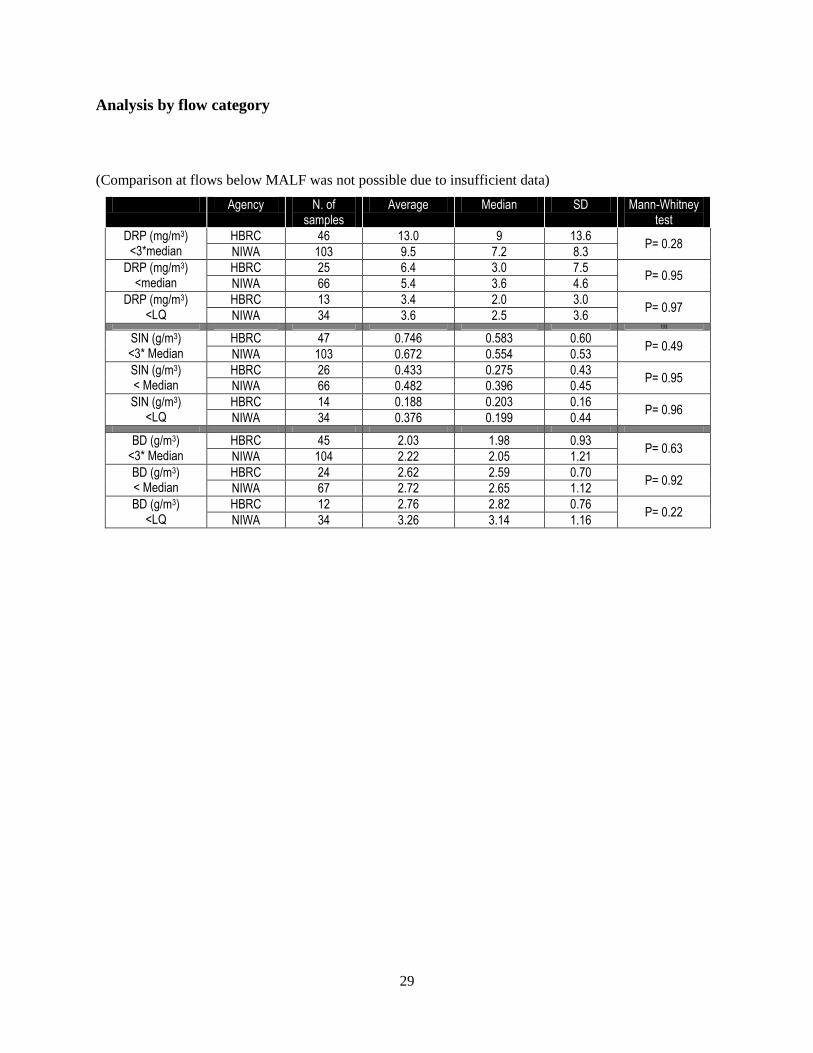
29
Analysis by flow category
(Comparison at flows below MALF was not possible due to insufficient data)
Agency N. of samples
Average Median SD Mann-Whitney test
DRP (mg/m3) <3*median
HBRC 46 13.0 9 13.6 P= 0.28
NIWA 103 9.5 7.2 8.3
DRP (mg/m3) <median
HBRC 25 6.4 3.0 7.5 P= 0.95
NIWA 66 5.4 3.6 4.6
DRP (mg/m3) <LQ
HBRC 13 3.4 2.0 3.0 P= 0.97
NIWA 34 3.6 2.5 3.6 103
SIN (g/m3) <3* Median
HBRC 47 0.746 0.583 0.60 P= 0.49
NIWA 103 0.672 0.554 0.53
SIN (g/m3) < Median
HBRC 26 0.433 0.275 0.43 P= 0.95
NIWA 66 0.482 0.396 0.45
SIN (g/m3) <LQ
HBRC 14 0.188 0.203 0.16 P= 0.96
NIWA 34 0.376 0.199 0.44
BD (g/m3) <3* Median
HBRC 45 2.03 1.98 0.93 P= 0.63
NIWA 104 2.22 2.05 1.21
BD (g/m3) < Median
HBRC 24 2.62 2.59 0.70 P= 0.92
NIWA 67 2.72 2.65 1.12
BD (g/m3) <LQ
HBRC 12 2.76 2.82 0.76 P= 0.22
NIWA 34 3.26 3.14 1.16

30
Flow below 3* median

31
Flow below median

32
Flow below Lower Quartile