wear resistance of 3d printing resin material opposing ... · materials article wear resistance of...
TRANSCRIPT

materials
Article
Wear Resistance of 3D Printing Resin MaterialOpposing Zirconia and Metal Antagonists
Ji-Man Park 1 ID , Jin-Soo Ahn 2, Hyun-Suk Cha 3 and Joo-Hee Lee 3,*1 Department of Prosthodontics, College of Dentistry, Yonsei University, 250 Seongsanno, Seodaemun-gu,
Seoul 03722, Korea; [email protected] Department of Dental Biomaterials Science and Dental Research Institute, School of Dentistry,
Seoul National University, 101 Daehak-ro, Jongno-gu, Seoul 03080, Korea; [email protected] Division of Prosthodontics, Department of Dentistry, Asan Medical Center, College of Medicine,
University of Ulsan, 88 Olympic-ro 43-gil, Songpa-gu, Seoul 05505, Korea; [email protected]* Correspondence: [email protected]; Tel.: +82-2-3010-3850; Fax: +82-2-3010-6967
Received: 9 May 2018; Accepted: 15 June 2018; Published: 20 June 2018�����������������
Abstract: 3D printing offers many advantages in dental prosthesis manufacturing. This studyevaluated the wear resistance of 3D printing resin material compared with milling and conventionalresin materials. Sixty substrate specimens were prepared with three types of resin materials: 3Dprinted resin, milled resin, and self-cured resin. The 3D printed specimens were printed at a buildangle of 0◦ and 100 µm layer thickness by digital light processing 3D printing. Two kinds of abraderswere made of zirconia and CoCr alloy. The specimens were loaded at 5 kg for 30,000 chewing cycleswith vertical and horizontal movements under thermocycling condition. The 3D printed resin didnot show significant difference in the maximal depth loss or the volume loss of wear compared to themilled and the self-cured resins. No significant difference was revealed depending on the abradersin the maximal depth loss or the volume loss of wear. In SEM views, the 3D printed resin showedcracks and separation of inter-layer bonds when opposing the metal abrader. The results suggest thatthe 3D printing using resin materials provides adequate wear resistance for dental use.
Keywords: 3D printing; CAD/CAM; wear; resin; zirconia; metal
1. Introduction
The most recent technological movement in digital dentistry is centered on additive manufacturingcalled 3D printing. A 3D printing technique for the fabrication of dental prostheses offers manyadvantages. Because digital data acquired from the intra-oral scanner can be printed into a physicalworking model, the impression procedure can be skipped, which prevents patients from experiencingnausea due to swallowing the impression materials. In addition, the laboratory procedures forprosthesis fabrication can be reduced. Consequently, 3D printing helps save materials and energy,decreases the carbon footprint, and is more economical than conventional methods [1–3]. Subtractivemanufacturing called milling shares many of the same advantages as 3D printing, i.e., the impressiontechnique is similar and various fabrication procedures are omitted [4]. However, the milling methodresults in more wastage because the procedure entails cutting materials with a bur, which producesheat, noise, and an unfavorable force [5]. The use of 3D printing as a substitute for milling is thus ofmore interest for the manufacturing of dental prostheses.
3D printing has considerable potential for application in the dental field. 3D printing machinesare now cheaper, smaller, and lighter, and can work with various materials including metals, ceramics,and polymers [6]. Recent studies have shown that dental prostheses manufactured using 3D printingmethod have an acceptable degree of precision compared with prostheses made using milling or
Materials 2018, 11, 1043; doi:10.3390/ma11061043 www.mdpi.com/journal/materials

Materials 2018, 11, 1043 2 of 10
conventional methods [7]. Furthermore, several studies have reported 3D printing applications inmaxillofacial reconstruction [8–10], implant fixture construction and intervention [11], orthodonticappliances [12], metal bridges [13], guided tissue regeneration [14], tissue surfaces [15], and the metalframeworks of removable partial dentures [16]. The fabrication of dental provisional restorationsis one remaining area that will benefit from these recent developments. Provisional restorationsmade of polymethylmethacrylate (PMMA)-based resin have been used to protect pulpal tissue frombacterial contamination, physio-mechanical and thermal irritation. Long-term use of provisionalrestorations is frequently necessary for a large range of occlusal reconstruction and implant treatment.In such situations, sufficient wear resistance and mechanical strength are essential for clinical use.However, conventional self-polymerizing PMMA-based resin materials showed high polymerizationshrinkage, heat generation, and water sorption [17]. In addition, conventional provisional restorationsare commonly fabricated using the templates filled with a mixture of self-polymerizing powder andliquid. This technique usually requires longer chair time for additional adjustments and offers lowermarginal integrity. Due to the advantages of digital manufacturing, 3D printed resin materials can bean alternative to conventional resin materials for long-term dental applications.
Zirconia for full zirconia crowns and the CoCr alloy for dental restorations have been utilizedwidely in dental clinics. The wear occurring between provisional restorations and occluding prosthesisis a very important factor to consider in the extended temporary stage for a final restoration decisionin clinical practice. For the 3D printing to be applicable in clinical practice, the wear resistance ofprovisional prostheses manufactured using 3D printing method should be investigated against zirconiaand metal antagonists. Studies regarding the wear resistance of dental materials have been conductedon a variety of manufacturing methods and materials [18,19], but all were limited to conventionalfabrication methods. It is meaningful that the wear pattern of the 3D printing material is experimented.Some comparative studies of the physical properties of materials made using the milling and theconventional method have been reported [20,21], but no comparison with the 3D printing method hasbeen reported. This study investigated the wear patterns of three kinds of resin materials fabricated by3D printing, milling, and conventional self-polymerizing. Measurements of volume loss and maximaldepth loss of wear were performed for the wear facets of three resin materials subjected to a weargenerating process through chewing simulation. The purpose of this study was to compare the wearresistance of the 3D printed resin material to the milled and the conventional self-cured resin materialsopposing zirconia and metal antagonists.
2. Materials and Methods
2.1. Computer-Assisted Designing (CAD) and 3D Printing for Specimen Preparation
Three different types of resin materials were used for the wear test (C&B; NextDent, Soesterberg,Netherlands), (Vipiblock; VIPI, São Paulo, Brazil), (Jet™; Lang Dental Mfg., Wheeling, IL, USA).The mechanical properties and basic composition of the resin materials used in this study are presentedin Table 1.
Table 1. Resin materials investigated in this study *.
Product Manufacturer Composition FlexuralStrength
FlexuralModulus Batch Number
C&B NextDent Poly Methyl Methacrylate 80 MPa 2000 MPa XM284N01Vipi Block® PMMA
MonocolorVIPI Poly Methyl Methacrylate 100 MPa 2200 MPa 0000067727
Jet™ Lang DentalMfg. Co., Inc. Poly Methyl Methacrylate 68.3 MPa 1698 MPa
1430-14EP(Powder)1304-14AX
(Liquid)
* written followed by the manufacturer’s information.

Materials 2018, 11, 1043 3 of 10
The substrate specimens were rectangular parallelepipeds measuring 15 × 10 × 10 mm(length × width × height) in size and were designed by a universal CAD software (Rhinoceros®;version 5, Robert McNeel & Associates, Seattle, WA, USA). The specimens of the 3D printed resin weremanufactured using a digital light processing (DLP) 3D printer (D1-150; Veltz3D, Incheon, Korea).The laser was controlled by a digital micro mirror and the entire layer of liquid resin was polymerizedat once. The specimens were printed with a build angle of 0◦ where the side to be tested was parallelto the build platform (Figure 1). The z-axis layer thickness was set to 100 µm. The accuracy ofthe printed specimens with various thickness showed the highest values at 0◦ orientation, and theerror was significantly low. In addition, peak stress was higher in prints with a layer thickness of100 µm [22]. After the 3D printing process, the blocks were detached from the platform and washedwith 100% isopropyl alcohol to remove excessive resin monomers. In the final stage, the specimensunderwent a postcuring processing for 120 min using a postcuring machine (Denstar-300; Denstar Co.,Daegu, Korea).
Materials 2018, 11, x FOR PEER REVIEW 3 of 10
Robert McNeel & Associates, Seattle, WA, USA). The specimens of the 3D printed resin were
manufactured using a digital light processing (DLP) 3D printer (D1-150; Veltz3D, Incheon, Korea).
The laser was controlled by a digital micro mirror and the entire layer of liquid resin was polymerized
at once. The specimens were printed with a build angle of 0° where the side to be tested was parallel
to the build platform (Figure 1). The z-axis layer thickness was set to 100 μm. The accuracy of the
printed specimens with various thickness showed the highest values at 0° orientation, and the error
was significantly low. In addition, peak stress was higher in prints with a layer thickness of 100 μm
[22]. After the 3D printing process, the blocks were detached from the platform and washed with 100%
isopropyl alcohol to remove excessive resin monomers. In the final stage, the specimens underwent
a postcuring processing for 120 min using a postcuring machine (Denstar-300; Denstar Co., Daegu,
Korea).
(a) (b) (c)
Figure 1. 3D printed resin specimens were fabricated from a DLP 3D printer. (a) preprocessing before
3D printing; (b) printed specimens on build platform in the 3D printer; and (c) 3D printed specimens
after primary wash.
For the milled resin, a disc-type block was machined by a dry milling machine (DWX-51D;
Roland DGA Corp., Irvine, CA, USA). The tool path of the specimen design was calculated by
computer-assisted manufacturing (CAM) software (hyperDENT® version 7.4, FOLLOW-ME!
Technology GmbH, Munich, Germany). The resin disc was machined following the tool path, and
the machined blocks were sintered. In the self-cured resin, a silicon mold was prepared and filled
with resin mixed at a powder: liquid ratio of 100:52, according to the manufacturer’s recommendation.
Then, the mixture was placed in the mold, covered with a glass slide, and cured in a pot containing
water at a pressure of 0.21 MPa. It was obtained with 20 specimens for each of the material. Before
the wear test, the specimens were dried at a temperature of 37 °C for one day. Then, the specimens
were ground and polished with silicon carbide paper of grain sizes 600 and 1200 grit on a rotary
machine with water cooling.
The abrader, which was mounted on a chewing simulator applying abrasive force to the
specimen, was made of zirconia and CoCr alloy. It was designed to have a hemisphere with a radius
of 1.5 mm according to the cuspal radio reported [23], connected to a 10 mm cube via a 5 mm-long
neck (Figure 2). In the wear tests, the mesio-palatal cusp of the upper molar was used frequently for
size. As the sharpness of the antagonist is greater, the wear rate increases. The zirconia abrader was
fabricated by a dry milling machine (DWX-51D; Roland DGA Corp., Irvine, CA, USA) from a disc-
shaped tetragonal zirconia polycrystal-based block (ZirPremium UT+; Acucera Inc., Pochon, Korea;
Vickers hardness number of 1200) and sintered. The metal abrader was 3D printed by a SLA-type
machine (Form2, Formlabs Inc., Somerville, MA, USA) using castable material (Castable Resin;
FormLabs Inc., Somerville, MA, USA) and cast into a CoCr alloy (Wirebond 280; Bego GmbH, Bremen,
Germany; Co, 60.2%; Cr, 25.0%; Mo, 4.8%; Vickers hardness number of 280) by a lost wax technique.
The metal abrader surface to be tested was polished in one direction with a 1200-grit brown rubber
point (Brownie® Polisher PC2; SHOFU, Kyoto, Japan). Polishing the surfaces of the zirconia abraders
was performed using a polishing kit (Soft Diamonds Grinding and Buffing Wheels; Asami Tanaka
Dental, Friedrichsdorf, Germany). The abraders were polished with the full series of polishing discs
rotating at approximately 10,000 rpm in a slow speed handpiece [18].
Figure 1. 3D printed resin specimens were fabricated from a DLP 3D printer. (a) preprocessing before3D printing; (b) printed specimens on build platform in the 3D printer; and (c) 3D printed specimensafter primary wash.
For the milled resin, a disc-type block was machined by a dry milling machine (DWX-51D;Roland DGA Corp., Irvine, CA, USA). The tool path of the specimen design was calculatedby computer-assisted manufacturing (CAM) software (hyperDENT® version 7.4, FOLLOW-ME!Technology GmbH, Munich, Germany). The resin disc was machined following the tool path, and themachined blocks were sintered. In the self-cured resin, a silicon mold was prepared and filled withresin mixed at a powder: liquid ratio of 100:52, according to the manufacturer’s recommendation.Then, the mixture was placed in the mold, covered with a glass slide, and cured in a pot containingwater at a pressure of 0.21 MPa. It was obtained with 20 specimens for each of the material. Before thewear test, the specimens were dried at a temperature of 37 ◦C for one day. Then, the specimens wereground and polished with silicon carbide paper of grain sizes 600 and 1200 grit on a rotary machinewith water cooling.
The abrader, which was mounted on a chewing simulator applying abrasive force to the specimen,was made of zirconia and CoCr alloy. It was designed to have a hemisphere with a radius of 1.5 mmaccording to the cuspal radio reported [23], connected to a 10 mm cube via a 5 mm-long neck (Figure 2).In the wear tests, the mesio-palatal cusp of the upper molar was used frequently for size. As thesharpness of the antagonist is greater, the wear rate increases. The zirconia abrader was fabricatedby a dry milling machine (DWX-51D; Roland DGA Corp., Irvine, CA, USA) from a disc-shapedtetragonal zirconia polycrystal-based block (ZirPremium UT+; Acucera Inc., Pochon, Korea; Vickershardness number of 1200) and sintered. The metal abrader was 3D printed by a SLA-type machine(Form2, Formlabs Inc., Somerville, MA, USA) using castable material (Castable Resin; FormLabs Inc.,Somerville, MA, USA) and cast into a CoCr alloy (Wirebond 280; Bego GmbH, Bremen, Germany;Co, 60.2%; Cr, 25.0%; Mo, 4.8%; Vickers hardness number of 280) by a lost wax technique. The metal

Materials 2018, 11, 1043 4 of 10
abrader surface to be tested was polished in one direction with a 1200-grit brown rubber point(Brownie® Polisher PC2, SHOFU, Kyoto, Japan). Polishing the surfaces of the zirconia abraders wasperformed using a polishing kit (Soft Diamonds Grinding and Buffing Wheels; Asami Tanaka Dental,Friedrichsdorf, Germany). The abraders were polished with the full series of polishing discs rotatingat approximately 10,000 rpm in a slow speed handpiece [18].
Materials 2018, 11, x FOR PEER REVIEW 4 of 10
(a) (b)
(c) (d)
Figure 2. The zirconia abraders were fabricated by milling, and the metal abrader was 3D printed,
invested, and cast into a CoCr alloy. (a) computer assisted design for the abraders; (b) calculation and
arrangement on CAM software (hyperDENT® version 7.4, FOLLOW-ME! Technology GmbH,
Munich, Germany) for the zirconia abrader; (c) the zirconia abrader inside a block after milling; (d)
sacrifice patterns made of castable 3D printing resin for the metal abraders.
2.2. Wear Testing and Quantitative/Qualitative Analysis of Wear
A chewing simulator (CS-4.8, SD; Mechatronik, Feldkirchen-Westerham, Germany), which can
test 8 antagonists and abrader pairs simultaneously, was used in this study. Each chamber consisted
of an upper sample holder on which the abrader could be fixed with a screw, and a lower plastic
sample holder on which the substrate specimen was built. The parameters used in this study are
presented in Table 2. The chewing cycle of the abrader was set to have 5 mm vertical descending
movement, 2 mm horizontal movement, ascend, and recover to its original position. The vertical load
was maintained at 5 kg during the scraping motion, equivalent to the masticating force of 49 N [24].
It was conducted under a thermocycling condition of 5–55 °C by a heat/cool system with a
programmable logic. Each specimen was abraded for 30,000 cycles, which is equivalent to one and a
half months of chewing from a clinical perspective
Table 2. Parameters of the chewing simulator.
Parameter Characteristics
Weight per sample 5 kg
Cycle frequency 0.8 Hz
Vertical movement 5 mm
Horizontal movement 2 mm
Rising speed 55 mm/s
Descending speed 55 mm/s
Forward speed 55 mm/s
Backward speed 55 mm/s
Cold/hot bath temperature 5 °C/55 °C
Dwell time 60 s
The abraded specimens were steam cleaned and air-dried to remove any specks of dirt prior to
scanning. To obtain surface data, the specimens were scanned in a 3-axis blue LED light scanner
(Identica Hybrid; Medit, Seoul, Korea) with an accuracy of 7 μm (ISO 12836). For the quantification
of wear, loss of volume and maximal depth can be measured directly on specimens using a 3D
Figure 2. The zirconia abraders were fabricated by milling, and the metal abrader was 3D printed,invested, and cast into a CoCr alloy. (a) computer assisted design for the abraders; (b) calculation andarrangement on CAM software (hyperDENT® version 7.4, FOLLOW-ME! Technology GmbH, Munich,Germany) for the zirconia abrader; (c) the zirconia abrader inside a block after milling; (d) sacrificepatterns made of castable 3D printing resin for the metal abraders.
2.2. Wear Testing and Quantitative/Qualitative Analysis of Wear
A chewing simulator (CS-4.8, SD; Mechatronik, Feldkirchen-Westerham, Germany), which cantest 8 antagonists and abrader pairs simultaneously, was used in this study. Each chamber consisted ofan upper sample holder on which the abrader could be fixed with a screw, and a lower plastic sampleholder on which the substrate specimen was built. The parameters used in this study are presented inTable 2. The chewing cycle of the abrader was set to have 5 mm vertical descending movement, 2 mmhorizontal movement, ascend, and recover to its original position. The vertical load was maintained at5 kg during the scraping motion, equivalent to the masticating force of 49 N [24]. It was conductedunder a thermocycling condition of 5–55 ◦C by a heat/cool system with a programmable logic. Eachspecimen was abraded for 30,000 cycles, which is equivalent to one and a half months of chewing froma clinical perspective
Table 2. Parameters of the chewing simulator.
Parameter Characteristics
Weight per sample 5 kgCycle frequency 0.8 Hz
Vertical movement 5 mmHorizontal movement 2 mm
Rising speed 55 mm/sDescending speed 55 mm/s
Forward speed 55 mm/sBackward speed 55 mm/s
Cold/hot bath temperature 5 ◦C/55 ◦CDwell time 60 s

Materials 2018, 11, 1043 5 of 10
The abraded specimens were steam cleaned and air-dried to remove any specks of dirt priorto scanning. To obtain surface data, the specimens were scanned in a 3-axis blue LED light scanner(Identica Hybrid; Medit, Seoul, Korea) with an accuracy of 7 µm (ISO 12836). For the quantification ofwear, loss of volume and maximal depth can be measured directly on specimens using a 3D scanningdevice, an optical sensor, or a profilometry device. There was a very good match between the threekinds of measuring methods to quantify, and the ranking has not been significantly affected by thequantitative methods [25]. Due to its simplicity and speed, the scanning was adopted in this study.The acquired image was imported on the universal reverse engineering software (Rapidform 2004;version, Geomagic Inc., Cary, NC, USA). The worn part of the specimen was cut out, and this shell wasinverted with the “reverse normal” command. It was then precisely aligned on top of the rectangularparallelepiped measuring 6 × 5 × 0.5 mm (width × length × height) on the universal CAD S/W(Rhinoceros® version 5, Robert McNeel & Associates, Seattle, WA, USA) and combined into one solidto enable volume measurement. The amount of abrasion (volume loss) by the chewing simulatorwas calculated by subtracting the volume of the rectangular solid meshbox, which was 15 mm3, fromthe total volume of the produced solid. The wear depth (maximal depth loss) was calculated bysubtracting the height of the meshbox, which was 0.5 mm, from the total height. The qualitative wearanalysis was performed on gold-sputtered replicas of the specimens with field emission scanningelectron microscopy (FESEM) (Hitachi S-4700, Hitachi High-Technologies Group, Schaumburg, IL,USA) at various magnifications at the end of the wear test.
2.3. Statistical Analysis
Statistical analysis of the values from the materials was carried out using a statistics software(SPSS, IBM Corp., New York, NY, USA). Tests of normality and equality of variances were applied.The nonparametric Kruskal–Wallis and Mann–Whitney tests were used to analyze the data ata significance level of 5%.
3. Results
The volume loss and the maximal depth loss of wear of the substrate specimens after the chewingcycles are presented in Figures 3 and 4. The medians and interquartile ranges (IQRs) of the volumeloss (mm3) against the zirconia abrader and the metal abrader, respectively, was 1.11 (IQR, 0.96–1.50),and 1.22 (0.47–2.20) for the 3D printed resin, 1.20 (0.90–1.42) and 1.11 (0.63–1.81) for the milled resin,and 1.06 (0.93–1.63), and 1.06 (0.73–2.30) for the self-cured resin (Figure 3). There was not any significantdifference in the volume loss among the resin materials (p = 0.957).
Materials 2018, 11, x FOR PEER REVIEW 5 of 10
scanning device, an optical sensor, or a profilometry device. There was a very good match between
the three kinds of measuring methods to quantify, and the ranking has not been significantly affected
by the quantitative methods [25]. Due to its simplicity and speed, the scanning was adopted in this
study. The acquired image was imported on the universal reverse engineering software (Rapidform
2004; version, Geomagic Inc., Cary, NC, USA). The worn part of the specimen was cut out, and this
shell was inverted with the “reverse normal” command. It was then precisely aligned on top of the
rectangular parallelepiped measuring 6 × 5 × 0.5 mm (width × length × height) on the universal CAD
S/W (Rhinoceros® version 5, Robert McNeel & Associates, Seattle, WA, USA) and combined into one
solid to enable volume measurement. The amount of abrasion (volume loss) by the chewing simulator
was calculated by subtracting the volume of the rectangular solid meshbox, which was 15 mm3, from
the total volume of the produced solid. The wear depth (maximal depth loss) was calculated by
subtracting the height of the meshbox, which was 0.5 mm, from the total height. The qualitative wear
analysis was performed on gold-sputtered replicas of the specimens with field emission scanning
electron microscopy (FESEM) (Hitachi S-4700, Hitachi High-Technologies Group, Schaumburg, IL,
USA) at various magnifications at the end of the wear test.
2.3. Statistical Analysis
Statistical analysis of the values from the materials was carried out using a statistics software
(SPSS, IBM Corp., New York, NY, USA). Tests of normality and equality of variances were applied.
The nonparametric Kruskal–Wallis and Mann–Whitney tests were used to analyze the data at a
significance level of 5%.
3. Results
The volume loss and the maximal depth loss of wear of the substrate specimens after the
chewing cycles are presented in Figures 3 and 4. The medians and interquartile ranges (IQRs) of the
volume loss (mm3) against the zirconia abrader and the metal abrader, respectively, was 1.11 (IQR,
0.96–1.50), and 1.22 (0.47–2.20) for the 3D printed resin, 1.20 (0.90–1.42) and 1.11 (0.63–1.81) for the
milled resin, and 1.06 (0.93–1.63), and 1.06 (0.73–2.30) for the self-cured resin (Figure 3). There was
not any significant difference in the volume loss among the resin materials (p = 0.957).
Figure 3. The wear volume loss of the materials against the zirconia and the metal abraders. The
length of the box represents the interquartile ranges (IQRs) and the horizontal black line in the box
stands for the median. The vertical lines extend to the maximum and minimum values.
The medians and IQRs of the maximal depth loss (mm) against the zirconia abrader and the
metal abrader, respectively, was 0.36 (IQR, 0.32–0.43) and 0.42 (0.22–0.56) for the 3D printed resin,
0.35 (0.30–0.41) and 0.38 (0.28–0.51) for the milled resin, and 0.35 (0.32–0.41) and 0.38 (0.25–0.57) for
Figure 3. The wear volume loss of the materials against the zirconia and the metal abraders. The lengthof the box represents the interquartile ranges (IQRs) and the horizontal black line in the box stands forthe median. The vertical lines extend to the maximum and minimum values.
Materials 2018, 11, 1043 6 of 10
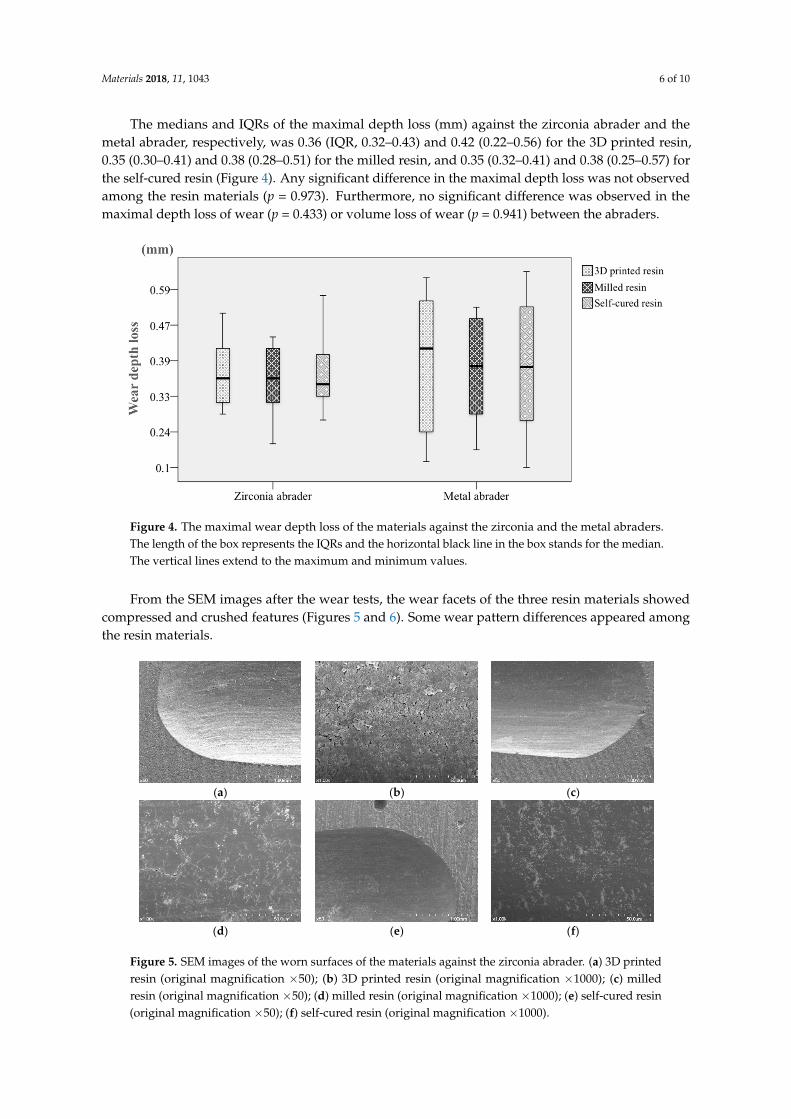
The medians and IQRs of the maximal depth loss (mm) against the zirconia abrader and themetal abrader, respectively, was 0.36 (IQR, 0.32–0.43) and 0.42 (0.22–0.56) for the 3D printed resin,0.35 (0.30–0.41) and 0.38 (0.28–0.51) for the milled resin, and 0.35 (0.32–0.41) and 0.38 (0.25–0.57) forthe self-cured resin (Figure 4). Any significant difference in the maximal depth loss was not observedamong the resin materials (p = 0.973). Furthermore, no significant difference was observed in themaximal depth loss of wear (p = 0.433) or volume loss of wear (p = 0.941) between the abraders.
Materials 2018, 11, x FOR PEER REVIEW 6 of 10
the self-cured resin (Figure 4). Any significant difference in the maximal depth loss was not observed
among the resin materials (p = 0.973). Furthermore, no significant difference was observed in the
maximal depth loss of wear (p = 0.433) or volume loss of wear (p = 0.941) between the abraders.
Figure 4. The maximal wear depth loss of the materials against the zirconia and the metal abraders.
The length of the box represents the IQRs and the horizontal black line in the box stands for the
median. The vertical lines extend to the maximum and minimum values.
From the SEM images after the wear tests, the wear facets of the three resin materials showed
compressed and crushed features (Figures 5 and 6). Some wear pattern differences appeared among
the resin materials.
(a) (b) (c)
(d) (e) (f)
Figure 5. SEM images of the worn surfaces of the materials against the zirconia abrader. (a) 3D printed
resin (original magnification ×50); (b) 3D printed resin (original magnification ×1000); (c) milled resin
(original magnification ×50); (d) milled resin (original magnification ×1000); (e) self-cured resin
(original magnification ×50); (f) self-cured resin (original magnification ×1000).
In some of the 3D printed resin specimens, cracks were observed when the metal abrader was
applied, and the bond between the layers was observed to be detached (Figure 6a). In the ×1000 image,
fine flaws like cracks were observed and some resin particles that did not fall off remained on the
Figure 4. The maximal wear depth loss of the materials against the zirconia and the metal abraders.The length of the box represents the IQRs and the horizontal black line in the box stands for the median.The vertical lines extend to the maximum and minimum values.
From the SEM images after the wear tests, the wear facets of the three resin materials showedcompressed and crushed features (Figures 5 and 6). Some wear pattern differences appeared amongthe resin materials.
Materials 2018, 11, x FOR PEER REVIEW 6 of 10
the self-cured resin (Figure 4). Any significant difference in the maximal depth loss was not observed
among the resin materials (p = 0.973). Furthermore, no significant difference was observed in the
maximal depth loss of wear (p = 0.433) or volume loss of wear (p = 0.941) between the abraders.
Figure 4. The maximal wear depth loss of the materials against the zirconia and the metal abraders.
The length of the box represents the IQRs and the horizontal black line in the box stands for the
median. The vertical lines extend to the maximum and minimum values.
From the SEM images after the wear tests, the wear facets of the three resin materials showed
compressed and crushed features (Figures 5 and 6). Some wear pattern differences appeared among
the resin materials.
(a) (b) (c)
(d) (e) (f)
Figure 5. SEM images of the worn surfaces of the materials against the zirconia abrader. (a) 3D printed
resin (original magnification ×50); (b) 3D printed resin (original magnification ×1000); (c) milled resin
(original magnification ×50); (d) milled resin (original magnification ×1000); (e) self-cured resin
(original magnification ×50); (f) self-cured resin (original magnification ×1000).
In some of the 3D printed resin specimens, cracks were observed when the metal abrader was
applied, and the bond between the layers was observed to be detached (Figure 6a). In the ×1000 image,
fine flaws like cracks were observed and some resin particles that did not fall off remained on the
Figure 5. SEM images of the worn surfaces of the materials against the zirconia abrader. (a) 3D printedresin (original magnification ×50); (b) 3D printed resin (original magnification ×1000); (c) milledresin (original magnification ×50); (d) milled resin (original magnification ×1000); (e) self-cured resin(original magnification ×50); (f) self-cured resin (original magnification ×1000).

Materials 2018, 11, 1043 7 of 10
In some of the 3D printed resin specimens, cracks were observed when the metal abrader wasapplied, and the bond between the layers was observed to be detached (Figure 6a). In the ×1000 image,fine flaws like cracks were observed and some resin particles that did not fall off remained on the layer(Figure 6b). The surfaces of the wear areas of the three materials in contact with the zirconia abraderappeared relatively smooth. The milled resin specimens were dented and showed homogenous images(Figures 5c and 6c). In self-cured resin specimens, small pores were observed induced by air bubblesdespite curing under pressure (Figures 5e and 6e).
Materials 2018, 11, x FOR PEER REVIEW 7 of 10
layer (Figure 6b). The surfaces of the wear areas of the three materials in contact with the zirconia
abrader appeared relatively smooth. The milled resin specimens were dented and showed
homogenous images (Figures 5c and 6c). In self-cured resin specimens, small pores were observed
induced by air bubbles despite curing under pressure (Figures 5e and 6e).
(a) (b) (c)
(d) (e) (f)
Figure 6. SEM images of the worn surfaces of the materials against the metal abrader. (a) 3D printed
resin (original magnification ×50); (b) 3D printed resin (original magnification ×1000); (c) milled resin
(original magnification ×50); (d) milled resin (original magnification ×1000); (e) self-cured resin
(original magnification ×50); (f) self-cured resin (original magnification ×1000).
4. Discussion
As the results of this study, the 3D printing resin material showed clinically comparable wear
resistance. The amount of wear of the 3D printed resin was similar to the wear amount of the milled
and the conventional self-cured resins. The values of volume loss and maximal depth loss of wear
showed similar patterns to each other. In the SEM images, some pores were observed in the self-
cured resin specimens, and, from a clinical standpoint, these pores can have the potential to cause a
defect or fracture with longer use. The wear facets showed various features: compressed and/or
crushed, rough and/or smooth, and ingredients compacted to be clump together, as revealed by the
SEM images of the resin specimens. The basic component of these three resin materials is the same,
but differences in wear patterns were found between the materials according to the abraders. This
suggests that the properties of PMMA-based resin materials may vary according to the fabrication
methods. In the 3D printed resin specimens when the metal abrader was applied, cracks and fine
flaws were observed. Separation of the inter-layer bonds occurred, after which the resin residues still
remained attached to the lower resin layer. This seems to be due to the difference in manufacturing
methods. In the 3D printing manufacturing method, layer printing is performed and bonding
between layers occurs. From a mechanical point of view, inter-layer bonding is generally weaker than
intra-layer bonding in 3D printed materials. The reason for the difference by the abraders seems to
be due to the difference in the nature of the abrader materials. The surface roughness of the abraders
affected only the beginning, and, after a certain period of contact, wear was influenced by the
properties of the material itself. The zirconia particles are smoother than the non-precious metal,
resulting in a difference in the results of this study.
Test parameters to investigate the wear resistance of the materials differ widely from one study
to another. Most in vitro wear tests allowed ranking of materials and comparative assessment under
standardized conditions, but there has been limited correlation with clinical results. Therefore,
examination parameters similar to the clinical conditions are desirable. The 49 N chewing force
Figure 6. SEM images of the worn surfaces of the materials against the metal abrader. (a) 3D printedresin (original magnification ×50); (b) 3D printed resin (original magnification ×1000); (c) milledresin (original magnification ×50); (d) milled resin (original magnification ×1000); (e) self-cured resin(original magnification ×50); (f) self-cured resin (original magnification ×1000).
4. Discussion
As the results of this study, the 3D printing resin material showed clinically comparable wearresistance. The amount of wear of the 3D printed resin was similar to the wear amount of the milledand the conventional self-cured resins. The values of volume loss and maximal depth loss of wearshowed similar patterns to each other. In the SEM images, some pores were observed in the self-curedresin specimens, and, from a clinical standpoint, these pores can have the potential to cause a defect orfracture with longer use. The wear facets showed various features: compressed and/or crushed, roughand/or smooth, and ingredients compacted to be clump together, as revealed by the SEM images ofthe resin specimens. The basic component of these three resin materials is the same, but differencesin wear patterns were found between the materials according to the abraders. This suggests that theproperties of PMMA-based resin materials may vary according to the fabrication methods. In the 3Dprinted resin specimens when the metal abrader was applied, cracks and fine flaws were observed.Separation of the inter-layer bonds occurred, after which the resin residues still remained attachedto the lower resin layer. This seems to be due to the difference in manufacturing methods. In the 3Dprinting manufacturing method, layer printing is performed and bonding between layers occurs. Froma mechanical point of view, inter-layer bonding is generally weaker than intra-layer bonding in 3Dprinted materials. The reason for the difference by the abraders seems to be due to the difference in thenature of the abrader materials. The surface roughness of the abraders affected only the beginning,and, after a certain period of contact, wear was influenced by the properties of the material itself.

Materials 2018, 11, 1043 8 of 10
The zirconia particles are smoother than the non-precious metal, resulting in a difference in the resultsof this study.
Test parameters to investigate the wear resistance of the materials differ widely from one studyto another. Most in vitro wear tests allowed ranking of materials and comparative assessment understandardized conditions, but there has been limited correlation with clinical results. Therefore,examination parameters similar to the clinical conditions are desirable. The 49 N chewing forcerepresents the average chewing force, which has been popularly adopted for in vitro simulations oforal conditions. A horizontal movement was included to simulate oral chewing with water as the liquidmedium. It was reported that cracks could be formed because the load on the sliding element causeda stress 10 times greater than the static load [26]. In this study, 2 mm horizontal movement was appliedwith the water chambers drained for changes between 5 ◦C and 55 ◦C. Thermal cycling has been usedas a method of artificial aging to produce a wear increasing effect. Water supplying and thermocyclingcaused additional aging, and removed debris from the specimen surfaces keeping specimens wetduring the wear test. In addition, 0.4 to 75 N ranges of force and 10,000 to 1,200,000 cycles wereadopted for most wear tests. A cycle of 240,000 to 250,000 loadings in the chewing simulator is similarto that of about one year in clinical situations [27]. Thus, 30,000 cycles of load are comparable toapproximately one and a half months of chewing, from a clinical perspective. In the dental field,provisional restorations are usually used for less than one and a half months. Furthermore, it wasfound that about 40% of the final wear occurred during the first 10,000 cycles in resin materials [28].Most in vitro wear tests represented a progressive step where wear increased rapidly in the initialstage and then the curve became flat. The 3D printed resin material showed enough wear resistancefor dental provisional restorations.
Studies on 3D printed materials have been focused on strength and accuracy. In a previous study,the elastic modulus of 3D printed resin material (C&B; NextDent, Soesterberg, The Netherlands) wasfound to be similar to that of conventional resin material (Jet™; Lang Dental Mfg., Wheeling, IL,USA), and the peak stress of the 3D printed resin material was significantly greater than that of theconventional resin material [22]. In our study, the wear resistance of the material fabricated by 3Dprinting was evaluated, and the results showed that the 3D printed resin material could yield stableclinical outcomes comparable to those of the milled or the self-cured resins. Clinical use of 3D printingtechniques would increase productivity and offer a more convenient method of fabricating provisionalrestorations. For a wider application of the 3D printing technology in dental care, additional studiesare required to examine flexural, compressive, tensile, shear, and fatigue strength along with solubilityand permeability. These physical properties of the 3D printed resin materials with respect to manyfactors should be studied in the future.
5. Conclusions
The use of resin materials in the 3D printing manufacturing for making a dental restoration isworthy of study in a novel way. The purpose of this study was to investigate the volume loss andthe maximal depth loss of wear of the 3D printed resin material compared with the milled and theconventionally fabricated resin materials opposing zirconia and metal antagonists. Within the limits ofthis in vitro study, the wear resistance of the 3D printed resin material was in a range comparable tothe milled or the conventionally fabricated resin materials. The 3D printing manufacturing appearedto be suitable for dental restorations.
Author Contributions: Conceptualization, J.-H.L.; Methodology, J.-M.P., J.-S.A. and J.-H.L.; Software, J.-M.P. andH.-S.C.; Validation, H.-S.C. and J.-H.L.; Formal Analysis, J.-M.P.; Investigation, J.-M.P. and J.-S.A.; Resources,J.-H.L.; Data Curation, J.-M.P. and J.-H.L.; Writing—Original Draft Preparation, J.-M.P.; Writing—Review andEditing, H.-S.C., J.-S.A. and J.-H.L.; Visualization, J.-M.P. and J.-H.L.; Supervision, J.-H.L. All authors gave finalapproval and agreed to be accountable for all aspects of the work.
Funding: This research received no external funding.
Conflicts of Interest: The authors declare no conflict of interest.

Materials 2018, 11, 1043 9 of 10
References
1. Atzeni, E.; Salmi, A. Economics of additive manufacturing for end-usable metal parts. Int. J. Adv.Manuf. Technol. 2012, 62, 1147–1155. [CrossRef]
2. Frazier, W.E. Metal Additive Manufacturing: A Review. J. Mater. Eng. Perform. 2014, 23, 1917–1928.[CrossRef]
3. Van Noort, R. The future of dental devices is digital. Dent. Mater. 2012, 28, 3–12. [CrossRef] [PubMed]4. Kim, D.Y.; Jeon, J.H.; Kim, J.H.; Kim, H.Y.; Kim, W.C. Reproducibility of different arrangement of
resin copings by dental microstereolithography: Evaluating the marginal discrepancy of resin copings.J. Prosthet. Dent. 2017, 117, 260–265. [CrossRef] [PubMed]
5. Ishida, Y.; Miyasaka, T. Dimensional accuracy of dental casting patterns created by 3D printers. Dent. Mater.J. 2016, 35, 250–256. [CrossRef] [PubMed]
6. Barazanchi, A.; Li, K.C.; Al-Amleh, B.; Lyons, K.; Waddell, J.N. Additive Technology: Update on CurrentMaterials and Applications in Dentistry. J. Prosthodont. 2017, 26, 156–163. [CrossRef] [PubMed]
7. Park, J.Y.; Jeong, I.D.; Lee, J.J.; Bae, S.Y.; Kim, J.H.; Kim, W.C. In vitro assessment of the marginal and internalfits of interim implant restorations fabricated with different methods. J. Prosthet. Dent. 2016, 116, 536–542.[CrossRef] [PubMed]
8. Neto, R.; Costa-Ferreira, A.; Leal, N.; Machado, M.; Reis, A. An engineering-based approach for design andfabrication of a customized nasal prosthesis. Prosthet. Orthot. Int. 2015, 39, 422–428. [CrossRef] [PubMed]
9. Tsai, M.J.; Wu, C.T. Study of mandible reconstruction using a fibula flap with application of additivemanufacturing technology. Biomed. Eng. Online 2014, 13. [CrossRef] [PubMed]
10. Fernandes, N.; van den Heever, J.; Hoogendijk, C.; Botha, S.; Booysen, G.; Els, J. Reconstruction ofan Extensive Midfacial Defect Using Additive Manufacturing Techniques. J. Prosthodont. 2016, 25, 589–594.[CrossRef] [PubMed]
11. Cheng, A.; Humayun, A.; Cohen, D.J.; Boyan, B.D.; Schwartz, Z. Additively manufactured 3D porousTi-6Al-4V constructs mimic trabecular bone structure and regulate osteoblast proliferation, differentiationand local factor production in a porosity and surface roughness dependent manner. Biofabrication 2014, 6.[CrossRef] [PubMed]
12. Al Mortadi, N.; Jones, Q.; Eggbeer, D.; Lewis, J.; Williams, R.J. Fabrication of a resin appliance with alloycomponents using digital technology without an analog impression. Am. J. Orthodont. Dentofac. Orthop.2015, 148, 862–867. [CrossRef] [PubMed]
13. Gebhardt, A.; Schmidt, F.M.; Hotter, J.S.; Sokalla, W.; Sokalla, P. Additive manufacturing by selective lasermelting the realizer desktop machine and its application for the dental industry. Phys. Procedia 2010, 5,543–549. [CrossRef]
14. Carter, S.S.D.; Costa, P.F.; Vaquette, C.; Ivanovski, S.; Hutmacher, D.W.; Malda, J. Additive Biomanufacturing:An Advanced Approach for Periodontal Tissue Regeneration. Ann. Biomed. Eng. 2017, 45, 12–22. [CrossRef][PubMed]
15. Chen, J.N.; Ahmad, R.; Suenaga, H.; Li, W.; Sasaki, K.; Swain, M.; Li, Q. Shape Optimization for AdditiveManufacturing of Removable Partial Dentures—A New Paradigm for Prosthetic CAD/CAM. PLoS ONE2015, 10, e0132552. [CrossRef] [PubMed]
16. Nakata, T.; Shimpo, H.; Ohkubo, C. Clasp fabrication using one-process molding by repeated laser sinteringand high-speed milling. J. Prosthodont. Res. 2017, 61, 276–282. [CrossRef] [PubMed]
17. Patras, M.; Naka, O.; Doukoudakis, S.; Pissiotis, A. Management of Provisional Restorations’ Deficiencies:A Literature Review. J. Esthet. Restor. Dent. 2012, 24, 26–38. [CrossRef] [PubMed]
18. Ghazal, M.; Albashaireh, Z.S.; Kern, M. Wear resistance of nanofilled composite resin and feldspathic ceramicartificial teeth. J. Prosthet. Dent. 2008, 100, 441–448. [CrossRef]
19. Rayyan, M.M.; Aboushelib, M.; Sayed, N.M.; Ibrahim, A.; Jimbo, R. Comparison of interim restorationsfabricated by CAD/CAM with those fabricated manually. J. Prosthet. Dent. 2015, 114, 414–419. [CrossRef][PubMed]
20. Alp, G.; Murat, S.; Yilmaz, B. Comparison of Flexural Strength of Different CAD/CAM PMMA-BasedPolymers. J. Prosthodont. 2018. [CrossRef] [PubMed]
21. Karaokutan, I.; Sayin, G.; Kara, O. In vitro study of fracture strength of provisional crown materials.J. Adv. Prosthodont. 2015, 7, 27–31. [CrossRef] [PubMed]

Materials 2018, 11, 1043 10 of 10
22. Tahayeri, A.; Morgan, M.; Fugolin, A.P.; Bompolaki, D.; Athirasala, A.; Pfeifer, C.S.; Ferracane, J.L.;Bertassoni, L.E. 3D printed versus conventionally cured provisional crown and bridge dental materials.Dent. Mater. 2018, 34, 192–200. [CrossRef] [PubMed]
23. Preis, V.; Behr, M.; Kolbeck, C.; Hahnel, S.; Handel, G.; Rosentritt, M. Wear performance of substructureceramics and veneering porcelains. Dent. Mater. 2011, 27, 796–804. [CrossRef] [PubMed]
24. Krejci, I.; Lutz, F.; Reimer, M.; Heinzmann, J.L. Wear of Ceramic Inlays, Their Enamel Antagonists, and LutingCements. J. Prosthet. Dent. 1993, 69, 425–430. [CrossRef]
25. Heintze, S.D.; Cavalleri, A.; Forjanic, M.; Zellweger, G.; Rousson, V. A comparison of three different methodsfor the quantification of the in vitro wear of dental materials. Dent. Mater. 2006, 22, 1051–1062. [CrossRef][PubMed]
26. Mair, L.H.; Stolarski, T.A.; Vowles, R.W.; Lloyd, C.H. Wear: Mechanisms, manifestations and measurement.Report of a workshop. J. Dent. 1996, 24, 141–148. [CrossRef]
27. DeLong, R.; Sakaguchi, R.L.; Douglas, W.H.; Pintado, M.R. The wear of dental amalgam in an artificialmouth: A clinical correlation. Dent. Mater. 1985, 1, 238–242. [CrossRef]
28. Heintze, S.D. How to qualify and validate wear simulation devices and methods. Dent. Mater. 2006, 22,712–734. [CrossRef] [PubMed]
© 2018 by the authors. Licensee MDPI, Basel, Switzerland. This article is an open accessarticle distributed under the terms and conditions of the Creative Commons Attribution(CC BY) license (http://creativecommons.org/licenses/by/4.0/).