webinar sesion: "built environment supports for brt ridership - evidence from latin...
TRANSCRIPT
Built environment supports
for BRT ridership:
Evidence from Latin
America Daniel A. Rodríguez, Ph.D. y Erik Vergel, Ph.D. candidate
University of North Carolina, Chapel Hill
December 18, 2015

Presentation outline Background
Motivation
Methods
Results
Discussion
Conclusions
2

Attributes of transit oriented development
(TOD): Compact and dense
High land use mixtures
High-quality pedestrian
environment
Strong articulation between
transit and environment around
it
Background: TOD
Source: IPPUC (2011)
Source: Reconnectingamerica.org`

Make transit use more viable (TCRP 2008)
Concentrate demand (economies of
density)
Balance flows (Stockholm goal)
Real estate/neighborhood development
strategy
Benefits of TOD
Generalized perception that the “T” in
TOD is rail, not BRT Lack of locational rigidity & permanence
Noise & pollution
Allure of rails’ newness
All this, despite Curitiba’s exemplary approach
Motivation
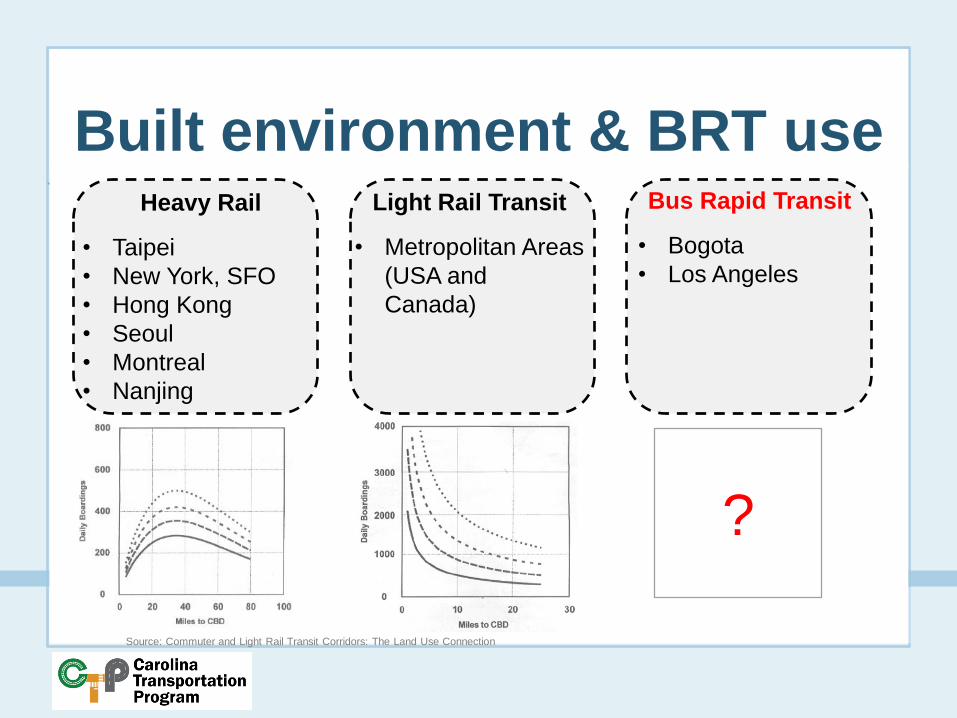
Built environment & BRT use Heavy Rail
• Taipei
• New York, SFO
• Hong Kong
• Seoul
• Montreal
• Nanjing
Light Rail Transit
• Metropolitan Areas
(USA and
Canada)
Bus Rapid Transit
• Bogota
• Los Angeles
?
Source: Commuter and Light Rail Transit Corridors: The Land Use Connection
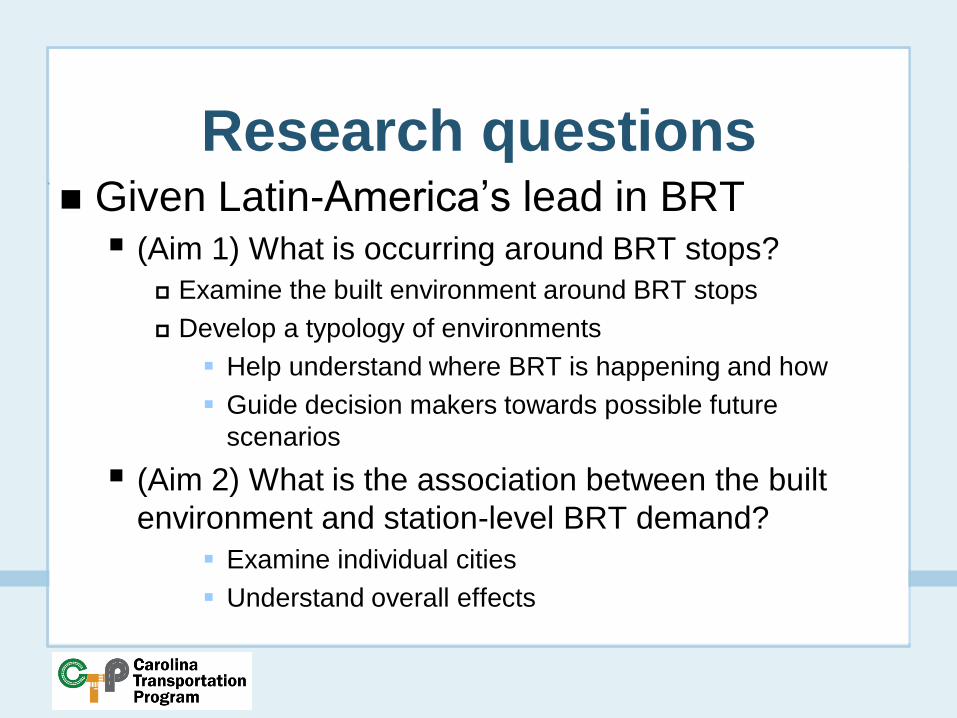
Given Latin-America’s lead in BRT (Aim 1) What is occurring around BRT stops?
Examine the built environment around BRT stops
Develop a typology of environments
Help understand where BRT is happening and how
Guide decision makers towards possible future
scenarios
(Aim 2) What is the association between the built
environment and station-level BRT demand?
Examine individual cities
Understand overall effects
Research questions

Presentation outline Background
Motivation
Methods
Results
Discussion
Conclusions
8

Collect stop-level data
Inclusion criteria for BRTs > 5 yrs in operation
Medium to large city
Seven Latin American cities 16% of worlds’ BRT use
31% of Latin America BRT use
Methods

Identify stops with different conditions Confirmed/reconsidered with local planners
Methods
City # stops
studied % of all
# terminals
studied % of all
Bogotá 26 19.26% 5 55.56%
Sao Paulo ABD
Corridor 7 9.72%
5 62.50%
Curitiba 9 7.32% 7 46.67%
Goiânia 6 33.33% 5 71.43%
Ciudad de
Guatemala 8 57.14%
1 33.33%
Quito 24 23.76% 6 54.55%
Guayaquil 8 12.31% 3 75.00%

What to collect?
Data collection
1. Density
2. Diversity (use)
3. Design of streets
4. Destination
accessibility
5. Distance to transit
BRT demand (# pax per day) The five 5 “Ds”
6. Parking
7. NMT
infrastructure
8. Socioeconomic
characteristics
9. Facilities and
public spaces
Additional dimensions
TOD?

Environment around each stop 250 m for simple stops (0.2 km2)
500 m for terminal (0.79km2)
Atypical cases (n=8),
paired or twin stops
Data collection
Source: Adjusted by Vergel (2012) from original by Gonzalez & Hartleben (2012)
Data source: Google Earth, Gonzalez, Hartleben, Alcaldia de la Ciudad de Guatemala, Fieldwork Data, 2011-2012.
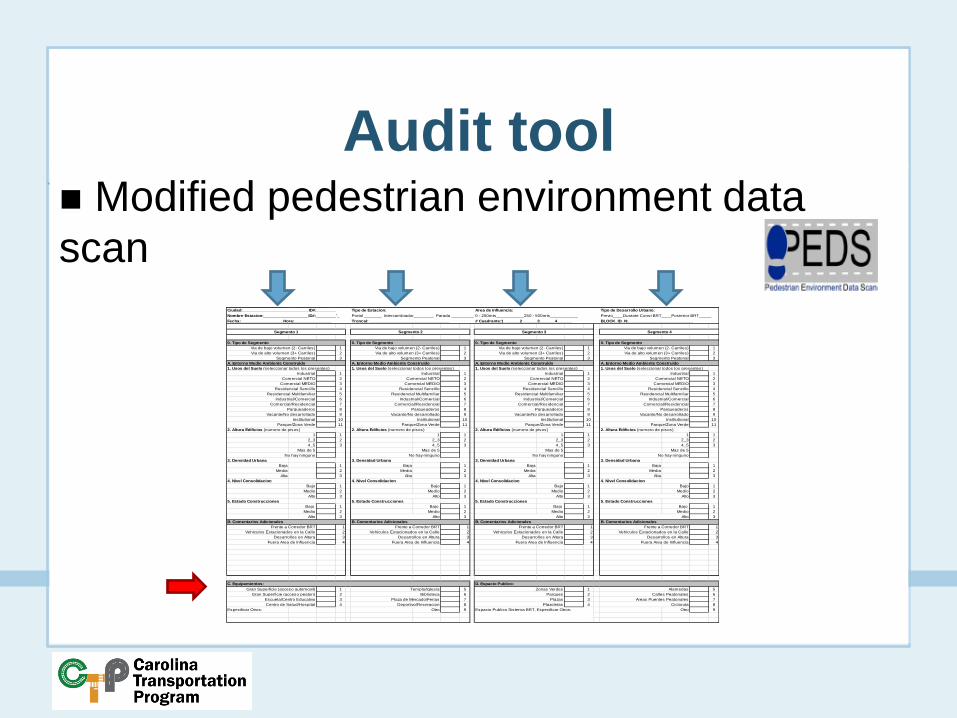
Modified pedestrian environment data
scan
Audit tool
Tipo de Desarrollo Urbano:
Portal _______ Intercambiador________ Parada _________ 0 - 250mts___________250 - 500mts___________ Previo____Durante Const BRT____Posterior BRT_____
0. Tipo de Segmento 0. Tipo de Segmento 0. Tipo de Segmento 0. Tipo de Segmento
1 1 1 1
2 2 2 2
3 3 3 3
A. Entorno Medio Ambiente Construido A. Entorno Medio Ambiente Construido A. Entorno Medio Ambiente Construido A. Entorno Medio Ambiente Construido
1. Usos del Suelo (seleccionar todos los presentes) 1. Usos del Suelo (seleccionar todos los presentes) 1. Usos del Suelo (seleccionar todos los presentes) 1. Usos del Suelo (seleccionar todos los presentes)
1 1 1 1
2 2 2 2
3 3 3 3
4 4 4 4
5 5 5 5
6 6 6 6
7 7 7 7
8 8 8 8
9 9 9 9
10 10 10 10
11 11 11 11
2. Altura Edificios (numero de pisos) 2. Altura Edificios (numero de pisos) 2. Altura Edificios (numero de pisos) 2. Altura Edificios (numero de pisos)
1 1 1 1 1 1 1 1
2_3 2 2_3 2 2_3 2 2_3 2
4_5 3 4_5 3 4_5 3 4_5 3
Mas de 5 Mas de 5 Mas de 5 Mas de 5
No hay ninguno No hay ninguno No hay ninguno No hay ninguno
3. Densidad Urbana 3. Densidad Urbana 3. Densidad Urbana 3. Densidad Urbana
Baja 1 Baja 1 Baja 1 Baja 1
Media 2 Media 2 Media 2 Media 2
Alta 3 Alta 3 Alta 3 Alta 3
4. Nivel Consolidacion 4. Nivel Consolidacion 4. Nivel Consolidacion 4. Nivel Consolidacion
Bajo 1 Bajo 1 Bajo 1 Bajo 1
Medio 2 Medio 2 Medio 2 Medio 2
Alto 3 3 3 3
5. Estado Construcciones 5. Estado Construcciones 5. Estado Construcciones 5. Estado Construcciones
Bajo 1 Bajo 1 Bajo 1 Bajo 1
Medio 2 Medio 2 Medio 2 Medio 2
Alto 3 3 3 3
B. Comentarios Adicionales B. Comentarios Adicionales B. Comentarios Adicionales B. Comentarios Adicionales
Frente a Corredor BRT 1 Frente a Corredor BRT 1 Frente a Corredor BRT 1 Frente a Corredor BRT 1
Vehiculos Estacionados en la Calle 2 Vehiculos Estacionados en la Calle 2 Vehiculos Estacionados en la Calle 2 Vehiculos Estacionados en la Calle 2
Desarrollos en Altura 3 Desarrollos en Altura 3 Desarrollos en Altura 3 Desarrollos en Altura 3
Fuera Area de Influencia 4 Fuera Area de Influencia 4 Fuera Area de Influencia 4 Fuera Area de Influencia 4
1 5 1 5
2 6 2 6
3 7 3 7
4 8 4 8
Especificar Otros: Otro 9 Otro 9
Nombre Estacion:__________________ID#:________'_
Fecha:_________________Hora:_______________ Troncal: ________________________________ # Cuadrante:1 ______2______3______4______ BLOCK_ID_N:__________________________
Segmento 1 Segmento 2 Segmento 3 Segmento 4
Via de bajo volumen (2- Carriles) Via de bajo volumen (2- Carriles)
Industrial Industrial Industrial Industrial
Ciudad: __________________________ID#:________ Tipo de Estacion: Area de Influencia:
Via de bajo volumen (2- Carriles) Via de bajo volumen (2- Carriles)
Via de alto volumen (3+ Carriles) Via de alto volumen (3+ Carriles) Via de alto volumen (3+ Carriles) Via de alto volumen (3+ Carriles)
Segmento Peatonal Segmento Peatonal Segmento Peatonal Segmento Peatonal
Comercial/Residencial Comercial/Residencial Comercial/Residencial Comercial/Residencial
Comercial NETO Comercial NETO Comercial NETO Comercial NETO
Comercial MEDIO Comercial MEDIO Comercial MEDIO Comercial MEDIO
Residencial Sencillo Residencial Sencillo Residencial Sencillo Residencial Sencillo
Residencial Multifamiliar Residencial Multifamiliar Residencial Multifamiliar Residencial Multifamiliar
Industrial/Comercial Industrial/Comercial Industrial/Comercial Industrial/Comercial
Alto Alto Alto
Parqueaderos Parqueaderos Parqueaderos Parqueaderos
Vacante/No desarrollado Vacante/No desarrollado Vacante/No desarrollado Vacante/No desarrollado
Institutional Institutional Institutional Institutional
Parque/Zona Verde Parque/Zona Verde Parque/Zona Verde Parque/Zona Verde
Alto Alto Alto
Centro de Salud/Hospital Deportivo/Recreacion Plazoletas Cicloruta
Espacio Publico Sistema BRT, Especificar Otros:
C. Equipamientos: D. Espacio Publico:
Gran Superficie (acceso automovil) Templo/Iglesia Zonas Verdes Alamedas
Gran Superficie (acceso peaton) Biblioteca Parques Calles Peatonales
Escuela/Centro Educativo Plaza de Mercado/Ferias Plazas Areas Puentes Peatonales

Secondary data at stop level Population, roads, distance to central business area
Other data sources
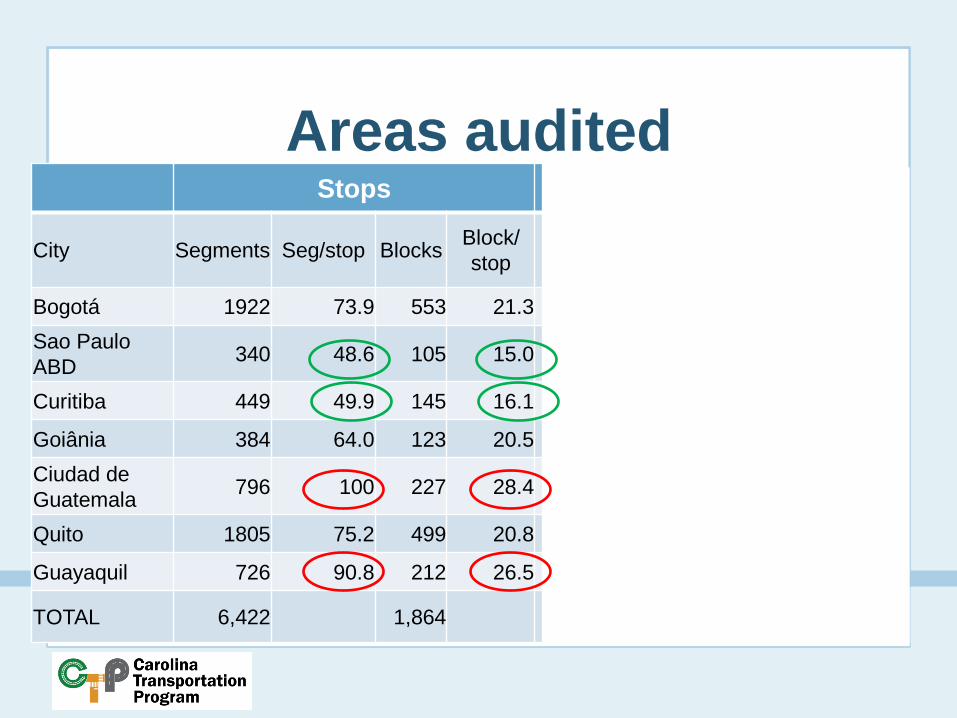
Areas audited Stops
City Segments Seg/stop Blocks Block/
stop
Bogotá 1922 73.9 553 21.3
Sao Paulo
ABD 340 48.6 105 15.0
Curitiba 449 49.9 145 16.1
Goiânia 384 64.0 123 20.5
Ciudad de
Guatemala 796 100 227 28.4
Quito 1805 75.2 499 20.8
Guayaquil 726 90.8 212 26.5
TOTAL 6,422 1,864

Areas audited Stops Terminals
City Segments Seg/stop Blocks Block/
stop Segments Seg/stop Blocks
Block/
stop
Bogotá 1922 73.9 553 21.3 1440 288.0 395 79.0
Sao Paulo
ABD 340 48.6 105 15.0 977 195.4 266 53.2
Curitiba 449 49.9 145 16.1 1189 169.9 312 44.6
Goiânia 384 64.0 123 20.5 924 184.8 267 53.4
Ciudad de
Guatemala 796 100 227 28.4 434 434 121 121.0
Quito 1805 75.2 499 20.8 1312 218.7 311 51.8
Guayaquil 726 90.8 212 26.5 857 285.7 274 91.3
TOTAL 6,422 1,864 7,133 1,946

All data aggregated at stop level, in
different ways Segment-level data % of segments in stop
Block-level data density or count of instances (0-n)
Stop-level data used as continuous variables
Data aggregation

Data aggregation

Factor & cluster analysis
Aim 1: Typology
X1……...X38
O1
.
.
.
.
.
.
.
.
O82
Data matrix
X1……...X38
O1
.
.
.
.
.
.
.
.
O82
Data matrix
F1...Fk
Cluster
1
Cluster
2

Aim 2: Association with
population density

Presentation outline Background
Motivation
Methods
Results
Discussion
Conclusions
21

Aim 1 results: Selected
descriptives (N=120) City Mean SD Min Max
Facility index 2.75 1.49 0.00 6.00
Facility density 24.55 22.34 0.00 122.23
NMT friendliness 57.03 65.72 0.00 336.13
Residential multifamily 0.15 0.18 0.00 0.87
High density 0.09 0.12 0.00 0.60
High consolidation 0.67 0.26 0.00 1.00
Commercial and parking 0.19 0.16 0.00 0.73
On street parking 0.37 0.19 0.00 0.89
Vacant and BRT 0.02 0.02 0.00 0.16
Population density 74.74 70.31 0.48 390.17
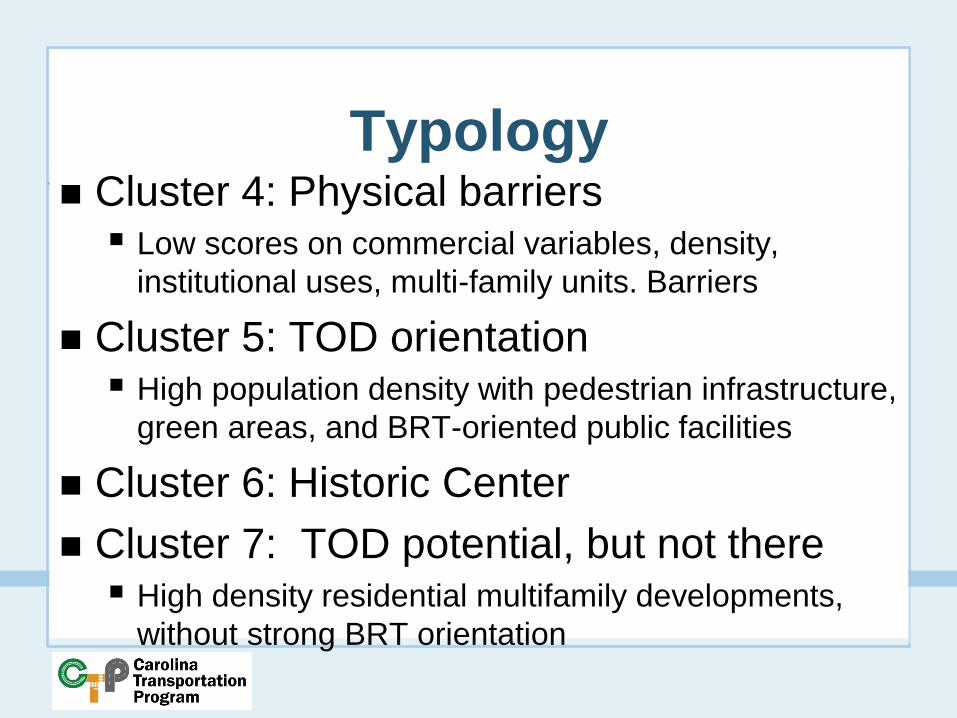
Cluster 4: Physical barriers Low scores on commercial variables, density,
institutional uses, multi-family units. Barriers
Cluster 5: TOD orientation High population density with pedestrian infrastructure,
green areas, and BRT-oriented public facilities
Cluster 6: Historic Center
Cluster 7: TOD potential, but not there High density residential multifamily developments,
without strong BRT orientation
Typology

Cluster 11: Open space Undeveloped land, high quality green spaces, with
some institutional land uses
Typology
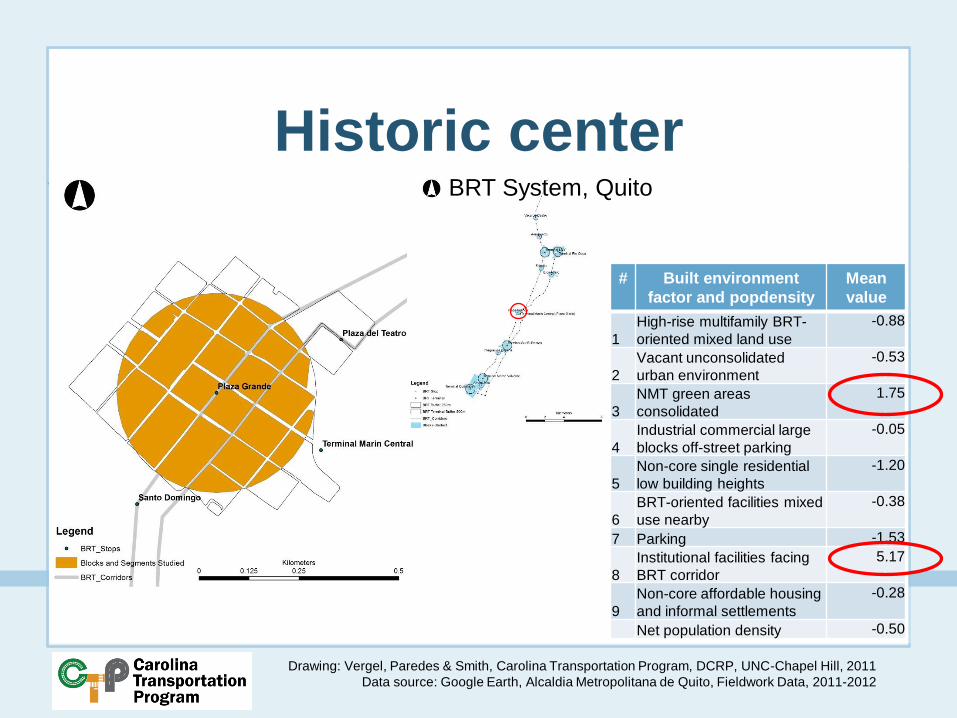
Historic center BRT System, Quito
Drawing: Vergel, Paredes & Smith, Carolina Transportation Program, DCRP, UNC-Chapel Hill, 2011
Data source: Google Earth, Alcaldia Metropolitana de Quito, Fieldwork Data, 2011-2012
# Built environment
factor and popdensity
Mean
value
1
High-rise multifamily BRT-
oriented mixed land use
-0.88
2
Vacant unconsolidated
urban environment
-0.53
3
NMT green areas
consolidated
1.75
4
Industrial commercial large
blocks off-street parking
-0.05
5
Non-core single residential
low building heights
-1.20
6
BRT-oriented facilities mixed
use nearby
-0.38
7 Parking -1.53
8
Institutional facilities facing
BRT corridor
5.17
9
Non-core affordable housing
and informal settlements
-0.28
Net population density -0.50

Historic center
Fuente: Vergel-Tovar (2011)
BRT station Plaza Grande, Quito, Ecuador

TOD potential (n=11) Jardim Botanico BRT System, Curitiba
Drawing: Vergel & Paredes, Carolina Transportation Program, DCRP, UNC-Chapel Hill, 2011
Source: Google Earth, IPPUC, URBS Fieldwork Data, 2011-2012.
# Built environment
factor and popdensity
Mean
value
1
High-rise multifamily BRT-
oriented mixed land use
1.97
2
Vacant unconsolidated urban
environment
-0.04
3
NMT green areas
consolidated
-0.51
4
Industrial commercial large
blocks off-street parking
0.09
5
Non-core single residential
low building heights
-1.00
6
BRT-oriented facilities mixed
use nearby
-0.61
7 Parking 0.06
8
Institutional facilities facing
BRT corridor
-0.75
9
Non-core affordable housing
and informal settlements
0.15
Net population density 0.22

TOD potential (n=11)
Source:Vergel-Tovar (2011)
BRT station Jardim Botanico, Curitiba, Brazil

Open space stop (n=6) Portal Usme, Bogota BRT System, Bogota
Drawing: Vergel & Paredes, Carolina Transportation Program, DCRP, UNC-Chapel Hill, 2011
Source: Google Earth, Secretary of Planning Department of Bogota, Fieldwork Data, 2011-2012
# Built environment
factor and popdensity
Mean
value
1
High-rise multifamily BRT-
oriented mixed land use
-0.07
2
Vacant unconsolidated urban
environment
2.59
3
NMT green areas
consolidated
0.13
4
Industrial commercial large
blocks off-street parking
0.69
5
Non-core single residential
low building heights
0.27
6
BRT-oriented facilities mixed
use nearby
-0.29
7 Parking -0.45
8
Institutional facilities facing
BRT corridor
0.46
9
Non-core affordable housing
and informal settlements
1.70
Net population density 0.20

Open space stop (n=6) BRT Terminal Usme, Bogota, Colombia
Source:Vergel-Tovar (2011)

Does the typology capture city-specific
factors? 13 clusters
1 Quito Historic Center (Cluster 6, n=1)
1 Ciudad de Guatemala (Cluster 10, n=6)
1 BRT Terminals (Cluster 8, N=21)
Discussion

Surprises Amount of parking on and off-street
Relatively low density
Little vacant land –regeneration and redevelopment
options
Muted role of land uses
Uses are highly mixed, for good and bad
Entropy of 0.64
Compare with 0.25-0.26 for Atlanta; San Francisco Bay
Area; Winston-Salem; Chicago
Discussion
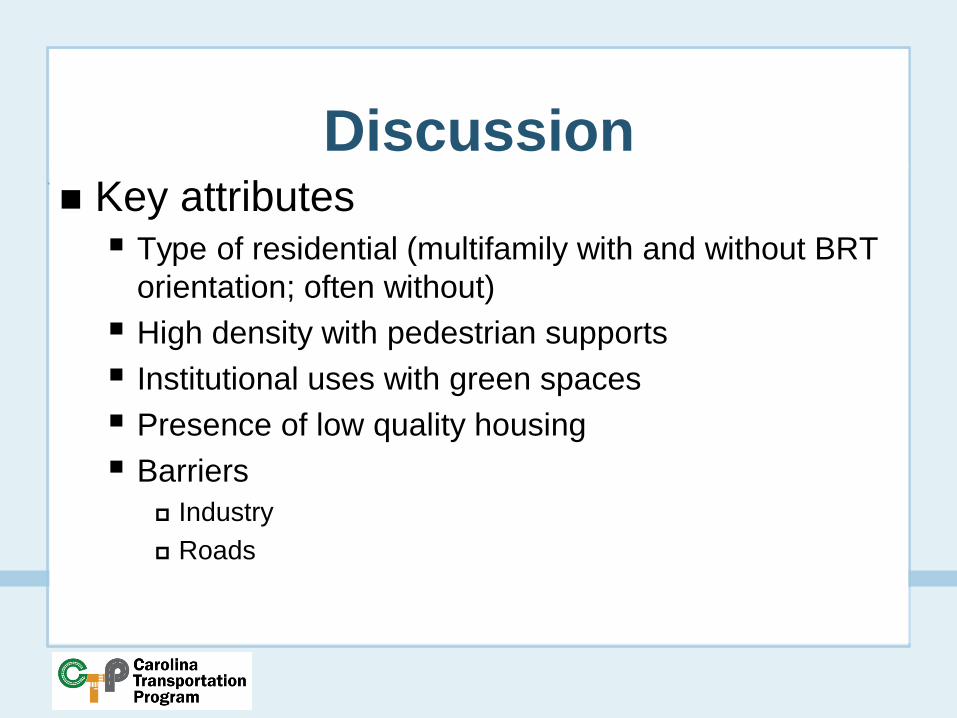
Key attributes Type of residential (multifamily with and without BRT
orientation; often without)
High density with pedestrian supports
Institutional uses with green spaces
Presence of low quality housing
Barriers
Industry
Roads
Discussion
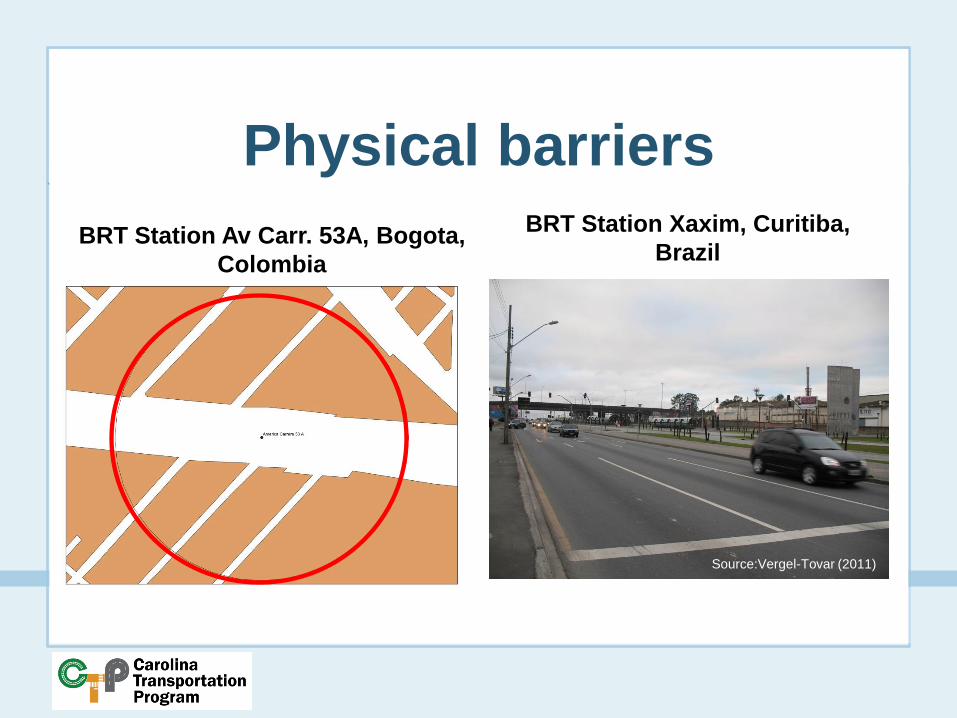
Physical barriers
BRT Station Av Carr. 53A, Bogota,
Colombia
BRT Station Xaxim, Curitiba,
Brazil
Source:Vergel-Tovar (2011)

Aim 2 results: Curitiba
500
700
900
1,100
1,300
1,500
1,700
1,900
2,100
2,300
2,500
0 20 40 60 80 100 120 140 160 180 200
Pre
dic
ted
BR
T r
iders
hip
Population density (people/ha)
Sample BRT Terminals and stations N=87
Sample BRT single stations N=72

Aim 2 results: All cities Predicted BRT ridership and entropy
5,000
7,500
10,000
12,500
15,000
17,500
20,000
0 10 20 30 40 50 60 70 80 90 100
Pre
dic
ted
BR
T r
iders
hip
Percentile
Predicted BRT ridership and developments (% segments high-rise development - % segments with >5 stories)
6,000
7,000
8,000
9,000
10,000
11,000
12,000
13,000
0 10 20 30 40 50 60 70 80 90 100
Pre
dic
ted
BR
T r
iders
hip
Percentile
High-rise developments >5 stories
(evenness commercial, residential, institutional land uses)

Aim 2 results: All cities
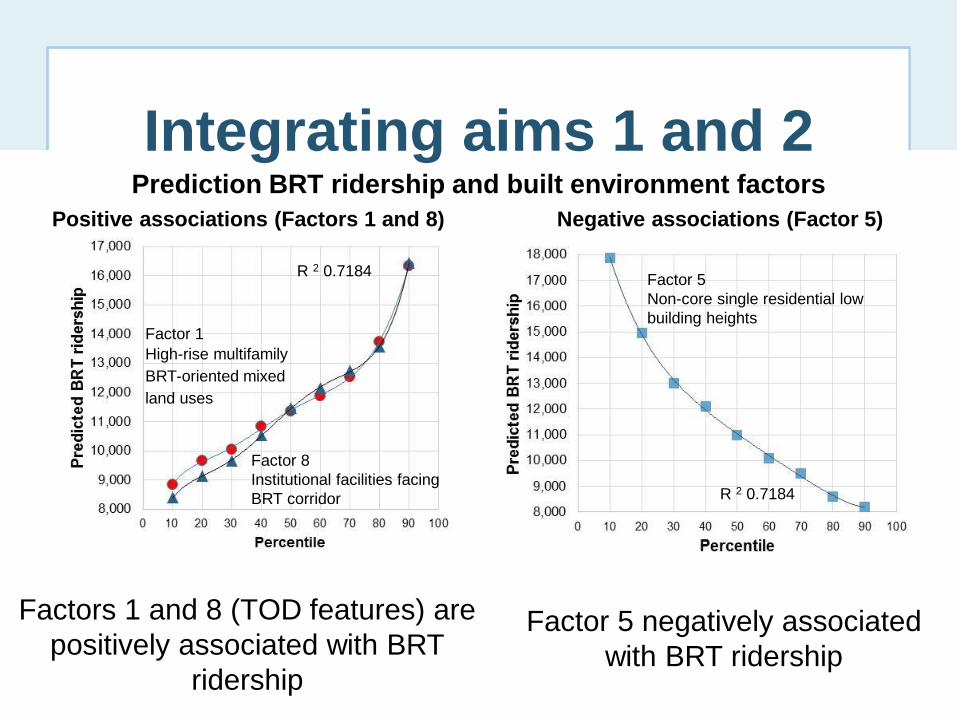
Prediction BRT ridership and built environment factors
Positive associations (Factors 1 and 8) Negative associations (Factor 5)
Factor 5 negatively associated
with BRT ridership
Factors 1 and 8 (TOD features) are
positively associated with BRT
ridership
Integrating aims 1 and 2
Factor 1
High-rise multifamily
BRT-oriented mixed
land uses
Factor 8
Institutional facilities facing
BRT corridor
R 2 0.7184
R 2 0.7184
Factor 5
Non-core single residential low
building heights
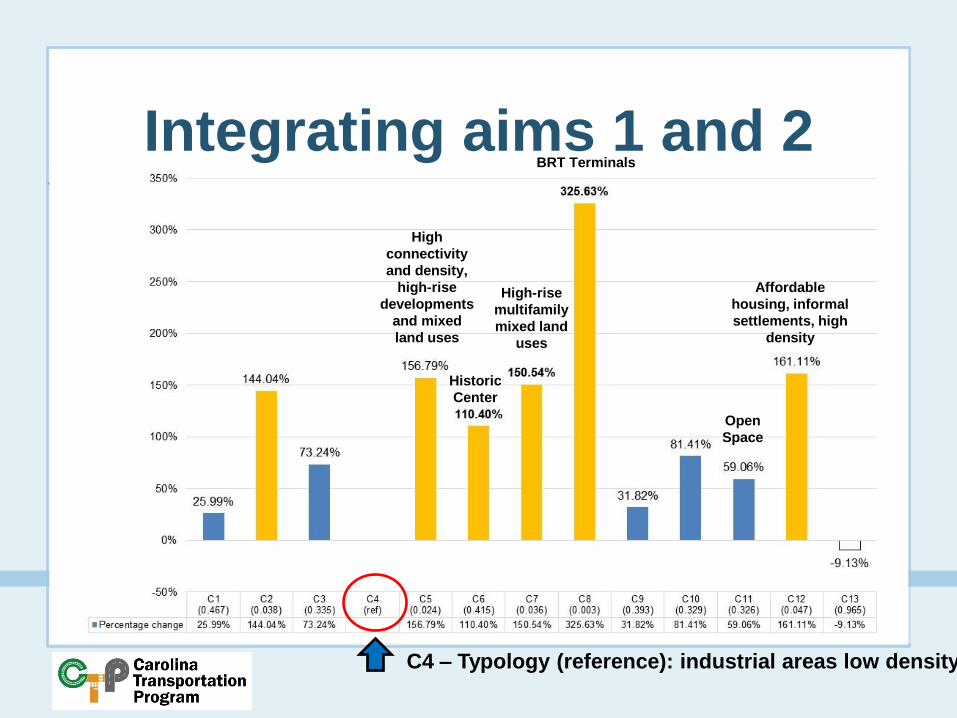
Integrating aims 1 and 2
C4 – Typology (reference): industrial areas low density
BRT Terminals
High-rise
multifamily
mixed land
uses
Historic
Center
High
connectivity
and density,
high-rise
developments
and mixed
land uses
Affordable
housing, informal
settlements, high
density
Open
Space
Developed a typology of the built
environment around BRT stops in Latin
America Highly descriptive
Identifies types that highlight opportunities and
barriers
Pedestrian friendliness, parking, redevelopment, access to
stops/terminals
Conclusions

• Population density necessary but not
sufficient for BRT ridership
• TOD features positively associated with
BRT ridership
Conclusions

• Characteristics of urban development
typologies around BRT stations with
positive associations with BRT ridership: • High-rise multifamily and commercial developments
• Mixture of BRT oriented land uses (commercial,
residential and institutional)
• Building heights > 5 stories
• Presence of facilities facing BRT corridors
Conclusions
Importance of planning stage Adapt/modify regulations
Work with land owners/tenants (redevelopment)
Implementation Promotion of high density development
Promotion of NMT infrastructure
Redevelopment
Public spaces
Conclusions

Funding: Lincoln Institute for Land Policy, Lee Schipper Memorial Scholarship, Institute for the Study of the Americas
Data collection: Bogota: Erik Vergel-Tovar, Nicolas Estupinan y Maria Mercedes Maldonado
Sao Paulo: Erik Vergel-Tovar, Marcos Bicahlo, Frederico Roman Ramos, Claudia Acosta, Paula Sakamoto,
Daniel Todtmann Montandon, Carlos Joffe, and Magali Jorge
Curitiba: Erik Vergel-Tovar, Debora Ciociola, Irina Cerrutti, Teresa Torres, Adriana Matias, Mauricio Meyer,
Oscar Schmeiske, Silvia Mara dos Santos, Anderson Gosmatti, Regina Sorgenfrei
Goainia: Erik Vergel-Tovar, José Carlos Xavier, Domingos Sávio Afonso, Flávia Araújo Xavier, Spyro Angelos
Katopodes, Cinthia Machado de Meneses, Julienne Santana de Morais
Guatemala City: Oliver Hartleben, Fabricio Gonzalez, Eddy Morataya.
Quito: Erik Vergel-Tovar, Fernando Puente, Fabricio Castillo, Henry Vilatuna. Sandra Hidalgo, Marcelo Yánez
Guayaquil: Erik Vergel-Tovar, Federico von Buchwald, Felipe Xavier Huerta, Gina Alvarez, Jenny Saade
Carriel
GIS and data entry: Julio Paredes, Taylor Smith, S. Kirk, M. Khurana, and Amanda Klepper
All transit agencies in each of the cities studied
Acknowledgements