welspun india ltd india ltd.pdf · pakistan & bangladesh ... now at ~35%; expected to rise to...
TRANSCRIPT

Welspun Group | Textiles
Welspun India Ltd Largest Home Textile Company in the World
Welspun Group | Textiles
May 2013
1
Welspun Group | Textiles
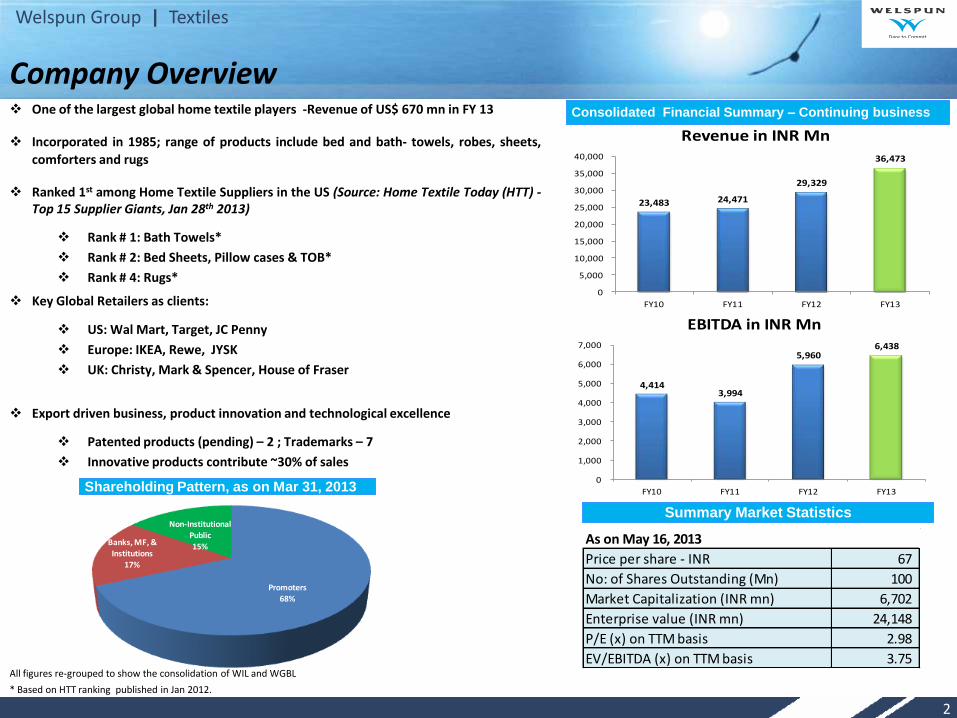
As on May 16, 2013
Price per share - INR 67
No: of Shares Outstanding (Mn) 100
Market Capitalization (INR mn) 6,702
Enterprise value (INR mn) 24,148
P/E (x) on TTM basis 2.98
EV/EBITDA (x) on TTM basis 3.75
Promoters68%
Banks, MF, & Institutions
17%
Non-Institutional Public15%
Company Overview One of the largest global home textile players -Revenue of US$ 670 mn in FY 13
Incorporated in 1985; range of products include bed and bath- towels, robes, sheets,
comforters and rugs
Ranked 1st among Home Textile Suppliers in the US (Source: Home Textile Today (HTT) -Top 15 Supplier Giants, Jan 28th 2013)
Rank # 1: Bath Towels*
Rank # 2: Bed Sheets, Pillow cases & TOB*
Rank # 4: Rugs*
Key Global Retailers as clients:
US: Wal Mart, Target, JC Penny
Europe: IKEA, Rewe, JYSK
UK: Christy, Mark & Spencer, House of Fraser
Export driven business, product innovation and technological excellence
Patented products (pending) – 2 ; Trademarks – 7
Innovative products contribute ~30% of sales
Shareholding Pattern, as on Mar 31, 2013
Summary Market Statistics
Consolidated Financial Summary – Continuing business
All figures re-grouped to show the consolidation of WIL and WGBL
2
* Based on HTT ranking published in Jan 2012.
23,483 24,471
29,329
36,473
0
5,000
10,000
15,000
20,000
25,000
30,000
35,000
40,000
FY10 FY11 FY12 FY13
Revenue in INR Mn
4,414 3,994
5,960 6,438
0
1,000
2,000
3,000
4,000
5,000
6,000
7,000
FY10 FY11 FY12 FY13
EBITDA in INR Mn
Welspun Group | Textiles
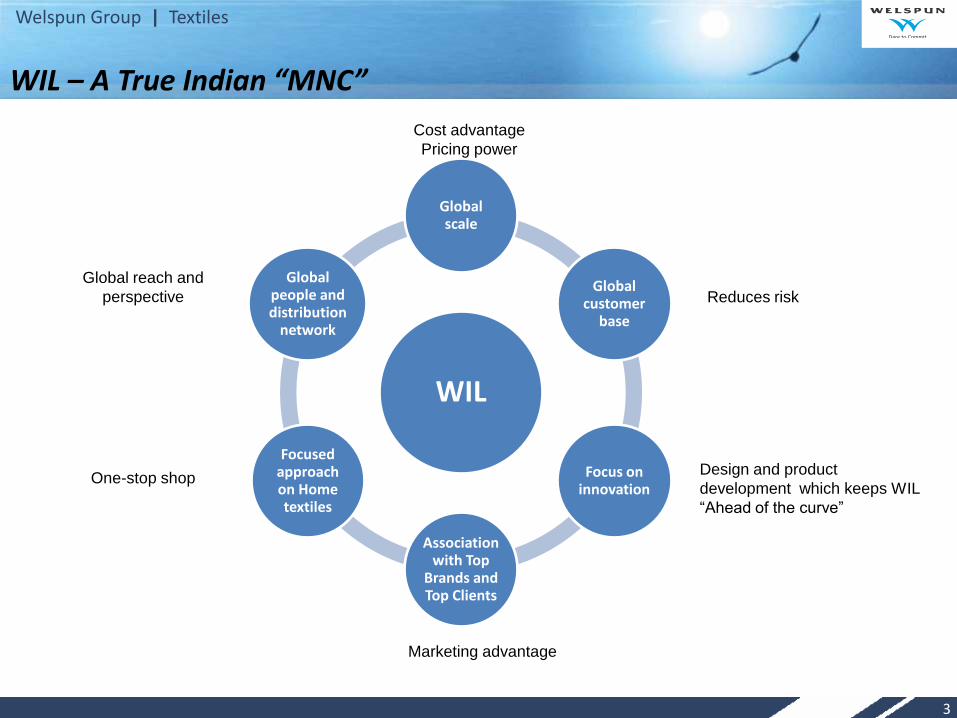
WIL
Global scale
Global customer
base
Focus on innovation
Association with Top
Brands and Top Clients
Focused approach on Home textiles
Global people and distribution
network
Reduces risk
Cost advantage
Pricing power
Global reach and
perspective
One-stop shop Design and product
development which keeps WIL
“Ahead of the curve”
Marketing advantage
WIL – A True Indian “MNC”
3

Welspun Group | Textiles
WIL – Strong positive Outlook
Strong
sustainable
growth and
profitability
Industry factors
• India’s Location advantage
• Surplus cotton
• Cheap labour and favourable demographics
• High-growth domestic market
• De-risking from China, Pakistan & Bangladesh
• Proposed FTA with Europe
• Favourable government policies
WIL specific factors
• Unification of WIL and WGBL to deliver synergy benefits including lower cost and better control
• Completed exit from loss making subsidiaries; Continuing business has always been robust
• Increasing contribution from innovation: now at ~30% of sales
• Increasing backward integration: now at ~35%; expected to rise to 70-75% in a year
4
Welspun Group | Textiles
WIL - Initiatives To Overcome Structural Challenges
Consolidation of Textile Business under single umbrella to re-create unified stronger entity
Merger with Welspun Global Brands Ltd (WGBL) brings in synergy benefits
The two entities intertwined for manufacturing, marketing and branding
Financial inter-linkages for debtors, creditors, loans & advances, guarantees etc
Business re-strategizing Acknowledgement of the ineffectiveness of earlier decisions; concentrated efforts for a unified structure for a profitable Home
Textile business
Non performing international manufacturing and marketing setups closed down
Resultant one time losses booked in FY12 results
Retail: Preference given to shop-in-shop concept with no capex and low risk rather than handling own retail outlets
Simplified structure with better control All textile operations under one entity – WIL
Control on administrative and other distribution costs
Streamlining of administrative and compliance procedure
Value for all the stakeholders Shareholder value under single listed entity which is completely integrated with manufacturing by parent and marketing through
a wholly-owned subsidiary
Vertical Integration of ~75% will contribute to improve the profitability of WIL significantly.
Recently commissioned an 80 MW power plant, which will further reduce power costs.
Competitive environment presenting opportunities to increase market share globally
5
Welspun Group | Textiles
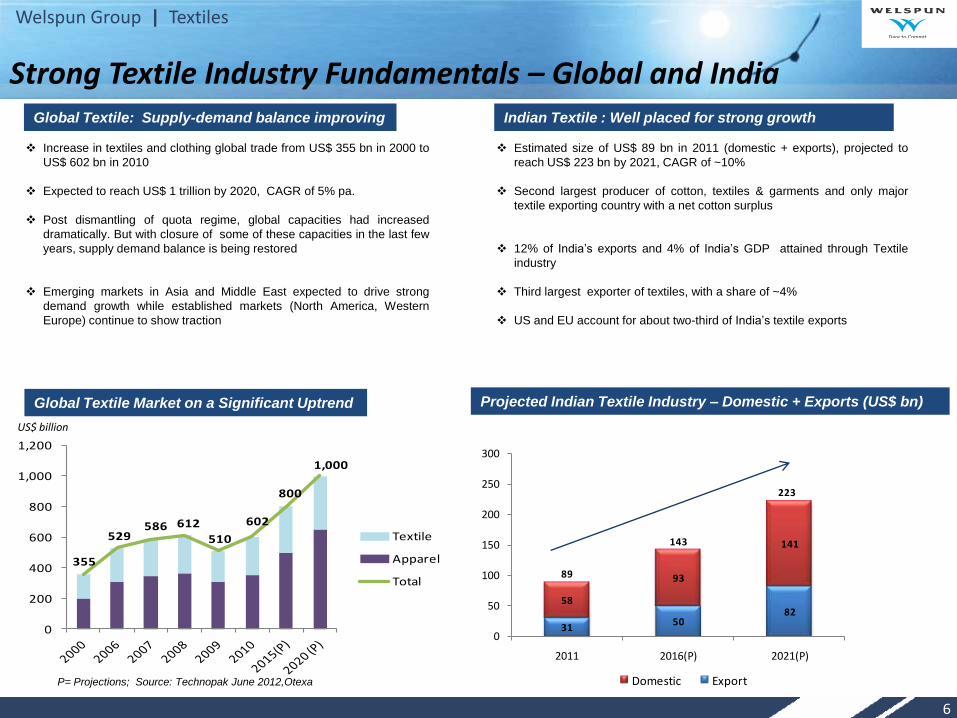
Strong Textile Industry Fundamentals – Global and India
Increase in textiles and clothing global trade from US$ 355 bn in 2000 to
US$ 602 bn in 2010
Expected to reach US$ 1 trillion by 2020, CAGR of 5% pa.
Post dismantling of quota regime, global capacities had increased
dramatically. But with closure of some of these capacities in the last few
years, supply demand balance is being restored
Emerging markets in Asia and Middle East expected to drive strong
demand growth while established markets (North America, Western
Europe) continue to show traction
Global Textile: Supply-demand balance improving
Estimated size of US$ 89 bn in 2011 (domestic + exports), projected to
reach US$ 223 bn by 2021, CAGR of ~10%
Second largest producer of cotton, textiles & garments and only major
textile exporting country with a net cotton surplus
12% of India’s exports and 4% of India’s GDP attained through Textile
industry
Third largest exporter of textiles, with a share of ~4%
US and EU account for about two-third of India’s textile exports
Indian Textile : Well placed for strong growth
Projected Indian Textile Industry – Domestic + Exports (US$ bn) Global Textile Market on a Significant Uptrend
P= Projections; Source: Technopak June 2012,Otexa
355
529586 612
510
602
800
1,000
0
200
400
600
800
1,000
1,200
Textile
Apparel
Total
US$ billion
6
3150
8258
93
141
89
143
0
50
100
150
200
250
300
2011 2016(P) 2021(P)
Domestic Export
223
Welspun Group | Textiles
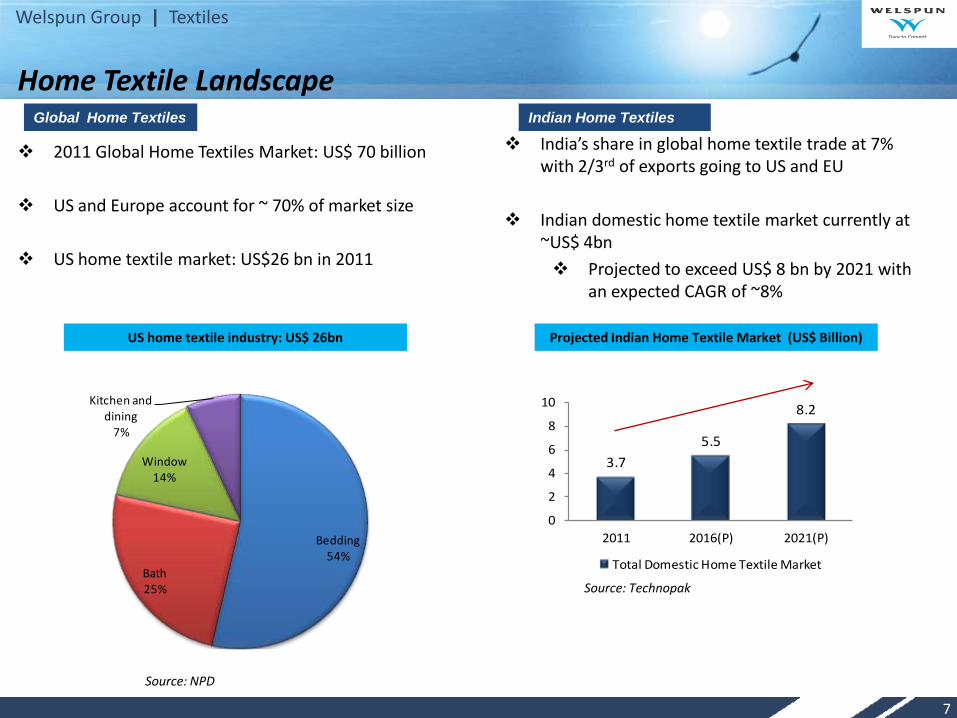
Home Textile Landscape
2011 Global Home Textiles Market: US$ 70 billion
US and Europe account for ~ 70% of market size
US home textile market: US$26 bn in 2011
7
3.7
5.5
8.2
0
2
4
6
8
10
2011 2016(P) 2021(P)
Total Domestic Home Textile Market
Projected Indian Home Textile Market (US$ Billion)
Source: Technopak
US home textile industry: US$ 26bn
Bedding54%
Bath25%
Window14%
Kitchen and dining
7%
Global Home Textiles Indian Home Textiles
India’s share in global home textile trade at 7% with 2/3rd of exports going to US and EU
Indian domestic home textile market currently at ~US$ 4bn
Projected to exceed US$ 8 bn by 2021 with an expected CAGR of ~8%
Source: NPD
Welspun Group | Textiles
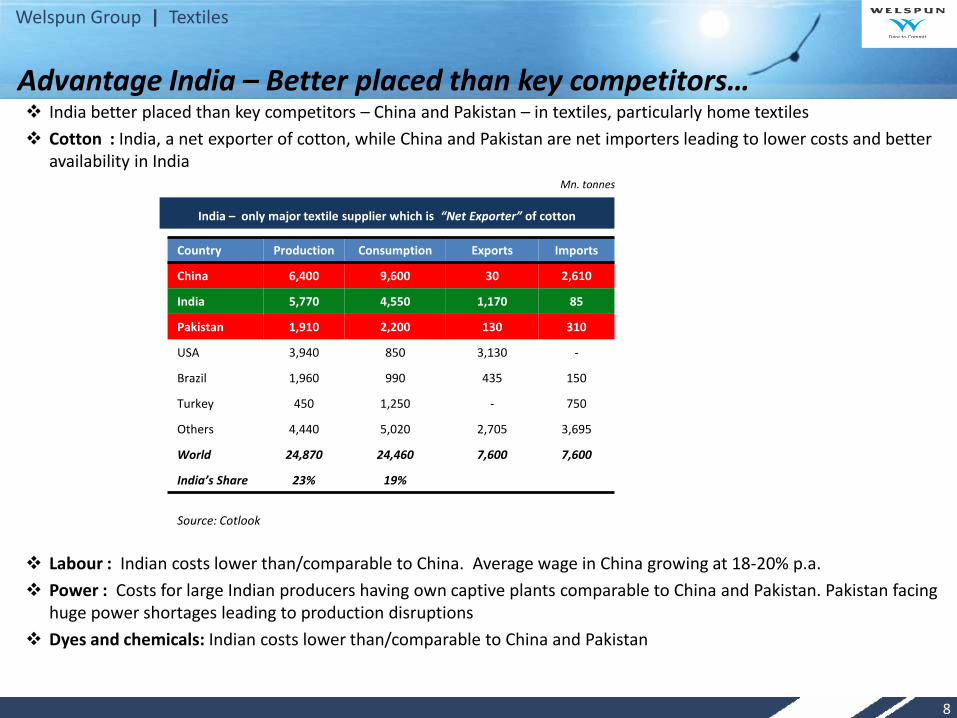
Advantage India – Better placed than key competitors… India better placed than key competitors – China and Pakistan – in textiles, particularly home textiles
Cotton : India, a net exporter of cotton, while China and Pakistan are net importers leading to lower costs and better availability in India
Labour : Indian costs lower than/comparable to China. Average wage in China growing at 18-20% p.a.
Power : Costs for large Indian producers having own captive plants comparable to China and Pakistan. Pakistan facing huge power shortages leading to production disruptions
Dyes and chemicals: Indian costs lower than/comparable to China and Pakistan
Source: Cotlook
Country Production Consumption Exports Imports
China 6,400 9,600 30 2,610
India 5,770 4,550 1,170 85
Pakistan 1,910 2,200 130 310
USA 3,940 850 3,130 -
Brazil 1,960 990 435 150
Turkey 450 1,250 - 750
Others 4,440 5,020 2,705 3,695
World 24,870 24,460 7,600 7,600
India’s Share 23% 19%
India – only major textile supplier which is “Net Exporter” of cotton
Mn. tonnes
8
Welspun Group | Textiles
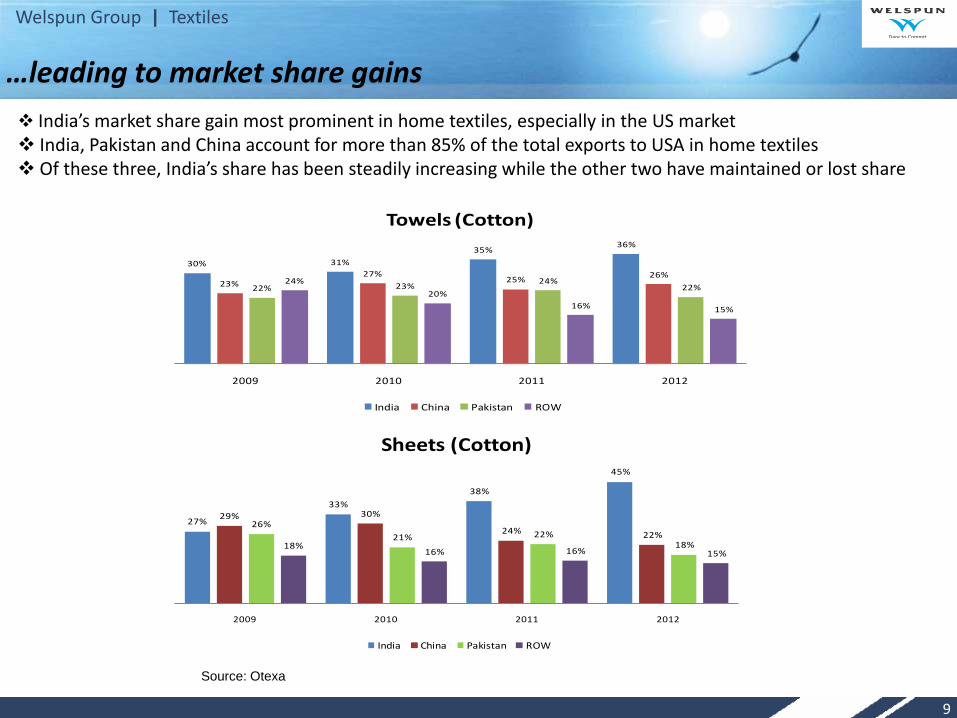
India’s market share gain most prominent in home textiles, especially in the US market India, Pakistan and China account for more than 85% of the total exports to USA in home textiles Of these three, India’s share has been steadily increasing while the other two have maintained or lost share
…leading to market share gains
9
Source: Otexa
30% 31%
35%36%
23%27%
25%26%
22% 23%24%
22%24%
20%
16% 15%
2009 2010 2011 2012
Towels (Cotton)
India China Pakistan ROW
27%
33%
38%
45%
29% 30%
24% 22%26%
21% 22%18%18%
16% 16% 15%
2009 2010 2011 2012
Sheets (Cotton)
India China Pakistan ROW
Welspun Group | Textiles
India – Robust growth expected to continue
Huge opportunity in Europe
Proposed India - EU FTA, which is in the final stages of discussion, to remove 5-10% of import duties on Indian textiles. This will make India more competitive and lead to market share gains in the region
Customers continuing to de-risk from China, Pakistan and Bangladesh
With China's rising per capita income and transition to a developed country, domestic consumption has increased. This has impacted China's ability to export
Currency appreciation of yuan coupled with rising labour and power costs leading to higher costs making China less competitive
Pakistan’s geopolitical situation and power shortages prompting clients to look for other sources
Bangladesh facing scrutiny over workers’ safety
Significant growth opportunity in the Indian market
Increasing retail penetration in the Indian market – Share of Textiles and Clothing Retail ~ 40% of organized retailing in India; Organized Retailing expected to increase from ~5% in 2005 to ~24% by 2020
Higher disposable income & Favourable demographic profile in the Indian market - Rising per capita income leading to an increase in consumption of Textiles. The % of earning population (15-60 years) in the total population is rising
FDI in retail to boost textile consumption
Favourable government policies
Interest and capital subsidies for new capex from central and various state governments
TUFS scheme of central government providing 4-5% of interest rebate on loans for new capex
Gujarat state government providing 5-7% of interest rebate on new capex loans in addition to TUFS rebate
10
Welspun Group | Textiles
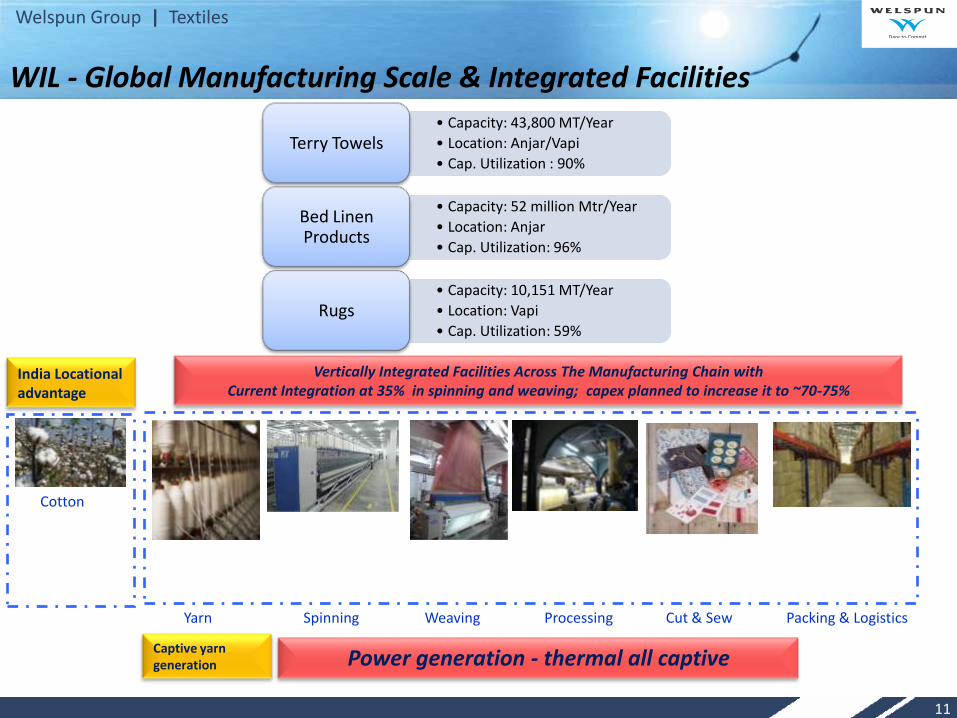
WIL - Global Manufacturing Scale & Integrated Facilities
Spinning Weaving Processing Cut & Sew Packing & Logistics
India Locational advantage
Cotton
Yarn
Vertically Integrated Facilities Across The Manufacturing Chain with Current Integration at 35% in spinning and weaving; capex planned to increase it to ~70-75%
Captive yarn generation Power generation - thermal all captive
• Capacity: 43,800 MT/Year
• Location: Anjar/Vapi
• Cap. Utilization : 90% Terry Towels
• Capacity: 52 million Mtr/Year
• Location: Anjar
• Cap. Utilization: 96%
Bed Linen Products
• Capacity: 10,151 MT/Year
• Location: Vapi
• Cap. Utilization: 59% Rugs
11

Welspun Group | Textiles
Bed Bath & Beyond Macy’s Wal Mart J C Penney Target Kohl’s K Mart- Sears Sam’s Club CostCo Burlington Coat Factory Ross Stores Bon Ton Belk, Inc. Anna’s Linen
Marquee Retailing Giants as Valued Customers
Ikea Carrefour JYSK El Corte Ingles Vincenzo Zucchi S.p.A Bassetti Auchan Rewe Tom Tailor Descamps Casino
Christy Tesco Marks & Spencer Debenhams House of Frazer John Lewis Sainsbury ASDA T J Hughes T K Maxx Fenwicks
• Spaces- Home & Beyond
12
Welspun Group | Textiles
13
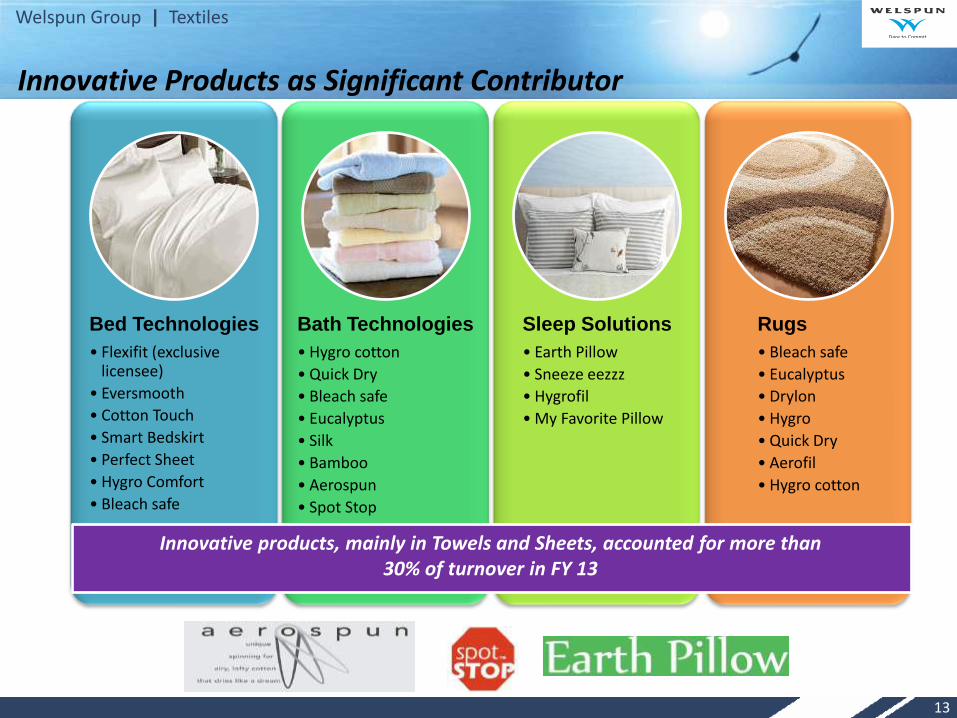
Bed Technologies
• Flexifit (exclusive licensee)
• Eversmooth
• Cotton Touch
• Smart Bedskirt
• Perfect Sheet
• Hygro Comfort
• Bleach safe
Bath Technologies
• Hygro cotton
• Quick Dry
• Bleach safe
• Eucalyptus
• Silk
• Bamboo
• Aerospun
• Spot Stop
Sleep Solutions
• Earth Pillow
• Sneeze eezzz
• Hygrofil
• My Favorite Pillow
Rugs
• Bleach safe
• Eucalyptus
• Drylon
• Hygro
• Quick Dry
• Aerofil
• Hygro cotton
Innovative products, mainly in Towels and Sheets, accounted for more than 30% of turnover in FY 13
Innovative Products as Significant Contributor

Welspun Group | Textiles
Total US Towel Imports – 1,427 mn
Total US Towel Imports from India
495 mn Welspun's Towel Exports to US
195 mn ~ 39% of India Exports
Towels - 2011 Towels – 2012
Total US Towel Imports – 1,460 mn
Total US Towel Imports from India
531 mn Welspun's Towel Exports to US
243 mn ~ 46% of India Exports
WIL – Increasing market share in the US
Bed sheets - 2011 Bed sheets – 2012
Total US Bed sheet Imports - 1,740 mn
Total US Bed sheet Imports from India
665 mn Welspun's Bed sheet Exports to US
146 mn ~ 22% of India Exports
Total US Bed sheet Imports 1,756mn
Total US Bed sheet Imports from India
795 mn Welspun's Bed sheet Exports to US
199 mn ~ 25% of India Exports
US$ US$
US$ US$
Source: OTEXA.
WIL contributed 25% of India’s Bed sheet Exports to the US in 2012
WIL contributed 46% of India’s Towel Exports to the US in 2012
14

Welspun Group | Textiles
Pricing power on account of long-term relationship with clients Welspun has developed strong relationships with clients over the years, which gives it better
pricing power
Most clients on an index-based pricing Price varies up or down with changes in major input costs
This reduces volatility in margins
15
60
80
100
120
140
160
180Index (Jan 10 = 100)
Contact price – Sample contract with one of our clients for a particular product
Welspun Group | Textiles
16
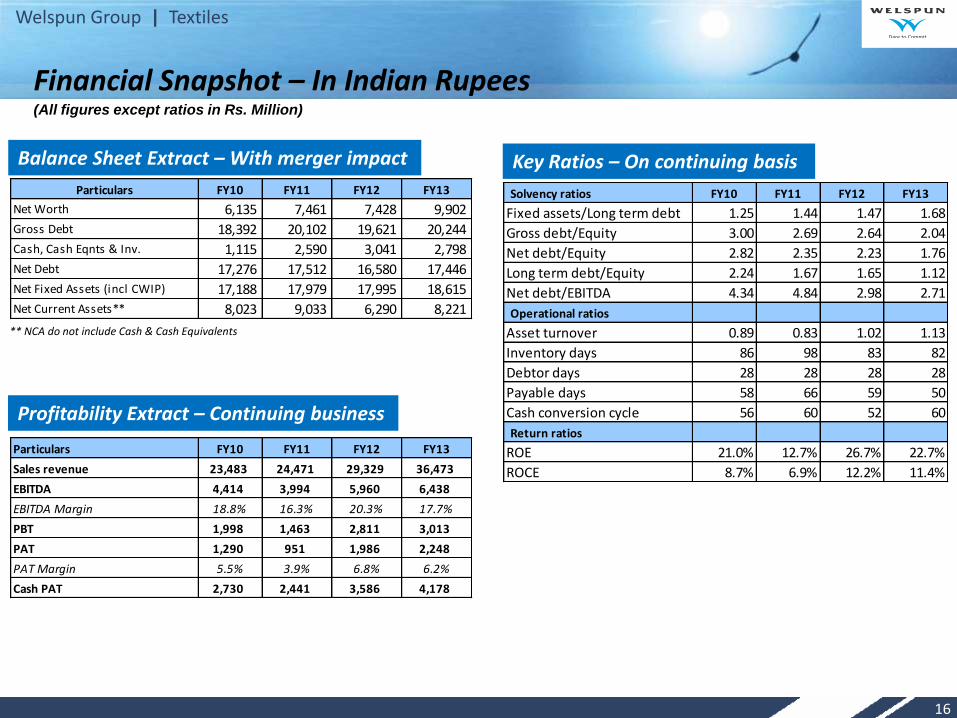
Financial Snapshot – In Indian Rupees
Balance Sheet Extract – With merger impact
Profitability Extract – Continuing business
Key Ratios – On continuing basis
(All figures except ratios in Rs. Million)
** NCA do not include Cash & Cash Equivalents
Particulars FY10 FY11 FY12 FY13
Net Worth 6,135 7,461 7,428 9,902
Gross Debt 18,392 20,102 19,621 20,244
Cash, Cash Eqnts & Inv. 1,115 2,590 3,041 2,798
Net Debt 17,276 17,512 16,580 17,446
Net Fixed Assets (incl CWIP) 17,188 17,979 17,995 18,615
Net Current Assets** 8,023 9,033 6,290 8,221
Solvency ratios FY10 FY11 FY12 FY13
Fixed assets/Long term debt 1.25 1.44 1.47 1.68
Gross debt/Equity 3.00 2.69 2.64 2.04
Net debt/Equity 2.82 2.35 2.23 1.76
Long term debt/Equity 2.24 1.67 1.65 1.12
Net debt/EBITDA 4.34 4.84 2.98 2.71
Operational ratios
Asset turnover 0.89 0.83 1.02 1.13
Inventory days 86 98 83 82
Debtor days 28 28 28 28
Payable days 58 66 59 50
Cash conversion cycle 56 60 52 60
Return ratios
ROE 21.0% 12.7% 26.7% 22.7%
ROCE 8.7% 6.9% 12.2% 11.4%
Particulars FY10 FY11 FY12 FY13
Sales revenue 23,483 24,471 29,329 36,473
EBITDA 4,414 3,994 5,960 6,438
EBITDA Margin 18.8% 16.3% 20.3% 17.7%
PBT 1,998 1,463 2,811 3,013
PAT 1,290 951 1,986 2,248
PAT Margin 5.5% 3.9% 6.8% 6.2%
Cash PAT 2,730 2,441 3,586 4,178

Welspun Group | Textiles
Financial Snapshot – In USD Balance Sheet Extract – With merger impact
Profitability Extract – Continuing business
** NCA do not include Cash & Cash Equivalents
17
Exchange Rates
(All figures in USD Million)
Particulars FY10 FY11 FY12 FY13
Net Worth 137 167 146 182
Gross Debt 410 451 386 373
Cash, Cash Eqnts & Inv. 25 58 60 52
Net Debt 385 393 326 321
Net Fixed Assets 383 403 354 343
Net Current Assets** 179 203 124 151
Particulars FY10 FY11 FY12 FY13
Sales revenue 495 537 612 670
EBITDA 93 88 124 118
EBITDA Margin 18.8% 16.3% 20.3% 17.7%
PBT 42 32 59 55
PAT 27 21 41 41
PAT Margin 5.5% 3.9% 6.8% 6.2%
Cash PAT 57 54 75 77
Rates FY10 FY11 FY12 FY13
Avg 47.47 45.53 47.95 54.40
Period ending 44.90 44.60 50.87 54.31

Welspun Group | Textiles
WIL - Way Ahead
New unified structure to will help lower costs, give better control on manufacturing and
branding
Focus on stringent cost controls, foray into new markets and consolidation and
streamlining of operations to maximize ROI
Continued emphasis on innovation
Strong focus on the high growth domestic market through
Shop-in-shop in large retail stores which entail no capex and low risk
Wholesale distributors
Institutional clients such as hotels
E-commerce
Gaining traction in new markets like Canada, South Africa, Japan, Korea and Australia
Capex to be focused on backward integration and modernization in India
WIL well placed with high end global scale capacity, skilled workforce, product knowledge expertise and coordinated marketing approach to capitalize on growth opportunities
18
Welspun Group | Textiles
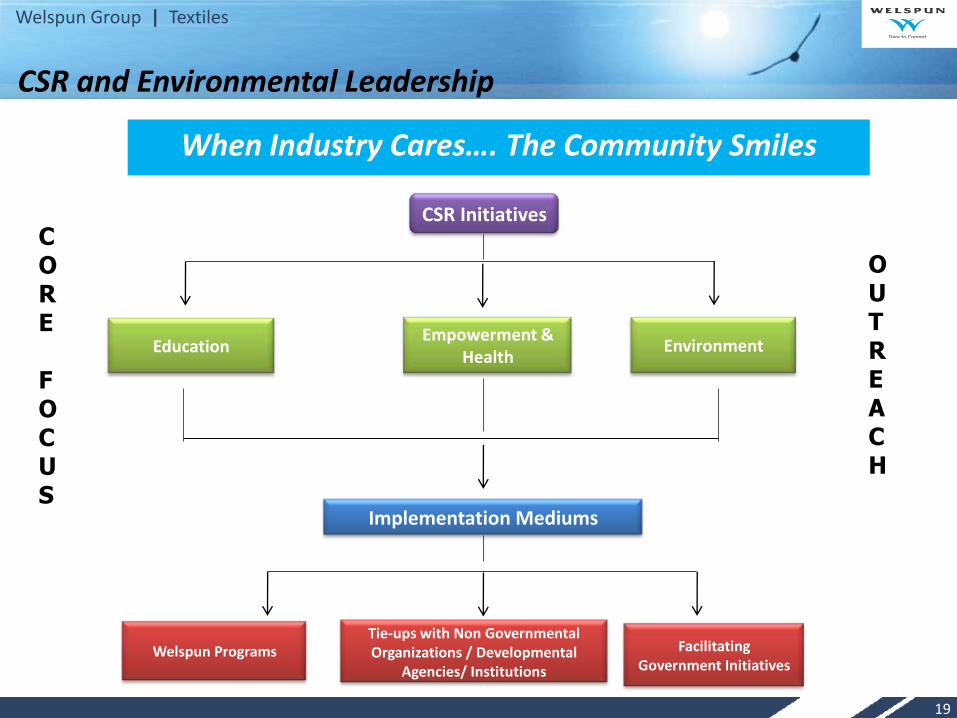
CSR and Environmental Leadership
Empowerment & Health
Education Environment
Tie-ups with Non Governmental Organizations / Developmental
Agencies/ Institutions
Welspun Programs Facilitating Government Initiatives
CSR Initiatives
Implementation Mediums
CORE FOCUS
OUTREACH
When Industry Cares…. The Community Smiles
19

Welspun Group | Textiles
Performance Awards
Most Preferred Furnishing Brand - MAGPPIE
Gold Supplier Award – TESCO
Innovation Award for Eco-Dry towels - Golden Peacock
Best Product Award- Wilkinson
Five Star Award – Macy’s
Vendor of the Year Award - Sears / K-Mart
Partners in Business Transformation award - Sears / K-Mart
Sustainability awards
Responsibility Award for Excellence – Walmart
Global CSR Excellence & Leadership - Bluedart
Recent Awards and Recognitions in 2012-13
20

Welspun Group | Textiles
Thank You
For further details, please contact:
Harish Venkateswaran
GM - Group Strategy and Finance
Email: [email protected]
Akhil Jindal
Director – Group Strategy and Finance
Email: [email protected]
Company Website: www.welspunindia.com
21