what we can learn from others -...
TRANSCRIPT

What We Can Learn From Others: The IHI experience with quality improvement around the world Kelly McCutcheon Adams, LICSW IHI Director
March 11, 2014

The Model for Improvement ! Results in many settings from improving education
outcomes to reducing infection ! It is what you do all day, everyday ! Making it more formal and planned ! Power of teamwork ! Power of measurement
3

EXAMPLES
4
James M. Anderson Center for Health Systems Excellence
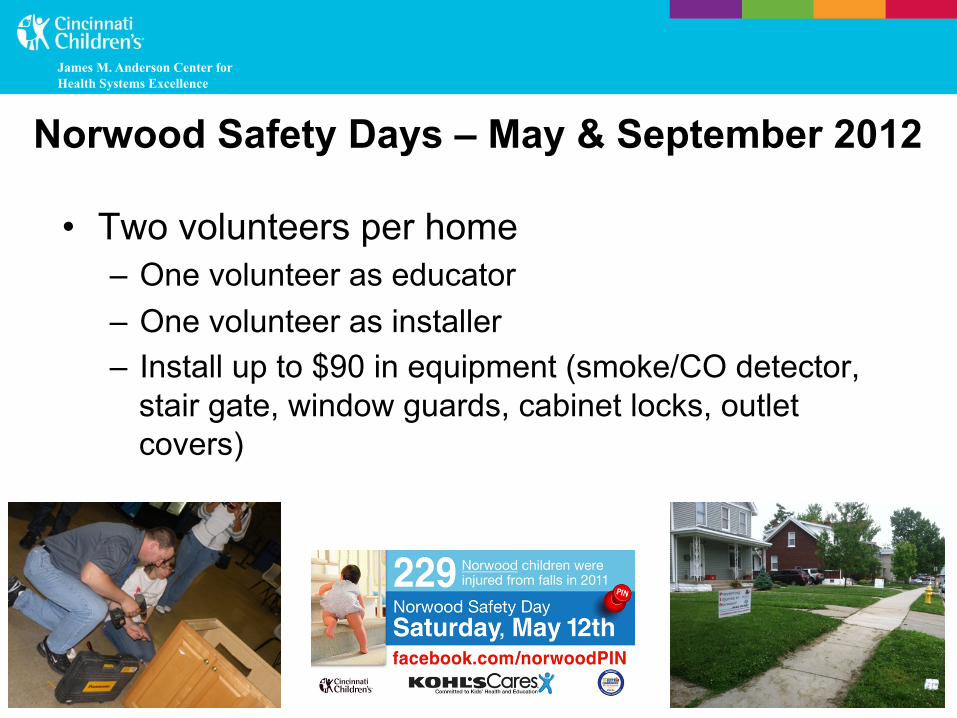
Norwood Safety Days – May & September 2012
• Two volunteers per home – One volunteer as educator – One volunteer as installer – Install up to $90 in equipment (smoke/CO detector,
stair gate, window guards, cabinet locks, outlet covers)

James M. Anderson Center for Health Systems Excellence
Injury Reduction in Intervention Homes
0%
20%
40%
60%
80%
100%
Observed/Expected Injuries
All homes
Intevention Homes
Non-intervention
*
• 1150 Norwood Children Ages 1-4 We have reached 184 (16%) in 130 Homes
• 82% reduction in intervention homes • Estimate that if intervention into 40% of
homes community reduction goal could be met
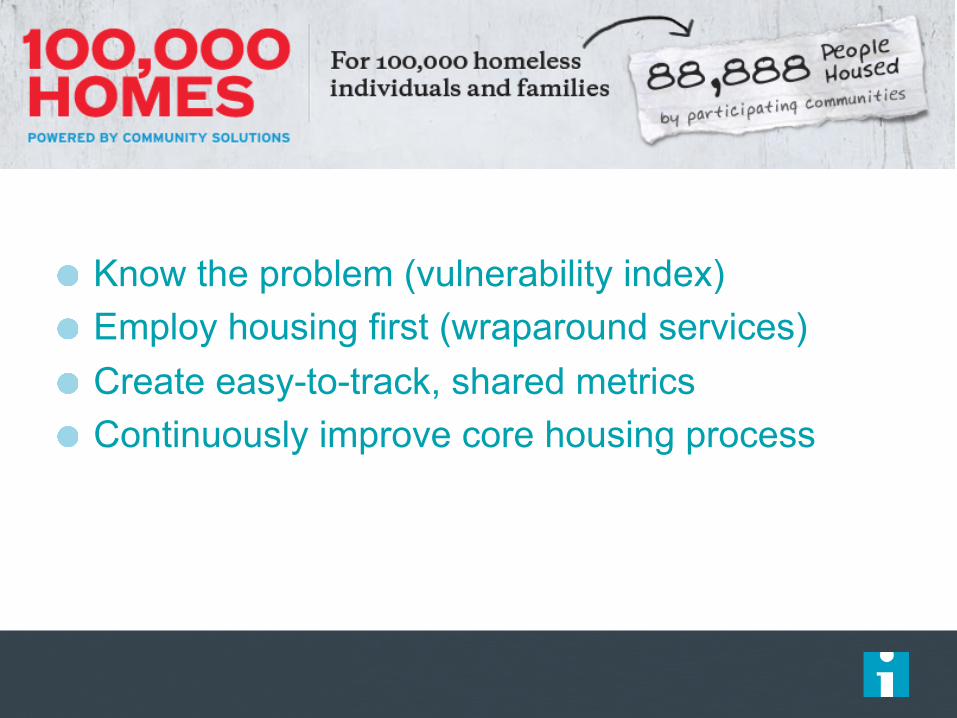
! Know the problem (vulnerability index) ! Employ housing first (wraparound services) ! Create easy-to-track, shared metrics ! Continuously improve core housing process

Simple, Shared Metric

Malawi “3 Delays”: Drivers of Maternal Mortality and Morbidity
Reduce maternal
mortality and morbidity
2nd Delay -‐ reaching an
appropriate care
1st Delay – deciding to seek appropriate medical help AIM
3rd Delay -‐ receiving
adequate care when a facility is
reached
PRIMARY DRIVERS
Malawi: Women’s Groups

UCL
LCL
0
10
20
30
40
50
60
Jan-
11
Mar
-11
May
-11
Jul-1
1
Sep
-11
Nov
-11
Jan-
12
Mar
-12
May
-12
Jul-1
2
Sep
-12
Nov
-12
Jan-
13
Mar
-13
May
-13
Rate 24h OB coverage in house Nurse mentoring program for neonatal intervenEons
MaiKhanda QI team reconsEtuted Public Audit of neonatal deaths
VLBW to KCH ANCS program
Malawi Neonatal Mortality per 1000 live births
First 8 months of 2011: 348 deaths Last 8 months: 202 deaths
Outcome Primary Drivers Secondary Drivers
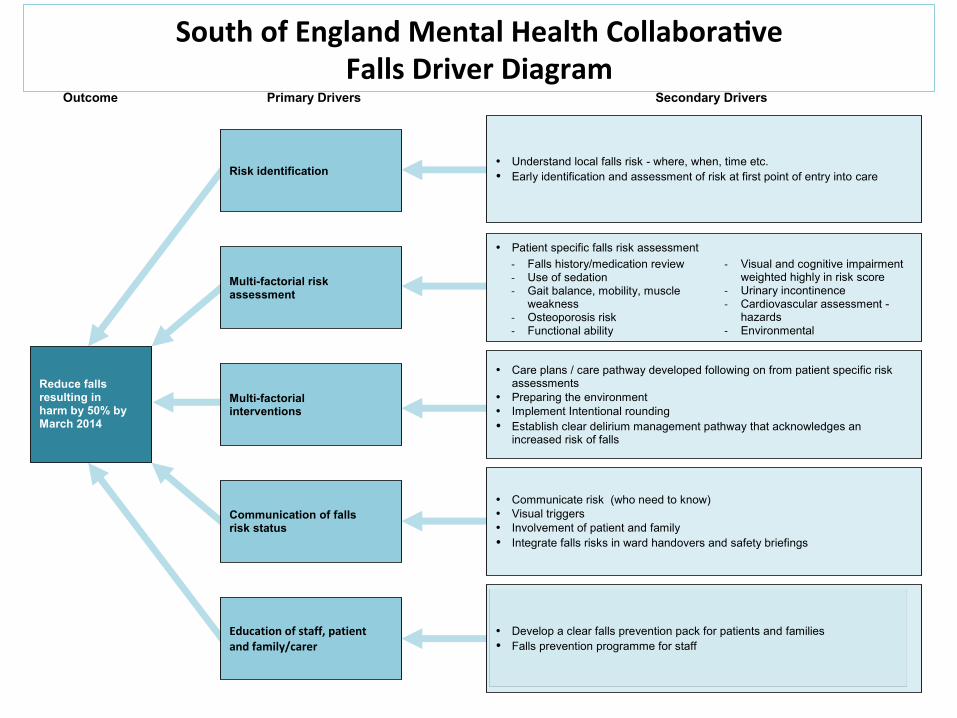
Reduce falls resulting in harm by 50% by March 2014
Risk identification
Multi-factorial risk assessment
• Patient specific falls risk assessment
-‐ Falls history/medication review -‐ Use of sedation -‐ Gait balance, mobility, muscle
weakness -‐ Osteoporosis risk -‐ Functional ability
-‐ Visual and cognitive impairment weighted highly in risk score
-‐ Urinary incontinence -‐ Cardiovascular assessment -
hazards -‐ Environmental
Multi-factorial interventions
• Care plans / care pathway developed following on from patient specific risk assessments
• Preparing the environment • Implement Intentional rounding • Establish clear delirium management pathway that acknowledges an
increased risk of falls
Communication of falls risk status
• Communicate risk (who need to know) • Visual triggers • Involvement of patient and family • Integrate falls risks in ward handovers and safety briefings
Education of staff, patient and family/carer
• Develop a clear falls prevention pack for patients and families • Falls prevention programme for staff
• Understand local falls risk - where, when, time etc. • Early identification and assessment of risk at first point of entry into care
South of England Mental Health CollaboraDve Falls Driver Diagram

South of England Mental Health CollaboraDve Total Falls Across the CollaboraDve
(15 hospitals)
Note that the variaEon amongst all 15 sites has
decreased as well as the average number of falls.

13 Ghana: Fives Alive!
! Insert day’s agenda
Scottish Patient Safety Programme
14

Critical care – SAB rate (per thousand bed days)
0
2
4
6
8
10
12
Jan-08
Mar-08
May-08
Jul-08
Sep-08
Nov-08
Jan-09
Mar-09
May-09
Jul-09
Sep-09
Nov-09
Jan-10
Mar-10
May-10
Jul-10
Sep-10
Nov-10
Jan-11
Mar-11
May-11
Jul-11
1.785
0.38
79% reduction

STARR
Reducing Readmissions from Skilled Nursing Care Homes

TransiDon from Hospital to Home • Enhanced Assessment
• Teaching and Learning
• Real-‐Eme Handover CommunicaEons
• Follow-‐up Care Arranged
Post-‐Acute Care AcDvated • MD Follow-‐up Visit • Home Health Care (as needed)
• Social Services (as needed)
• Skilled Nursing Facility Services
• Hospice/PalliaEve Care
Supplemental Care for High-‐Risk PaDents * • TransiEonal Care Models • Intensive Care Management (e.g. PaEent-‐Centered Medical Homes, HF Clinics, Evercare)
or
IHI’s Roadmap for Improving Transitions and Reducing Avoidable Rehospitalizations
* Additional Costs for these Services
Improved Transitions and Coordination of Care Reduction in Avoidable Rehospitalizations
PaDent and Family Engagement
Cross-‐ConDnuum Team CollaboraDon
Evidence-‐based Care in All Clinical SeKngs
Health InformaDon Exchange and Shared Care Plans

(c) Eric A. Coleman, MD, MPH
Key Elements of The Care Transitions Intervention®
l Adaptable to wide variety of care settings l One home visit, three phone calls over 30 days l “Transition Coach” is the vehicle to build skills,
confidence and provide tools to support self-care – Model behavior for how to handle common problems – Practice or role-play next encounter or visit – Elicit patient’s health related goal – Create a “gold standard” medication list

(c) Eric A. Coleman, MD, MPH
Key Findings of The Care Transitions Intervention®
l Significant reduction in 30-day hospital readmits) l Significant reduction in 90-day and 180-day
readmits (sustained effect of coaching) l Net cost savings of $300,000 for 350 pts/12 mo l Adopted by over 580 leading health care
organizations in 39 states nationwide l Please visit www.caretransitions.org

20

Looking at the map ! IHI Employees (there is a peg in the US for each remote
worker – and one peg for Cambridge) ! IHI Open School Chapters (there is one peg per country
that has at least one chapter – this does not indicate countries with more than one chapter)
! IHI Faculty (one peg per country with at least one faculty member)
! Grants and Contracts (one peg per country with at least one grant or contract)
! LoMIC (one peg per country where LoMIC works)
21

IHI Staff photo
22
Going Forward
“Make no little plans; they have no magic to stir men’s blood and probably will themselves not be realized. Make big plans; aim high in hope and work, remembering that a noble, logical diagram, once recorded will not die.” – Daniel Burnham
23