whatever happened to “the good old days”? · whatever happened to “the good old days” of...
TRANSCRIPT

NPG-140 February 2014
Whatever happened to“the Good old days”?
an npG Forum paperby Chris Clugston
Whatever happened to “the good old days” of vigorously increasing global prosperity – i.e., persistently robust economic growth and rapidly improving material living standards?
historiCal Global prosperity GroWth trajeCtories
the short answer is that our transition from vigorously increasing global prosperity to faltering global prosperity during the past 50 years was caused by a more fundamental geological transition from relative global nnr (nonrenewable natural resource) abundance to ever-increasing global nnr scarcity during the same period.
the following update to “scarcity - humanity’s Final Chapter?”1 offers compelling evidence to support the contention that despite humanity’s unparalleled ingenuity during our modern industrial era, global prosperity is being seriously undermined by increasingly prevalent global nnr scarcity – a trend that will produce disastrous consequences in the not-too-distant future.
-4.00%
-2.00%
0.00%
2.00%
4.00%
6.00%
8.00%
20131960
Global Economic (GDP) Growth Rate
Global Material Living Standard (per capita GDP) Improvement Rate
i. nnrs – the enablersOur modern industrialized existence is enabled almost exclusively by enormous and ever-increasing quantities of NNRs2 (nonrenewable natural resources) – the finite and non-replenishing fossil fuels, metals, and nonmetallic minerals that serve as:
• The raw material inputs to our industrialized economies;• The building blocks that comprise our industrialized infrastructure and support systems; and • The primary energy sources that power our industrialized societies.

Page 2 Whatever Happened to “The Good Old Days”?
nnr rolesNNRs play three essential roles in enabling our industrial lifestyle paradigm:
• NNRs enable RNRs (renewable natural resources) – air, water, soil, forests, and other naturally occurring biota – to be used in ways and at levels that are necessary to support the extraordinary population levels and material living standards associated with industrialized human societies. Examples include water storage/distribution systems, food production/distribution systems, and energy generation/distribution systems, which would support only a negligible fraction of today’s global human population in the absence of NNRs.
• NNRs enable the production and provisioning of infrastructure, goods, and energy that are inconceivable through the exclusive utilization of RNRs. Examples include cars, airplanes, computers, skyscrapers, highway systems, gasoline stations, communication networks, electric power grids, and nuclear power plants.
• NNRs enable the creation of enormous real wealth surpluses, which are necessary to support the thriving middle class population segments that differentiate industrialized societies from pre-industrial, RNR-based, agrarian and hunter-gatherer societies.
Within the context of our industrial lifestyle paradigm, human prosperity3 – as defined by economic output and material living standards – is enabled by NNRs.
nnrs human prosperity (economic output and Material living standards)
nnr CriticalityExamples of the critical role played by NNRs in enabling human prosperity:
• NNRs comprise approximately 95% of the raw material inputs to the US economy each year.4 • During 2006, America used over 7.1 billion tons of newly mined NNRs, which equated to nearly 48,000 pounds per
US citizen.5
The tightly-linked causal relationship between NNR utilization and economic output (GDP) is clearly demonstrated by America’s experience since the inception of its industrial revolution.
1800-2008 Us nnr Utilization and GdpBetween the years 1800 and 2008, total US NNR utilization increased by over 1600 times, from 4 million tons to 6.5 billion tons. As a result of this spectacular increase in NNR utilization, the size of the US economy (GDP) increased equally as spectacularly, by nearly 1800 times, from $7.4 billion in 1800 to $13.2 trillion in 2008.6,7,8
Remarkably, the correlation between the increase in US NNR utilization and the increase in US economic output (GDP) during the past 200+ years is nearly one-to-one.2008
6,500 Million Tons
1800-2008 US NNR Increase: 1,625X
4 Million Tons
1800
US GDP
3,500 Mil Tons
7,000 Mil Tons
20,000+ BC
$7.4 Billion
1800-2008 US GDP Increase: 1,783X
$13,200 Billion
$7,000 Billion
$14,000 Billion
US NNRs
(2005 USD)
Whatever Happened to “The Good Old Days”? Page 3
nnr occurrenceWhile NNRs are essentially ubiquitous within Earth’s crust, “economically viable” NNR deposits – i.e., those that are both profitable to produce and affordable to procure – are extremely rare in almost all cases.
Crustal occurrences: Vast quantities of nearly all NNRs exist in Earth’s undifferentiated crust, the outer rocky shell that ranges in thickness from approximately 3 miles to 30 miles.9 Unfortunately NNR concentrations in Earth’s undifferentiated crust are too small in all cases to be economically viable.
resources: Significantly greater NNR concentrations exist in mineral deposits classified by the US Geological Survey (USGS) as “resources”.10 Resources account for only very small subsets of total NNR occurrences however; and most NNR resources are not economically viable.
reserves: Economically viable subsets of resources exist in proven deposits that the USGS classifies as “reserves”.11 Reserves are the NNR occurrences that enable us to perpetuate our industrial lifestyle paradigm; they are also the least abundant NNR occurrences on Earth.
To put global NNR occurrence into perspective, if the total quantity of an NNR in Earth’s crust were represented by the size of Disneyland (150 football fields), the economically viable NNR “reserve” would be approximately the size of a postage stamp; and the potentially economically viable “resource” would be about the size of a cell phone.12
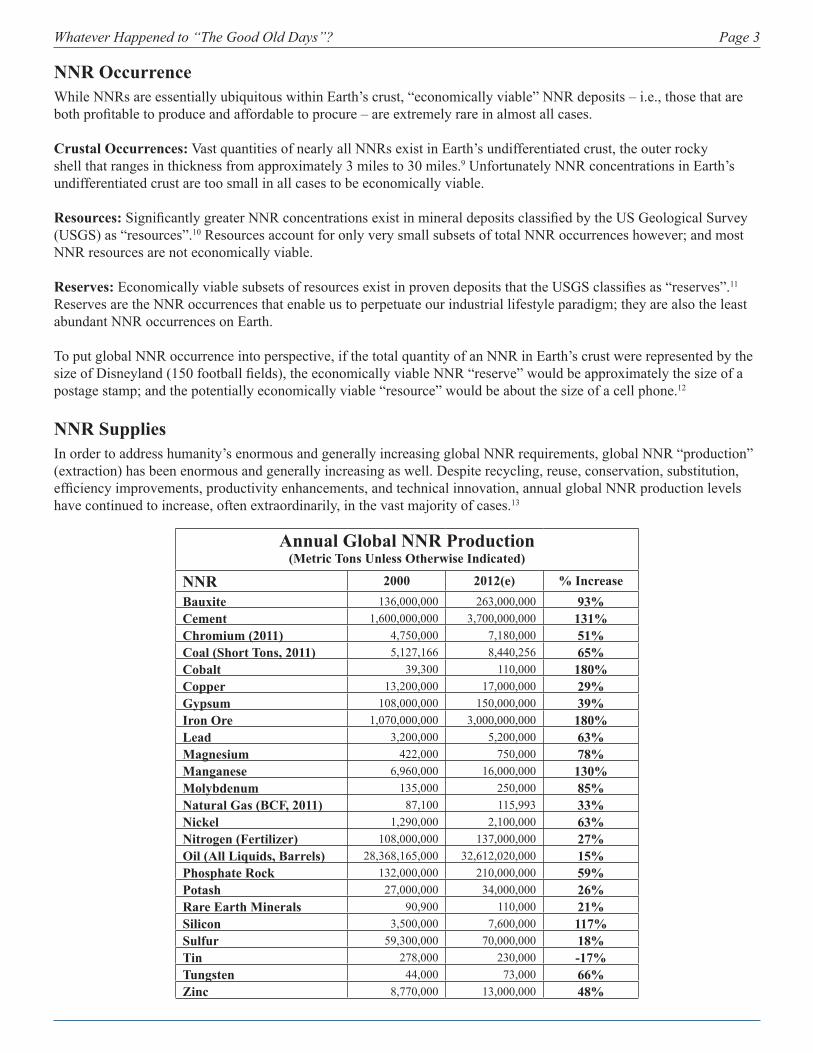
nnr suppliesIn order to address humanity’s enormous and generally increasing global NNR requirements, global NNR “production” (extraction) has been enormous and generally increasing as well. Despite recycling, reuse, conservation, substitution, efficiency improvements, productivity enhancements, and technical innovation, annual global NNR production levels have continued to increase, often extraordinarily, in the vast majority of cases.13
annual Global nnr production (Metric tons Unless otherwise indicated)
nnr 2000 2012(e) % increasebauxite 136,000,000 263,000,000 93%Cement 1,600,000,000 3,700,000,000 131%Chromium (2011) 4,750,000 7,180,000 51%Coal (short tons, 2011) 5,127,166 8,440,256 65%Cobalt 39,300 110,000 180%Copper 13,200,000 17,000,000 29%Gypsum 108,000,000 150,000,000 39%iron ore 1,070,000,000 3,000,000,000 180%lead 3,200,000 5,200,000 63%Magnesium 422,000 750,000 78%Manganese 6,960,000 16,000,000 130%Molybdenum 135,000 250,000 85%natural Gas (bCF, 2011) 87,100 115,993 33%nickel 1,290,000 2,100,000 63%nitrogen (Fertilizer) 108,000,000 137,000,000 27%oil (all liquids, barrels) 28,368,165,000 32,612,020,000 15%phosphate rock 132,000,000 210,000,000 59%potash 27,000,000 34,000,000 26%rare earth Minerals 90,900 110,000 21%silicon 3,500,000 7,600,000 117%sulfur 59,300,000 70,000,000 18%tin 278,000 230,000 -17%tungsten 44,000 73,000 66%Zinc 8,770,000 13,000,000 48%

Page 4 Whatever Happened to “The Good Old Days”?
Moreover, we expect annual global NNR production levels to increase continuously going forward, even as Earth’s increasingly constrained NNR supply mix transitions from “high quality/low cost” to “low quality/high cost”.
We have yet to understand that while there will always be plenty of NNRs in the ground (we will never “run out” of any NNR); and over the near term there will likely be more NNRs of nearly every type supplied each year; in an increasing number of cases there are not enough economically viable NNRs to completely address our global requirements – i.e., to increase global prosperity at a rate that we consider “acceptable”.
Global NNR scarcity is becoming increasingly prevalent.
nnr scarcityNNR scarcity typically occurs when inordinately high NNR prices associated with inordinately expensive NNR supplies suppress a population’s NNR demand to a level that is insufficient to completely address the population’s NNR requirement.14
Episodes of temporary NNR scarcity have occurred during the “boom” periods of commodity “boom/bust” cycles since the inception of our industrial revolution over 200 years ago.15
Historically, these NNR scarcity episodes culminated when sufficient economically viable NNR supplies were brought online to depress NNR prices to more affordable levels, thereby re-stimulating NNR demand to levels that were sufficient to address our then-current NNR requirements.
Since the beginning of the 21st century, however, we have experienced an episode of global NNR scarcity that is unprecedented during our modern industrial era in terms of its magnitude, scope, and duration.16 At issue is “what happens next?”
ii. 2014 Global nnr sCarCity analysisThe 2014 Global NNR Scarcity Analysis (Analysis) is the third update to the Global NNR Scarcity Analysis presented in “Scarcity – Humanity’s Final Chapter?” .17 The Analysis assesses the incidence of global NNR scarcity – past, present, and future – and its impact on global prosperity.
historical nnr scarcityFrom the inception of our industrial revolution until the end of the 20th century, humanity – especially industrialized and industrializing humanity – experienced relatively robust economic growth and steadily improving material living standards, which were enabled by our ever-increasing utilization of generally abundant and affordable NNRs.
Reflecting on decreasing metals price levels as an indicator of general NNR abundance during the 19th century, D.F. Hewett of the United States Geological Survey (USGS) stated in 1929, “Since 1800 the trend of prices for the common metals, measured not only by monetary units but by the cost in human effort, has been almost steadily downward…”.18
Relative NNR abundance persisted throughout the 20th century as well. “In spite of the fact that the use of mineral raw materials increased over the last [20th] century, the long-term constant dollar price of key U.S. mineral raw materials declined during the same period.”19
Our 20th century experience with respect to NNR availability, which was defined by the counterintuitive reality of generally decreasing NNR price levels despite dramatically increasing NNR demand, extraction, and utilization levels, is exemplified by the following USGS diagram depicting 20th century US mineral utilization and price levels.20

Whatever Happened to “The Good Old Days”? Page 5
UsGs “Mineral Mountain”
0
500
1,000
1,500
2,000
2,500
3,000
3,500
1900 1910 1920 1930 1940 1950 1960 1970 1980 1990 2000
YEAR
U.S
. CO
NSU
MPT
ION
OF
RA
W
MA
TER
IALS
, IN
MIL
LIO
NS
OF
MET
RIC
TO
NS
0
50
100
150
200
250
MIN
ERA
L PR
ICE
IND
EX,
2000
= 1
00
Consumption Mineral price index
In a comprehensive analysis of 20th century NNR availability21, the USGS concluded: “The fact that production of mineral commodities has been able to keep up with or exceed the demand for minerals is, in part, an indicator that based on the past, scarcity has not been an issue for mineral resources in general [emphasis mine].”21
And the USGS was correct. During the 19th and 20th centuries, industrialized and industrializing nations experienced only periodic episodes of temporary NNR scarcity within the context of relative NNR abundance, which enabled historically unprecedented prosperity increases for increasing segments of their continuously expanding populations.
relative nnr abundance Generally increasing Global prosperity
Unfortunately, we misinterpreted temporary NNR abundance as permanent NNR sufficiency.
Current nnr scarcityDuring the mid/late 20th century, a barrel of oil cost $22 on average; during the years immediately prior to the Great Recession, the average price of a barrel of oil had increased to $54; and during the years immediately following the Great Recession, the average price of a barrel of oil had further increased to $93.22
During the same three time intervals, the average price of a metric ton of copper increased from $3,575, to $4,211, to $7,490; the average price of a metric ton of iron ore increased from $42, to $70, to $137; and the average price of a metric ton of potash increased from $134, to $209, to $379.
The simple fact is that global prosperity cannot increase on $93 oil, $7,490 copper, $137 iron ore, and $379 potash as robustly as it increased on $22 oil, $3,575 copper, $42 iron ore, and $134 potash.
Given the generally significant NNR price increases that have occurred during the early years of the 21st century, it is not surprising that our NNR-dependent global economy experienced the Great Recession during 2009. Nor is it surprising that we have yet to recover from the Great Recession as we enter 2014.23

Page 6 Whatever Happened to “The Good Old Days”?
Mid/late 20th Century Global nnr scarcityNotwithstanding episodes of temporary NNR scarcity associated with commodity cycle “boom” periods and with the geopolitically induced 1970s “oil shocks”, global NNR supplies typically remained sufficient during the mid/late 20th century to address our steadily increasing global NNR requirements, as evidenced by relatively low average NNR price levels during the 1960-1999 period.
As a result, the mid/late 20th century was a period of generally increasing global prosperity, especially for industrialized nations rebuilding after WWII, and for newly industrializing nations such as South Korea, Taiwan, Singapore, and Hong Kong.
pre-recession Global nnr scarcityOur quest for universal “Western style” prosperity through global industrialization during the latter decades of the 20th century caused fundamental changes in global NNR demand/supply dynamics by the beginning of the new millennium:
• On the “demand side”, approximately 1 billion people occupied industrialized and industrializing nations during the mid/late 20th century.24 By the year 2000, as a consequence of the industrialization initiatives launched by China, India, Brazil, and other emerging nations in Asia, Africa, and Latin America, that number had increased to over 5 billion. As a result, global NNR requirements increased nearly instantaneously and extraordinarily during the early years of the new millennium. More importantly, early 21st century NNR utilization levels within these newly industrializing nations represented only tiny fractions of their longer term requirements.
• On the “supply side”, owing to persistent and increasing exploitation since the beginning of our industrial revolution, the quality associated with the vast majority of NNRs has been decreasing – i.e., NNR discoveries and deposits are generally fewer in number, smaller in size, less accessible, and of lower grade and purity.25 Increasingly, the cost advantages derived from new NNR exploration, extraction, and processing technologies are failing to offset the cost disadvantages attributable to exploiting Earth’s lower quality NNR deposits. The result is diminishing returns on NNR-related investments – i.e., each incremental dollar invested in NNR exploitation yields smaller quantities of economically viable NNRs.26
Inflation Adjusted Average Annual NNR Prices ($)nnr 1960-
19992000-2008
2009 2010-2013
2013
Fossil FuelsOil (Index of Brent, Dubai, and WTI) 22.08 53.56 64.02 92.59 98.13Natural Gas (Global Index: 2010=100) 41.30 122.21 98.93 99.40 105.73Coal (Australian: 1970-2013) 48.67 56.11 74.48 94.96 79.73
Fertilizer ComponentsPhosphate Rock 60 85 126 151 140Potash 134 209 654 379 358Urea (Nitrogen) 201 229 259 343 321
MetalsAluminum 2,193 2,191 1,726 2,000 1,741Copper 3,575 4,211 5,339 7,490 6,913Lead 994 1,196 1,782 2,073 2,018Tin 14,224 9,513 14,072 21,248 21,013Nickel 9,394 17,693 15,192 18,335 14,173Zinc 1,412 1,812 1,716 1,948 1,801Platinum 523 1,016 1,248 1,508 1,402Silver 8.94 9.09 15.18 25.98 22.48Iron Ore 42 70 83 137 128

Whatever Happened to “The Good Old Days”? Page 7
Global NNR supplies, which had remained sufficiently “low cost” in most cases during the mid/late 20th century to enable relatively low price levels, became increasingly “high cost” during the early years of the 21st century, as increasingly expensive marginal NNR deposits were exploited in order to address rapidly increasing global NNR demand. By the year 2008, most NNR prices had increased to historically unprecedented levels – global NNR scarcity had become epidemic.27
In fact, 63 of the 89 NNRs that enable our modern industrial existence – including aluminum, chromium, coal, copper, gypsum, iron/steel, magnesium, manganese, molybdenum, natural gas, oil, phosphate rock, potash, rare earth minerals, titanium, tungsten, uranium, vanadium, and zinc – were scarce globally in 2008.28
[Of the 15 NNRs considered in the Analysis (see the above table), average 21st century pre-recession price levels exceeded average mid/late 20th century price levels in all but one case, tin (Average aluminum price levels were nearly identical during the two time periods).]
Epidemic global NNR scarcity precipitated the Great Recession, thereby derailing global prosperity.
Great recession Global nnr scarcityBy the onset of the Great Recession in 2008, NNR prices had increased to levels at which many of the NNR purchases planned for 2009 and beyond no longer made economic sense. Projects, investments, and associated NNR purchases were cancelled or postponed indefinitely. Global NNR demand/utilization collapsed as a result – demand destruction – as did global prosperity.
Economic growth among most newly industrializing nations slowed dramatically; economic growth among most industrialized nations went negative.29
Collapsing global NNR demand during the Great Recession created spontaneous global NNR supply surpluses, which caused most NNR prices to plunge from their pre-recession highs. Ironically, the debilitatingly high NNR price levels that precipitated the Great Recession were temporarily mitigated by the Great Recession.
[It is notable that 2009 prices associated with 11 of 15 analyzed NNRs (see the above table), while decreasing (sometimes considerably) from their pre-recession highs, remained above their average pre-recession levels. And, in 13 of 15 cases, 2009 prices remained above their average mid/late 20th century levels.]
post-recession Global nnr scarcityFueled by incessant central government fiscal stimulus (unrepayable debt) and central bank monetary stimulus (money printing and interest rate suppression) since 2009, the industrialized and industrializing nations of the world have attempted to recover from the Great Recession and restore global economic growth and material living standard improvement rates reminiscent of the good old days.
Stimulus-provided “liquidity” and severely depressed NNR prices served to re-stimulate global NNR demand in 2010, albeit within the context of still-constrained global NNR supplies, thereby quickly driving post-recession NNR prices to pre-recession levels, or higher.
[In 13 of the 15 analyzed cases (see the above table), with natural gas and aluminum being the exceptions, average post-recession NNR prices exceeded average pre-recession prices. And for 12 of the 15 analyzed NNRs – natural gas, aluminum, and potash being the exceptions – average post-recession prices exceeded average prices during any of the three earlier intervals.]
Nascent economic recoveries failed in 2010, 2011, 2012, and 2013, as global NNR demand/utilization was throttled in each case by inordinately high and/or increasing NNR prices – global NNR scarcity persisted through 2013.30
(Note that unlike historical NNR scarcity episodes, which were “boom” period phenomena, our current NNR scarcity episode has persisted during the protracted post-recession “bust” period as well – i.e., NNR prices have remained

Page 8 Whatever Happened to “The Good Old Days”?
inordinately high even during our post-recession economic malaise. The reason: as NNR quality decreases, the minimum costs at which these lower quality NNRs remain profitable to produce – “cost floors” – increase. As NNR cost floors increase, NNR “price floors” must necessarily increase as well, irrespective of underlying economic conditions.)
Future nnr scarcitySome analysts contend that our current episode of global NNR scarcity is simply the result of a temporary, albeit protracted, commodity “super cycle”. They expect substantial quantities of high quality/low cost NNRs to be brought online immediately and for the foreseeable future, which will suppress NNR prices and end our current episode of NNR scarcity.31
[It is notable that 2013 NNR prices have in fact decreased in many cases from their post-recession peaks, which generally occurred during 2011. For 13 of the 15 analyzed NNRs, oil and natural gas being the exceptions, average 2013 prices were lower than average 2011 prices.
However, despite recent decreases, most NNR prices remain inordinately high by historical standards (see the above table). In 14 of 15 cases, with aluminum being the exception, 2013 prices remained higher than average mid/late 20th century prices – in many cases significantly higher. And in 12 of 15 cases, with natural gas, aluminum, and nickel being the exceptions, 2013 prices remained higher than average pre-recession prices – in many cases significantly higher.
Our faltering global prosperity indicates that recent NNR price decreases are likely the result of gradually decreasing global NNR demand owing to persistently high NNR prices – “slow motion demand destruction” – rather than to increasingly abundant and affordable global NNR supplies.32]
While it is unclear at this point whether our current episode of global NNR scarcity will prove to be temporary or permanent, it is clear that our early 21st century experience with NNR scarcity is a precursor of things to come.
iii. 2014 Global prosperity assessMentThe 2014 Global Prosperity Assessment (Assessment) reviews and analyzes historical global prosperity trajectories and trends during our modern industrial era (1960-2013).33 Specifically, the Assessment considers the growth trajectories and average growth rates associated with:
• Global GDP (economic output), which measures aggregate global prosperity for all of humanity; and• Global per capita GDP (material living standards), which measures average prosperity per global inhabitant.
The Assessment also considers future global prosperity scenarios and their respective probabilities.
historical Global prosperity
During the course of our modern industrial era, as global NNR abundance has transitioned to global NNR scarcity, robustly increasing global prosperity has transitioned to faltering global prosperity.
Global economic (Gdp) Growth
Annual Global GDP Growth Rate Trajectory
During the years between 1960 and 2013, the overall trajectory associated with annual global economic (GDP) growth was decidedly negative (downward tending). The annual global GDP growth rate plunged from a relatively robust 4%-6% range during the 1960s to approximately 2% in 2013 – a time span of less than 50 years.

Whatever Happened to “The Good Old Days”? Page 9
Inflation Adjusted Annual Global GDP Growth Rate: 1960-2013
-3.00%-2.00%-1.00%0.00%1.00%2.00%3.00%4.00%5.00%6.00%7.00%8.00%
20131960
Global Economic (GDP) Growth Rate
annual Global Gdp Growth rate trend
Between 1960 and 2000, the annual increase in global GDP averaged 3.76%.
Annual global GDP growth then decreased to 2.99% on average during the 2000-2008 pre-recession period, and further decreased to 1.86% from the Great Recession forward. The average annual global economic growth rate that we have experienced since the Great Recession is less than half the rate that we experienced during the mid/late 20th century.
Global Material living standard (per Capita Gdp) improvement
Annual Global Per Capita GDP Growth Rate Trajectory
Not surprisingly, the trajectory associated with global material living standard (per capita GDP) improvement paralleled the negative trajectory in global economic (GDP) growth during our modern industrial era. The annual global per capita GDP growth rate decreased from a relatively strong 3%-4% range during the 1960s to approximately 1.0% in 2013.
Inflation Adjusted Annual Global Per Capital GDP Growth Rate: 1960-2013
annual Global economic (Gdp) Growth rate1960-2000 average 2000-2008 average 2008-2013 average
3.76% 2.99% 1.86%
-4.00%
-3.00%
-2.00%
-1.00%
0.00%
1.00%
2.00%
3.00%
4.00%
5.00%
20131960
Global Material Living Standard (per capita GDP) Improvement Rate

Page 10 Whatever Happened to “The Good Old Days”?
annual Global per Capita Gdp Growth rate trend
Between 1960 and 2000, the annual increase in global per capita GDP averaged 1.97%.
Annual global per capita GDP growth then decreased to 1.73% on average during the 2000-2008 pre-recession period, and further decreased to 0.67% from the Great Recession forward. The average annual global material living standard improvement rate that we have experienced since the Great Recession is only one third the rate that we experienced during the mid/late 20th century.
While global prosperity is still increasing, it is increasing at a greatly diminished rate – faltering global prosperity has become our new reality.34
persistent nnr scarcity Faltering Global prosperity
What happened?Over the past several decades, continuously decreasing NNR quality has prevailed over human ingenuity. That is, human technology, resourcefulness, innovation, resilience, efficiency improvements, and productivity enhancements have failed to prevent often significant cost/price increases associated with NNRs of continuously decreasing quality.
Our enormous and generally increasing global NNR requirements within the context of increasingly expensive/lower quality global NNR supplies have resulted in ever-increasing global NNR scarcity, which has caused faltering global prosperity. In less than half a century, global humanity has experienced a transition from robustly increasing prosperity to anemically increasing prosperity.
At issue going forward is whether human ingenuity will once again prevail over decreasing NNR quality, as had been the case during much of the 20th century; and if so, over what period of time? Or, will decreasing NNR quality continue to prevail over human ingenuity, as has been the case during the early years of the 21stcentury?
Future Global prosperityShould existing global prosperity trends persist going forward, our global material living standard improvement trajectory will reach zero – i.e., global per capita GDP will peak and enter terminal decline – by the early 2030s; and global economic output (GDP) will peak and enter terminal decline by the middle 2040s.35 The implications associated with such a scenario for human societal wellbeing would be catastrophic.
Projected Global Prosperity Growth Trajectories
annual Global Material living standard (per Capita Gdp) improvement rate
1960-2000 average 2000-2008 average 2008-2013 average1.97% 1.73% 0.67%
-4.00%
-2.00%
0.00%
2.00%
4.00%
6.00%
8.00%
0.00%
1960 2013 20442031
Global Economic (GDP) Growth Rate
Global Material Living Standard (per capita GDP)
Improvement Rate

Whatever Happened to “The Good Old Days”? Page 11
Given that our future global NNR requirements are likely to remain enormous and generally increasing, future global prosperity – and the future of the human enterprise – will be determined by the quantities and quality associated with future global NNR supplies.
That is, the outcome of the ongoing battle between continuously decreasing NNR quality and human ingenuity will determine future global NNR supply costs, which will determine NNR prices, which will determine NNR demand/utilization, which will determine global economic output (GDP), which will determine global material living standards (per capita GDP).
Continuously decreasing nnr Quality versus human ingenuity nnr supply Costs nnr prices nnr demand/Utilization
economic output (Gdp) Material living standards (per Capita Gdp)
This causal relationship is reflected in the four possible global prosperity scenarios open to humanity from this point forward:
Future Global prosperity scenarios
205020131960
1
2
34
Four Future Scenarios
Global Prosperity Growth Rate Trajectory
HistoricalFuture
scenario 1 – temporary reversalscenario 1: human ingenuity prevails over continuously decreasing NNR quality during the near term, as many geopolitical and geological barriers36 to currently inaccessible NNR supplies are successfully overcome.
Beginning in 2014 and continuing for at least a decade, enormous quantities of high quality/low cost NNRs are brought online, as previously inaccessible NNR deposits become accessible through new NNR exploitation processes and technologies, and/or as previously off-limits NNR deposits become accessible through relaxed restrictions.
As relative global NNR abundance displaces NNR scarcity, NNR prices decrease to mid/late 20th century levels or below, which stimulates global NNR demand/utilization to levels that enable 5+% annual global economic growth and steadily improving global material living standards for a decade or so.
Regrettably, even under the most optimistic circumstances, our global prosperity renaissance ends within a few decades, as continuously decreasing NNR quality ultimately prevails over human ingenuity, and global NNR scarcity permanently displaces NNR abundance. Global economic growth and material living standard improvement resume their negative (downward) trajectories as a result.

Page 12 Whatever Happened to “The Good Old Days”?
scenario 1 probability: because Scenario 1 is predicated upon the immediate and continuous exploitation of enormous high quality/low cost NNR deposits of nearly all types – NNR deposits that are currently undiscovered, physically inaccessible, and/or technologically inaccessible – the probability of its occurrence is essentially zero.
While periodic upticks in global economic growth and material living standard improvement are certainly possible during the near term, a return to the good old days of vigorously increasing global prosperity – i.e., persistently robust economic growth and rapidly improving material living standards – if only for a few decades, is nearly impossible.
scenario 2 – temporary reprievescenario 2: the ongoing battle between continuously decreasing NNR quality and human ingenuity remains at a standoff during the near term, as we attempt with some success to overcome geopolitical and geological barriers to currently inaccessible NNR supplies.
Global NNR scarcity is essentially held in check, as sufficient high quality/low cost NNR supplies are brought online to enable anemic 2% annual global economic growth and modest global material living standard improvement during the next decade or so.
By approximately 2030, however, decreasing NNR quality inevitably prevails over human ingenuity. Continuously increasing NNR prices associated with lower quality/higher cost global NNR supplies suppress global NNR demand/utilization to levels that no longer enable even anemic increases in global prosperity. Global economic growth and global material living standard improvement trajectories resume their downward slides.
scenario 2 probability: because we are a resourceful and resilient species – we will pull out all the stops in our attempt to perpetuate our industrial lifestyle paradigm for as long as possible – the probability associated with Scenario 2 is high.
To the extent that we as a species focus on cooperatively maximizing future globally available, economically viable NNR supplies – rather than resorting to natural resource wars – it is quite possible that we can continue to increase global prosperity at today’s rate for a decade or more.
scenario 3 – Continued declinescenario 3: decreasing NNR quality continues to prevail over human ingenuity. Geopolitical and geological barriers to currently inaccessible NNRs are either not overcome or provide only modest incremental high quality/low cost NNR supplies in the event that they are overcome.
Increasingly costly, lower quality global NNR supplies cause persistently high and/or increasing NNR prices, which suppress global NNR demand/utilization to levels that cause global economic growth and global material living standard improvement to remain on their current negative (downward) trajectories.
scenario 3 probability: unless human ingenuity affords us no incremental high quality/low cost NNR supplies going forward, it is likely that humanity will experience at least a brief period of constant global economic growth and material living standard improvement during the near term, as depicted by Scenario 2. The probability associated with Scenario 3 is therefore only medium.
scenario 4 – accelerated declinescenario 4: in the worst case scenario, continuously decreasing NNR quality completely overwhelms human ingenuity in the near term. Geopolitical and geological barriers to currently inaccessible NNRs are generally not overcome, and provide only negligible incremental high quality/low cost NNRs to the extent that they are overcome.
Increasingly prevalent low quality/high cost global NNR supplies cause debilitatingly high NNR prices, which suppress global NNR demand/utilization to levels that drastically impair global economic growth and material living standard improvement.

Whatever Happened to “The Good Old Days”? Page 13
In Scenario 4, we make a bad situation worse by reacting adversely to our deteriorating circumstances – we resort increasingly to conflict as the means by which to allocate increasingly scarce natural resources and material wealth. The result is an increasingly severe decline in global prosperity. scenario 4 probability: while the probability associated with Scenario 4 is low, this scenario carries a far greater probability than the best case scenario, Scenario 1.
iv. hUManity’s destiny
no happy endingHumanity’s destiny is being determined by the ongoing battle between continuously decreasing NNR quality and human ingenuity. While Scenario 2 is the most likely of the four future global prosperity scenarios – we are already resorting to extreme measures in our attempt to perpetuate our industrialized existence37 – Scenario 3 is a relatively close second, and Scenario 4 cannot be ruled out.
(Scenario 1 is considered virtually impossible. The probability that we will discover and extract sufficient high quality/low cost NNRs to instantaneously reverse our faltering global prosperity trajectory is infinitesimal – given that we have been unable to do so during the past 50 years, despite unparalleled human ingenuity during that time; and given that our current global NNR requirements are historically unprecedented, and increasing, in most cases.)
However, irrespective of which global prosperity scenario unfolds, the ultimate outcome will be the same. Continuously decreasing NNR quality will overwhelm human ingenuity, global NNR scarcity will become increasingly prevalent, and faltering global prosperity will culminate in global societal collapse.
Going forward, global competition for increasingly scarce renewable and nonrenewable natural resources will devolve into resource wars, which will devolve into global societal collapse through an ecological/economic/societal chain of events that is being driven by ever-increasing, geologically-induced, global NNR scarcity:38
historically Unprecedented Global requirements for Finite and non-replenishing nnrsWithin the Context of nnr supplies of Continuously decreasing Quality
diminishing returns on investments in nnr exploitation
persistently high/increasing nnr Cost/price levels
stagnating/decreasing nnr demand/Utilization levels
stagnating/decreasing Gdp levels
stagnating/decreasing Material living standards
Increasing Economic, Political, and Social Instability/Unrest/Conflict
Collapsing national economies followed by Global societal Collapse
Humanity’s fate was sealed at the inception of our industrial revolution when the NNR genie was let out of the bottle. Our self-inflicted demise is a question of “when”, not “if”.
nature always bats lastWere we truly the wise species that the name “Homo sapiens”39 implies, we would understand that the good old days, as characterized by vigorously increasing global prosperity, were enabled by temporarily abundant and affordable supplies of finite and non-replenishing NNRs, most of which are now becoming increasingly scarce and expensive.
Page 14 Whatever Happened to “The Good Old Days”?
We could then acknowledge that both globally abundant NNRs and the good old days are gone forever. Our old reality of “continuously more and more” is giving way to our new reality of “continuously less and less”.
We would also understand that our persistent global economic malaise and increasing global political instability and social unrest are merely symptoms and manifestations of faltering global prosperity, which is a consequence of ever-increasing global NNR scarcity.
We could then refrain from wasting additional time and resources pursuing irrelevant economic, political, and social “fixes” to our ecologically-based “predicament”.
(Humanity’s predicament: because the natural resource utilization behavior that enables our current “success” – our industrial lifestyle paradigm – and that is essential to perpetuating our success, is simultaneously undermining our very existence, neither our natural resource utilization behavior nor our industrial lifestyle paradigm is sustainable.)
Rather, we could focus our energies and resources on optimizing our inevitable transition to a sustainable lifestyle paradigm.40
Regrettably, because it is inconceivable to us that continuously decreasing NNR quality (Nature) will inevitably prevail over human ingenuity, we will fail to understand these inconvenient truths. We will instead continue to pursue universal Western style prosperity through global industrialization, unravel as described above, and experience global societal collapse – almost certainly by the year 2050.
through industrialism, humanity set out to accomplish great things; and we have accomplished great things. Unfortunately, we have obviated ourselves in the process.
Ω
notes
1. Information regarding “Scarcity – Humanity’s Final Chapter?” can be found here – www.nnrscarcity.com. 2. NNRs are considered “nonrenewable” because their supplies are not naturally replenished on a time scale that is relevant
from the perspective of a human lifespan, in the event that they are replenished at all.3. As used in the paper, the term “prosperity” is defined by quantifiable criteria: economic output (GDP) and material living
standards (per capita GDP). 4. “Economic Drivers of Mineral Supply” - U.S. Geological Survey Open-File Report 02-335, page 21; 2002 - Lorie A.
Wagner, Daniel E. Sullivan, and John L. Sznopek - http://pubs.usgs.gov/of/2002/of02-335/of02-335.pdf. 5. Mineral Information Institute (Historical US NNR utilization data compiled by the Mineral Information Institute is
available upon request from coclugston at Verizon dot net.) – www.mii.org. 6. Estimated total US mineral utilization in the year 1800: per capita US mineral utilization in 1776 was about 1200 lbs./year
- http://www.mii.org/pdfs/Minerals1776vsToday.pdf; I increased the per capita number to 1500 lbs. for the year 1800; so total US mineral utilization was 1500 lbs. times 5.3 million people, which equals (3,975,000 tons) ~ 4 million tons.
7. Estimated US total mineral utilization in the year 2008: per capita US mineral utilization in 2008 was ~42,719 pounds, per Mineral Industry Information, pg. 2 - http://www.mii.org/pdfs/Baby_Info.pdf; times 304 million people, which equals ~6.5 billion tons total.
8. US year 1800 and year 2008 inflation adjusted GDP data from Measuring Worth - http://www.measuringworth.com/.9. “Crust”, Wikipedia, 2011 - http://en.wikipedia.org/wiki/Crust_(geology). 10. “Mineral Commodities Summary 2009”, page 191; USGS, 2009 - http://minerals.usgs.gov/minerals/pubs/mcs/2009/
mcs2009.pdf. 11. “Mineral Commodities Summary 2009”, USGS, page 192.

Whatever Happened to “The Good Old Days”? Page 15
12. Crustal occurrences, resources, and reserves vary widely among NNRs; the example provides an indication of the scale of the relationship among the three metrics, on average. Crustal NNR occurrences can be found at “Abundance of Elements in Earth’s Crust”, Wikipedia, 2010 - http://en.wikipedia.org/wiki/Abundance_of_elements_in_Earth’s_crust; globally available NNR “resources” and “reserves” as of 2012 are available in “Mineral Commodities Summary 2013”, USGS, 2013 – http://minerals.usgs.gov/minerals/pubs/mcs/2013/mcs2013.pdf.
13. Annual global extraction data for 24 indispensible NNRs: ”Historical Statistics for Mineral and Material Commodities in the United States”; US Geological Survey, 2013 - http://minerals.usgs.gov/ds/2005/140/http://minerals.usgs.gov/ds/2005/140/; “Mineral Commodities Summary 2013”, USGS, 2013 – http://minerals.usgs.gov/minerals/pubs/mcs/2013/mcs2013.pdf; and “International Energy Statistics”, US Energy Information Administration, 2014 - http://www.eia.gov/cfapps/ipdbproject/IEDIndex3.cfm.
14. See “Scarcity – Humanity’s Final Chapter?” pages 20-33 for a detailed explanation of NNR scarcity.15. “200 Years of Commodity Prices”, Barry Bannister, 2010 - http://www.japaninc.com/files/images/mgz_72_commo-
price-cycles.JPG.16. See “Scarcity – Humanity’s Final Chapter?”; “Austerity – Our “New Normal”, Chris Clugston, 2012 - http://www.
wakeupamerika.com/PDFs/Austerity-Our-New-Normal.pdf; and “21st Century NNR Scarcity – Blip or Paradigm Shift?”, Chris Clugston, 2013 – http://www.wakeupamerika.com/PDFs/21st-Century-NNR-Scarcity_Blip-or-Paradigm-Shift.pdf for details.
17. See “Scarcity – Humanity’s Final Chapter?” pages 51-59.18. “Economic Drivers of Mineral Supply” – USGS, page 10. 19. “Economic Drivers of Mineral Supply”, USGS, page 61. 20. “Economic Drivers of Mineral Supply”, USGS, page 78; NNRs included in the USGS “mineral mountain” are cement,
clays, lime, phosphate rock, salt, sand and gravel, crushed stone, copper, gold, iron ore, lead, and zinc. 21. “Economic Drivers of Mineral Supply”, USGS, page 64. 22. All NNR prices used in the Analysis are inflation adjusted data from “World Prices of Commodities and Indices (Pink
Sheets)”, World Bank, 2014 – http://econ.worldbank.org/WBSITE/EXTERNAL/EXTDEC/EXTDECPROSPECTS/0,,contentMDK:21574907~menuPK:7859231~pagePK:64165401~piPK:64165026~theSitePK:476883,00.html.
23. Included in the Analysis are 15 fossil fuels, metals, and major fertilizer components for which the World Bank maintains inflation adjusted pricing data between the years 1960 and 2013 (except coal, 1970-2013). These 15 NNRs represent a viable subset of the 89 NNRs that were analyzed in “Scarcity – Humanity’s Final Chapter?”, and provide a good proxy for the global NNR price trends and trajectories that prevailed during the 1960-2013 period.
24. The global industrialized population estimate of approximately 1 billion is based on the assumption that roughly 25% of Earth’s 4.1 billion people lived in industrialized regions in 1975. These included most of Europe, Russia, North America, Japan, and the four Asian tigers.
25. See “21st Century NNR Scarcity – Blip or Paradigm Shift?” Appendix A, pages 21-24.26. See “21st Century NNR Scarcity – Blip or Paradigm Shift?” pages 4-5.27. A complete listing of NNR price changes between the years 2000 and 2008 is available in Appendix B of “Scarcity –
Humanity’s Final Chapter?”, pages 376-378.28. A complete listing of globally scarce NNRs in the year 2008 is available in “Scarcity – Humanity’s Final Chapter?”,
pages 51-53.29. See “World Development Indicators/World GDP (constant 2000 US$)”, World Bank, 2014, – http://www.google.com/
publicdata/explore?ds=d5bncppjof8f9_&met_y=ny_gdp_mktp_cd&idim=country:USA&dl=en&hl=en&q=us+gdp#!ctype=l&strail=false&bcs=d&nselm=h&met_y=ny_gdp_mktp_cd&scale_y=lin&ind_y=false&rdim=region&idim=country:USA&ifdim=region&tdim=true&hl=en_US&dl=en&ind=false for global and national inflation adjusted GDP data.
30. Current global NNR surpluses, in cases where they exist, typically consist of low quality/high cost NNRs that are surplus due to unaffordably high prices.
31. See “21st Century NNR Scarcity – Blip or Paradigm Shift?”, pages 15-17.

Page 16 Whatever Happened to “The Good Old Days”?
Negative Population Growth, Inc. Voice: (703) 370-95102861 Duke Street, Suite 36 Fax: (703) 370-9514Alexandria, VA 22314 email: [email protected] www.NPG.org
SIGN UP TODAY AT WWW.NPG.ORGFOR OUR NEW INTERNET NPG JOURNAL!
Board of DirectorsDonald Mann, PresidentFrances Dorner, Secretary/TreasurerJosephine LobrettoSharon MarksDiane Saco
32. While NNR demand destruction temporarily alleviates NNR scarcity, it also negatively impacts prosperity. Decreased NNR utilization resulting from demand destruction causes decreased economic output (GDP) and decreased material living standards (per capita GDP) as well.
33. Global GDP and global per capita GDP data used in the Assessment can be found at “World Development Indicators”, World Bank, 2014 – http://www.google.com/publicdata/explore?ds=d5bncppjof8f9_&met_y=ny_gdp_mktp_cd&idim=country:USA&dl=en&hl=en&q=us+gdp#!ctype=l&strail=false&bcs=d&nselm=h&met_y=ny_gdp_mktp_cd&scale_y=lin&ind_y=false&rdim=region&idim=country:USA&ifdim=region&tdim=true&hl=en_US&dl=en&ind=false; 2013 estimates are derived from “Global Economics Prospects”, World Bank, 2014 - http://www.worldbank.org/en/publication/global-economic-prospects.
34. Although global prosperity is generally increasing on average, growing income and wealth disparities among nations and among population segments within nations are becoming increasingly prevalent, as are decreases in real income and wealth levels for many. These phenomena are sources of increasing global tension and conflict.
35. See “World Development Indicators”.36. Geopolitical barriers to NNR accessibility include legal restrictions, unrest, tariffs, quotas, and other trade barriers.
Geological barriers include harsh climate, difficult terrain, extreme depth, lack of resources such as water, and other natural constraints.
37. Oil is an example. As higher quality/lower cost “conventional” oil extraction peaks and enters terminal decline globally, we are forced to rely on lower quality/higher cost resources such as deep water oil, ultra-deep water oil, polar oil, heavy oil, tar sands, shale oil, and biofuels.
38. For a detailed description of the consequences associated with increasing global NNR scarcity, see “Scarcity – Humanity’s Final Chapter?”, pages 87-94.
39. Wikipedia “Homo sapiens”, 2014 – http://en.wikipedia.org/wiki/Homo_sapiens. 40. For a description of a sustainable lifestyle paradigm, see “Scarcity – Humanity’s Final Chapter?”, page 91.
Chris Clugston bioSince 2006, Clugston has conducted extensive independent research into the area of “sustainability”, with a focus on NNR (nonrenewable natural resource) scarcity. NNRs are the fossil fuels, metals, and nonmetallic minerals that enable our modern industrial existence.
He has sought to quantify from a combined ecological and economic perspective the extent to which America and humanity are living unsustainably beyond our means, and to articulate the causes, magnitude, implications, and consequences associated with our “predicament”. His research includes the publication of Scarcity – Humanity’s Final Chapter? in 2012, and several analytical updates.
© 2014 by NPG. Permission to reprint is granted in advance. Please acknowledge source and author, and notify NPG.The views expressed by the author do not necessarily reflect those of NPG.This Forum, as well as other NPG publications, can be found on our internet website at www.NPG.org.NPG is a national membership organization founded in 1972. Annual dues are $30 and are tax-deductible to the extent the law allows.Please write or call for a list of available publications.