whirlpool corporation q3 2008...
TRANSCRIPT

Whirlpool Confidential
Whirlpool CorporationWhirlpool CorporationQ3 2008 ReviewQ3 2008 Review
October 28, 2008

22Whirlpool ConfidentialOctober 28, 2008
AgendaAgenda
►Overview► Jeff Fettig – Chairman and Chief Executive Officer
►North American Operations► Mike Todman – President, North America
► International Operations► Jeff Fettig – Chairman and Chief Executive Officer
►Financial Review and 2008 Outlook► Roy Templin – EVP and Chief Financial Officer

33Whirlpool Confidential
Third Quarter SummaryThird Quarter Summary
► Sales increase 1% to $4.9 billion
► Earnings from continuing operations decreased 7 percent to $163 million compared to $175 million in the previous year
► EPS of $2.15 per share versus $2.20 per share in the prior year
October 28, 2008
44Whirlpool Confidential
OverviewOverview
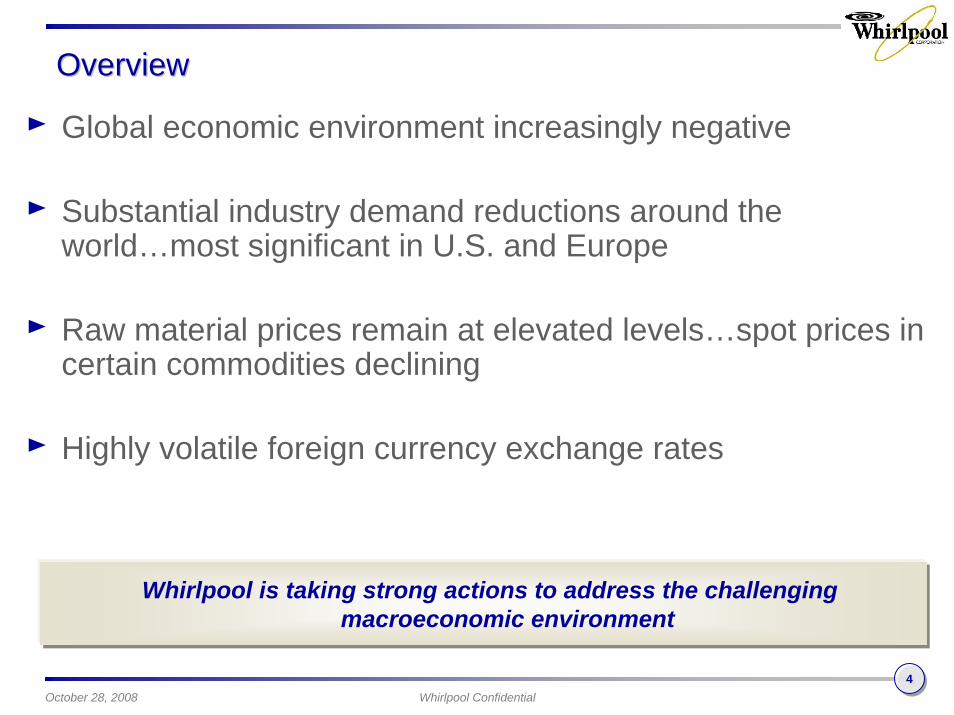
► Global economic environment increasingly negative
► Substantial industry demand reductions around the world…most significant in U.S. and Europe
► Raw material prices remain at elevated levels…spot prices in certain commodities declining
► Highly volatile foreign currency exchange rates
Whirlpool is taking strong actions to address the challenging macroeconomic environment
October 28, 2008

55Whirlpool Confidential
Business PrioritiesBusiness Priorities
► Reduce structural costs and production capacity to expected demand levels
► Cost-based price increases
► Continue to invest in innovative new products
► Enhance strong liquidity position– Suspend share repurchase program– Tightly manage working capital and capital expenditures
October 28, 2008
66Whirlpool Confidential
Structural Cost Reduction ActionsStructural Cost Reduction Actions
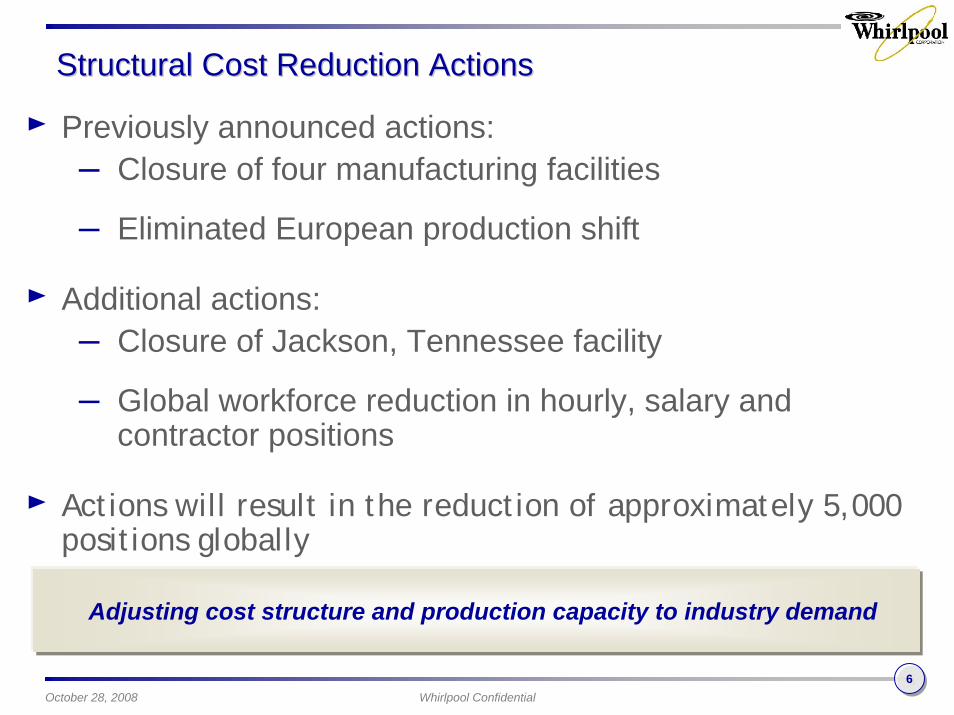
► Previously announced actions:– Closure of four manufacturing facilities
– Eliminated European production shift
► Additional actions:– Closure of Jackson, Tennessee facility
– Global workforce reduction in hourly, salary and contractor positions
► Actions will result in the reduction of approximately 5,000 positions globally
Adjusting cost structure and production capacity to industry demand
October 28, 2008

77Whirlpool Confidential
Structural Cost Reduction Actions ImpactStructural Cost Reduction Actions Impact
► Full year 2008 restructuring charge of $170 million
► Actions undertaken through 2009
► Result in annualized cost savings of approximately $275 million
Undertaking necessary changes to adapt to the economic environment and continue to invest in the right areas to generate future value
October 28, 2008

88Whirlpool Confidential
CostCost--Based Pricing ActionsBased Pricing Actions
► Implemented and announced increases in all major regions
► On average 4-10% globally
► North America► Effective January
► Europe► Implemented November through December
► Latin America► Implemented during September
October 28, 2008

Whirlpool Confidential
North America

1010Whirlpool Confidential
• U.S. demand down ~11% during 3Q• Material and oil-related costs unfavorable• Favorable price/mix impact
North America Q3 ResultsNorth America Q3 Results
Third Quarter Better/(Worse)
(USD in millions) 2008 2007 2007 %
Net Sales 2,741$ 2,947$ (206)$ (7)%
Operating Profit 74 132 (58) (44)%
Operating Margin % 2.7% 4.5% (1.8) pts
October 28, 2008

1111Whirlpool Confidential
Current outlook for U.S. demand decline accelerated in recent weeks…currently expect U.S. down (10)%
2008 U.S. Industry Outlook (T7*)2008 U.S. Industry Outlook (T7*)
DemandComponent Outlook Trend
New Home Completions ~ (30)%
Existing Home Sales ~ (13)%
Discretionary Low Consumer Confidence
Replacement Some Delayed Purchases
October 28, 2008

1212Whirlpool Confidential
U.S. Industry Demand Trends U.S. Industry Demand Trends (T7*)(T7*)
20.0
25.0
30.0
35.0
40.0
45.0
50.0
1998 1999 2000 2001 2002 2003 2004 2005 2006 2007 2008E
(Uni
ts in
mill
ions
)
U.S. Industry demand at lowest levels since 2001…industry has declined 7.3 million units since 2005
October 28, 2008

1313Whirlpool Confidential
Q3 Product LaunchesQ3 Product Launches
Whirlpool brand Resource Saver dishwashing system
Eco‐friendly SteamClean innovation on Whirlpool brand electric ranges
Maytag Bravos with a CEE Tier III energy rating
Maytag Performance Series washer and dryer pair
October 28, 2008

1414Whirlpool Confidential
2008 Outlook2008 Outlook
► Industry demand forecast down 10%
► Implemented additional cost-based price increases to mitigate unfavorable cost and demand levels
► Further reducing production capacity and structural costs to lower expected demand levels and continued material cost inflation
October 28, 2008

Whirlpool Confidential
International

1616Whirlpool Confidential
SummarySummary
► Third quarter demand weak in European region
► Latin America and Asia continued to see strong growth rates during the quarter
► Implemented global cost-based price initiatives
► Substantial foreign exchange fluctuations
Solid International results in volatile operating environment
October 28, 2008

1717Whirlpool Confidential
Europe Q3 ResultsEurope Q3 Results
• Industry demand down 4%• Sales approximately equal to prior year excluding currency
translation impact• 2008 asset sale gain of $9 million versus $32 million in prior year
Third Quarter Better/(Worse)
(USD in millions) 2008 2007 2007 %
Net Sales 1,087$ 998$ 89$ 9%
Operating Profit 52 84 (32) (38)%
Operating Margin % 4.8% 8.4% (3.6) pts
October 28, 2008

1818Whirlpool Confidential
Latin America Q3 ResultsLatin America Q3 Results
• Sales increase 11% excluding currency translation impact
• Prior year results include non-income based tax credit of $12 million
• Increased appliance unit shipments and favorable price/mix were mitigated by increased material and oil-related costs
Third Quarter Better/(Worse)
(USD in millions) 2008 2007 2007 %
Net Sales 989$ 813$ 176$ 22%
Operating Profit 116 103 13 13%
Operating Margin % 11.7% 12.7% (1.0) pts
October 28, 2008

1919Whirlpool Confidential
Asia Q3 ResultsAsia Q3 Results
• Net sales increase ~16% excluding currency translation impact
• Profitability improvement resulting from product price/mix initiatives and ongoing productivity gains
Third Quarter Better/(Worse)
(USD in millions) 2008 2007 2007 %
Net Sales 137$ 123$ 14$ 11%
Operating Profit/(Loss) 0 (5) 5 NM
Operating Margin % 0.3% (4.4)% 4.7 pts
October 28, 2008

2020Whirlpool Confidential
Q3 International Product Launches
Whirlpool brand Onyx refrigerator
Whirlpool brand VARIwashing machine
Brastemp brand Split Ativeair conditioner featuring
decorative stickers
Consul brand stainless steel kitchen
suite
Bauknecht brand CombiA++ refrigerator
KitchenAid brand Pro-Clean Integrated
Dishwasher
KitchenAid 9M ovenWhirlpool brand induction
cooktop
Whirlpool brand large capacity washing machine
October 28, 2008

2121Whirlpool Confidential
2008 Outlook2008 Outlook
► European market experienced significant demand reduction it 3Q…expect market to remain very challenging in 4Q
► Latin America demand solid in 3Q…will remain positive at a slower rate
► Asia demand favorable in 3Q…expect will remain positive at a slower rate in 4Q
► Additional cost-based pricing and productivity actions taken in all international operations
October 28, 2008

Whirlpool Confidential
Financial Overview

2323Whirlpool Confidential
ThirdThird--Quarter SummaryQuarter Summary
Revenue performance+ Latin America and Asia market demand
+ Foreign currency exchange
– U.S. and Europe market demand
Margin performance+ Price/mix improvements globally
+ Cost productivity gains
– Material and oil-related costs
– U.S. and Europe market demand
– Lower asset sale gains vs. 2007 levels
Other items+ Monetized $43 million of BEFIEX credits
October 28, 2008

2424Whirlpool Confidential
Financial SummaryFinancial Summary
► Net Sales: Excluding foreign exchange sales decreased ~2%► Gross Margin: Increased raw material/oil costs and lower production
volumes partially offset by favorable price/mix and productivity► SG&A: FX translation and increased brand investment
Third Quarter Better/(Worse)
2008 2007 2007 %
Net Sales 4,902 4,840 62 1%
Cost of Goods Sold 4,217 4,148 (69) (2)% Gross Margin % 14.0% 14.3% (0.3) pts
SG&A 477 414 (63) (15)%
Restructuring 24 13 (11) (84)%
Operating Profit 177 258 (81) (32)% Operating Margin % 3.6% 5.3% (1.7) pts
(millions of USD)
October 28, 2008

2525Whirlpool Confidential
Financial SummaryFinancial SummaryThird Quarter Better/(Worse)
2008 2007 2007 %
Operating Profit 177 258 (81) (32)%
Interest Expense (52) (52) 0 0%Interest & Sundry Income/(Expense) (3) (17) 14 NM Gain on Sale of Investment 0 7 (7) NM
Earnings Before Income Taxes 122 196 (74) (38)%
Income Taxes (46) 8 54 NM Effective Tax Rate (37.8)% 4.2%
Equity Earnings/(Loss) - (6) 6 NM Minority Interest (5) (7) 2 23%
Earnings from Continuing Operations 163 175 (12) (7)%
EPS - Diluted 2.15$ 2.20$ (0.05)$ (2)%
(millions of USD)
► Lower interest and sundry expenses primarily related to increased interest income
► Income tax benefit compared to prior year expense
October 28, 2008

2626Whirlpool Confidential
Working CapitalWorking Capital
9/30/08 9/30/07 6/30/08
Accounts Receivable 2,603 2,755 2,628
Inventory 3,053 2,934 2,996
Accounts Payable 3,282 3,217 3,399
Working Capital 2,374 2,472 2,225 % of Sales 12.2% 13.2% 11.5%
October 28, 2008

2727Whirlpool Confidential
Cash FlowCash Flow
Nine Months EndedSeptember 30
2008 2007
Earnings from Continuing Operations 374 460
Depreciation & Amortization 467 435
Working Capital (458) (391)
Other (389) (376)
Cash Provided By Continuing Operating Activities (6) 128
Capital Expenditures (378) (310)
Proceeds from Sale of Assets/Businesses (non-Maytag) 35 99
Free Cash Flow (349) (83)
(millions of USD)
October 28, 2008
2828
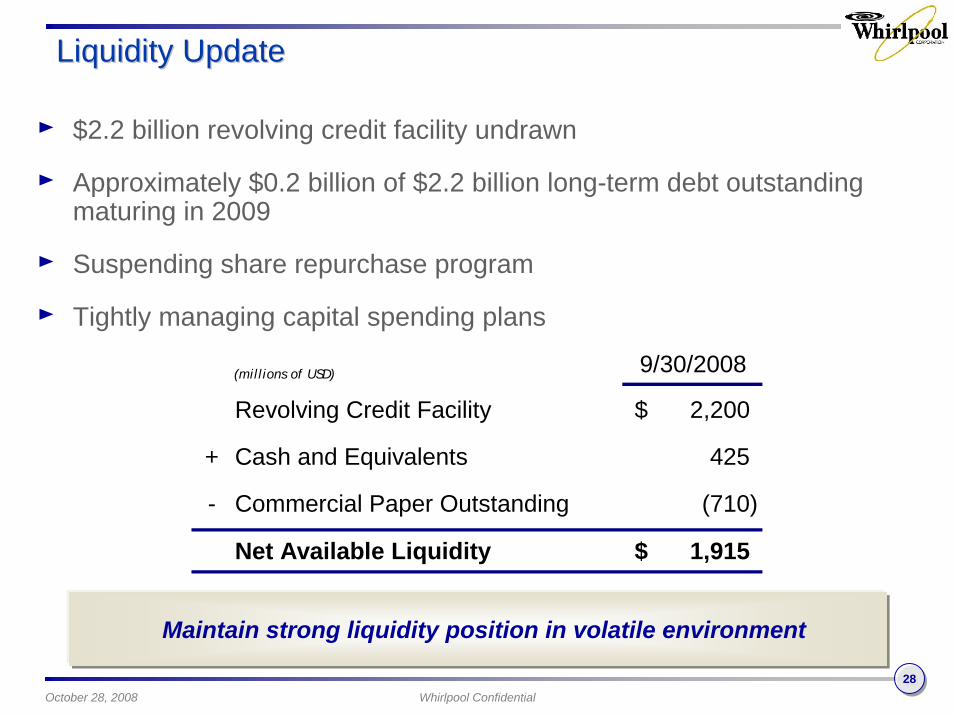
9/30/2008
Revolving Credit Facility 2,200$
+ Cash and Equivalents 425
- Commercial Paper Outstanding (710)
Net Available Liquidity 1,915$
Whirlpool Confidential
Liquidity UpdateLiquidity Update
► $2.2 billion revolving credit facility undrawn
► Approximately $0.2 billion of $2.2 billion long-term debt outstanding maturing in 2009
► Suspending share repurchase program
► Tightly managing capital spending plans
Maintain strong liquidity position in volatile environment
(millions of USD)
October 28, 2008

2929Whirlpool Confidential
2008 Guidance2008 Guidance
October 28, 2008
Current Previous
Earnings per Share $5.75 - $6.00 $7.00 - $7.50
Restructuring Expenses ~ $170 million ~ $100 million
Free Cash Flow $0 - $50 million $500 - $550 million

3030Whirlpool Confidential
Closing Remarks
3131Whirlpool Confidential
Closing RemarksClosing Remarks
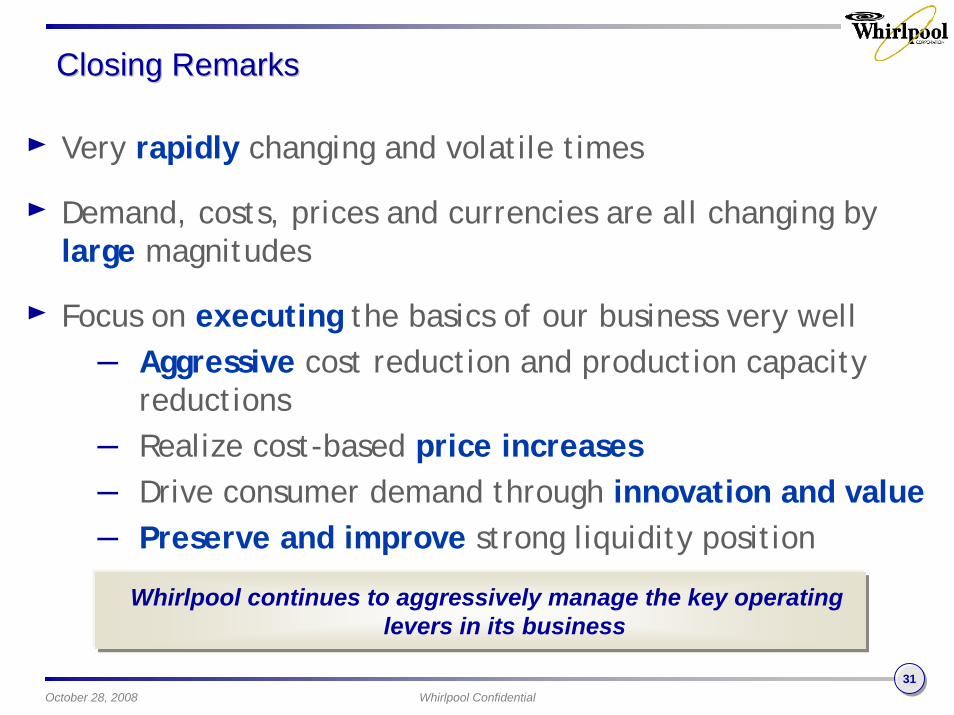
► Very rapidly changing and volatile times
► Demand, costs, prices and currencies are all changing by large magnitudes
► Focus on executing the basics of our business very well– Aggressive cost reduction and production capacity
reductions– Realize cost-based price increases– Drive consumer demand through innovation and value– Preserve and improve strong liquidity position
Whirlpool continues to aggressively manage the key operating levers in its business
October 28, 2008

3232Whirlpool Confidential

3333Whirlpool Confidential
Appendix

3434Whirlpool Confidential
Cash Flow ReconciliationThe table below reconciles actual 2007 & 2008 and projected 2008 cash provided by continuing operations determined in accordance with generally accepted accounting principles (GAAP) in the United States to free cash flow, a non-GAAP measure. Management believes that free cash flow provides shareholders with a relevant measure of liquidity and a useful basis for assessing the company's ability to fund its activities and obligations. There are limitations to using non-GAAP financial measures, including the difficulty associated with comparing companies that use similarly named non-GAAP measures whose calculations may differ from the company's calculations. As defined by the company, free cash flow is cash provided by continuing operations after capital expenditures and proceeds from the sale of assets/businesses. Free cash flow does not include proceeds from the sale of Maytag businesses. The projections shown here are based upon many estimates and are inherently subject to change based on future decisions made by management and the board of directors of the company, and significant economic, competitive and other uncertainties and contingencies.
About Whirlpool CorporationWhirlpool Corporation is the world's leading manufacturer and marketer of major home appliances, with annual sales of approximately $19 billion, 73,000 employees, and 72 manufacturing and technology research centers around the world. The company markets Whirlpool, Maytag, KitchenAid, Jenn-Air, Amana, Brastemp, Consul, Bauknecht and other major brand names to consumers in nearly every country around the world. Additional information about the company can be found at http://www.whirlpoolcorp.com.
* T7 refers to the following household appliance categories: washers, dryers, refrigerators, freezers, dishwashers, ranges and compactors
2008(millions of dollars) 2008 2007 Outlook
Cash provided/(used) by continuing operations (6)$ 128$ 500$ - 525$
Capital expenditures (378) (310) (535) - (550)
Proceeds from sale of assets/non-Maytag businesses 35 99 35 - 75
Free cash flow (349)$ (83)$ -$ - 50$
Nine Months Ended September 30

3535Whirlpool Confidential
Whirlpool Additional Information:This document contains forward-looking statements that speak only as of this date. Whirlpool disclaims any obligation to update these statements. Forward-looking statements in this document include, but are not limited to, statements regarding expected earnings per share, cash flow, productivity and material and oil-related prices. Many risks, contingencies and uncertainties could cause actual results to differ materially from Whirlpool Corporation’s forward-looking statements. Among these factors are: (1) intense competition in the home appliance industry reflecting the impact of both new and established global competitors, including Asian and European manufacturers; (2) Whirlpool’s ability to continue its relationship with significant trade customers, including Sears Holding Corporation in North America (accounting for approximately 12% of Whirlpool’s 2007 consolidated net sales of $19.4 billion), and the ability of these trade customers to maintain or increase market share; (3) changes in economic conditions, including the strength of the U.S. building industry and the level of interest rates; (4) the ability of Whirlpool to achieve its business plans, productivity improvements, cost control, leveraging of its global operating platform, and acceleration of the rate of innovation; (5) fluctuations in the cost of key materials (including steel, oil, plastic, resins, copper and aluminum) and components and the ability of Whirlpool to offset cost increases; (6) the ability of suppliers of critical parts, components and manufacturing equipment to deliver sufficient quantities to Whirlpool in a timely and cost-effective manner; (7) our ability to attract, develop and retain executives and other qualified employees; (8) health care cost trends and regulatory changes that could increase future funding obligations for pension and post retirement benefit plans; (9) the cost of compliance with environmental and health and safety regulations; (10) litigation including product liability and product defect claims; (11) the impact of labor relations; (12) Whirlpool’s ability to obtain and protect intellectual property rights; (13) the ability of Whirlpool to manage foreign currency fluctuations; and (14) global, political and/or economic uncertainty and disruptions, especially in Whirlpool’s significant geographic regions, including uncertainty and disruptions arising from natural disasters or terrorist attacks. Additional information concerning these and other factors can be found in Whirlpool Corporation’s filings with the Securities and Exchange Commission, including the most recent annual report on Form 10-K, quarterly reports on Form 10-Q, and current reports on Form 8-K.