who really cares about “mobility?” testing assumptions about housing choice voucher holders’...
TRANSCRIPT

Who really cares about “mobility?”
Testing assumptions about Housing Choice Voucher holders’ neighborhood preferences
Martha M. Galvez
WA State DSHS Research & Data Analysis
WCPC Seminar, November 14, 2011

2
Overview
Background
Methods and theoretical framework
Results
Implications for policy and research
Questions and comments

3
Voucher program background
• HCV program pays part of private market rent
• Serves more than 2 million very low-income households
• 2,500 local Public Housing Authorities (“PHAs”)

4
Voucher program background
• Response to isolation & concentrated poverty in public housing
• Passive “mobility” expectations
• Portability, choice expected to allow low income households to reach high quality neighborhoods
5
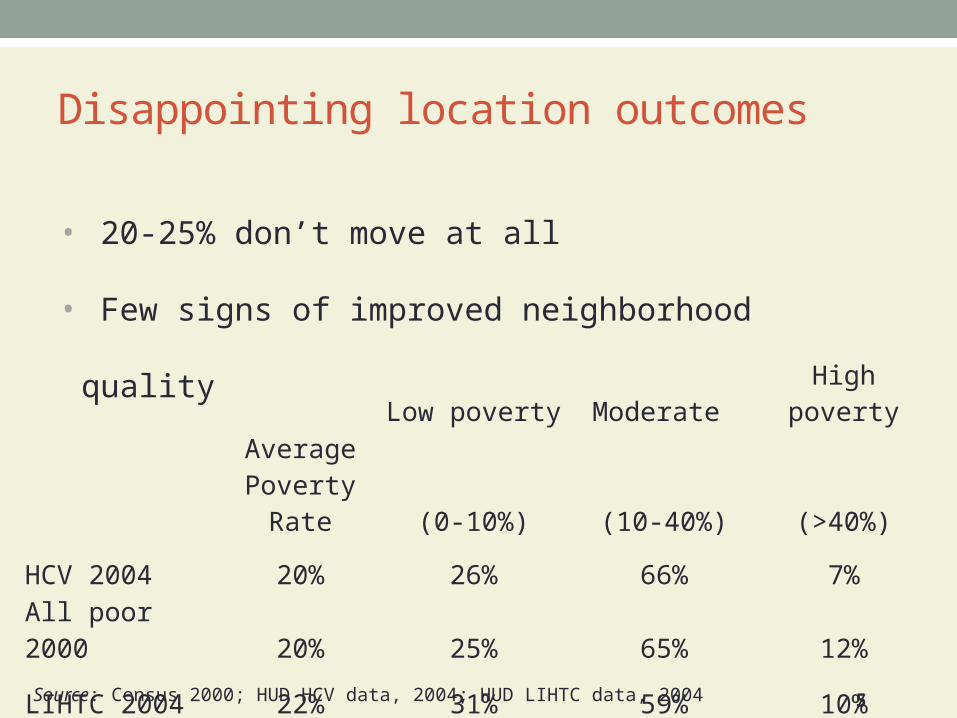
Average Poverty
Rate
Low poverty Moderate High poverty
(0-10%) (10-40%) (>40%)
HCV 2004 20% 26% 66% 7%
All poor 2000 20% 25% 65% 12%
LIHTC 2004 22% 31% 59% 10%
Disappointing location outcomes
Source: Census 2000; HUD HCV data, 2004; HUD LIHTC data, 2004
• 20-25% don’t move at all
• Few signs of improved neighborhood quality

6
Motivating questions
• What’s driving these outcomes?
• Housing market constraints alone can’t explain locations• Pendall 2000; Devine et al., 2003; Galvez, 2011
• Voucher holders find their own housing
• Why are they choosing these areas?
• Is “mobility” actually a goal?

7
Overview
Background and policy context
Methods and theoretical framework
Results
Implications for policy and research
Questions and comments

8
Methods• Tracking moves & preferences for 243 Seattle HCV holders
• Survey data matched to administrative data
• Asking:
• Move preferences on the day they received a voucher?
• Did outcomes appear to reflect day 1 preferences?
• Do some common assumptions about preferences & behavior hold?

Survey constructs
9
Basic move preference• New unit, neighborhood?• Prioritize “mobility”?

10
Understanding move preferences
• Expect voucher income to trigger a move
• Expect preferences for new neighborhoods
• Expect stronger preferences for clients in low quality areas

Survey constructs: “push/pull” factors
11
Place attachment/ dependence
Perceived alternatives
Basic move preference• New unit, neighborhood?• Prioritize “mobility”?
Neighborhood satisfaction

12
Understanding move preferences• Place attachments/Place dependence
• Relationships with place• Family/social networks
(Manzo, 2003; Fried, 2000; Charles, 2005; Dawkins, 2006; Kleit, 2007; Stokols & Schumacher, 1981; Pretty, Chipuer, & Bramston, 2003 )
• Reliance on services• Community ties

13
Understanding move preferences• Perceived constraints on options
• Housing availability• Personal finances
• LL Discrimination• Knowledge of rules
(Charles, 2005; Popkin & Cunningham, 2000)

14
Understanding move preferences
• Explains choice to remain despite “better” options w/ a voucher
• Explains choices to remain despite dissatisfaction with NH
• Are voucher holders dissatisfied with their neighborhoods?

15
Understanding move preferences
• MTO/HOPE VI does suggest neighborhood dissatisfaction
• Relocating from from highest poverty public housing
• MTO avg. poverty rate > 50% in 1990
• HOPE VI avg. > 40%
• High poverty rates expected to reflect physical distress
(Smith et al., 2002; Popkin & Cunningham, 2000; Clampet-Lundquist, 2004)
16
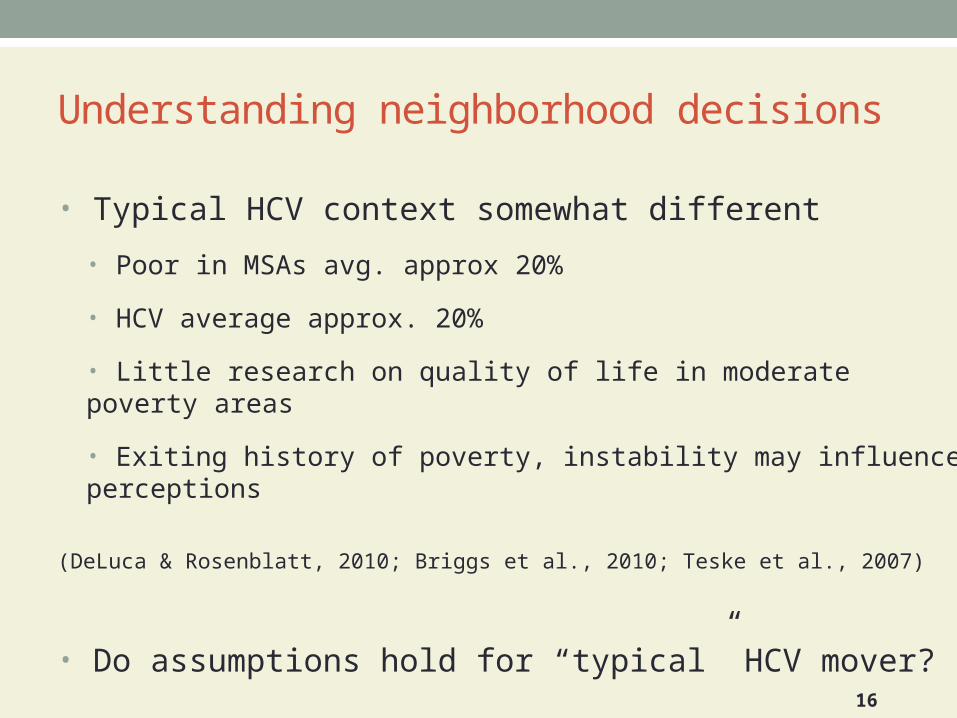
• Typical HCV context somewhat different
• Poor in MSAs avg. approx 20%
• HCV average approx. 20%
• Little research on quality of life in moderate poverty areas
• Exiting history of poverty, instability may influence perceptions
(DeLuca & Rosenblatt, 2010; Briggs et al., 2010; Teske et al., 2007)
• Do assumptions hold for “typical” HCV mover?
Understanding neighborhood decisions

Survey constructs
17
(1) Place attachment/ (2) Place dependence
• Reliance on services• Social network• Community ties
(3) Perceived alternatives• Housing availability• Personal finances• LL Discrimination• Knowledge of rules
Basic move preference• New unit, neighborhood?• Prioritize “mobility”?
(4) Neighborhood satisfaction

18
Overview
Background and policy context
Methods and theoretical framework
Results
Implications for policy and research
Questions and comments

NHousehold Head of household age 38.8 243 Female Head of household 71% 243 Children in household 47% 240 Household Size 2.1 240 ESL 12% 243Race White 39% 243 Black 51% 243 Other 11% 243 Hispanic (any race) 6% 240Education No HS/GED 24% 237 HS Degree/GED 37% 237 Some College or more 39% 237Housing Private rental 39% 241 Public housing 18% 241 Homeless 26% 241 Doubled-up/couch surfing 11% 241Neighborhood Poverty rate 18% 243
Low Opportunity 71% 243Moderate Opportunity 9% 243High Opportunity 20% 243

20
Highly mobile, but without improvements
• 73% of successful moved (60% of full sample)
• More likely to live in a low-opportunity neighborhood
• More concentrated into fewer neighborhoods
21
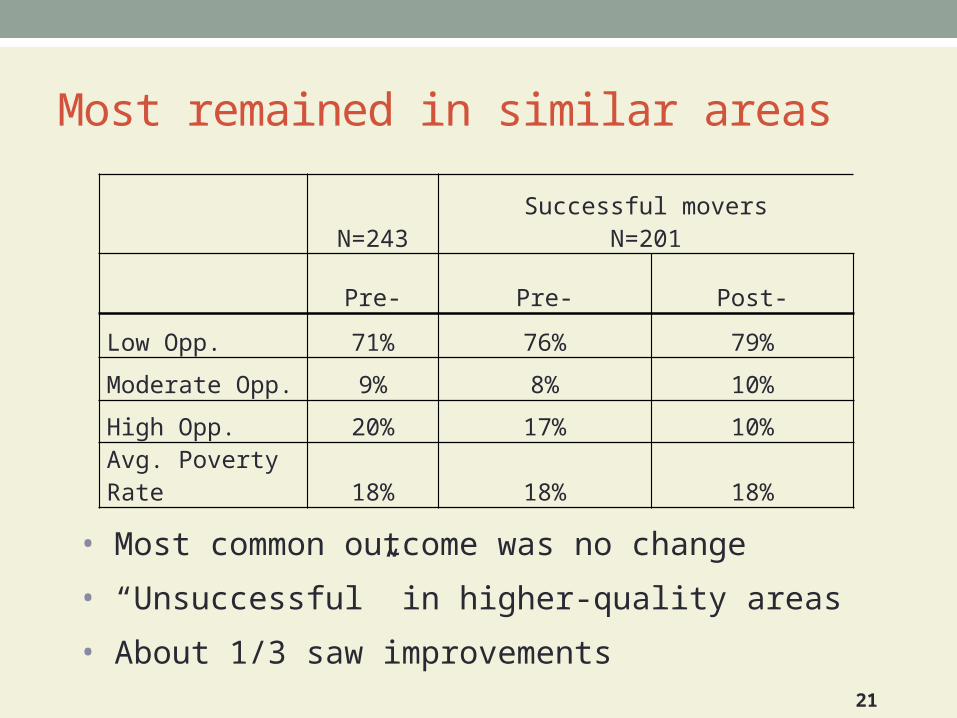
Most remained in similar areas
N=243Successful movers
N=201
Pre- Pre- Post-
Low Opp. 71% 76% 79%
Moderate Opp. 9% 8% 10%
High Opp. 20% 17% 10%
Avg. Poverty Rate 18% 18% 18%
• Most common outcome was no change
• “Unsuccessful” in higher-quality areas
• About 1/3 saw improvements

22
Moves mirrored basic preferences
Leas
e in
place
Mov
e to
a n
ew u
nit
Stay
in pr
e-pr
ogra
m N
H
Likes
NH b
ut o
pen
to m
ove
Prefe
r new
NH
"Bet
ter"
NH 0%
10%
20%
30%
40%
50%
60%
70%
80%
N=243
• 75% wanted a new unit; 57% also open to a new neighborhood
• “Mobility” not the main goal
• Actual moves mirrored basic preferences

23
Place attachments did not appear binding
Agree Neither Disagree
I know my neighbors 43% 23% 21%
Neighborhood feels like a community 50% 20% 30%
Member of a community group 14% n/a 87%
None 36%One or two 26%
Three to five 23%
More than Six 16%
How many friends/family live in your neighborhood (but not with you)?

24
No significant relationship with place attachment measures
• Social network size
• Sense of community
• Knowing neighbors
• Length of time in unit, neighborhood
Place attachments did not appear binding

25
Dependence important, but in unexpected ways
As expected:
• Service-dependent more likely to prefer to remain in pre-program housing unit & neighborhood, and do so (p<1%)
• But only 18% of full sample dependent on services
Agree Neither Disagree
I rely on services in the neighborhood 65% 17% 18%
I couldn't find services elsewhere 23% 15% 47%

26
• Housing-dependent more likely to prefer to move to new units and neighborhoods, and to do so (p.<1%)
Agree Neither Disagree
I live here mainly because it’s affordable 55% 18% 27%
Dependence important, but in unexpected ways

Agree Neither Disagree NMost NHs have housing I can afford 48% 35% 17% 243It's hard to find voucher-affordable housing 30% 52% 18% 240Landlords treat people differently based on race 31% 41% 28% 241It's hard to find landlords who accept kids 19% 49% 32% 240 I can afford to pay a rental deposit 55% n/a 45% 240I can afford application fees 53% n/a 48% 242I think my credit is good enough 57% n/a 43% 237 I understand SHA's rules 99% n/a 1% 242I understand how SHA will calculate my rent 96% n/a 4% 242SHA gives enough time to look for housing 89% 10% 2% 231I know how to look for housing 93% n/a 8% 239
Neutral to positive perceptions, as opposed to constrained
Perceptions did not appear constrained

28
• Average satisfaction score high (4.6 of 7; cronbach .72)
• Satisfaction not correlated with neighborhood quality measures
Agree Neither Disagree N=
Streets are clean 69% 14% 16% 238
Good access to transportation 90% 3% 7% 238
Safe from crime 50% 22% 28% 242
Good quality schools 63% 28% 10% 242
Good access to parks 56% 14% 30% 241
Good quality housing 63% 27% 10% 242
Overall good place to live 69% 20% 12% 239
Most were satisfied with pre-program areas

Preferences & outcomes vary by satisfaction
Preference: N
Prefers to lease in place 5.2** 45
Prefers a new unit in pre-HCV NH 5.4*** 65
Likes NH but open to moving to a new NH 4.1*** 136
Prefers a new NH 3.8*** 99Prioritized moving to a “better” NH 4.4 33
Move outcome:
Improved poverty rate 3.8*** 66
Improved access to opportunity (very low to low) 4.1** 61
All 4.6 234
**=p. <.05; ***=p.<.01

30
Results
Assumptions of move behavior appear to hold:
• Most wanted new units
• Dependent households less likely to want to move or actually move
• Neighborhood satisfaction important to preferences and outcomes

31
Results
Assumptions of move preferences do not:
• Place dependence/attachment not the norm
• Dissatisfaction not the norm
• Neighborhood quality was a poor predictor of preferences/outcomes or satisfaction
• Passive “mobility” expectations may be unrealistic

32
Overview
Background and policy context
Methods and theoretical framework
Results
Implications for policy and research
Questions and comments

33
Policy implications• Focus on households in highest poverty areas
• Direction for counseling & mobility services• Passive counseling programs may not be effective• Self-selecting, information-based services may not be effective
• More intensive counseling may be needed• Shift focus onto perceptions and expectations of neighborhoods• Longer relationship with voucher holders

34
Directions for research
• Which models work to talk about “mobility” goals?• What types of communication, information resonate?
• How do poor HHs experience & perceive neighborhoods?
• What about the income effects of vouchers? • Housing and financial stability• Decreased stress, improved mental health• Income for non-housing spending

35
Thanks
• HUD/DDRG
• Seattle Housing Authority
• Poverty & Race Research Action Council

36
Overview
Background and policy context
Methods and theoretical framework
Results
Implications for policy and research
Questions and comments

Atlanta waitlist opening 2010