why is ending hunger so hard?
TRANSCRIPT
IFPRI Policy Seminar
Why Ending Hunger is so Hard: Finding the Right Balance between Market Outcomes and
Government Interventions to Improve Food Security
February 23, 2015
C Peter TimmerCabot Professor of Development Studies, Emeritus
Harvard University, Cambridge, MA,
Non-Resident Fellow, Center for Global Development
Author
Food Security and Scarcity: Why Ending Hunger is so Hard
University of Pennsylvania Press, 2015
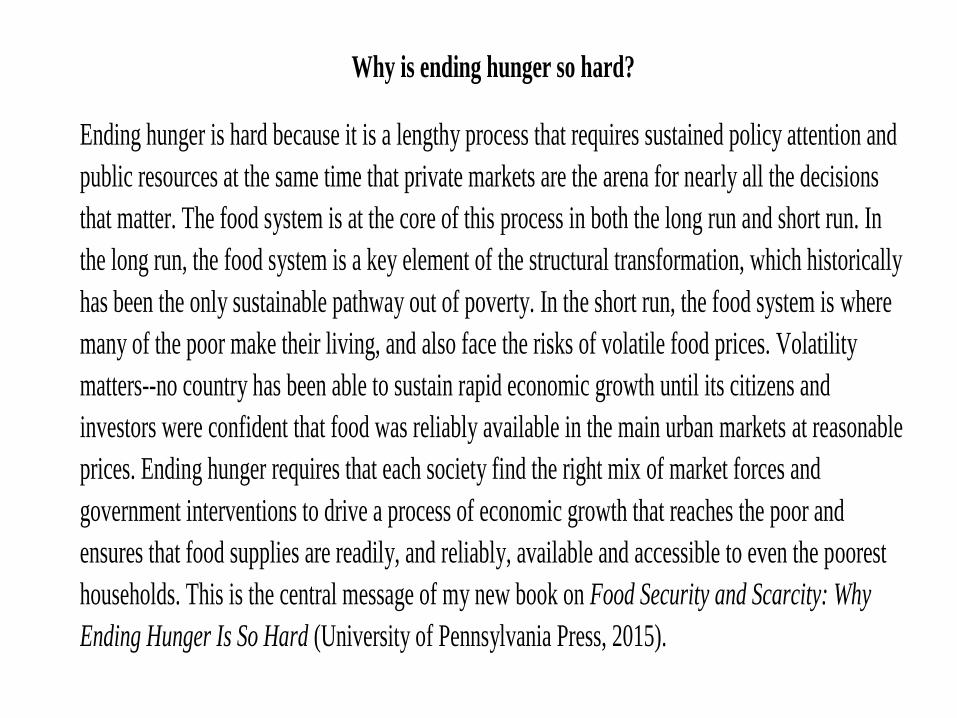
Why is ending hunger so hard?
Ending hunger is hard because it is a lengthy process that requires sustained policy attention and
public resources at the same time that private markets are the arena for nearly all the decisions
that matter. The food system is at the core of this process in both the long run and short run. In
the long run, the food system is a key element of the structural transformation, which historically
has been the only sustainable pathway out of poverty. In the short run, the food system is where
many of the poor make their living, and also face the risks of volatile food prices. Volatility
matters--no country has been able to sustain rapid economic growth until its citizens and
investors were confident that food was reliably available in the main urban markets at reasonable
prices. Ending hunger requires that each society find the right mix of market forces and
government interventions to drive a process of economic growth that reaches the poor and
ensures that food supplies are readily, and reliably, available and accessible to even the poorest
households. This is the central message of my new book on Food Security and Scarcity: Why
Ending Hunger Is So Hard (University of Pennsylvania Press, 2015).
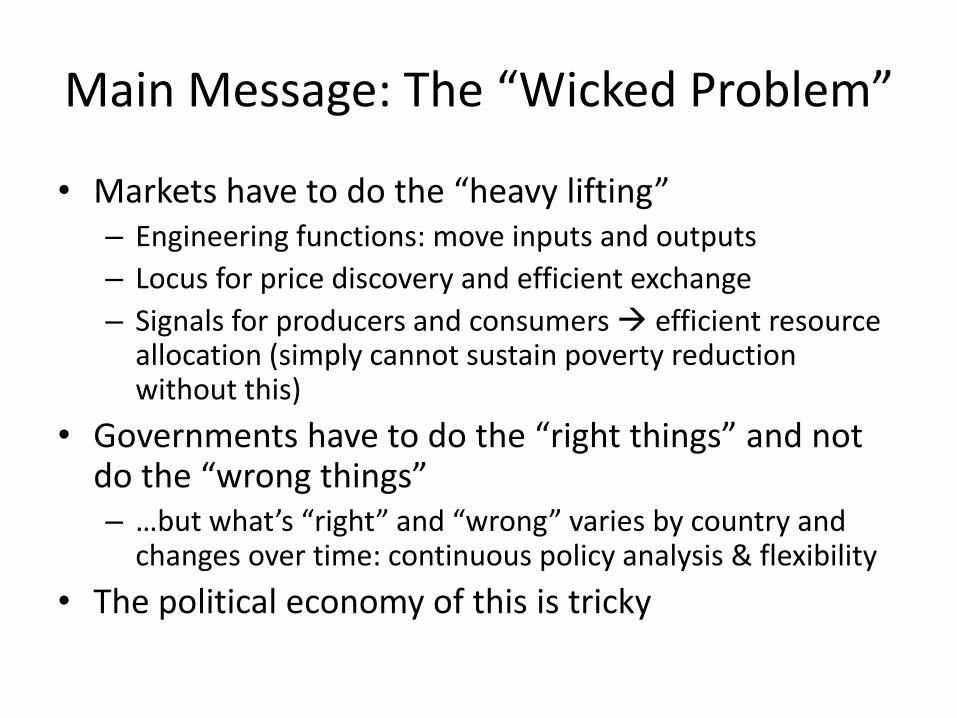
Main Message: The “Wicked Problem”
• Markets have to do the “heavy lifting”– Engineering functions: move inputs and outputs
– Locus for price discovery and efficient exchange
– Signals for producers and consumers efficient resource allocation (simply cannot sustain poverty reduction without this)
• Governments have to do the “right things” and not do the “wrong things”– …but what’s “right” and “wrong” varies by country and
changes over time: continuous policy analysis & flexibility
• The political economy of this is tricky
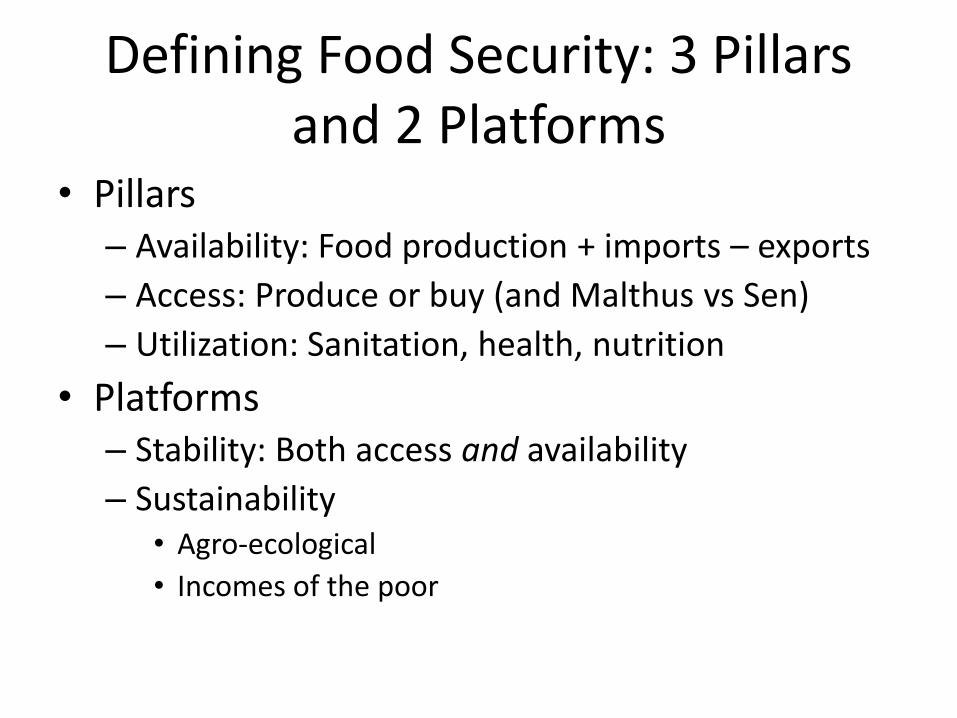
Defining Food Security: 3 Pillars and 2 Platforms
• Pillars– Availability: Food production + imports – exports
– Access: Produce or buy (and Malthus vs Sen)
– Utilization: Sanitation, health, nutrition
• Platforms– Stability: Both access and availability
– Sustainability• Agro-ecological
• Incomes of the poor

• Household level (micro: degree of undernourishment)
• National level (macro: reflected in urban markets as stable prices for staple foodstuffs)
• Global level (international market prices and the race between growth in demand and supply)
• Policy issues different from level to level
Three levels of food security
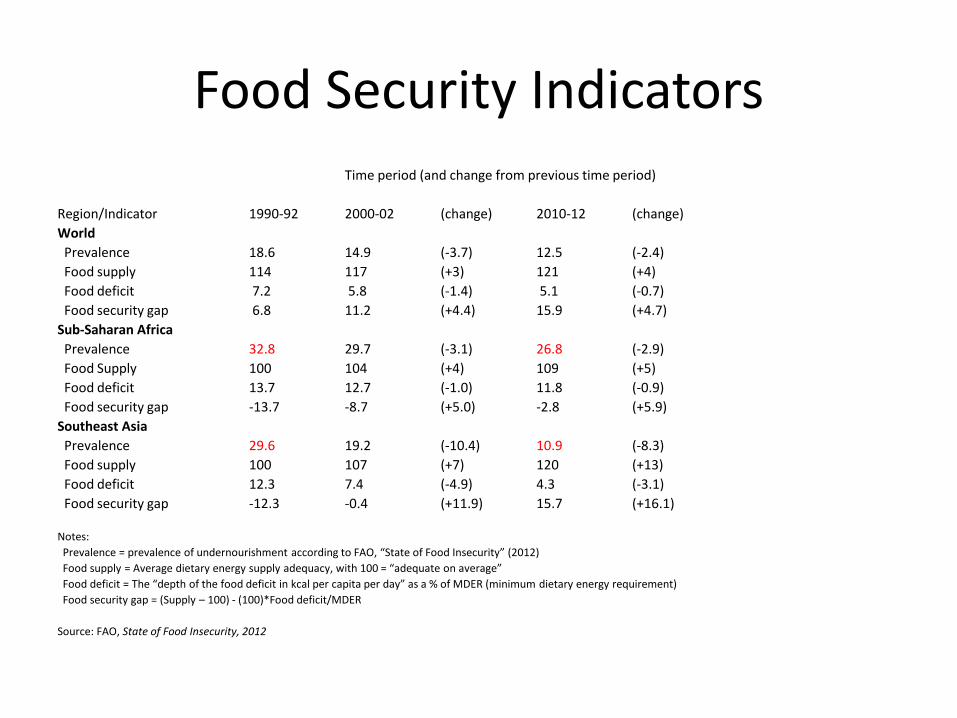
Time period (and change from previous time period)
Region/Indicator 1990-92 2000-02 (change) 2010-12 (change)
World
Prevalence 18.6 14.9 (-3.7) 12.5 (-2.4)
Food supply 114 117 (+3) 121 (+4)
Food deficit 7.2 5.8 (-1.4) 5.1 (-0.7)
Food security gap 6.8 11.2 (+4.4) 15.9 (+4.7)
Sub-Saharan Africa
Prevalence 32.8 29.7 (-3.1) 26.8 (-2.9)
Food Supply 100 104 (+4) 109 (+5)
Food deficit 13.7 12.7 (-1.0) 11.8 (-0.9)
Food security gap -13.7 -8.7 (+5.0) -2.8 (+5.9)
Southeast Asia
Prevalence 29.6 19.2 (-10.4) 10.9 (-8.3)
Food supply 100 107 (+7) 120 (+13)
Food deficit 12.3 7.4 (-4.9) 4.3 (-3.1)
Food security gap -12.3 -0.4 (+11.9) 15.7 (+16.1)
Notes:
Prevalence = prevalence of undernourishment according to FAO, “State of Food Insecurity” (2012)
Food supply = Average dietary energy supply adequacy, with 100 = “adequate on average”
Food deficit = The “depth of the food deficit in kcal per capita per day” as a % of MDER (minimum dietary energy requirement)
Food security gap = (Supply – 100) - (100)*Food deficit/MDER
Source: FAO, State of Food Insecurity, 2012
Food Security Indicators
What is driving food security? The changing global environment
• Surprisingly rapid economic growth occurred, especially in Asia, with hundreds of millions of people pulled out of poverty.
• A communications revolution at both the household and international levels has radically reduced transactions costs and increased access to knowledge.
• Global financial markets became interested in “emerging economies.”
• The rapid emergence in the 1990s of China and India as global growth engines meant a gradual shift in the drivers of demand for commodities and natural resources.
• High energy prices have turned out to be a “game changer” for agriculture and the food economy.
• Climate change is imposing itself as a reality on the increased probability of extreme weather events in general, but also on both global and localized food security outcomes in particular.
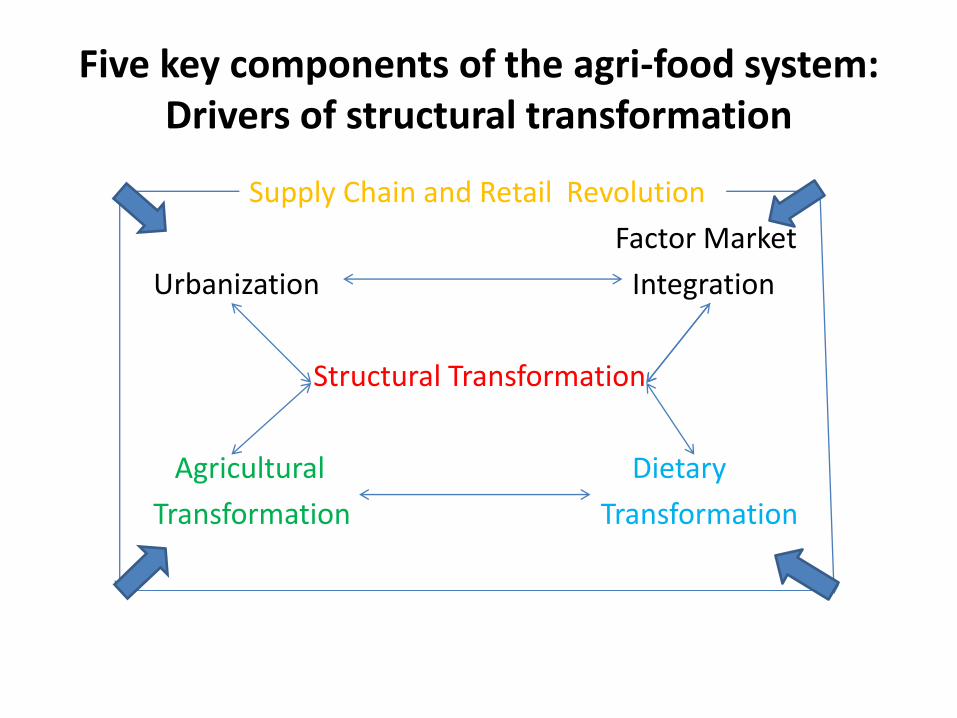
Five key components of the agri-food system: Drivers of structural transformation
Supply Chain and Retail Revolution
Factor Market
Urbanization Integration
Structural Transformation
Agricultural Dietary
Transformation Transformation
The Three Transformations
• Structural Transformation
• Agricultural Transformation
• Dietary Transformation
• …each driven by deep and basic global forces, as well as highly specific local factors
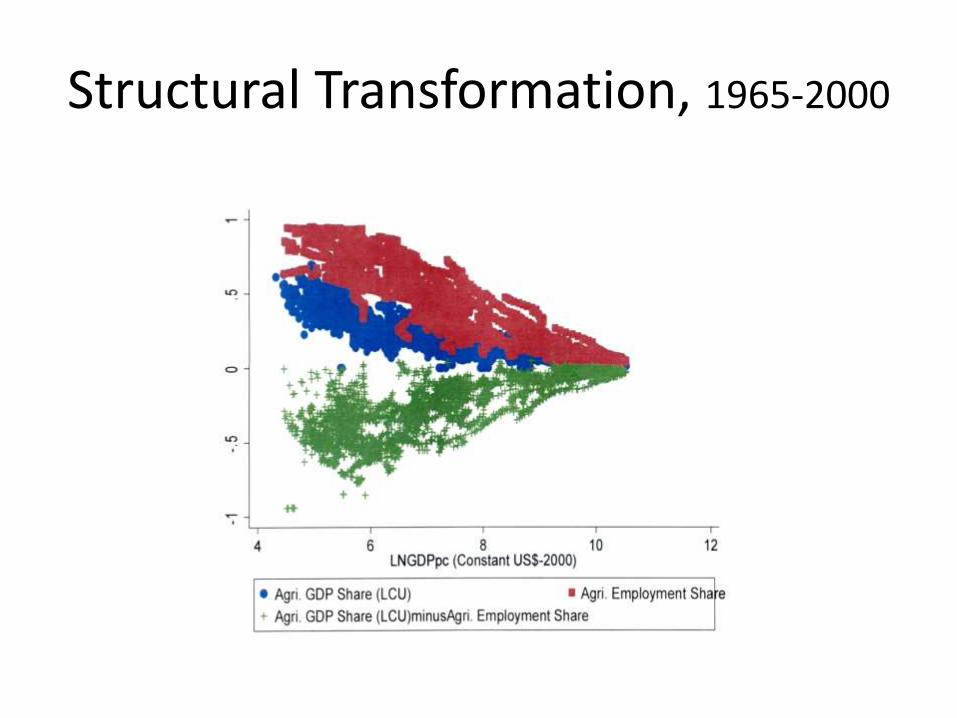
Structural Transformation, 1965-2000
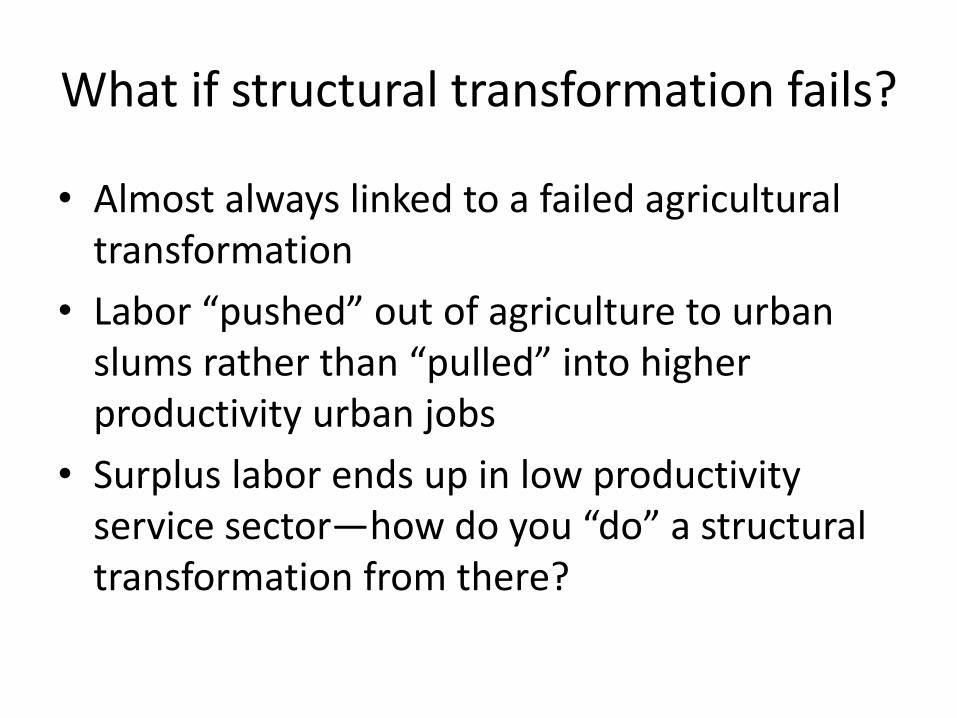
What if structural transformation fails?
• Almost always linked to a failed agricultural transformation
• Labor “pushed” out of agriculture to urban slums rather than “pulled” into higher productivity urban jobs
• Surplus labor ends up in low productivity service sector—how do you “do” a structural transformation from there?
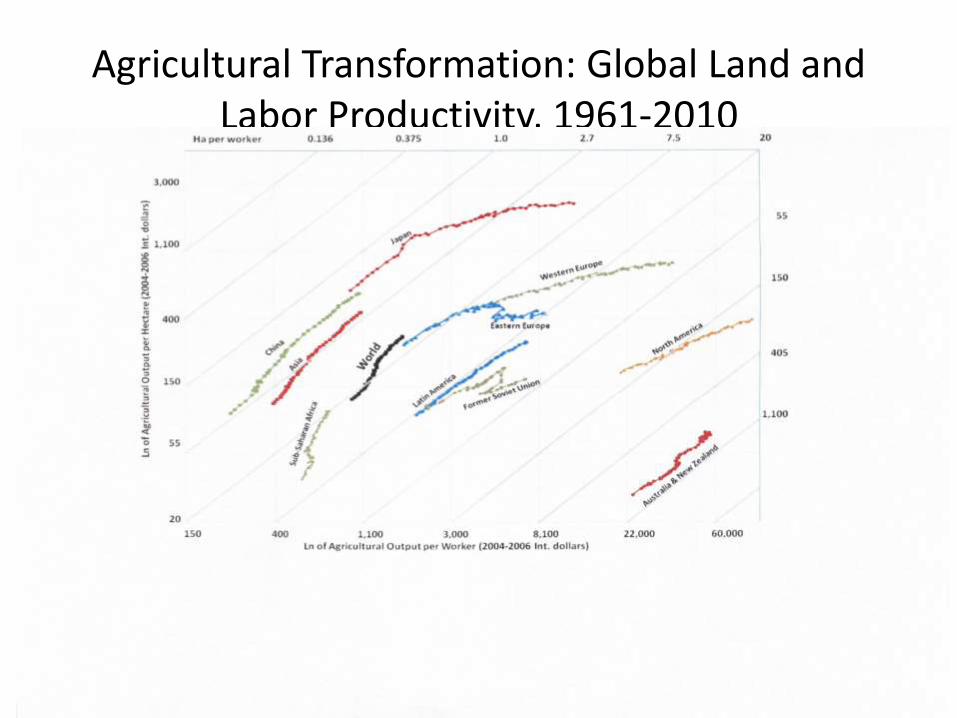
Agricultural Transformation: Global Land and Labor Productivity, 1961-2010
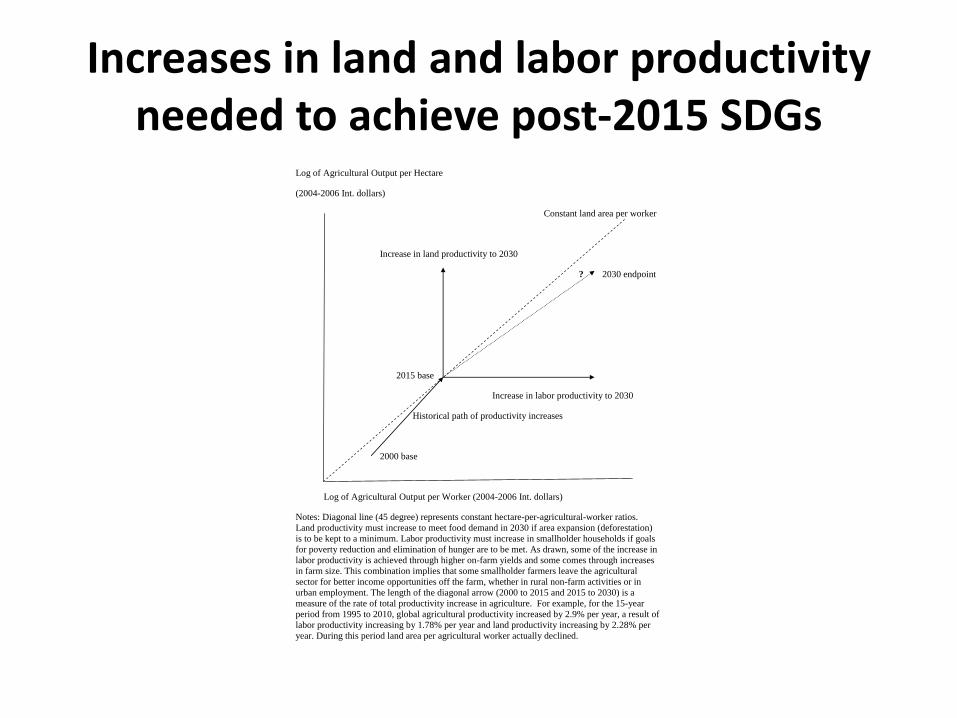
Increases in land and labor productivity needed to achieve post-2015 SDGs
Log of Agricultural Output per Hectare
(2004-2006 Int. dollars)
Constant land area per worker
Increase in land productivity to 2030
? 2030 endpoint
2015 base
Increase in labor productivity to 2030
Historical path of productivity increases
2000 base
Log of Agricultural Output per Worker (2004-2006 Int. dollars)
Notes: Diagonal line (45 degree) represents constant hectare-per-agricultural-worker ratios.
Land productivity must increase to meet food demand in 2030 if area expansion (deforestation)
is to be kept to a minimum. Labor productivity must increase in smallholder households if goals
for poverty reduction and elimination of hunger are to be met. As drawn, some of the increase in
labor productivity is achieved through higher on-farm yields and some comes through increases
in farm size. This combination implies that some smallholder farmers leave the agricultural
sector for better income opportunities off the farm, whether in rural non-farm activities or in
urban employment. The length of the diagonal arrow (2000 to 2015 and 2015 to 2030) is a
measure of the rate of total productivity increase in agriculture. For example, for the 15-year
period from 1995 to 2010, global agricultural productivity increased by 2.9% per year, a result of
labor productivity increasing by 1.78% per year and land productivity increasing by 2.28% per
year. During this period land area per agricultural worker actually declined.
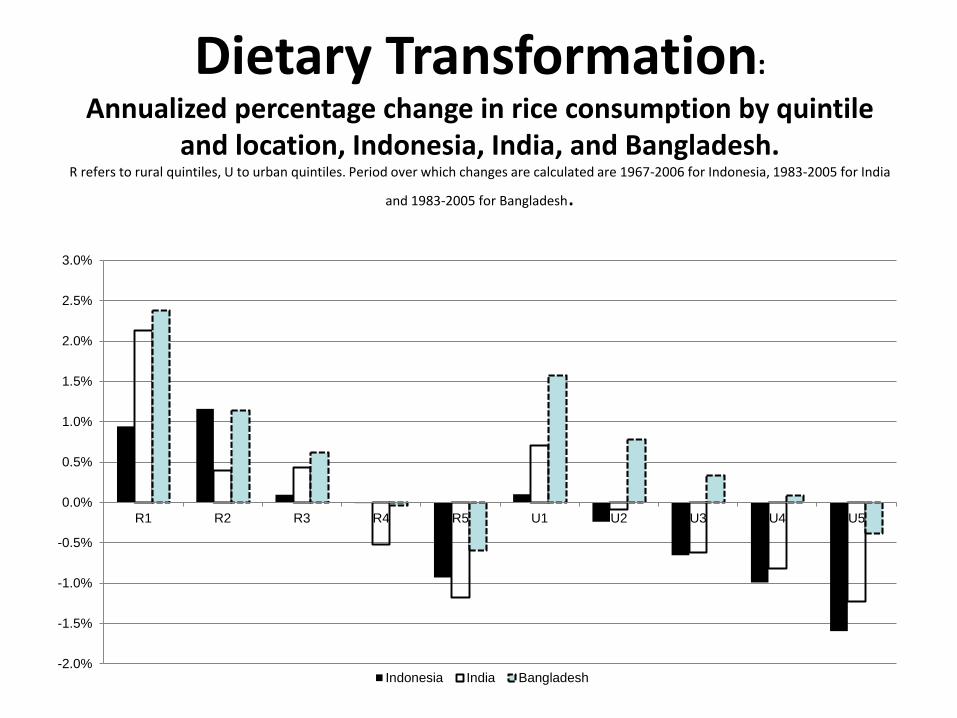
Dietary Transformation:
Annualized percentage change in rice consumption by quintile and location, Indonesia, India, and Bangladesh.
R refers to rural quintiles, U to urban quintiles. Period over which changes are calculated are 1967-2006 for Indonesia, 1983-2005 for India
and 1983-2005 for Bangladesh.
-2.0%
-1.5%
-1.0%
-0.5%
0.0%
0.5%
1.0%
1.5%
2.0%
2.5%
3.0%
R1 R2 R3 R4 R5 U1 U2 U3 U4 U5
Indonesia India Bangladesh
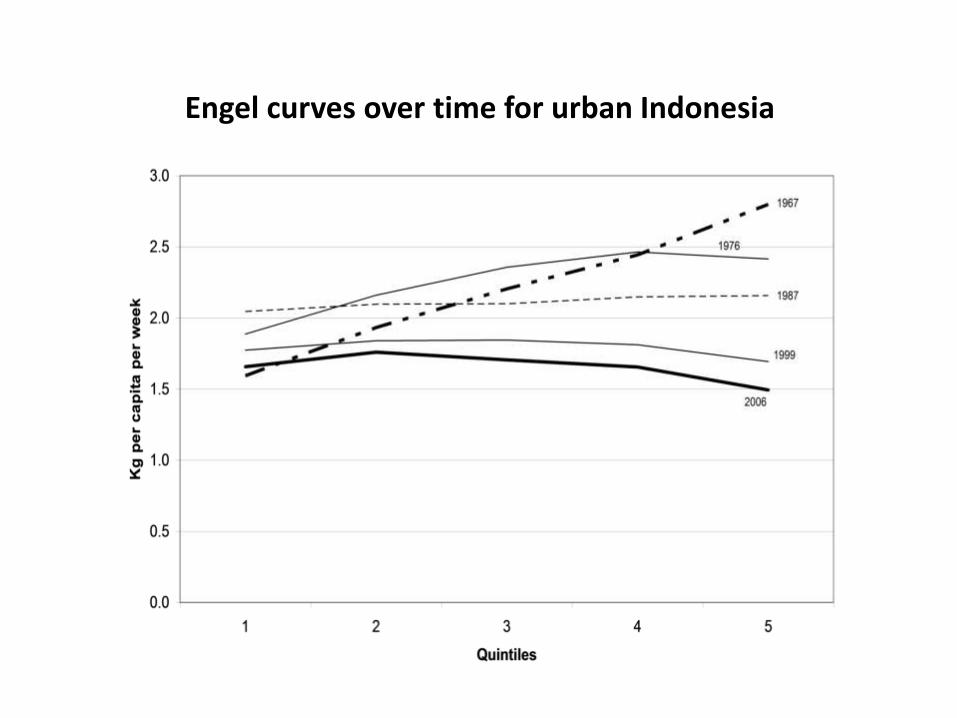
Engel curves over time for urban Indonesia
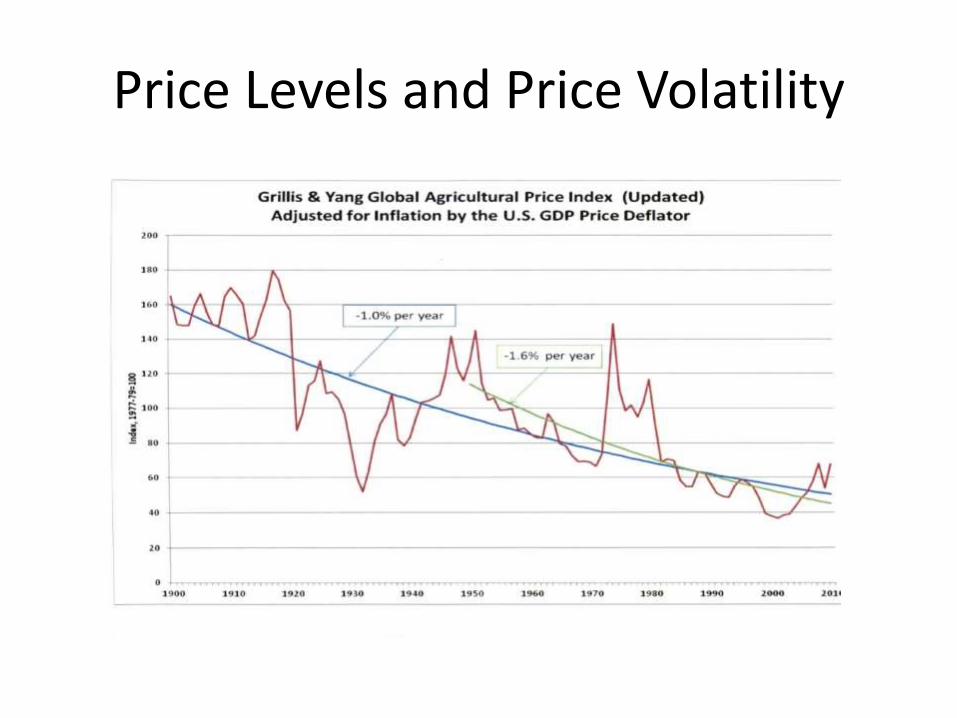
Price Levels and Price Volatility
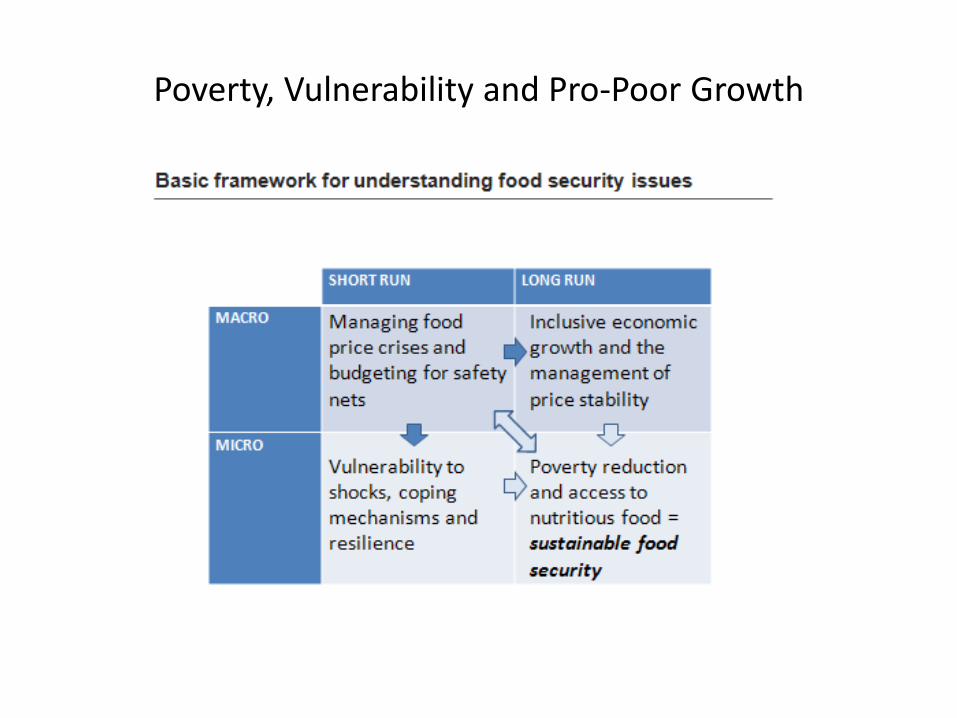
Poverty, Vulnerability and Pro-Poor Growth
• A “behavioral perspective”– Loss aversion, time inconsistency, other-regarding
preferences, herd behavior, and framing of decisions
– All of these imply serious welfare losses from food price instability
• A policy approach to food security– Micro/macro; short-run/long-run
– Volatile food prices keeps focus on wrong things
– How/where do you learn how to do this?
Political Economy of Food Security