why it matters · think of yourself as selling niceness, in much the same way you might think of...
TRANSCRIPT

Why It Matters
Just as a coin has two sides, so does amarket. A coin has heads and tails; amarket has a buying side and a selling
side. The previous chapter discussed demand,which is the buying side ofthe market. This chapterdiscusses supply, the sell-ing side.
In your life, you will beboth buyer and seller. Youwill buy many goods, andyou will also sell somegoods. You will certainlyend up selling a resource—your labor. In Chapter 4we learned about you as abuyer. In this chapter, wewill have the chance tolearn about you as a seller.
110
These personally auto-graphed guitars are beingexamined prior to an auc-tion. Before reading thischapter, can you guesshow the supply of theseguitars will affect the pricethat people will pay forthem in the auction?
05 (110-127) EMC Chap 05 11/17/05 4:51 PM Page 110

The following events occurred one dayin April.
7:04 A.M. Tara has young twin boys, Dave and Quentin.She has tried repeatedly to get both Dave and Quentin to behavebetter than they have been behaving. Yesterday she promisedthat she would take them to a movie if they behaved better.Dave ended up behaving a lot better, but Quentin behaved onlyslightly better. Right now she is asking Quentin why his behav-ior didn’t improve as much as his brother’s.• What does a concept like “elasticity of supply” have to
do with the twins?
9:10 A.M. Georgia and Tom are sitting on a trainthat is traveling from East Hampton, New York, into down-town Manhattan. Georgia is reading an article about taxesin the newspaper. It seems that the government wants toplace a tax on the production of cigarettes. For every cig-arette pack produced, the government wants cigarettemanufacturers to pay a $2 tax. Georgia tells Tom aboutthe article. “What do you think of that?” she asks. Tomresponds, “I think that tax is going to end up reducingthe supply of cigarettes.”• Will the tax reduce the supply of cigarettes?
11:03 A.M. Angie owns a small oil com-pany in Texas. She believes the price of a barrel ofcrude oil will be higher in three months than it istoday. She is thinking about not selling her currentoil supply until the oil price goes up. She knows shewill lose the interest on the oil revenue she wouldhave if she sold the oil now, but thinks that thehigher price in three months might more than com-pensate for lost interest.• Would you advise Angie to wait until later tosell her oil?
2:38 P.M. Frank and Pete are having coffeeat their local Starbuck’s. Frank owns a constructioncompany, and Pete is his business manager. Franksays, “I’m not sure how many more people will wantto work for us if we pay a higher wage. No matterhow much money we offer, people just don’t want towork in construction the way they once did.” Pete just
says, “I don’t know. Money is a powerful motivator.”• Will more people want to work in the construction
industry if Frank increases the wage rate (dollars perhour) he pays his employees?
111
05 (110-127) EMC Chap 05 11/17/05 4:51 PM Page 111
112
What Is Supply?Like the word demand, the word supply
has a specific meaning in economics. It refersto the willingness and ability of sellers to pro-duce and offer to sell different quantities of agood at different prices during a specific timeperiod. The supply of a good or servicerequires both a supplier’s willingness and abil-ity to produce and sell. Willingness to pro-duce and sell means that the person wants ordesires to produce and sell the good. Ability toproduce and sell means that the person iscapable of producing and selling the good.
Jackie is willing to buildand sell wooden chairs, but unfortunatelyshe doesn’t know how to build a chair. Inother words, she has the willingness but notthe ability. Outcome: Jackie will not supplychairs.�
What Does the Lawof Supply Say?
Suppose you are a supplier, or producer, ofTV sets, and the price of a set rises from $300to $400. Would you want to supply more or
E X A M P L E :
Chapter 5 Supply
fewer TV sets at the higher price? Most peo-ple would say more. If you did, you instinc-tively understand the law of supply, whichsays that as the price of a good increases, thequantity supplied of the good increases, andas the price of a good decreases, the quantitysupplied of the good decreases. In otherwords, price and quantity supplied move inthe same direction. This direct relationshipcan be shown in symbols:
Law of SupplyIf P ↑ then Qs ↑If P↓ then Qs↓
(where P � price and Qs � quantity supplied)
When economists use the word supply,they mean something different from whatthey mean when they use the wordsquantity supplied. Again, supply refers tothe willingness and ability of sellers toproduce and offer to sell different quanti-ties of a good at different prices. For exam-ple, a supply of new houses in the housingmarket means that firms are currently will-ing and able to produce and offer to sellnew houses.
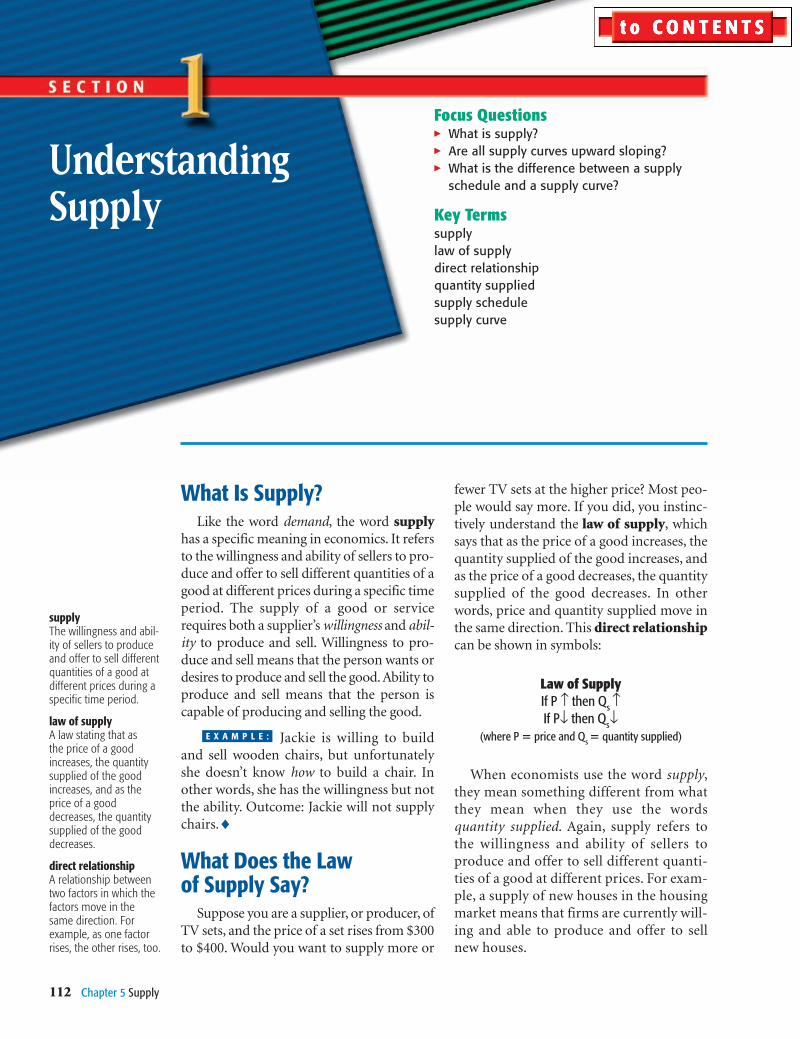
UnderstandingSupply
supplyThe willingness and abil-ity of sellers to produceand offer to sell differentquantities of a good atdifferent prices during aspecific time period.
law of supplyA law stating that asthe price of a goodincreases, the quantitysupplied of the goodincreases, and as theprice of a gooddecreases, the quantitysupplied of the gooddecreases.
direct relationshipA relationship betweentwo factors in which thefactors move in thesame direction. Forexample, as one factorrises, the other rises, too.
Focus Questions� What is supply?� Are all supply curves upward sloping?� What is the difference between a supply
schedule and a supply curve?
Key Termssupplylaw of supplydirect relationshipquantity suppliedsupply schedulesupply curve
05 (110-127) EMC Chap 05 11/17/05 4:51 PM Page 112

113Section 1 Understanding Supply
Business firms supply cars,clothes, food, computers, and
much more. The quantity of eachgood or service they supply dependson price. According to the law ofsupply, the higher the price, thegreater the quantity supplied. Inother words, the higher the price ofnotebook paper, the greater thequantity supplied of notebook paper.
Do you think the law of supplymight apply to personal, as well asbusiness, situations? Do you thinkpeople might behave differentlytoward others depending on thereactions to their emotions andbehavior? Let’s look at some exam-ples of one “product” that peoplecan supply to a greater or lesserdegree: niceness.
Wouldn’t you say that peoplecan supply different amounts ofniceness? Think about your ownbehavior: You can be very nice to aperson, moderately nice, a little
nice, or not nice at all. What deter-mines how much niceness you sup-ply to people? (In other words, whyare you nicer to some people thanto others?)
One factor that may determinehow nice you are to someone ishow much someone “pays” you tobe nice. It may be a stretch, butthink of yourself as selling niceness,
in much the same way you mightthink of yourself selling shoes, T-shirts, corn, or computers. Thequantity of each item you supplydepends on how much the buyerpays you.
If people want to buy nicenessfrom you, what kind of payment willthey offer? A person could come upto you and say, “I will pay you $100if you will be nice to me,” but usuallythings don’t work that way. People
buy, and therefore pay for, nicenessnot with the currency of dollars andcents but with the currency of nice-ness. In other words, the nicer theyare to you, the more they are payingyou to be nice to them.
Suppose a person can pay threeprices of niceness: the very-niceprice (high price), the moderatelynice price, and the little-nice price(low price). Now consider two per-sons, Caprioli and Turen. Capriolipays you the very-nice price, andTuren pays you the little-nice price.Will you be nicer to Caprioli, whopays you the higher price, or toTuren, who pays you the lower price?
If you answer that you will benicer to Caprioli, you are admittingthat you will supply a greater quan-tity of niceness to the person whopays you more to be nice. You havefound the law of supply in yourbehavior. Again, you are nicer tothose persons who pay you more(in the currency of niceness) tobe nice.
Do you think thatwhen it comes to the
quantity supplied of niceness, mostpeople behave in a manner consis-tent with the law of supply?
THINKABOUT IT
?Are You Nicer to NicePeople?
quantity suppliedThe number of units ofa good produced andoffered for sale at aspecific price.
Quantity supplied refers to the numberof units of a good produced and offered forsale at a specific price. Let’s say that a sellerwill produce and offer to sell five hamburg-ers when the price is $2 each. Five is thequantity supplied at this price. As you workyour way through this chapter, you will seewhy it is important to know the differencebetween supply and quantity supplied.
The Law of Supply inNumbers and Pictures
We can represent the law of supply innumbers, just as we did with the law ofdemand. The law of supply states that asprice rises, quantity supplied rises. Exhibit 5-1(a) shows such a relationship. As the pricegoes up from $1 to $2 to $3 to $4, the quan-tity supplied goes up from 10 to 20 to 30 to
05 (110-127) EMC Chap 05 11/17/05 4:51 PM Page 113

40. A numerical chart like this one that illus-trates the law of supply is called a supplyschedule.
We can also show the law of supply in pic-ture form by plotting the data in the supplyschedule, as in Exhibit 5-1(b). Point A is thefirst combination of price and quantity sup-
plied from the supply schedule, with a priceof $1 and a quantity supplied of 10. Point Brepresents a price of $2 and a quantity sup-plied of 20; Point C, a price of $3 and aquantity supplied of 30; and Point D, a priceof $4 and a quantity supplied of 40.Connecting points A through D creates a
114 Chapter 5 Supply
In 1992, MTV launched a pro-gram called The Real World.
Seven young people from acrossthe country came together in anapartment in New York City. In2000, CBS launched a show calledSurvivor. The show placed peopleon an island and then watched asthey tried to “outwit, outplay, andoutlast” each other for a prize of$1 million.
Both The Real World andSurvivor were reality TV shows. AfterSurvivor, it wasn’t long before televi-sion became deluged with realityshows. In other words, the supply ofreality shows increased. We willlearn in this chapter that one of thefactors that can increase supply isthe number of sellers. In otherwords, the greater the number ofsellers of a good, the larger the sup-ply of that good. The number of sell-ers does not increase for no reason;something acts as a catalyst, pushingupward the number of sellers. Thatthing is profit, which is closely tied to
success. The immense popularity ofCBS’s Survivor—as evidenced in itshigh television ratings—meant thatCBS could sell commercial time onthe show for huge sums of money,in the process earning high profits.
“Of all seven shows that
could be labeled phenome-
nal hits in the last four
years, all but one . . . have
been reality shows.”
—Bill Arter, New York Times,
May 19, 2003
Soon not only was CBS airingmore reality shows, but NBC andABC quickly came out with realityshows of their own. After all, every-one wanted to earn big profits.Over time, other reality shows hitthe air waves: For Love of Money,Fear Factor, Meet My Folks, TheRestaurant, Average Joe, ParadiseHotel, The Amazing Race, BigBrother, The Apprentice, TheBachelor, The Bachelorette, TommyLee Goes to College, and manymore. In 2004, four years after thefirst Survivor, some reality showswere earning big profits for theirnetworks. For example, a 30-secondspot on Survivor was selling for$327,000 and earning CBS anannual profit of $73 million. A
30-second spot on American Idol,considered a reality show, wasbeing sold for $414,700 and wasearning its company, Fox, $260 mil-lion in profit (for the year).
When people wonder where allthe reality TV shows are comingfrom, they are really asking, “Whatcaused the increase in the supply ofreality shows?” The answer is thatsupply increases as the number ofsellers (of a good or service)increases. So, what increases thenumber of sellers of a good or ser-vice? The answer is the chance toearn big profits. In short, money.
One lesson to belearned from the his-
tory of reality shows appearing ontelevision is that success is copied.Survivor was successful and so itwas copied. What other successfulproducts can you think of that havebeen copied?
THINKABOUT IT
???Why All theReality TV
Shows?
supply scheduleA numerical chart illus-trating the law of supply.
supply curveA graph that shows theamount of a good sellersare willing and able tosell at various prices.
05 (110-127) EMC Chap 05 11/17/05 4:51 PM Page 114

supply curve, a line that slopes upward(from left to right) and shows the amount ofa good sellers are willing and able to sell atvarious prices. The upward-sloping supplycurve in Exhibit 5-1(b) is the graphic repre-sentation of the law of supply.
A Vertical Supply CurveThe law of supply, which holds that as
price rises, quantity supplied rises, does nothold true for all goods; nor does it hold trueover all time periods. First, it does not holdfor goods that cannot be produced anylonger, such as Stradivarius violins. Theseviolins were made by Antonio Stradivarimore than 250 years ago. It is impossible foran additional Stradivarius violin to be pro-duced today, because Stradivari died in1737. No matter how high the price goes, thequantity supplied cannot increase to morethan the total number of Stradivarius violinsthat currently exist. Thus, the supply curveof Stradivarius violins is not upward slopingbut vertical, straight up and down, as shownin Exhibit 5-2(a).
In another example, a theater in St. Louisis sold out for tonight’s play. Increasingticket prices from $40 to $50 would not cre-ate additional seats tonight, because timedoes not allow enlarging the theater to addmore seats. For tonight’s performance, thesupply curve of theater seats is vertical, asillustrated in Exhibit 5-2(b).
A Firm’s Supply Curve and aMarket Supply Curve
Most of the goods supplied in the UnitedStates are supplied by business firms. Forexample, computers are supplied by Dell,Hewlett-Packard, and so on. A firm’s supplycurve is different from a market supplycurve. A firm’s supply curve is what itsounds like: it is the supply curve for a par-ticular firm. A market supply curve is thesum of all firms’ supply curves.
115Section 1 Understanding Supply
EX H I B IT 5-1 Supply Schedule and Supply Curve
Price (dollars)
Quantity supplied
(units)
$1234
10203040
(a)
(b)
$4
$3
$2
$1
10 20 30 40
Pric
e (d
olla
rs)
Quantity supplied (units)
A
B
C
D
Supplycurve
0
Supply Curves When No More Can Ever Be Producedor There Is No Time to Produce More
EX H I B IT 5-2
Supply curveof Stradivariusof Stradivariusviolins
Supply curveSupply curveof theater seats forseats fortonight’sperformanceperformance
� (a) A supplyschedule for a good.Notice that as priceincreases, quantitysupplied increases.(b) Plotting the fourcombinations ofprice and quantitysupplied from part(a), and connectingthe points, yields asupply curve.
� When additionalunits cannot be pro-duced or there is notime to producemore, the supplycurve is vertical.
05 (110-127) EMC Chap 05 5/8/06 4:51 PM Page 115
116 Chapter 5 Supply
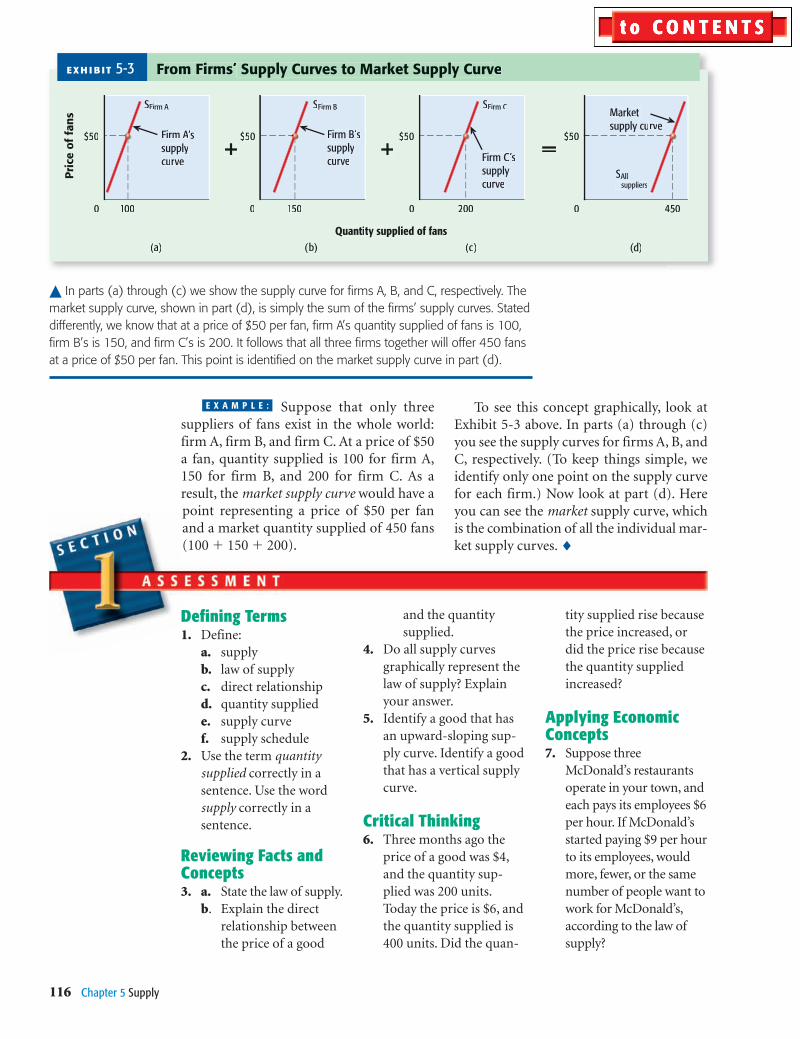
Suppose that only threesuppliers of fans exist in the whole world:firm A, firm B, and firm C. At a price of $50a fan, quantity supplied is 100 for firm A,150 for firm B, and 200 for firm C. As aresult, the market supply curve would have apoint representing a price of $50 per fanand a market quantity supplied of 450 fans(100 � 150 � 200).
E X A M P L E :
Defining Terms 1. Define:
a. supplyb. law of supplyc. direct relationshipd. quantity supplied e. supply curve f. supply schedule
2. Use the term quantitysupplied correctly in asentence. Use the wordsupply correctly in asentence.
Reviewing Facts andConcepts 3. a. State the law of supply.
b. Explain the directrelationship betweenthe price of a good
and the quantitysupplied.
4. Do all supply curvesgraphically represent thelaw of supply? Explainyour answer.
5. Identify a good that hasan upward-sloping sup-ply curve. Identify a goodthat has a vertical supplycurve.
Critical Thinking6. Three months ago the
price of a good was $4,and the quantity sup-plied was 200 units.Today the price is $6, andthe quantity supplied is400 units. Did the quan-
tity supplied rise becausethe price increased, ordid the price rise becausethe quantity suppliedincreased?
Applying EconomicConcepts7. Suppose three
McDonald’s restaurantsoperate in your town, andeach pays its employees $6per hour. If McDonald’sstarted paying $9 per hourto its employees, wouldmore, fewer, or the samenumber of people want towork for McDonald’s,according to the law ofsupply?
(a)
0 100
(b)
0 150 0 450
(c)
0 200
+ + =
Market supply curve
SFirm A SFirm B SFirm C
SAll suppliers
Firm B’ssupply curve Firm C’s
supply curve
Firm A’AA ssupply curve
From Firms’ Supply Curves to Market Supply CurveEX H I B IT 5-3
$50$50$50$50
(d)
Pric
e of
fan
s
Quantity supplied of fans
To see this concept graphically, look atExhibit 5-3 above. In parts (a) through (c)you see the supply curves for firms A, B, andC, respectively. (To keep things simple, weidentify only one point on the supply curvefor each firm.) Now look at part (d). Hereyou can see the market supply curve, whichis the combination of all the individual mar-ket supply curves. �
� In parts (a) through (c) we show the supply curve for firms A, B, and C, respectively. Themarket supply curve, shown in part (d), is simply the sum of the firms’ supply curves. Stateddifferently, we know that at a price of $50 per fan, firm A’s quantity supplied of fans is 100,firm B’s is 150, and firm C’s is 200. It follows that all three firms together will offer 450 fansat a price of $50 per fan. This point is identified on the market supply curve in part (d).
05 (110-127) EMC Chap 05 11/17/05 4:51 PM Page 116

When Supply Changes,the Curve Shifts
Supply can go up, and it can go down. Forexample, the supply of computers can rise orfall. Every time the supply of a good changes,the supply curve for that good “shifts.” Byshift we mean that it moves; it moves eitherto the right or to the left.
Change in supply → Shift in supply curve
For example, if the supply of computersincreases, the computer supply curve shiftsto the right. If the supply of computersdecreases, the supply curve shifts to the left.We can understand shifts in supply curvesbetter with the help of Exhibit 5-4.
Look at the curve labeled S1 in Exhibit 5-4.Suppose this supply curve represents theoriginal (and current) supply of computers.Notice that the quantity supplied at a priceof $1,000 is 4,000 computers. Now supposethe supply of computers increases. Forwhatever reason, people want more com-puters. This increase in supply is shown by
117Section 2 The Supply Curve Shifts
The Supply Curve Shifts
Focus Questions� What does it mean when a supply curve
shifts to the right?� What does it mean when a supply curve
shifts to the left?� What factors can change supply?� What factor can change quantity
supplied?
Key Termstechnologyadvancement in
technologyper-unit costsubsidy
quotaelasticity of supplyelastic supplyinelastic supply
the demand curve S1 shifting to the rightand becoming S2.
What does it mean for a supply curve toshift rightward? The answer is easy if you
Shifts in a Supply CurveEX H I B IT 5-4
$1,000
0 3,000 4,000 5,000 6,0002,0001,000
S3 S1 S2
C A B
Originalsupply curve
Quantity supplied of computers
Pric
e (d
olla
rs)
� Moving from S1 (the original supply curve) to S2 represents a right-ward shift in the supply curve. Supply has increased. Moving from S1 toS3 represents a leftward shift in the supply curve. Supply has decreased.
05 (110-127) EMC Chap 05 11/17/05 4:51 PM Page 117

118 Chapter 5 Supply
again look at Exhibit 5-4 and focus on thehorizontal axis and the numbers on it, alongthe bottom of the graph. What is the quan-tity supplied on curve S2 at the price of$1,000? The answer is 6,000 computers. Inother words, an increase in supply (or a shiftrightward in the supply curve) is the samething as saying, “Sellers want to sell more of a good at each and every price.” In our
example, sellers want to sell more computersat $1,000.
How would we graphically represent adecrease in supply? In Exhibit 5-4, again let’ssuppose that S1 is our original (and current)supply curve. A decrease in supply is repre-sented as a shift leftward in the supply curvefrom S1 to S3. This decrease in supply meansthat sellers want to sell less of the good at
It is important to distinguishbetween increasing the supply
of a good that has existed for sometime (increasing the supply of corn,paper, or shoes) and creating thesupply of a good that has neverexisted before. Many goods that wehave today—digital video recorders(first introduced by TiVo), podcasts,and blogs, for example—weren’tavailable to us in the past. Wheredid these goods and the ideas forthem come from?
Two answers come to mind:new technology and entrepreneur-ship. To illustrate how these twofactors sometimes work together,consider a blog. A blog, or weblog,is a personal Web site with a datedlog (diary-like) format that containscommentary and links to other Websites. Only about 30 blogs existed atthe beginning of 1999. Today, youcan find millions. The first blogswere hand-coded by Web develop-ers who taught themselves HTML (amarkup language designed to create
Web pages). Then, programmerscreated new software programs (atechnological development), andentrepreneurs responded to theunfulfilled demand for postingitems on the Web, leading to thevast supply of blogs today. Nowanyone can go to Blogger atwww.blogger.com/start and createa blog within minutes.
No digital video recorder (some-times called a personal videorecorder) could exist before thesoftware had been developed toprovide programming informationand encode data streams. The DVRis a new product brought to usthrough an advancement in technol-ogy, and by the entrepreneurs whosaw that the television publicwanted more control over theirpersonal television viewing.
Podcasting, which deliversrecorded audio programs throughthe Internet to iPods or otherportable music players, would notexist without the software thatmakes it easy to beam a podcastfrom a home computer to someonewho has signed up to receive it. Itwould also not exist without theentrepreneurs who saw an unful-filled demand on the part of con-sumers for more choices and greatercontrol over their entertainment.
New technology and entrepre-neurship—the combination thattoday gives us many of our newproducts—are the catalysts behindthe supply of new products.
Do you think the tech-nology exists today to
develop new products that aren’tbeing developed because entrepre-neurs think no one would buythem? What might these new prod-ucts (that could be developed butaren’t being developed) do? Willthey brush your teeth for you? Willthey make your bed for you? If youwere an entrepreneur, what newproducts would you supply?
THINKABOUT IT
Where Do TiVo,Podcasts, and
Blogs Come From???????????????????
05 (110-127) EMC Chap 05 11/17/05 4:51 PM Page 118

each and every price. Specifically, if we lookat the price $1,000, we see that sellers whoonce wanted to sell 4,000 computers nowwant to sell 2,000 computers.
Supply increases → Supply curve shifts rightwardSupply decreases → Supply curve shifts leftward
What Factors Cause SupplyCurves to Shift?
Supply curves do not shift to the right orleft without cause. They shift because ofchanges in several factors. These factorsinclude a change in resource prices, tech-nology, taxes, subsidies, quotas, number ofsellers, future price, and weather.
Resource PricesChapter 1 identified four resources, or
factors of production: land, labor, capital,and entrepreneurship. For now, concentrateon land, labor, and capital. These resourcesare used to produce goods and services.
When resource prices fall, sellers are will-ing and able to produce and offer to sellmore of the good (the supply curve shifts tothe right). The reason is that it is cheaper toproduce the good. When resource pricesrise, in contrast, sellers are willing and ableto produce and offer to sell less of the good(the supply curve shifts to the left); it is moreexpensive to produce the good.
Suppose the cost of laborrises for employees working for a car manu-facturer, while everything else remains thesame. Wage rates rise from, say, $20 an hourto $22 an hour. As a result, the car manufac-turer will produce and offer to sell fewercars; the supply curve shifts leftward. �
TechnologyTechnology is the skills and knowledge
used in production. For example, the tech-nology of farming today is much differentfrom 200 years ago. Today, unlike 200 yearsago, tractors, pesticides, and special fertiliz-ers are used in farming.
An advancement in technology is theability to produce more output with a fixed
E X A M P L E :
119Section 2 The Supply Curve Shifts
In 1921, a seller sold something to a buyer for $100. In 2005, a seller soldsomething to a buyer for $100. Were the two sales, in 1921 and 2005,
equivalent? Not at all, because a dollar was worth more in 1921 than in2005. In fact, a $100 purchase in 1921 was the equivalent of a $1,079.89purchase in 2005. In other words, buying something for $100 in 1921 wasthe same as buying something for $1,079.89 in 2005. To find out what anydollar purchase in the past is equivalent to today, go to the Bureau of LaborStatistics inflation calculator at www.emcp.net/inflation. Here we list the2005 dollar equivalent of several purchases made in 1961. For example,a person who paid $15 for dinner when going out to eat in 1961 would pay$96.22 for an equivalent dinner in 2005.
Good/service 1961 price 2005 equivalent
Dinner $ 15 $ 96.22
Book 4 25.66
Haircut 3 19.24
Car 3,000 19,244.15
Furniture 500 3,207.36
Hammer 2 12.83
Attorney services 200 1,282.94
technologyThe body of skills andknowledge concerningthe use of resources inproduction.
advancement intechnologyThe ability to producemore output with a fixedamount of resources.
per-unit costThe average cost of agood. For example, if$400,000 is spent to pro-duce 100 cars, the aver-age, or per-unit, cost is$4,000.
amount of resources. Again, consider farm-ing. With the use of fertilizers and pesti-cides, farmers today can produce muchmore output on an acre ofland than they could manyyears ago. This advancementin technology, in turn, low-ers the per-unit cost, oraverage cost, of production for farmers.Farmers respond to lower per-unit costs bybeing willing and able to produce and offerto sell more output. In other words, the sup-ply curve shifts to the right.
TaxesSome taxes increase the per-unit costs.
Suppose a shoe manufacturer must pay a $2tax for each pair of shoes it produces. This“extra cost” of doing business causes themanufacturer to supply less output. (It issimilar to the price of a resource rising andthus making it more expensive and less prof-itable for the producer to manufacture thegood. As a result, the producer produces lessoutput.) The supply curve shifts to the left. Ifthe tax is eliminated, the supply curve willshift rightward to its original position.
“What is wrong with our world
is that love is in short supply.”
—Anonymous
05 (110-127) EMC Chap 05 11/17/05 4:51 PM Page 119

SubsidiesSubsidies have the opposite effect of
taxes. A subsidy is a financial paymentmade by government for certain actions.Suppose the government subsidizes theproduction of corn by paying corn farmers$2 for every bushel of corn they produce.Farmers will then want to produce morecorn at every price, which means the sup-ply curve of corn shifts rightward. Removalof the subsidy causes the supply curve toshift to the left, back to its position prior tothe subsidy.
QuotasQuotas are restrictions on the number of
units of a foreign-produced good (import)that can enter a country. For example, sup-pose Japanese producers are currently send-ing, and want to continue to send, 100,000cars to the United States each year. Now sup-pose the U.S. government imposes a quotaon Japanese cars at 80,000 a year. This quotameans that no more than 80,000 Japanesecars can be imported into the United States.
120 Chapter 5 Supply
A quota decreases supply, so the supplycurve shifts to the left. The elimination of aquota causes the supply curve to shift right-ward to its original position.
Number of SellersIf more sellers begin producing a particu-
lar good, perhaps because of high profits,supply increases and the supply curve shiftsto the right. If some sellers stop producing aparticular good, perhaps because of losses,the supply curve shifts to the left.
Future PriceSellers who expect the price of a good to
be higher in the future may hold back thegood now and supply the good to the mar-ket in the future. Sellers who expect the priceof a good to be lower in the future may wantto supply the good now instead of later.
Ricky is thinking of sellinghis house. He just heard that the price ofhouses is expected to rise three months fromtoday. Instead of offering to sell his housetoday, he waits until three months later. Whydid he wait? Ricky believed the future priceof a house would be higher than the currentprice of a house. Notice that we are talkingabout a nonperishable good here (houses).In other words, waiting a few months, oreven a year, to sell a house doesn’t lead to achange in the quality of a house.
A different type of a good is a perishablegood, such as eggs. If the egg seller believesthat the future price will be higher than thecurrent price of eggs, he may want to holdhis eggs off the market today and sell themlater. He can’t really do that, though, becauseeggs spoil if kept too long. �
Weather (in Some Cases)Weather can affect the supply of a good.
Bad weather reduces the supply of manyagricultural goods, such as corn, wheat, andbarley. Unusually good weather can increasethe supply. Weather can also impact the sup-ply of non-agricultural products, as happenswhen hurricanes damage fishing boats, ship-ping docks, and coastal oil refineries.
E X A M P L E :
subsidyA financial paymentmade by government forcertain actions.
quotaA legal limit on the num-ber of units of a foreign-produced good (import)that can enter a country.
Suppose you are an oil producerand you want to know theprice of oil today and the
expected (future) price of oil. Wherewould you look to find the current and future price of oil?To find the current price, you might go to www.emcp.net/oil. Here you will see the current (or sometimes called spot)price for oil, such as Nymex Crude. On the day we checked,the price was $51.25 a barrel. If you want to check thefuture price of oil, go to www.emcp.net/oil_futures or sim-ply click on “Commodity Futures” in the left margin ofyour first screen (the screen that shows the current price ofcrude oil). On the day we checked, the (expected) futureprice of crude oil was $51.35. Notice that the differencebetween the current price ($51.25) and the future price($51.35) is only 10 cents, which means that oil producersdon’t have much incentive (if any at all) to shift oil fromcurrent supply to future supply.
05 (110-127) EMC Chap 05 11/17/05 4:51 PM Page 120
What Factor Causes aChange in QuantitySupplied?
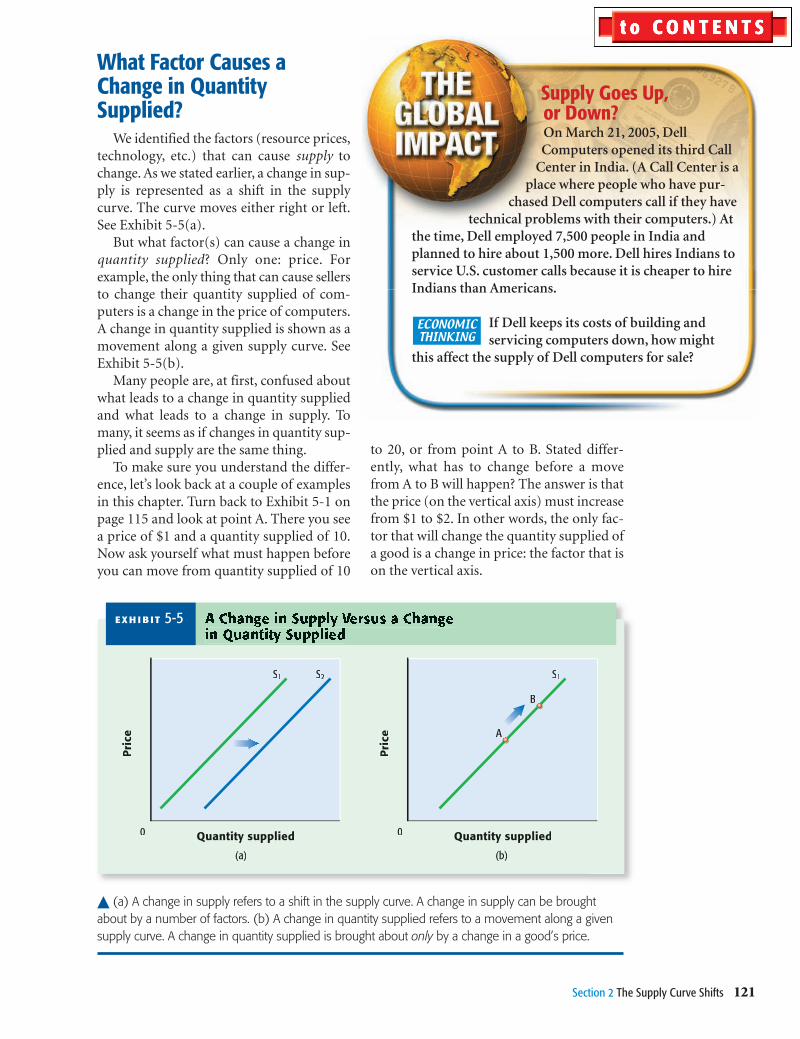
We identified the factors (resource prices,technology, etc.) that can cause supply tochange. As we stated earlier, a change in sup-ply is represented as a shift in the supplycurve. The curve moves either right or left.See Exhibit 5-5(a).
But what factor(s) can cause a change inquantity supplied? Only one: price. Forexample, the only thing that can cause sellersto change their quantity supplied of com-puters is a change in the price of computers.A change in quantity supplied is shown as amovement along a given supply curve. SeeExhibit 5-5(b).
Many people are, at first, confused aboutwhat leads to a change in quantity suppliedand what leads to a change in supply. Tomany, it seems as if changes in quantity sup-plied and supply are the same thing.
To make sure you understand the differ-ence, let’s look back at a couple of examplesin this chapter. Turn back to Exhibit 5-1 onpage 115 and look at point A. There you seea price of $1 and a quantity supplied of 10.Now ask yourself what must happen beforeyou can move from quantity supplied of 10
121Section 2 The Supply Curve Shifts
EX H I B IT 5-5 A Change in Supply Versus a Changein Quantity Supplied
0
(b)
A
B
Quantity supplied0
(a)
S1 S2 S1
Quantity supplied
Pri
ce
Pri
ce
Supply Goes Up, or Down?On March 21, 2005, DellComputers opened its third Call
Center in India. (A Call Center is aplace where people who have pur-
chased Dell computers call if they havetechnical problems with their computers.) At
the time, Dell employed 7,500 people in India andplanned to hire about 1,500 more. Dell hires Indians toservice U.S. customer calls because it is cheaper to hireIndians than Americans.
If Dell keeps its costs of building and servicing computers down, how might
this affect the supply of Dell computers for sale?
ECONOMICTHINKING
� (a) A change in supply refers to a shift in the supply curve. A change in supply can be broughtabout by a number of factors. (b) A change in quantity supplied refers to a movement along a givensupply curve. A change in quantity supplied is brought about only by a change in a good’s price.
to 20, or from point A to B. Stated differ-ently, what has to change before a movefrom A to B will happen? The answer is thatthe price (on the vertical axis) must increasefrom $1 to $2. In other words, the only fac-tor that will change the quantity supplied ofa good is a change in price: the factor that ison the vertical axis.
05 (110-127) EMC Chap 05 11/17/05 4:51 PM Page 121

122 Chapter 5 Supply
Now let’s move over to Exhibit 5-4 onpage 117. Take a look at S1. Ask yourselfwhat has to happen before S1 shifts to itsright and becomes S2. Does price (on thevertical axis) have to change? No, as you cansee in the exhibit, we never change pricefrom $1,000. So, then, you know that achange in a good’s actual price isn’t what willshift a supply curve. What then does shift a
supply curve? The answer is a change inresource prices, technology, taxes, and so on.
Elasticity of SupplyChapter 4 discussed elasticity of demand,
which deals with the relationship betweenprice and quantity demanded. Elasticity ofsupply is the relationship between the per-
elasticity of supplyThe relationshipbetween the percentagechange in quantity sup-plied and the percentagechange in price.
Usually, when we talk aboutsupply, we mean the supply
of goods and services. But can anadvancement in technologyincrease the supply of people? Oneway to increase the supply of peo-ple in the world is to increase thelength of life. For example, if peoplestart living an average of 100 yearsinstead of 70 years, it means morepeople in the world.
Michael Rose, a biologist whostudies the aging process, found away to increase the average life spanof a fruit fly. The average fruit fly livesfor about 70 days, but Rose’s fruitflies live for 140 days. If Rose andother like-minded scientists can dofor human beings what they havedone for fruit flies, then people inthe future may live longer lives.According to some scientists workingin the area of aging, ages of 100 or150 years are not unreasonable.
Now suppose that scientists didfigure out how to slow the agingprocess in humans, and peoplebegan to live longer. Also supposethat as a result of slowing the agingprocess, an average 80-year-old inthe future felt the same way anaverage 50-year-old feels today.What economic effects would thischange have?
First, longer-living people wouldprobably work for more years thanwe do today. People today oftenstart full-time work when they are22 years old and retire at about 65,a work life of 43 years. In the future,they may start work at 22 and retireat 85, a work life of 63years.
People areresources, andresources are used toproduce goods andservices. More peopleworking would meanmore goods and serv-ices. In other words,the current researchon aging, if successful,would lead to a greatersupply of goods andservices in the world.
Some people believethat the world has only
a finite number of jobs, and so withmore people—and the same num-ber of jobs—many more people willbe unemployed in the future if peo-ple live to be 100. The problemwith this way of thinking, though, isthat in 2005, the population of theUnited States was greater than itwas in 1982, but the unemploy-ment rate in 1982 was higher thanthe unemployment rate in 2005. Do you think these numbers areevidence that there “are not a finitenumber of jobs in the world”?
THINKABOUT IT ?Will You
Live to Be 100?
05 (110-127) EMC Chap 05 11/17/05 4:52 PM Page 122
centage change in quantity supplied and thepercentage change in price. We can look at itas an equation:
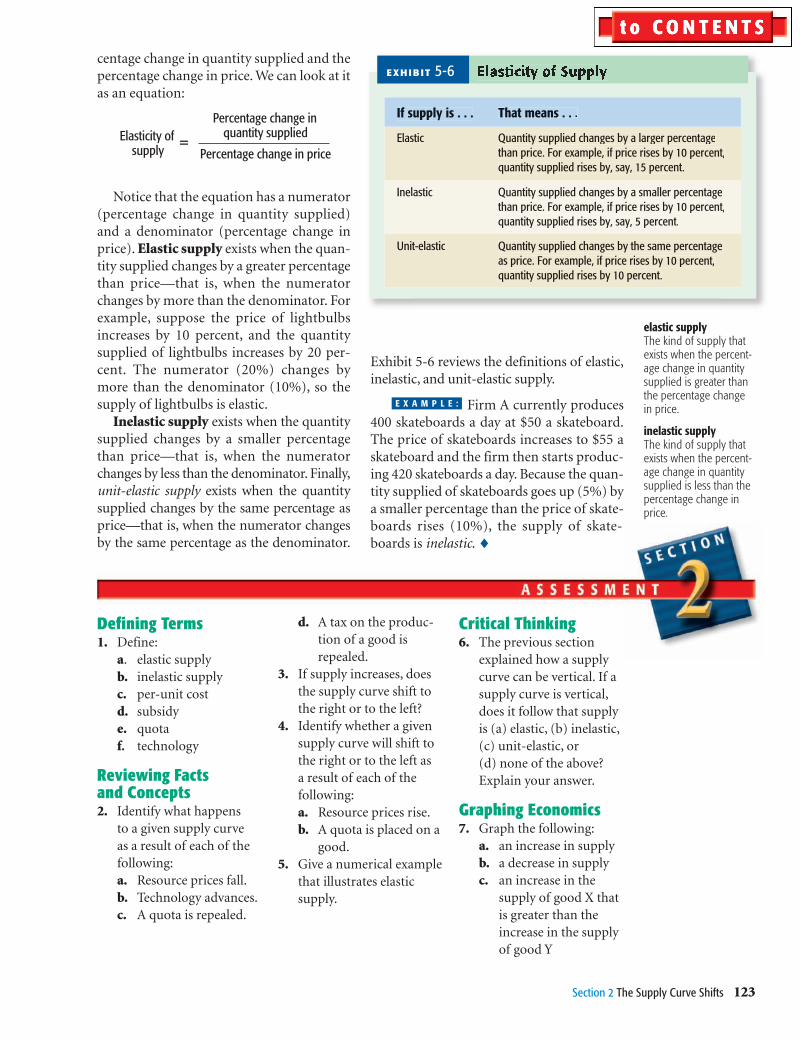
Notice that the equation has a numerator(percentage change in quantity supplied)and a denominator (percentage change inprice). Elastic supply exists when the quan-tity supplied changes by a greater percentagethan price—that is, when the numeratorchanges by more than the denominator. Forexample, suppose the price of lightbulbsincreases by 10 percent, and the quantitysupplied of lightbulbs increases by 20 per-cent. The numerator (20%) changes bymore than the denominator (10%), so thesupply of lightbulbs is elastic.
Inelastic supply exists when the quantitysupplied changes by a smaller percentagethan price—that is, when the numeratorchanges by less than the denominator. Finally,unit-elastic supply exists when the quantitysupplied changes by the same percentage asprice—that is, when the numerator changesby the same percentage as the denominator.
123Section 2 The Supply Curve Shifts
Exhibit 5-6 reviews the definitions of elastic,inelastic, and unit-elastic supply.
Firm A currently produces400 skateboards a day at $50 a skateboard.The price of skateboards increases to $55 askateboard and the firm then starts produc-ing 420 skateboards a day. Because the quan-tity supplied of skateboards goes up (5%) bya smaller percentage than the price of skate-boards rises (10%), the supply of skate-boards is inelastic. �
E X A M P L E :
Defining Terms1. Define:
a. elastic supplyb. inelastic supplyc. per-unit costd. subsidye. quotaf. technology
Reviewing Factsand Concepts2. Identify what happens
to a given supply curveas a result of each of thefollowing:a. Resource prices fall.b. Technology advances.c. A quota is repealed.
d. A tax on the produc-tion of a good isrepealed.
3. If supply increases, doesthe supply curve shift tothe right or to the left?
4. Identify whether a givensupply curve will shift tothe right or to the left asa result of each of thefollowing:a. Resource prices rise.b. A quota is placed on a
good.5. Give a numerical example
that illustrates elasticsupply.
Critical Thinking6. The previous section
explained how a supplycurve can be vertical. If asupply curve is vertical,does it follow that supplyis (a) elastic, (b) inelastic,(c) unit-elastic, or (d) none of the above?Explain your answer.
Graphing Economics7. Graph the following:
a. an increase in supplyb. a decrease in supplyc. an increase in the
supply of good X thatis greater than theincrease in the supplyof good Y
Elastic
Quantity supplied changes by a larger percentagethan price. For example, if price rises by 10 percent,quantity supplied rises by, say, 15 percent.
Quantity supplied changes by a smaller percentagethan price. For example, if price rises by 10 percent,quantity supplied rises by, say, 5 percent.
Quantity supplied changes by the same percentageas price. For example, if price rises by 10 percent,quantity supplied rises by 10 percent.
EXHIB IT 5-6 Elasticity of Supply
Inelastic
Unit-elastic
If supply is . . . That means . . .Percentage change in quantity supplied
Percentage change in price
elastic supplyThe kind of supply thatexists when the percent-age change in quantitysupplied is greater thanthe percentage changein price.
inelastic supplyThe kind of supply thatexists when the percent-age change in quantitysupplied is less than thepercentage change inprice.
Elasticity of supply
�
05 (110-127) EMC Chap 05 11/17/05 4:52 PM Page 123

124 Chapter 5 Supply
Investing in Yourself
When most people think ofinvesting, they think of
investing in such things as stocks,bonds, and real estate. Rarely do wethink of investing in ourselves. Investingin yourself, however, is one of the mostimportant things you can do.
Everyone wants a high returnfrom their investments. What couldyou invest in today—as a high schoolstudent—that could provide you with ahigh return tomorrow? Before we tellyou what it is, let’s look at how theaverage 15- to 17-year-old spends hisor her time each week.
How You Spend Your TimeAccording to a University of
Michigan study, the average 15- to17-year-old (in 2002–2003) eachweek spent 32 hours in school, 4hours and 47 minutes socializing or
visiting with friends, 3 hours playingsports, 1 hour and 17 minutes read-ing, 2 hours and 45 minutes on thecomputer, 7 hours eating, 5 hoursand 43 minutes doing householdwork, and 14 hours and 36 minuteswatching television.
Let’s focus on the 14 hours and36 minutes a week watching televi-sion. Could we reallocate some ofthe TV time toward something thatmight provide us with a higher return(than watching television provides us)?
For example, as a high school stu-dent, you might be thinking of attend-ing college. Getting into a goodcollege could be the stepping stoneto a good-paying job in the future.According to recent data, college grad-uates earn substantially more overtheir lifetimes than those with only ahigh school diploma (see Exhibit 5-7).
You Are Preparing forCollege, Aren’t You?
So, how do you get into a goodcollege? First, you need to have goodhigh school grades. Second, you needto have a reasonably high score onone of the two standardized tests thatcollege-bound high school juniors andseniors take: the SAT and ACT.
Many high school students takethese standardized tests withoutstudying for them. They simply get agood night’s sleep the night beforethe test, and then take it.
Think of an alternative way toproceed. Suppose, beginning eitherat the end of your sophomore yearor at the beginning of your junioryear of high school, you were towatch 2 hours less of television aweek and studied for the SAT orACT instead.
Now ask yourself how manyhours most juniors in high schoolspend studying for the SAT or ACT.Many say “no more than 5 hours.”Yet, the SAT and ACT are importantfactors considered by college admis-sion offices. (If you have alreadytaken the SAT and ACT, apply thefollowing suggestions to collegecourses and tests you’ll take inthe future. If you are a senior andhaven’t taken them, it’s not too lateto plan and prepare to take them.)
Are 100 Hours of StudyingToo Many?
What if instead of spending only5 hours studying for the SAT or ACT,a student spent 100 hours studying.
EX H I B IT 5-7 Average Annual Earningsby Level of Education
Not a high school graduate
High school graduate only
Some college, no degree
Associate’s degree
BachelorBachelor’s degrees degree
Master’s degree
Ph.D. degree
$18,826
$27,280
$29,725
$34,177
$51,194$51 194
$60,445
$89,724
Source: Statistical Abstract of the United States, 2004–2005.
� It’s clear that ifyou invest moretime, effort, andmoney in your edu-cation, your level ofincome will growsubstantially.
05 (110-127) EMC Chap 05 11/17/05 4:52 PM Page 124

125Chapter 5 Supply
These 100 hours are easily foundif the average 15- to 17-year-oldwould simply cut back his or her TVviewing. If you are the average 15-to 17-year-old, and watch 14 hoursand 36 minutes of television aweek, consider cutting that down to12 hours and 36 minutes. With the“freed up” 2 hours, you can nowstudy for the SAT or ACT. In 50weeks, you would have studied100 hours. Studying diligently for2 hours a week for 50 weeks for theSAT or ACT is likely to boost youroverall score.
Will you “earn a high return” atthe end of the 100 hours? We can-not guarantee how high the returnwill be (how much you will boostyour score over not studying), butcertainly it could be substantial. Asubstantial improvement in yourscore could pave the way to a goodcollege in your future and everythingelse that may follow.
The Best Use of Your TimeSo how should you proceed if you
are now convinced that 2 hours ofinvesting in yourself might bring ahigher return than watching an addi-tional 2 hours of television? Withrespect to either the SAT or ACT, youcan go to the appropriate Web sitesto see what the tests look like. Go towww.emcp.net/SAT for the SAT. Forthe ACT, go to www.emcp.net/ACT.
We also strongly urge you to pur-chase one or two of the test prepara-tion books (on the SAT and ACT) thatyou can find at almost any book-store. Most of these test prep booksnot only provide you with sampletests, but with plenty of studymaterial.
The thing to do once you havepurchased these books is to studyslowly and carefully. Don’t just take thesample tests and put the books away.
You will also find sections inthese books on grammar, vocabularywords, critical reading, writing anessay, and more. Read each sectioncarefully, and then read it again. Doall the exercises. Then do them
again. Take the sample tests. Thenmake sure you know what you gotwrong on each sample test. Thentake more sample tests.
If you simply cut out 2 hours oftelevision a week, and devote thattime to studying for the SAT or ACT,you will be surprised how much youlearn and how much you can boostyour test score.
My Personal Economics Action Plan
Here are some points you may want to consider and some
guidelines you might want to put into practice:
❑✔1. The average 15- to 17-year-old spends 14 hours and 36
minutes each week watching television. If you do too,
then you might want to consider cutting down your TV
viewing by 2 hours a week.
I will reduce my television watching time by ___ hours/___
minutes per day.
❑✔2. Spending 100 hours studying for the SAT or ACT can
substantially increase your test score. A reasonably high
SAT or ACT will increase the probability that you will be
admitted to a good college. If you were to spend 2 hours a
week for 50 weeks studying for the SAT or ACT, it would
mean that you would be studying 100 hours for the test.
This is only one-third of the time you put in to an average
high school course (if we count in-class time plus home-
work time.)
I will devote ___ hours per week studying for ___.
❑✔3. We can invest in things (stocks, bonds, gold, real estate),
and we can invest in ourselves. Investing in your aca-
demic self during your high school years can end up pay-
ing a high return in the future. Buy YOU!
Beginning ______, I will ______ as an investment in myself.
05 (110-127) EMC Chap 05 11/17/05 4:52 PM Page 125

126 Chapter 5 Supply
Economics Vocabulary
To reinforce your knowledge of the key terms inthis chapter, fill in the following blanks on a sepa-rate piece of paper with the appropriate word orphrase.
1. A(n) ______ is the numerical representation ofthe law of supply.
2. A(n) ______ is the graphic representation ofthe law of supply.
3. According to the law of supply, as priceincreases, ______ rises.
4. Supply is ______ if the percentage change inquantity supplied is greater than the percentagechange in price.
5. Supply is ______ if the percentage change inquantity supplied is less than the percentagechange in price.
6. ______ refers to the number of units of a goodproduced and offered for sale at a specific price.
Understanding the Main Ideas
Write answers to the following questions to reviewthe main ideas in this chapter.
1. Explain the term supply as it applies to econom-ics. What is the difference between supply andquantity supplied?
2. Express the law of supply in (a) words,(b) symbols, and (c) graphic form.
3. Luisa is willing but not able to produce andoffer to sell plastic cups. Is Luisa a supplier ofplastic cups? Explain your answer.
4. Are all supply curves upward sloping? Why orwhy not?
5. Write out a supply schedule for four differentcombinations of price and quantity supplied.
6. Identify whether the supply curve for each ofthe following would be vertical or upwardsloping.a. desks in your classroom at this momentb. seats at a football stadium at this momentc. television sets over timed. Hewlett-Packard computers over timee. Picasso paintings (Hint: Picasso is dead.)
7. What does it mean when a supply curve shifts tothe right? To the left?
Chapter Summary
Be sure you know and remember the followingkey points from the chapter sections.
Section 1� The supply of a good or service requires both a
supplier’s willingness and ability to produceand sell.
� The law of supply says that price and quantitysupplied move in the same direction—as priceincreases, so does quantity supplied, and viceversa—called a direct relationship.
� Quantity supplied refers to the number ofunits of a good produced and offered for saleat a specific price.
� The supply curve is an upward-sloping line(from left to right) that shows the amount of agood sellers are willing and able to sell at vari-ous prices.
� A market supply curve represents the sum ofall individual firms’ supply curves for a partic-ular good.
Section 2� Resource prices, advances in technology, subsi-
dies, quotas, the number of sellers, future priceexpectations, and weather are all factors thatcan cause a shift in the supply curve.
� The factor that causes a change in the quantitysupplied is price.
� The elasticity of supply measures the relation-ship between the percentage change in priceand the percentage change in quantity supplied.
� Supply is elastic when quantity suppliedchanges by a greater percentage than price.
� Supply is inelastic when quantity suppliedchanges by a smaller percentage than price.
� Unit-elastic supply exists when quantity sup-plied changes by the same percentage as price.
05 (110-127) EMC Chap 05 11/17/05 4:52 PM Page 126
127Chapter 5 Supply
8. Between the price of $10 and $14, supply isinelastic. What does this statement mean?
9. Explain what happens to the supply curve oftelevision sets as a consequence of each of thefollowing.a. Resource prices fall.b. A technological advancement occurs in the
television industry.c. A tax is placed on the production of televi-
sion sets.10. Identify the factors that can change supply.
Identify the factor that can change quantitysupplied.
11. In each of the following cases, identify whetherthe supply of the good is elastic, inelastic, orunit-elastic.a. The price of books increases 10 percent, and
the quantity supplied of books increases 14percent.
b. The price of bread increases 2 percent, and thequantity supplied of bread increases 2 percent.
c. The price of telephones decreases 6 percent,and the quantity supplied of telephonesdecreases 8 percent.
12. What factor causes movement along a supplycurve?
Doing the Math
Do the calculations necessary to solve the followingproblems.
1. A house-building company spends $40 millionto produce 400 houses. What is the average cost,or per-unit cost, of a house?
2. Firm A sold 400 stereos for a total of $200,000,and firm B sold 550 stereos for a total of$275,000. Which firm is charging more perunit? Graph the supply curve.
3. If the percentage change in price is 5 percentand the percentage change in quantity suppliedis 10 percent, calculate the elasticity of supply.
4. Currently the price of a good is $10, and thequantity supplied is 300 units. For every $1increase in price, quantity supplied rises by 5units. What is the quantity supplied at a priceof $22?
Working with Graphs
and Charts
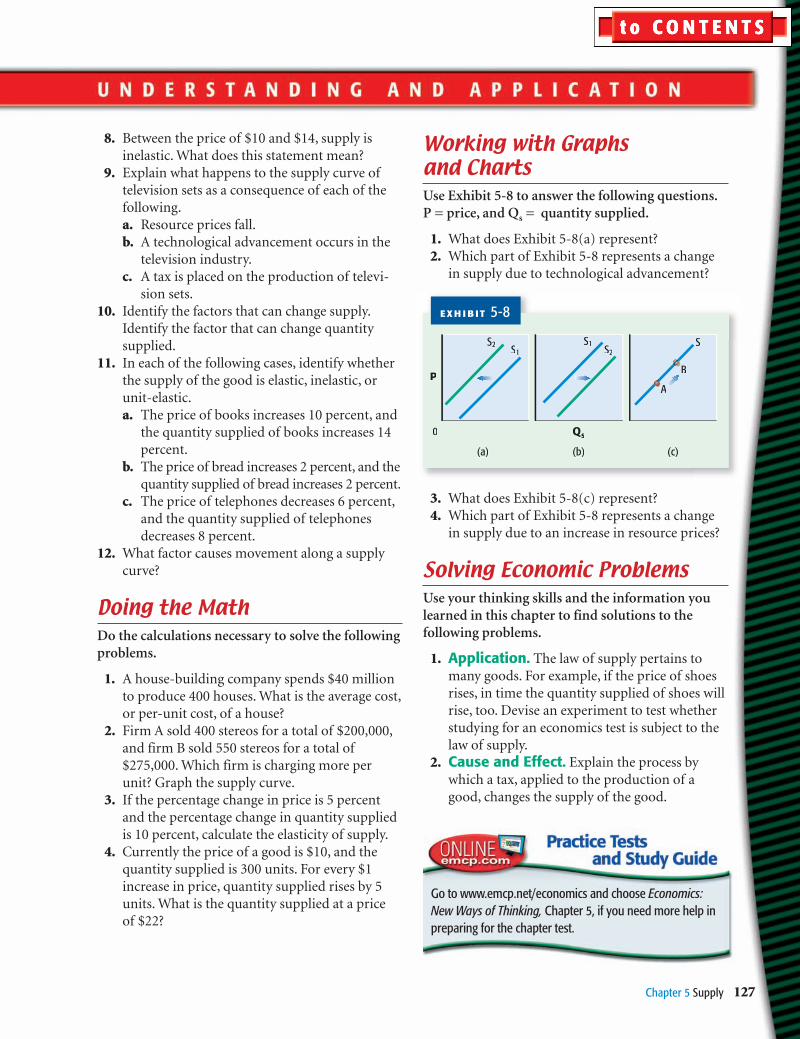
Use Exhibit 5-8 to answer the following questions.P = price, and Qs = quantity supplied.
1. What does Exhibit 5-8(a) represent?2. Which part of Exhibit 5-8 represents a change
in supply due to technological advancement?
3. What does Exhibit 5-8(c) represent?4. Which part of Exhibit 5-8 represents a change
in supply due to an increase in resource prices?
Solving Economic Problems
Use your thinking skills and the information youlearned in this chapter to find solutions to thefollowing problems.
1. Application. The law of supply pertains tomany goods. For example, if the price of shoesrises, in time the quantity supplied of shoes willrise, too. Devise an experiment to test whetherstudying for an economics test is subject to thelaw of supply.
2. Cause and Effect. Explain the process bywhich a tax, applied to the production of agood, changes the supply of the good.
0
(a) (b)
P
(c)
S
B
A
EX H I B IT 5-8
Qs
S2 S2S1S1
Go to www.emcp.net/economics and choose Economics:New Ways of Thinking, Chapter 5, if you need more help inpreparing for the chapter test.
05 (110-127) EMC Chap 05 11/18/05 4:19 PM Page 127