willbros - d.a. davidson conference presentation
DESCRIPTION
http://phx.corporate-ir.net/phoenix.zhtml?c=95816&p=irol-EventDetails&EventId=4202514 Presentation for D.A. Davidson Engineering & Construction ConferenceTRANSCRIPT
September 21, 2011
Willbros Group(NYSE : WG)
D.A. Davidson 10th Annual Engineering &
Construction Conference
September 2011
2
Forward Looking Statements
This presentation contains forward looking statements. All
statements, other than statements of historical facts which
address activities, events or developments the Company expects
or anticipates will or may occur in the future, are forward looking
statements. A number of risks and uncertainties could cause
actual results to differ materially from these statements. These
risk factors are described in the Company’s documents and
reports filed with the SEC. The Company assumes no obligation
to update publicly such forward looking statements, whether as a
result of new information, future events or otherwise. This
presentation contains non-GAAP numbers and a reconciliation is
provided in the Appendix.

September 2011
Willbros: Over 100 years of
3
Founded in 1908: IPO in 1996
Exchange / Ticker: NYSE : WG
Share Price(1): $6.22/share
Market Capitalization: $302 million
Avg. Trading Volume(2): 439,163 shs/d
Inside Ownership(3): ~9 million shares
Notes:(1) Share price as of 09/15/11
(2) Based on 3 month average
(3) Inside Ownership 8/31/11
Current work regions
Past work regions
Willbros of f ices
September 2011
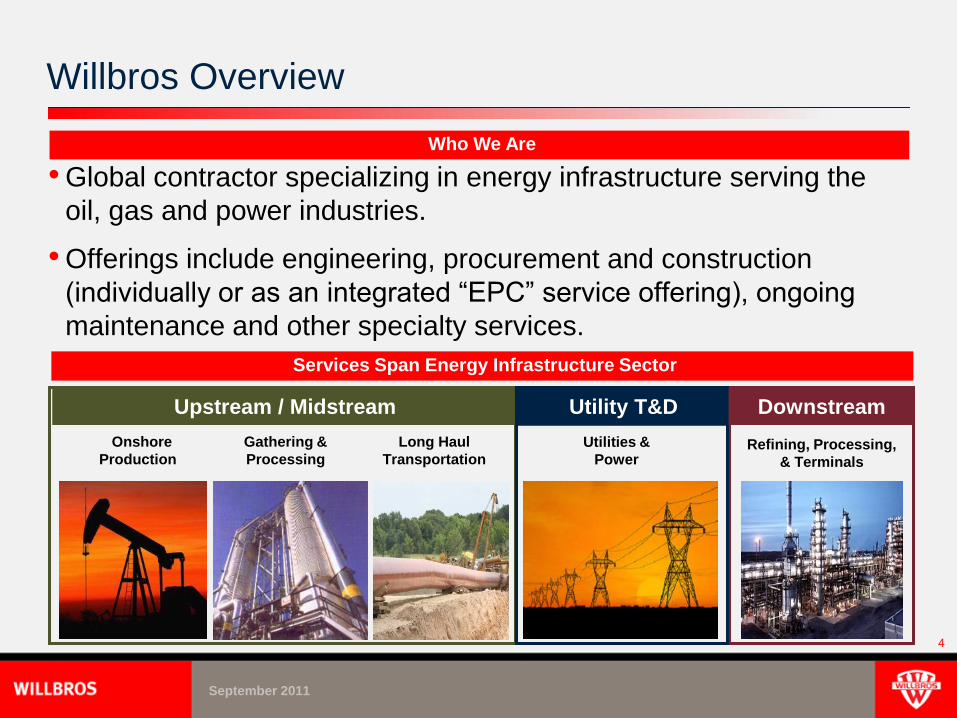
• Global contractor specializing in energy infrastructure serving the
oil, gas and power industries.
• Offerings include engineering, procurement and construction
(individually or as an integrated “EPC” service offering), ongoing
maintenance and other specialty services.
Utility T&D
Willbros Overview
Services Span Energy Infrastructure Sector
Onshore
Production
Gathering &
ProcessingRefining, Processing,
& Terminals
Long Haul
Transportation
Who We Are
4
Utilities &
Power
Upstream / Midstream Downstream
September 2011
5
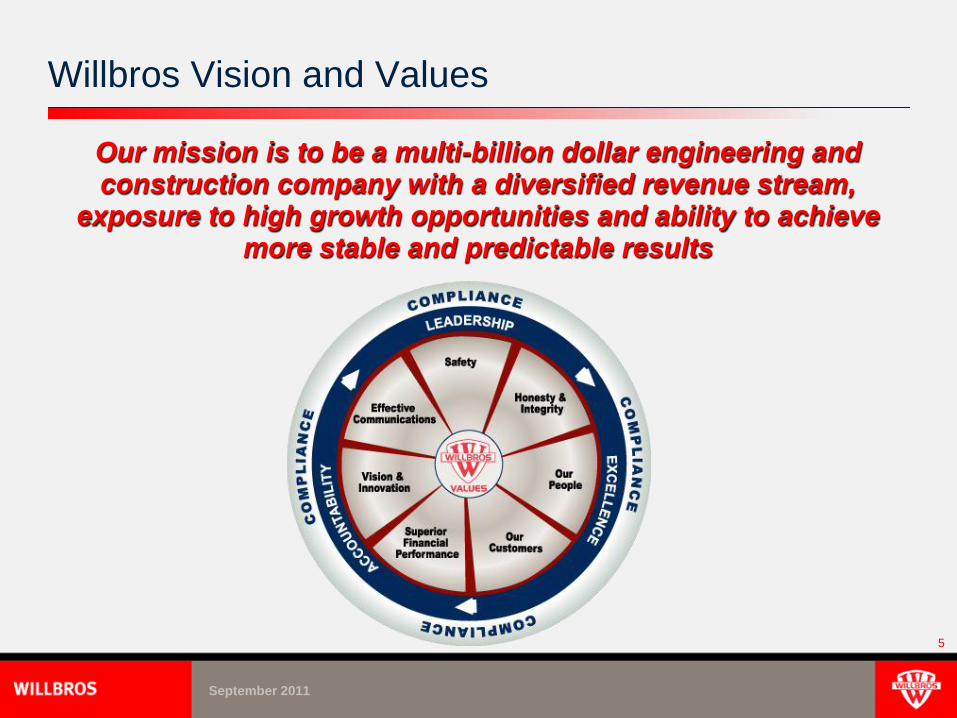
Willbros Vision and Values
Our mission is to be a multi-billion dollar engineering and construction company with a diversified revenue stream,
exposure to high growth opportunities and ability to achieve more stable and predictable results
September 2011
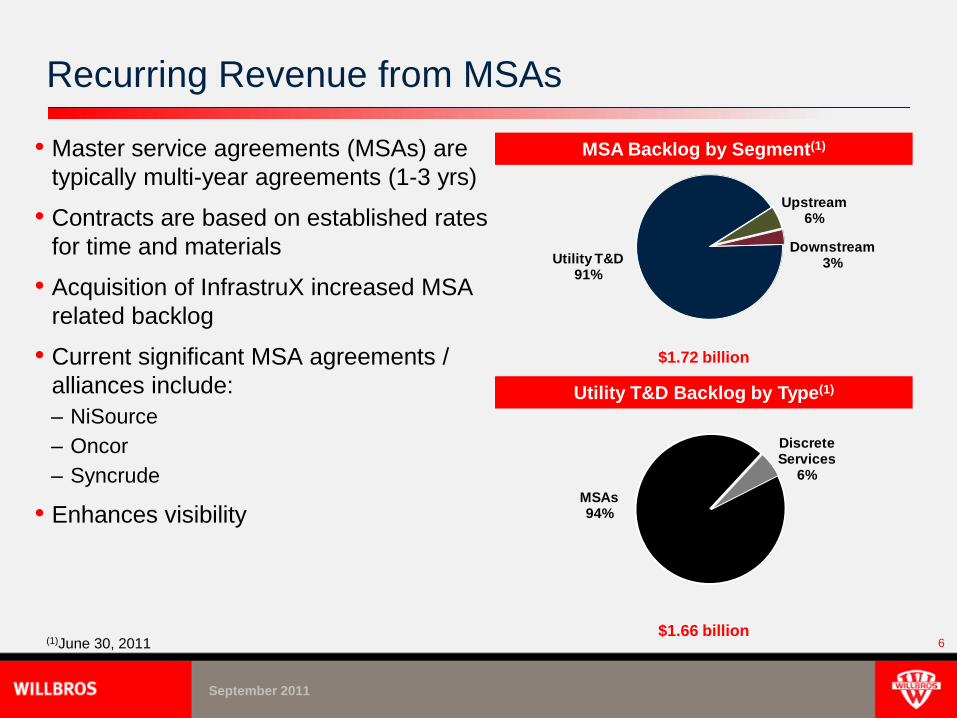
Upstream6%
Downstream3%Utility T&D
91%
• Master service agreements (MSAs) are
typically multi-year agreements (1-3 yrs)
• Contracts are based on established rates
for time and materials
• Acquisition of InfrastruX increased MSA
related backlog
• Current significant MSA agreements /
alliances include:
– NiSource
– Oncor
– Syncrude
• Enhances visibility
Utility T&D Backlog by Type(1)
6
Recurring Revenue from MSAs
(1)June 30, 2011$1.66 billion
MSA Backlog by Segment(1)
$1.72 billion
MSAs94%
Discrete Services
6%
September 2011
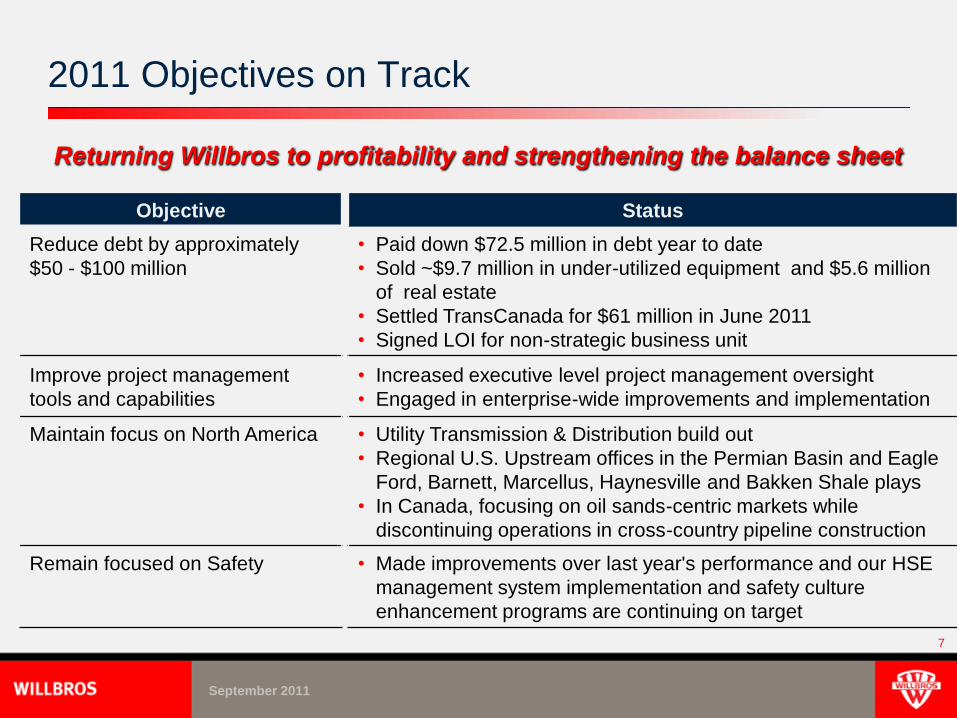
2011 Objectives on Track
7
Returning Willbros to profitability and strengthening the balance sheet
Objective
Reduce debt by approximately
$50 - $100 million
Improve project management
tools and capabilities
Maintain focus on North America
Remain focused on Safety
Status
• Paid down $72.5 million in debt year to date
• Sold ~$9.7 million in under-utilized equipment and $5.6 million
of real estate
• Settled TransCanada for $61 million in June 2011
• Signed LOI for non-strategic business unit
• Increased executive level project management oversight
• Engaged in enterprise-wide improvements and implementation
• Utility Transmission & Distribution build out
• Regional U.S. Upstream offices in the Permian Basin and Eagle
Ford, Barnett, Marcellus, Haynesville and Bakken Shale plays
• In Canada, focusing on oil sands-centric markets while
discontinuing operations in cross-country pipeline construction
• Made improvements over last year's performance and our HSE
management system implementation and safety culture
enhancement programs are continuing on target

September 2011
8
Key Investment Considerations
• Worldwide brand recognition and reputation for quality, safety and schedule /
price certainty
• Exposure to burgeoning markets in electric transmission, hydrocarbon
infrastructure and the Canadian oil sands driven by:
– Renewable energy – Shale development
– Pipeline integrity – Aging infrastructure
– Ongoing maintenance – Government regulation
• Transmission infrastructure market outlook implies earnings break-out as pricing
power shifts to contractors in a tightening market
• Broad range of services enhanced by in-house engineering
• Critical scale, extensive geographic presence and strong customer base reduces
cyclicality and risk
• Balanced revenue base from recurring services and EPC / discrete projects
• Trading at a discount to peer group based on most valuation metrics
September 2011
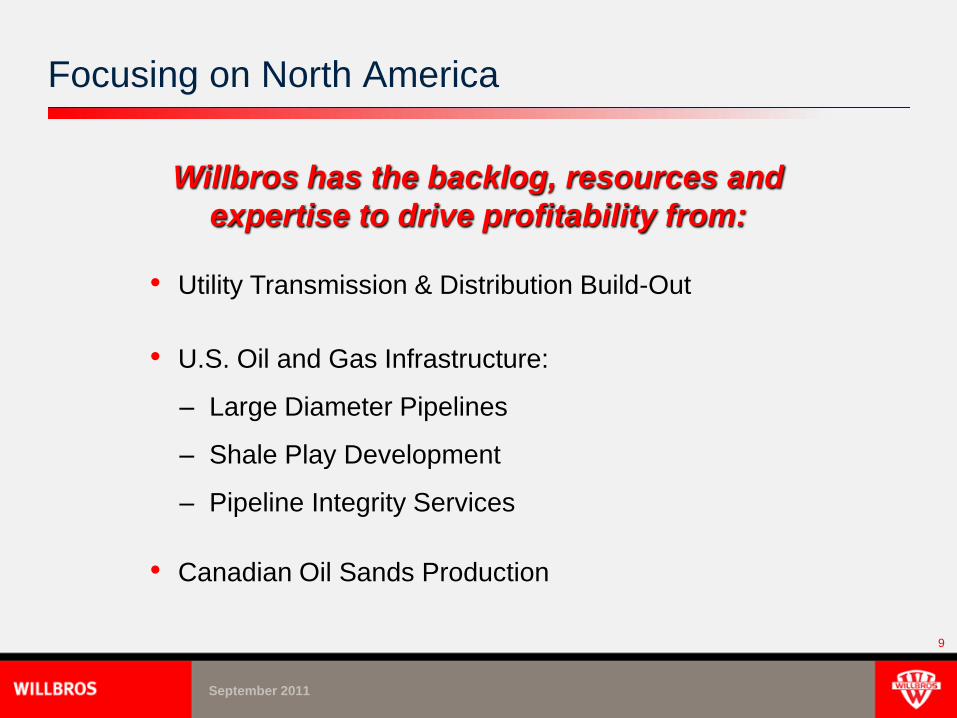
Focusing on North America
9
• Utility Transmission & Distribution Build-Out
• U.S. Oil and Gas Infrastructure:
– Large Diameter Pipelines
– Shale Play Development
– Pipeline Integrity Services
• Canadian Oil Sands Production
Willbros has the backlog, resources and
expertise to drive profitability from:
September 2011
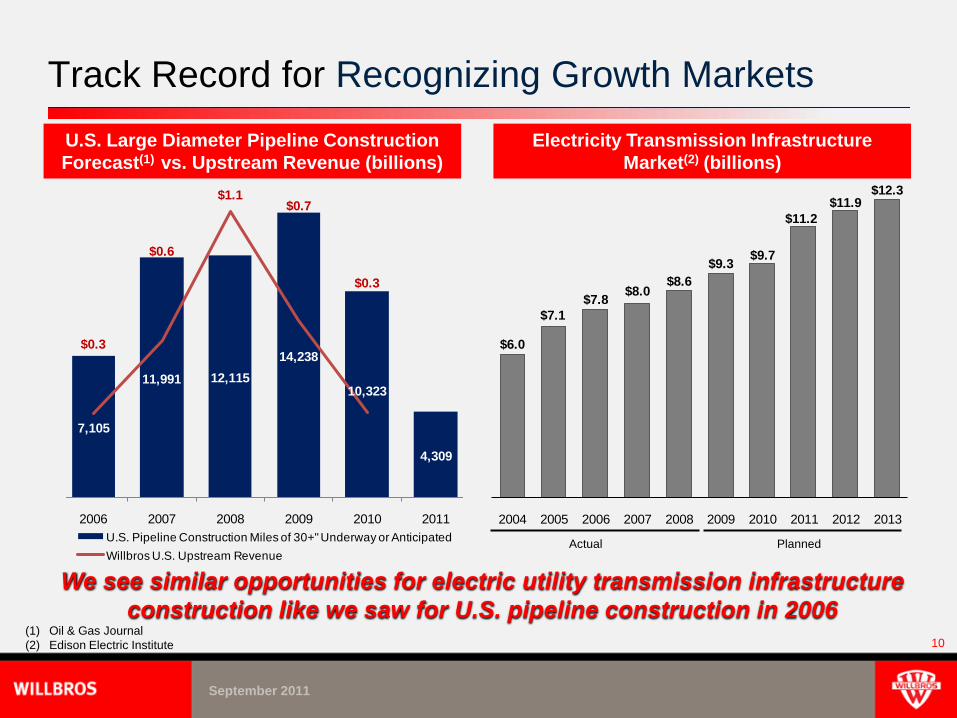
$6.0
$7.1
$7.8$8.0
$8.6
$9.3$9.7
$11.2
$11.9$12.3
2004 2005 2006 2007 2008 2009 2010 2011 2012 2013
Track Record for Recognizing Growth Markets
10
Electricity Transmission Infrastructure
Market(2) (billions)
(1) Oil & Gas Journal
(2) Edison Electric Institute
We see similar opportunities for electric utility transmission infrastructure
construction like we saw for U.S. pipeline construction in 2006
Actual Planned
7,105
11,991 12,115
14,238
10,323
4,309
$0.3
$0.6
$1.1$0.7
$0.3
$0.0
$0.3
$0.6
$0.9
$1.2
0
4,000
8,000
12,000
16,000
2006 2007 2008 2009 2010 2011
U.S. Pipeline Construction Miles of 30+" Underway or Anticipated
Willbros U.S. Upstream Revenue
U.S. Large Diameter Pipeline Construction
Forecast(1) vs. Upstream Revenue (billions)
September 2011
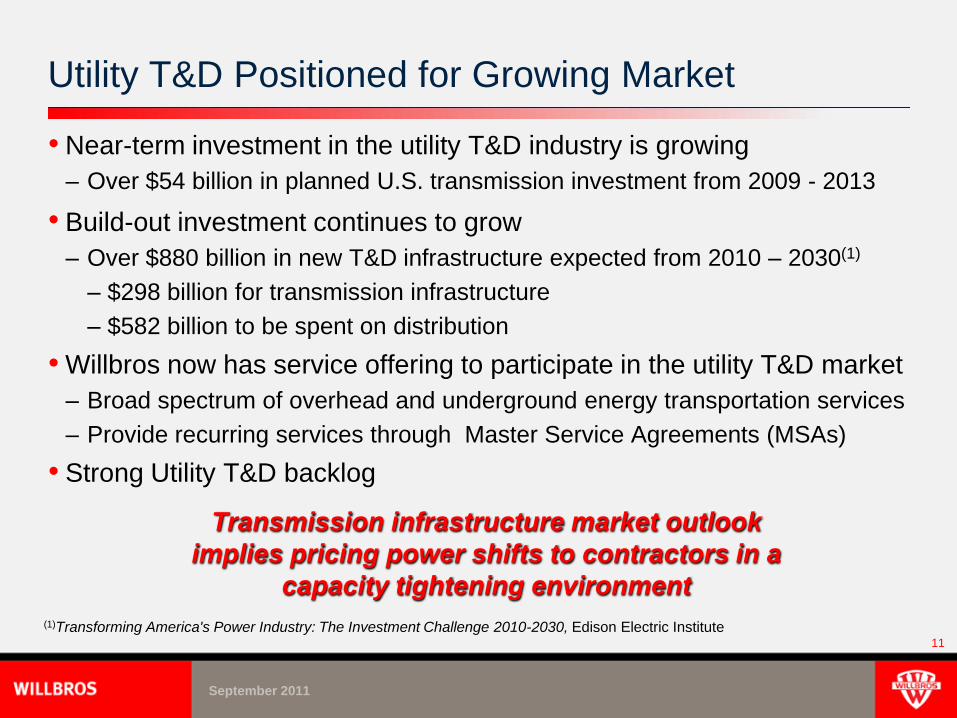
Utility T&D Positioned for Growing Market
• Near-term investment in the utility T&D industry is growing
– Over $54 billion in planned U.S. transmission investment from 2009 - 2013
• Build-out investment continues to grow
– Over $880 billion in new T&D infrastructure expected from 2010 – 2030(1)
– $298 billion for transmission infrastructure
– $582 billion to be spent on distribution
• Willbros now has service offering to participate in the utility T&D market
– Broad spectrum of overhead and underground energy transportation services
– Provide recurring services through Master Service Agreements (MSAs)
• Strong Utility T&D backlog
11
Transmission infrastructure market outlook
implies pricing power shifts to contractors in a
capacity tightening environment
(1)Transforming America's Power Industry: The Investment Challenge 2010-2030, Edison Electric Institute
September 2011
Large Diameter Pipeline Construction Remains a Core Upstream Capability
• Willbros has the resources and in-depth expertise to perform
pipeline assessment, engineering, construction and ongoing pipeline
integrity management and maintenance >> the full pipeline lifecycle.
– Integrity management and maintenance services generate recurring
revenues under MSAs
• Maintaining capacity to execute 1 to 2 large diameter pipeline
construction projects per year in the United States
• Continuous process improvement to ensure we offer competitive
value propositions to our customers
• Opportunistic view of international markets12
September 2011
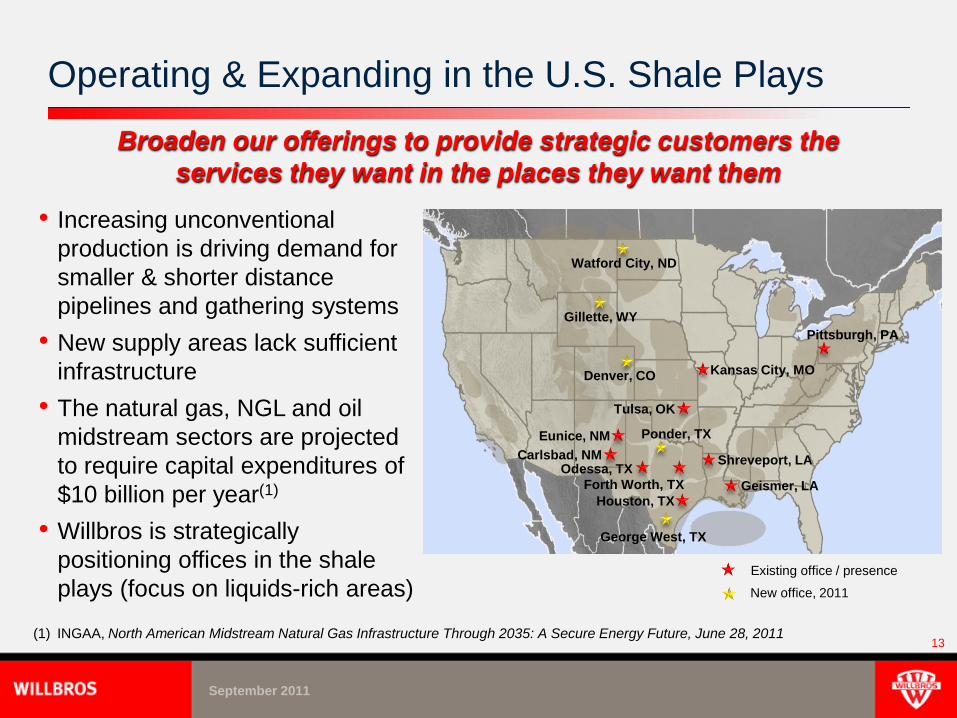
Operating & Expanding in the U.S. Shale Plays
13
• Increasing unconventional
production is driving demand for
smaller & shorter distance
pipelines and gathering systems
• New supply areas lack sufficient
infrastructure
• The natural gas, NGL and oil
midstream sectors are projected
to require capital expenditures of
$10 billion per year(1)
• Willbros is strategically
positioning offices in the shale
plays (focus on liquids-rich areas)
Broaden our offerings to provide strategic customers the
services they want in the places they want them
(1) INGAA, North American Midstream Natural Gas Infrastructure Through 2035: A Secure Energy Future, June 28, 2011
Ponder, TXEunice, NM
Houston, TXGeismer, LAForth Worth, TX
George West, TX
Pittsburgh, PA
Denver, CO
Watford City, ND
Gillette, WY
Carlsbad, NMOdessa, TX
Tulsa, OK
Kansas City, MO
Shreveport, LA
Existing office / presence
New office, 2011

September 2011
U.S. Production Growth Concentrated in Shale Plays is Changing Pipeline Landscape
14
+134
-3
+2
+3
+137Williston
+145Anadarko
+322Permian
+19
+78Marcellus
+7
+4
+10
+16
+33
+19
+4
+7
+4
+7
+40
+140Eagle
Ford
-2
-6
-1
+1
Dry Gas Focused Areas
Liquids Rich/Oil Focused Areas
Rig Declines Source: Bentek, April 2011
+14+28
+29+15
+2
+3
-7
Active Rig Additions Since Low – May 2009
September 2011
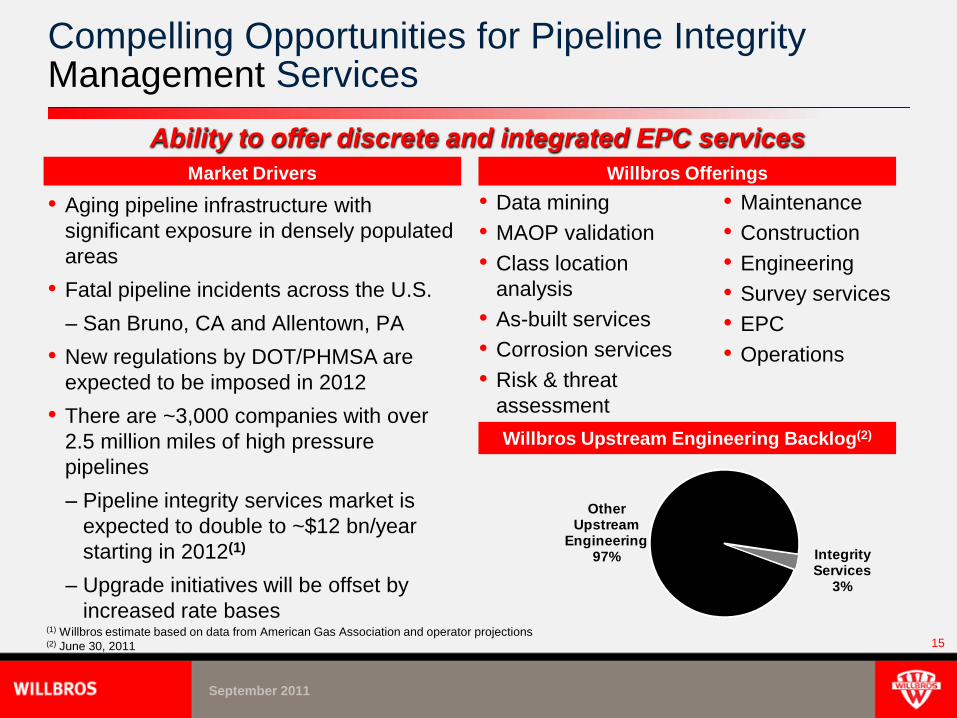
Other Upstream
Engineering97% Integrity
Services3%
Compelling Opportunities for Pipeline Integrity Management Services
15
Market Drivers Willbros Offerings
Ability to offer discrete and integrated EPC services
• Aging pipeline infrastructure with
significant exposure in densely populated
areas
• Fatal pipeline incidents across the U.S.
– San Bruno, CA and Allentown, PA
• New regulations by DOT/PHMSA are
expected to be imposed in 2012
• There are ~3,000 companies with over
2.5 million miles of high pressure
pipelines
– Pipeline integrity services market is
expected to double to ~$12 bn/year
starting in 2012(1)
– Upgrade initiatives will be offset by
increased rate bases
• Data mining
• MAOP validation
• Class location
analysis
• As-built services
• Corrosion services
• Risk & threat
assessment
(1) Willbros estimate based on data from American Gas Association and operator projections(2) June 30, 2011
• Maintenance
• Construction
• Engineering
• Survey services
• EPC
• Operations
Willbros Upstream Engineering Backlog(2)
September 2011
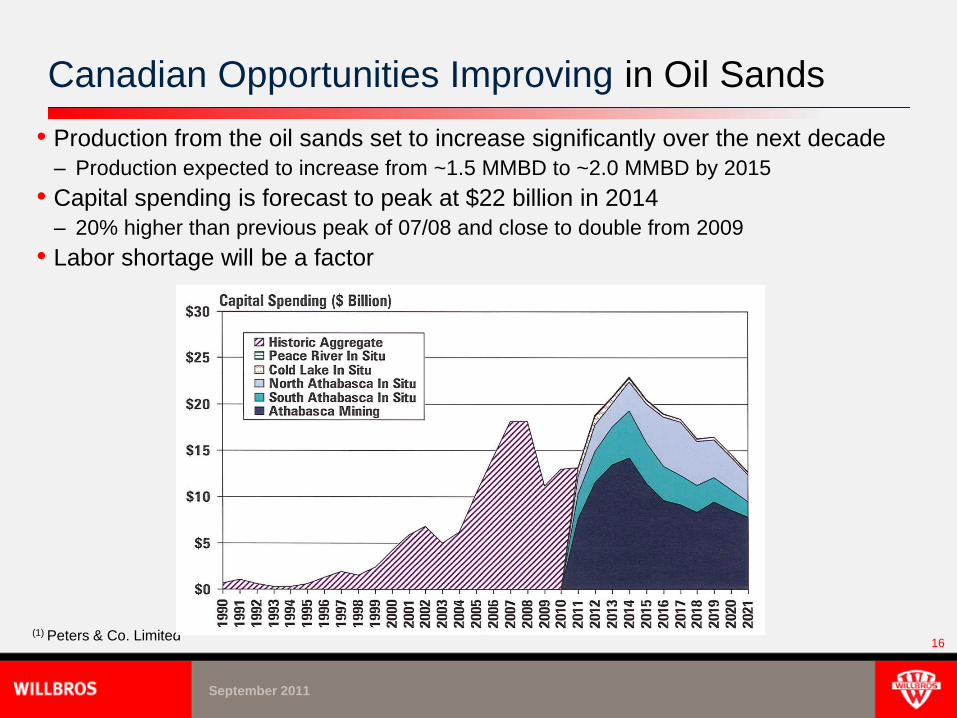
Canadian Opportunities Improving in Oil Sands
• Production from the oil sands set to increase significantly over the next decade
– Production expected to increase from ~1.5 MMBD to ~2.0 MMBD by 2015
• Capital spending is forecast to peak at $22 billion in 2014
– 20% higher than previous peak of 07/08 and close to double from 2009
• Labor shortage will be a factor
16(1) Peters & Co. Limited

Financial Overview
September 2011
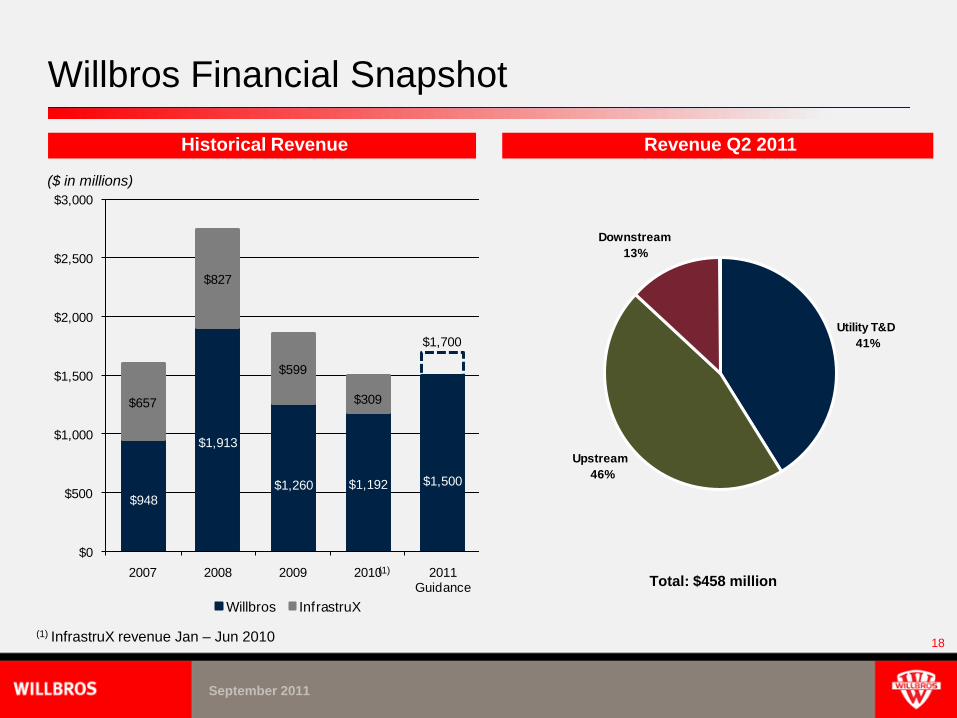
Willbros Financial Snapshot
18
Historical Revenue Revenue Q2 2011
(1) InfrastruX revenue Jan – Jun 2010
Total: $458 million(1)
Utility T&D
41%
Upstream
46%
Downstream
13%
($ in millions)
$948
$1,913
$1,260 $1,192 $1,500
$657
$827
$599
$309
$1,700
$0
$500
$1,000
$1,500
$2,000
$2,500
$3,000
2007 2008 2009 2010 2011 Guidance
Willbros InfrastruX

September 2011
Total Backlog
Oncor
BP Solar
Acadian Haynesville Extension
Oxy (CB&I)
NiSource
Syncrude Maintenance
Camp Pendleton
Upstream40%
Downstream10%
Utility T&D50%
12 Month Backlog by Segment (1)
19
Backlog
(1)June 30, 2011$0.9 billion
Total Backlog by Segment (1)
$2.4 billion
1Q 3Q 4Q 1Q 2Q 3Q2Q 4Q
2011 2012
Major Projects
Upstream26%
Downstream5%
Utility T&D69%
Total Backlog
Oncor
BP Solar
Acadian Haynesville Extension
Oxy (CB&I)
NiSource
Syncrude Maintenance
Camp Pendleton

September 2011
Improving Adjusted EBITDA While Reducing Debt
Q1 2011 Q2 2011
Contract revenue $328.9 $458.3
Adjusted EBITDA(1) $(9.0) $21.0
Adjusted operating income $(24.9) $13.1(2)
Backlog (12 month) 985.9 948.3
Cash 68.2 93.6
Total debt 355.1 317.9
($ in millions)
20
• Q2 revenue growth driven primarily by strong project execution in the
Upstream (Acadian Pipeline) and UT&D segments (BP Solar, Bangor Hydro
and MPRP)
• Downstream continues to experience a slow market recovery, especially in
small capital projects
• Cash build and debt paydown aided by receipt of $61 million related to the
TransCanada settlement
(1)See page 32 in the Appendix and Exhibits section for a reconciliation of Adjusted EBITDA(2)Adjusted operating income excludes the $8.2 million charge related to the TransCanada settlement
September 2011
Liquidity and Free Cash Flow(1)
21
• Cash and cash equivalents of approximately $94 million
• $175 million credit facility
‒ $25 million cash revolver available
‒ $25 million letters of credit drawn
‒ $59 million cash revolver borrowings
• Maturity profile
‒ $32 million of convertible notes due in December 2012
‒ Senior credit facility due in June 2013
‒ Term loan due in June 2014
• Flexible maintenance and capital expenditure requirements
(1)June 30, 2011

September 2011
0x
2x
4x
6x
8x
10x
WG MTRXFWLT DY PIKE EXH MYRG TTEK CBI MTZ PWR TISI GLBL
2012 EV/EBITDA Valuation
0x
2x
4x
6x
8x
10x
12x
EXH WG MTRX GLBL MYRG TTEK CBI PWR FWLT TISI MTZ DY PIKE
2012 Price/Cash Flow Valuation
WG is Undervalued Relative to Peers
22
Source: Thomson One
Pricing as of September 15, 2011
*Data not available0.0x
0.2x
0.4x
0.6x
0.8x
1.0x
WG EXH MTRX PIKE CBI MYRG DY FWLT MTZ TTEK TISI PWR GLBL
2012 Price/Sales Valuation
* * * *
September 2011
23
Key Investment Considerations
• Worldwide brand recognition and reputation for quality, safety and schedule /
price certainty
• Exposure to burgeoning markets in electric transmission, hydrocarbon
infrastructure and the Canadian oil sands driven by:
– Renewable energy – Shale development
– Pipeline integrity – Aging infrastructure
– Ongoing maintenance – Government regulation
• Transmission infrastructure market outlook implies earnings break-out as pricing
power shifts to contractors in a tightening market
• Broad range of services enhanced by in-house engineering
• Critical scale, extensive geographic presence and strong customer base reduces
cyclicality and risk
• Balanced revenue base from recurring services and EPC / discrete projects
• Trading at a discount to peer group based on most valuation metrics

www.willbros.com