william j. burke boston college: institute for scientific research and air force research...
TRANSCRIPT
William J. BurkeBoston College: Institute for Scientific Research
and Air Force Research Laboratory: Space Vehicles Directorate
Electrodynamics of the Equatorial Ionosphere: Messages from the C/NOFS
Satellite
C/NOFS DMSP

C/NOFS Satellite Mission Outline
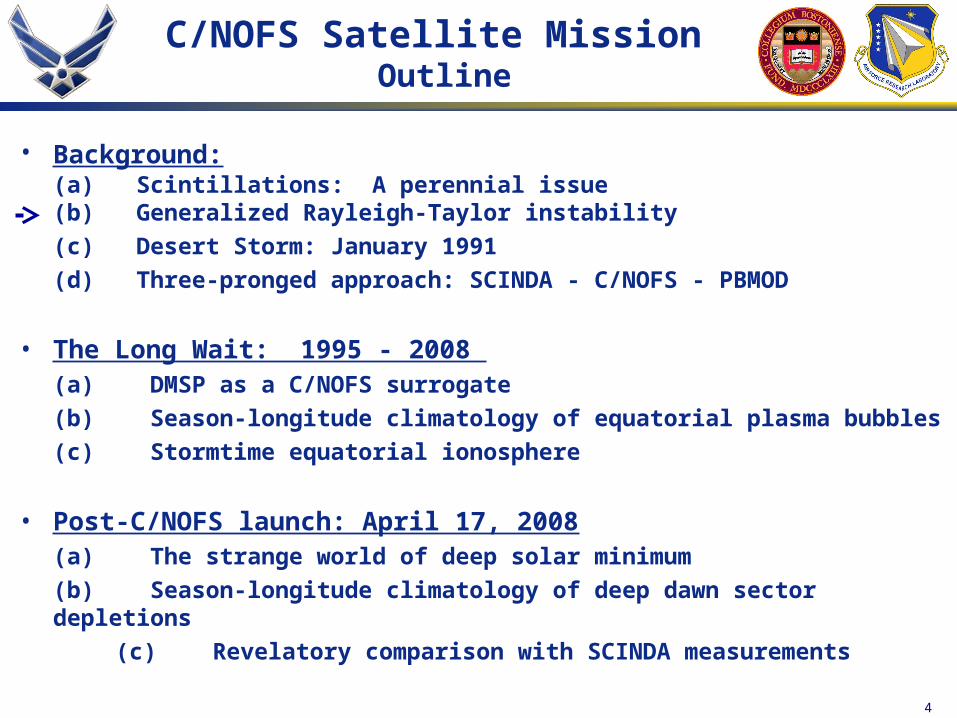
• Background: (a) Scintillations: A perennial issue(b) Generalized Rayleigh-Taylor instability
(c) Desert Storm: January 1991
(d) Three-pronged approach: SCINDA - C/NOFS - PBMOD
• The Long Wait: 1995 - 2008(a) DMSP as a C/NOFS surrogate
(b) Season-longitude climatology of equatorial plasma bubbles
(c) Stormtime equatorial ionosphere
• Post-C/NOFS launch; April 17, 2008(a) The strange world of deep solar minimum
(b) Season-longitude climatology of deep dawn sector depletions
(c) Revelatory comparison with SCINDA measurements
2
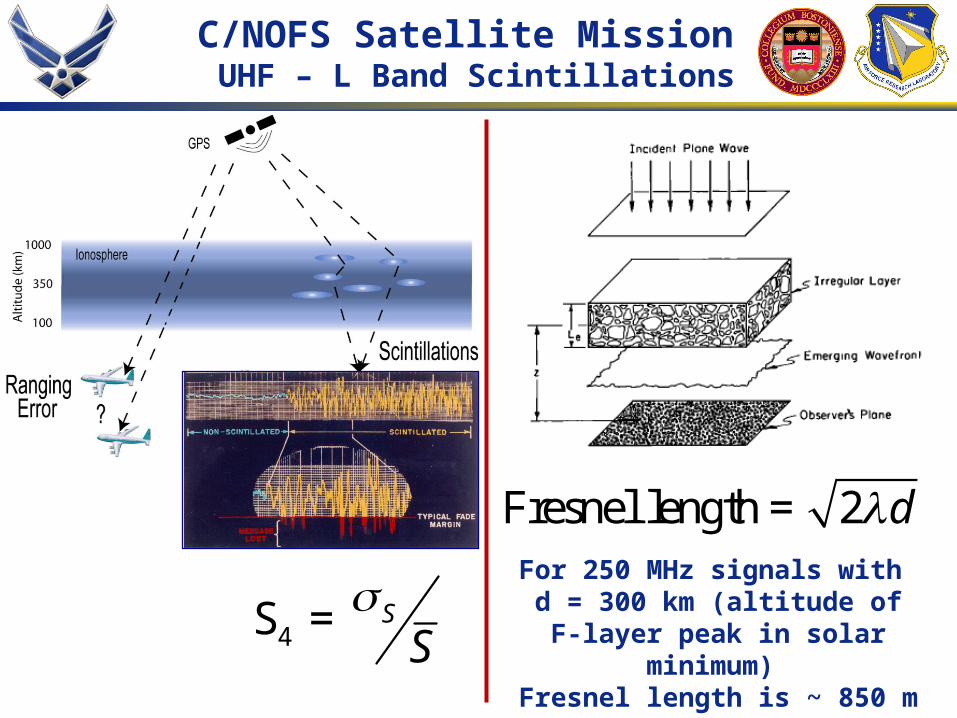
C/NOFS Satellite Mission UHF – L Band Scintillations
Fresnel length = 2 dFor 250 MHz signals with
d = 300 km (altitude of F-layer peak in solar minimum)
Fresnel length is ~ 850 m4S = S
S
C/NOFS Satellite Mission Outline
• Background: (a) Scintillations: A perennial issue(b) Generalized Rayleigh-Taylor instability
(c) Desert Storm: January 1991
(d) Three-pronged approach: SCINDA - C/NOFS - PBMOD
• The Long Wait: 1995 - 2008 (a) DMSP as a C/NOFS surrogate
(b) Season-longitude climatology of equatorial plasma bubbles
(c) Stormtime equatorial ionosphere
• Post-C/NOFS launch: April 17, 2008(a) The strange world of deep solar minimum
(b) Season-longitude climatology of deep dawn sector depletions
(c) Revelatory comparison with SCINDA measurements
4

C/NOFS Satellite Mission Equatorial Electrodynamics
R-T growth rates are controlled by the variability of E, Un, ΣE, ΣF, veff, and through the flux-tube integrated quantities by the height of the F layer.
0tA A eExponential Growth
GrowthRate
Conductance
Electric Field
Magnetic Field
Log DensityGradient
NeutralWind
Gravity
2
1Fn eff
F E
g NU
B N h
E B
Generalized Rayleigh-Taylor Instability
Linear Stage
Nonlinear Stage

C/NOFS Satellite Mission Outline
• Background: (a) Scintillations: A perennial issue(b) The generalized Rayleigh-Taylor instability
(c) Desert Storm: January 1991
(d) Three-pronged response: SCINDA - C/NOFS - PBMOD
• The Long Wait: 1995 - 2008(a) DMSP as a C/NOFS surrogate
(b) Season-longitude climatology of equatorial plasma bubble
(c) Comparison with JULIA radar measurements
(d) Stormtime equatorial ionosphere
• Post-C/NOFS launch; April 17, 2008(a) The strange new world of deep solar minimum
(b) Season-longitude climatology of deep dawn sector depletions
(c) Revelatory comparison with SCINDA measurements6
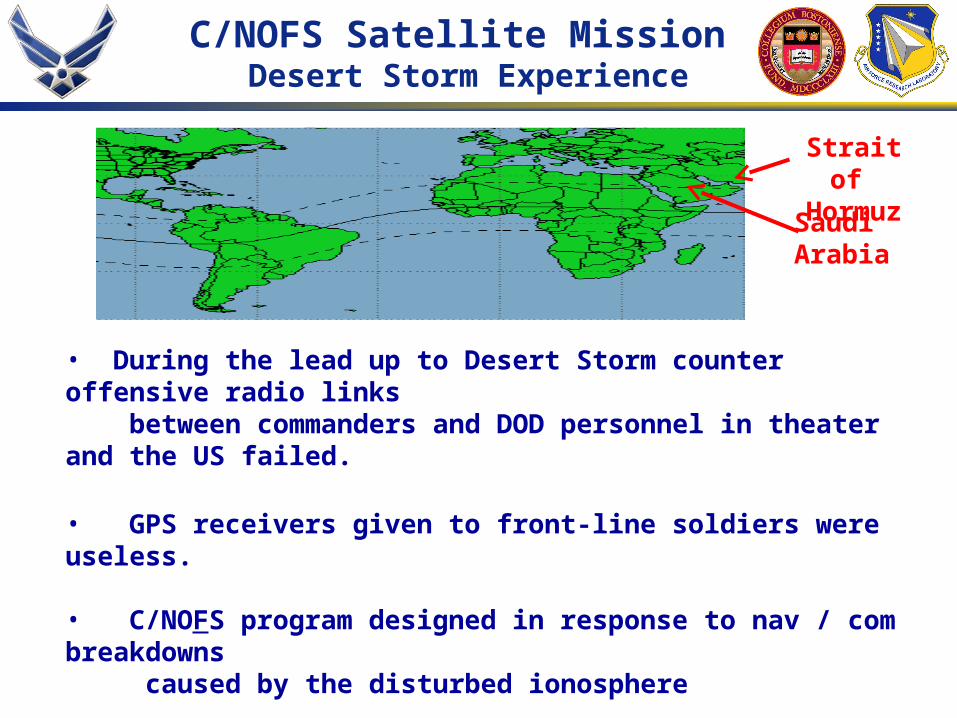
C/NOFS Satellite Mission Desert Storm Experience
• During the lead up to Desert Storm counter offensive radio links between commanders and DOD personnel in theater and the US failed.
• GPS receivers given to front-line soldiers were useless.
• C/NOFS program designed in response to nav / com breakdowns caused by the disturbed ionosphere
• In preparation for the C/NOFS mission we exploited database of equatorial plasma bubble (EPB) encountered by DMSP satellites in the evening local time sector.
Strait of Hormuz
Saudi Arabia
C/NOFS Satellite Mission Outline
• Background: (a) Scintillations: A perennial issue(b) The generalized Rayleigh-Taylor instability
(c) Desert Storm: January 1991
(d) Three-pronged approach: SCINDA - C/NOFS - PBMOD
• The Long Wait: 1995 - 2008(a) DMSP as a C/NOFS surrogate
(b) Season-longitude climatology of equatorial plasma bubbles
(c) Stormtime equatorial ionosphere
• Post-C/NOFS launch; April 17, 2008(a) The strange world of deep solar minimum
(b) Season-longitude climatology of deep dawn sector depletions
(c) Revelatory comparison with SCINDA measurements
8

C/NOFS Satellite Mission Approach
Mission Response: Ground- and Space-based Measurements
SCINDA = Scintillation Network
Decision Aid
SEVERE MODERATE WEAK
Term
inator
SatelliteLinks
C/NOFS
- Planar Langmuir Probe (PLP)- Vector Electric Field Instrument- Ion Velocity Meter (IVM)- Neutral Wind Meter- GPS Occultation Receiver- RF Radio Beacon
• Pegasus launch • 13 inclination • 850 by 400 km
C/NOFS Satellite Mission Approach
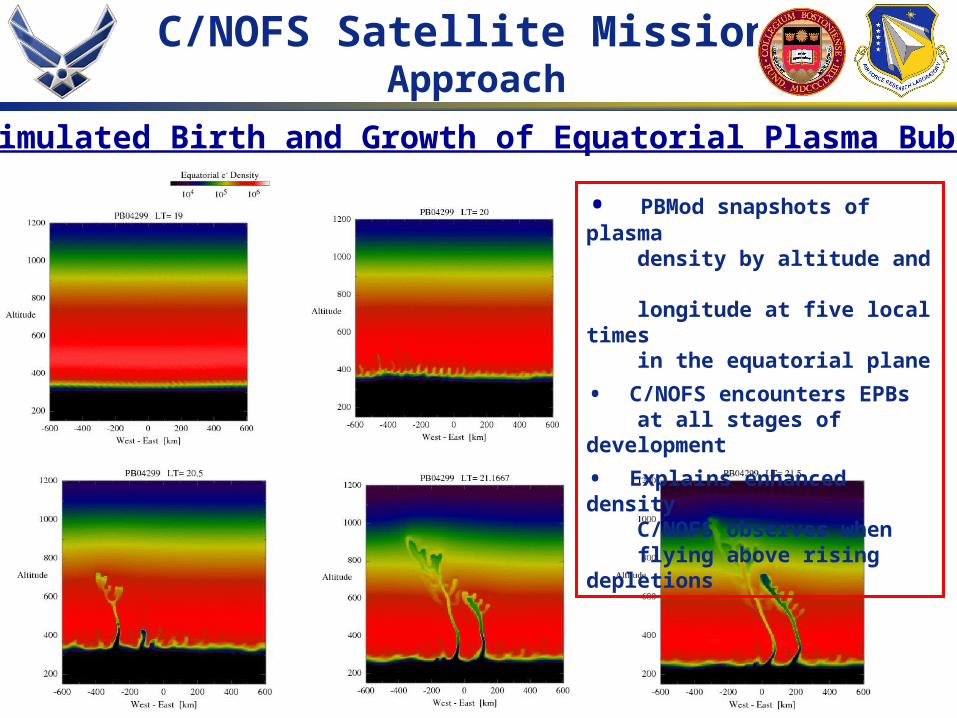
• PBMod snapshots of plasma density by altitude and longitude at five local times in the equatorial plane
• C/NOFS encounters EPBs at all stages of development
• Explains enhanced density C/NOFS observes when flying above rising depletions
Simulated Birth and Growth of Equatorial Plasma Bubbles

C/NOFS Satellite Mission Outline
• Background: (a) Scintillations: A perennial issue(b) The generalized Rayleigh-Taylor instability
(c) Desert Storm: January 1991
(d) Three-pronged approach: SCINDA - C/NOFS - PBMOD
• The Long Wait: 1995 - 2008(a) DMSP as a C/NOFS surrogate
(b) Season-longitude climatology of equatorial plasma bubbles
(c) Stormtime equatorial ionosphere
• Post-C/NOFS launch; April 17, 2008(a) The strange world of deep solar minimum
(b) Season-longitude climatology of deep dawn sector depletions
(c) Revelatory comparison with SCINDA measurements
11

C/NOFS Satellite MissionThe DMSP Surrogate
12
DMSP Observations of EPBs 1989 - 2006
M-0
M-1
M-2
M-3
South EQ North
EPBs observed by DMSP M - 0 if N 2
M - 1 if 2 < N 10 M - 2 if 10 < N 100 M - 3 if N > 100
Year Spacecraft LT (Hr) Orbits EPBs M-0 M-1 M-2 M-31989 F09 21 5121 1109 297 762 50 0
1990 F09 20.9 5091 1089 289 735 62 3
1991 F09 20.7 5040 1024 304 664 55 1
1991 F10 20 4925 675 218 351 86 20
1992 F10 20.7 5043 755 306 406 41 2
1993 F10 21.3 5092 389 186 191 11 1
1994 F10 21.7 3749 121 53 58 10 0
1994 F12 21.4 1575 42 33 8 1 0
1995 F12 21.4 4976 130 51 71 8 0
1996 F12 21.5 5122 73 35 36 2 0
1997 F12 21.4 3343 47 24 23 0 0
1997 F14 20.6 3104 51 18 32 1 0
1998 F12 21.2 4123 283 106 169 7 11998 F14 20.7 4993 275 129 138 8 0
1999 F12 20.8 4290 431 83 330 13 5
1999 F14 20.8 4839 460 167 285 6 2
2000 F12 20.3 4556 637 85 509 41 2
2000 F14 20.7 4969 821 298 493 26 4
2000 F15 21.3 5060 1034 377 620 30 7
2001 F12 19.8 4557 404 60 305 34 5
2001 F14 20.6 4787 861 174 643 38 6
2001 F15 21.5 5095 1014 292 699 20 3
2002 F14 20.3 4889 781 160 563 55 3
2002 F15 21.5 5113 991 279 672 40 0
2003 F14 19.9 4732 156 37 108 5 6
2003 F15 21.4 5149 385 84 275 15 11
2004 F14 19.6 4777 30 10 14 6 0
2004 F15 21.3 5123 267 63 180 14 10
2004 F16 19.9 5131 77 18 51 7 1
2005 F15 20.8 5139 140 56 68 13 3
2005 F16 20.2 5143 64 27 32 5 0
2006 F15 20.3 5130 51 26 25 0 0
2006 F16 20.2 5122 35 21 13 1 0
Totals 154898 14702 4366 9529 711 96

C/NOFS Satellite Mission Outline
• Background: (a) Scintillations: A perennial issue(b) Generalized Rayleigh-Taylor instability
(c) Desert Storm: January 1991
(d) Three-pronged approach: SCINDA - C/NOFS - PBMOD
• The Long Wait: 1995 - 2008(a) DMSP as a C/NOFS surrogate
(b) Season-longitude climatology of equatorial plasma bubbles
(c) Stormtime equatorial ionosphere
• Post-C/NOFS launch; April 17, 2008(a) The strange world of deep solar minimum
(b) Season-longitude climatology of deep dawn sector depletions
(c) Revelatory comparison with SCINDA measurements
13

C/NOFS Satellite Mission Season – Longitude Expectation
Terminator alignment with magnetic field in mid-Atlantic
Equinox Winter Solstice
Season-Longitude Variability of Equatorial Plasma Bubbles
2
1Fn eff
F E
g NU
B N h
E B
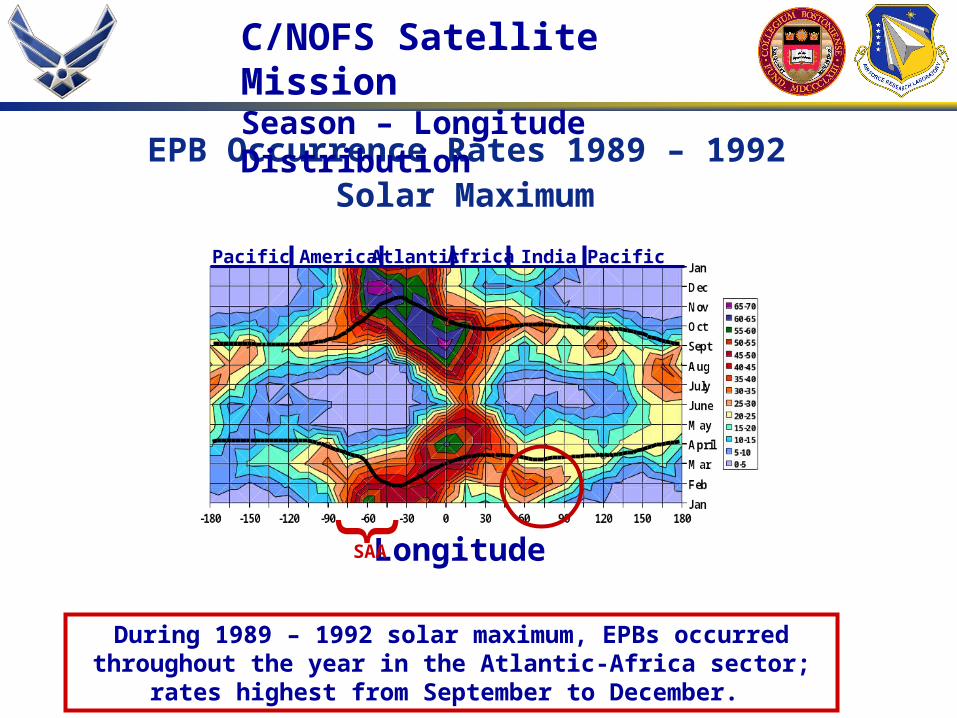
EPB Occurrence Rates 1989 – 1992 Solar Maximum
During 1989 – 1992 solar maximum, EPBs occurred throughout the year in the Atlantic-Africa sector; rates highest from September to December.
C/NOFS Satellite Mission Season – Longitude Distribution
Pacific America Atlantic Africa India Pacific
LongitudeSAA
{

EPB Occurrence Rates 1999 – 2002 Solar Maximum
Pacific America Atlantic Africa India Pacific
LongitudeSAA
{
In 1999 – 2002 solar maximum, EPB occurrence rates are fairly symmetric; high in the America-Atlantic-Africa sector both early and late in the year.
C/NOFS Satellite Mission Season – Longitude Distribution

EPB Occurrence Rates 1994 – 1997 Solar Minimum
Pacific America Atlantic Africa India Pacific
LongitudeSAA {
During 1994 – 1997 solar minimum, EPB occurrence rates were ~ 5% most of the time.
Highest rates were recorded in the America-Atlantic-Africa sector January to March.
C/NOFS Satellite Mission Season – Longitude Distribution
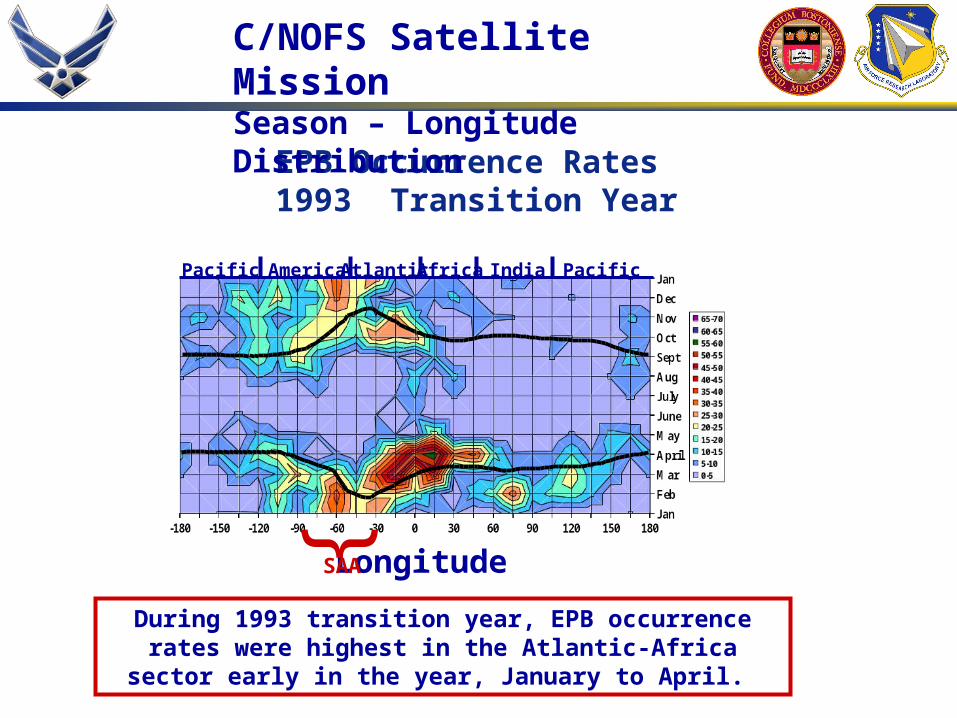
EPB Occurrence Rates 1993 Transition Year
Pacific America Atlantic Africa India Pacific
LongitudeSAA
{
During 1993 transition year, EPB occurrence rates were highest in the Atlantic-Africa sector early in the year, January to April.
C/NOFS Satellite Mission Season – Longitude Distribution

EPB Occurrence Rates 1998 Transition Year
Pacific America Atlantic Africa India Pacific
LongitudeSAA
{
During 1998 transition year, EPB occurrence rates are higher in the America-Atlantic-Africa sector late in the year, September to November.
C/NOFS Satellite Mission Season – Longitude Distribution
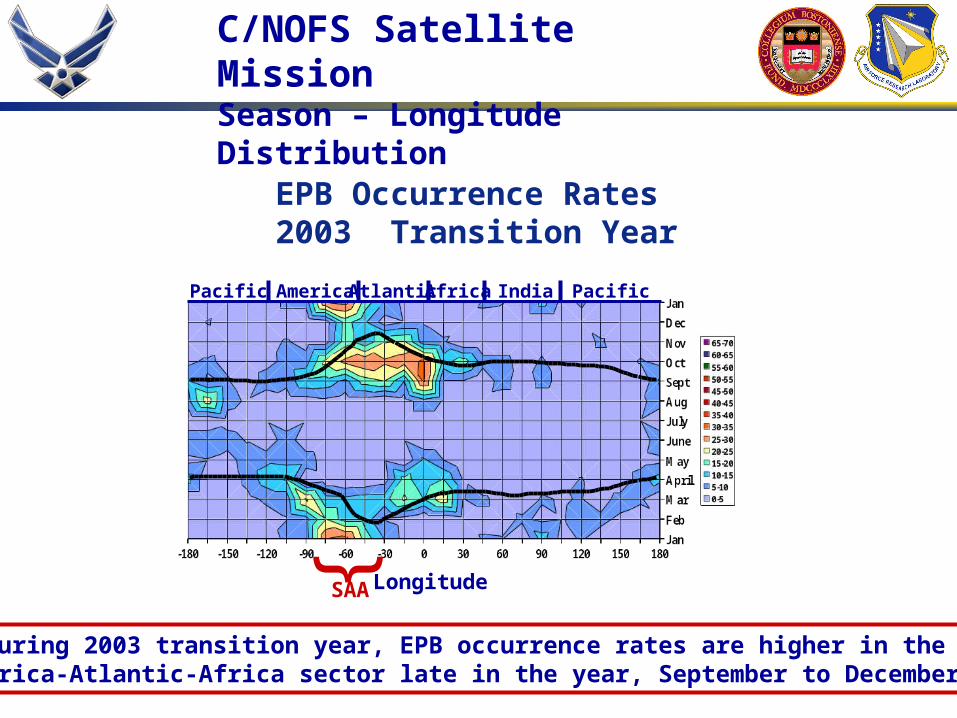
EPB Occurrence Rates 2003 Transition Year
Pacific America Atlantic Africa India Pacific
LongitudeSAA
{
During 2003 transition year, EPB occurrence rates are higher in the America-Atlantic-Africa sector late in the year, September to December.
C/NOFS Satellite Mission Season – Longitude Distribution
C/NOFS Satellite Mission Outline
• Background: (a) Scintillations: A perennial issue(b) Generalized Rayleigh-Taylor instability
(c) Desert Storm: January 1991
(d) Three-pronged approach: SCINDA - C/NOFS - PBMOD
• The Long Wait: 1995 - 2008(a) DMSP as a C/NOFS surrogate
(b) Season-longitude climatology of equatorial plasma bubbles
(c) Stormtime equatorial ionosphere
• Post-C/NOFS launch; April 17, 2008(a) The strange world of deep solar minimum
(b) Season-longitude climatology of deep dawn sector depletions
(c) Revelatory comparison with SCINDA measurements
21
C/NOFS Satellite Mission Stormtime Equatorial Ionosphere
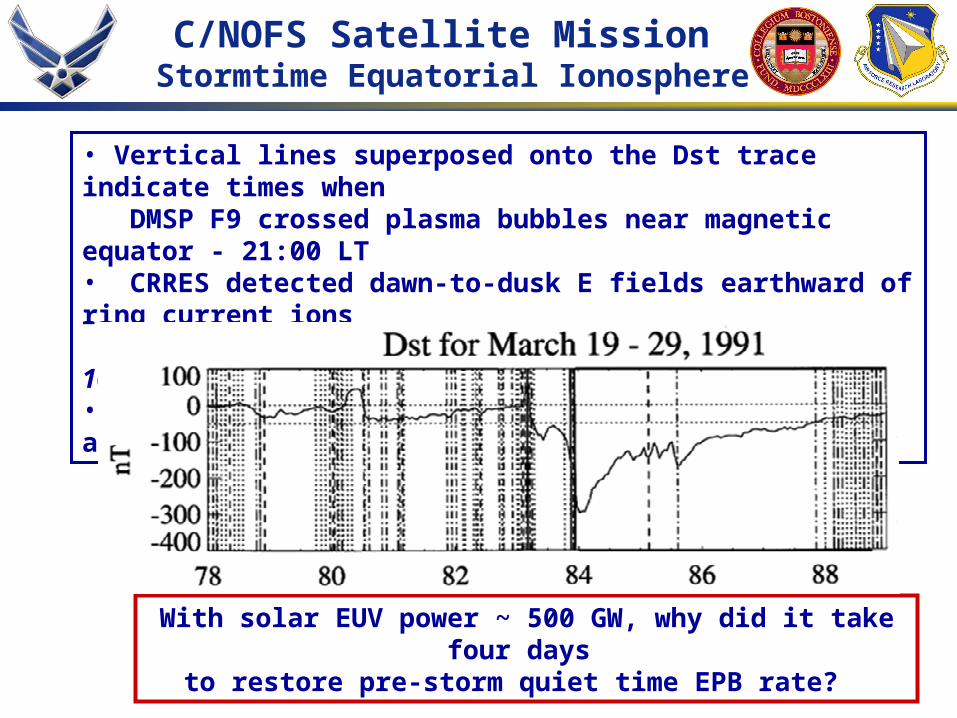
• Vertical lines superposed onto the Dst trace indicate times when DMSP F9 crossed plasma bubbles near magnetic equator - 21:00 LT• CRRES detected dawn-to-dusk E fields earthward of ring current ions at times of all stormtime EPBs [Wygant et al. JGR, 103, 29,527, 1998].• Regular EBP pattern took ~4 days to re-emerge after recovery began.
With solar EUV power ~ 500 GW, why did it take four days to restore pre-storm quiet time EPB rate?

C/NOFS Satellite Mission Outline
• Background: (a) Scintillations: A perennial issue(b) Generalized Rayleigh-Taylor instability
(c) Desert Storm: January 1991
(d) Three-pronged approach: SCINDA - C/NOFS - PBMOD
• The Long Wait: 1995 - 2008(a) DMSP as a C/NOFS surrogate
(b) Season-longitude climatology of equatorial plasma bubbles
(c) Stormtime equatorial ionosphere
• Post-C/NOFS launch; April 17, 2008(a) The strange world of deep solar minimum
(b) Season-longitude climatology of deep dawn sector depletions
(c) Revelatory comparison with SCINDA measurements
23

C/NOFS Satellite Mission Evening Sector Depletions
This solar min: Nothing yet!
DMSP evening sector EPB climatology
for solar max confirmed Tsunoda’s
[1985] model
Most EPBs were observed
in Atlantic-Africa sector
and when terminator
aligned with magnetic field
Previous solar min: Sparse but consistent

C/NOFS Satellite Mission Equatorial Electrodynamics
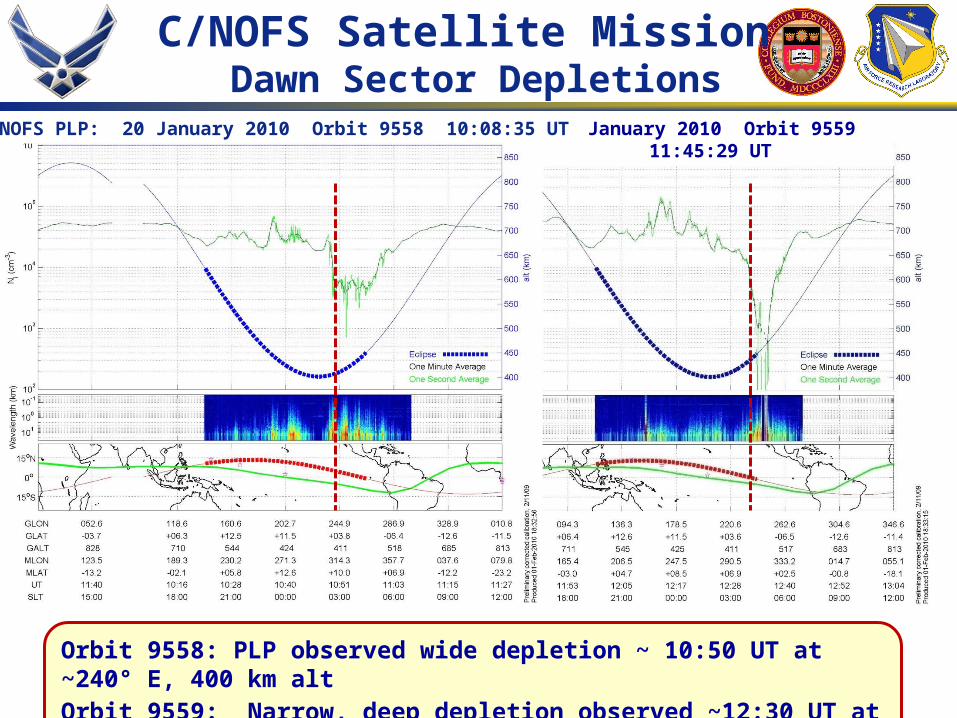
20 January 2010 Orbit 9559 11:45:29 UTC/NOFS PLP: 20 January 2010 Orbit 9558 10:08:35 UT
Orbit 9558: PLP observed wide depletion ~ 10:50 UT at ~240° E, 400 km altOrbit 9559: Narrow, deep depletion at observed ~12:30 UT at ~240° E, 450 km alt
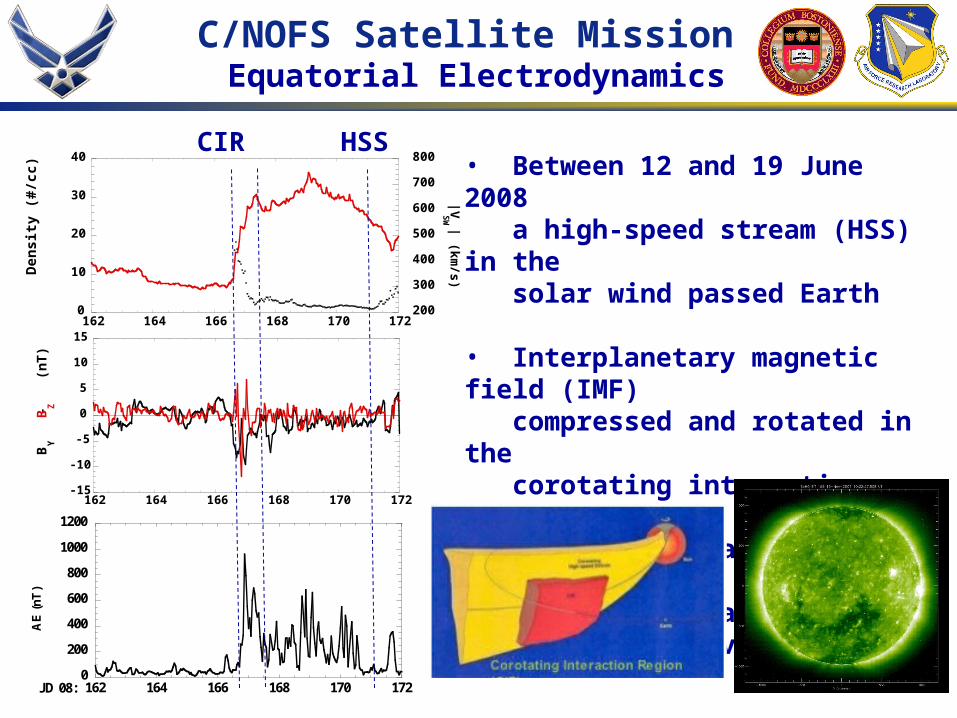
• Between 12 and 19 June 2008 a high-speed stream (HSS) in the solar wind passed Earth
• Interplanetary magnetic field (IMF) compressed and rotated in the corotating interaction region (CIR) at the HSS leading edge
• Excited indicated geomagnetic activity
0
10
20
30
40
200
300
400
500
600
700
800
162 164 166 168 170 172
Den
sity
(#/
cc) |V
SW
| (km
/s)-15
-10
-5
0
5
10
15
162 164 166 168 170 172
BY
-
BZ
(nT
)
0
200
400
600
800
1000
1200
162 164 166 168 170 172
AE
(nT
)
JD 08:
CIR HSS
C/NOFS Satellite Mission Equatorial Electrodynamics
10
100
1000
104
105
106
20:00 21:00 22:00 23:00 24:00
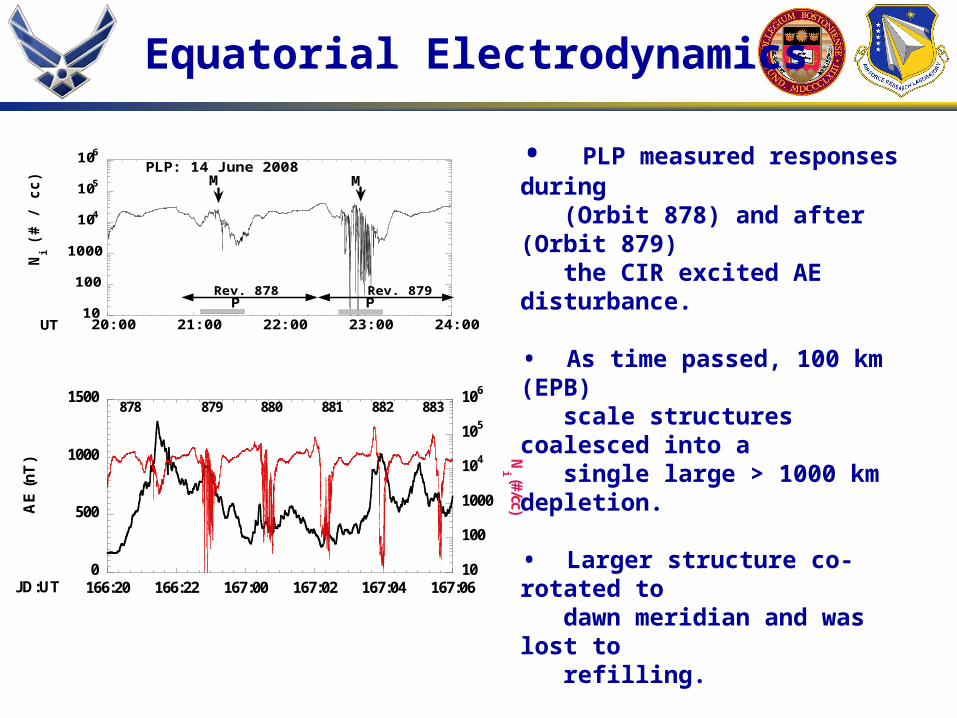
PLP: 14 June 2008
Ni (
# /
cc)
M
UT
M
PPRev. 878 Rev. 879
0
500
1000
1500
10
100
1000
104
105
106
166:20 166:22 167:00 167:02 167:04 167:06
AE
(n
T) N
i (#/cc)
JD:UT
878 879 880 881 882 883
• PLP measured responses during (Orbit 878) and after (Orbit 879) the CIR excited AE disturbance.
• As time passed, 100 km (EPB) scale structures coalesced into a single large > 1000 km depletion.
• Larger structure co-rotated to dawn meridian and was lost to refilling.
• Not all dawn sector depletions have interplanetary sources but appear “spontaneously” probably due to mi (g × B) currents.
Equatorial Electrodynamics
C/NOFS Satellite Mission Outline
• Background: (a) Scintillations: A perennial issue(b) The generalized Rayleigh-Taylor instability
(c) Desert Storm: January 1991
(d) Three-pronged response: SCINDA - C/NOFS - PBMOD
• The Long Wait: 1995 - 2008(a) DMSP as a C/NOFS surrogate
(b) Season-longitude climatology of equatorial plasma bubbles
(c) Comparison with JULIA radar measurements
(d) Stormtime equatorial ionosphere
• Post-C/NOFS launch; April 17, 2008(a) The strange world of deep solar minimum
(b) Season-longitude climatology of deep dawn sector depletions
(c) Revelatory comparison with SCINDA measurements28
20 January 2010 Orbit 9559 11:45:29 UTC/NOFS PLP: 20 January 2010 Orbit 9558 10:08:35 UT
Orbit 9558: PLP observed wide depletion ~ 10:50 UT at ~240° E, 400 km altOrbit 9559: Narrow, deep depletion observed ~12:30 UT at ~240° E, 450 km alt
C/NOFS Satellite Mission Dawn Sector Depletions

UTGLonGLatAlt
C/NOFS
F15 F17
UTGLonGLatAlt
UTGLonGLatAlt
Irregularities observed over 40° in latitude and 20°
in longitude
DMSP and C/NOFS: Latitudinal and Longitudinal Extent
C/NOFS Satellite Mission Dawn Sector Depletions

C/NOFS Satellite Mission Dawn Sector Depletions
DMSP F17 dawn sector EPB rates for 2008 near 5:30 MLT are dramatically different from any evening sector observations. Maximum rates (~ 70%) occur near the June solstice in the America-Atlantic sector. Rates are ~ 30% in the Pacific near the December solstice and < 10% when the dusk terminator aligns with the magnetic field. Dotted lines mark times the dawn terminator aligns with the magnetic field.
C/NOFS Satellite Mission Outline
• Background: (a) Scintillations: A perennial issue(b) The generalized Rayleigh-Taylor instability
(c) Desert Storm: January 1991
(d) Three-pronged response: SCINDA - C/NOFS - PBMOD
• The Long Wait: 1995 - 2008(a) DMSP as a C/NOFS surrogate
(b) Season-longitude climatology of equatorial plasma bubbles
(c) Comparison with JULIA radar measurements
(d) Stormtime equatorial ionosphere
• Post-C/NOFS launch; April 17, 2008(a) The strange world of deep solar minimum
(b) Season-longitude climatology of deep dawn sector depletions
(c) Revelatory comparison with SCINDA measurements32
C/NOFS Satellite Mission
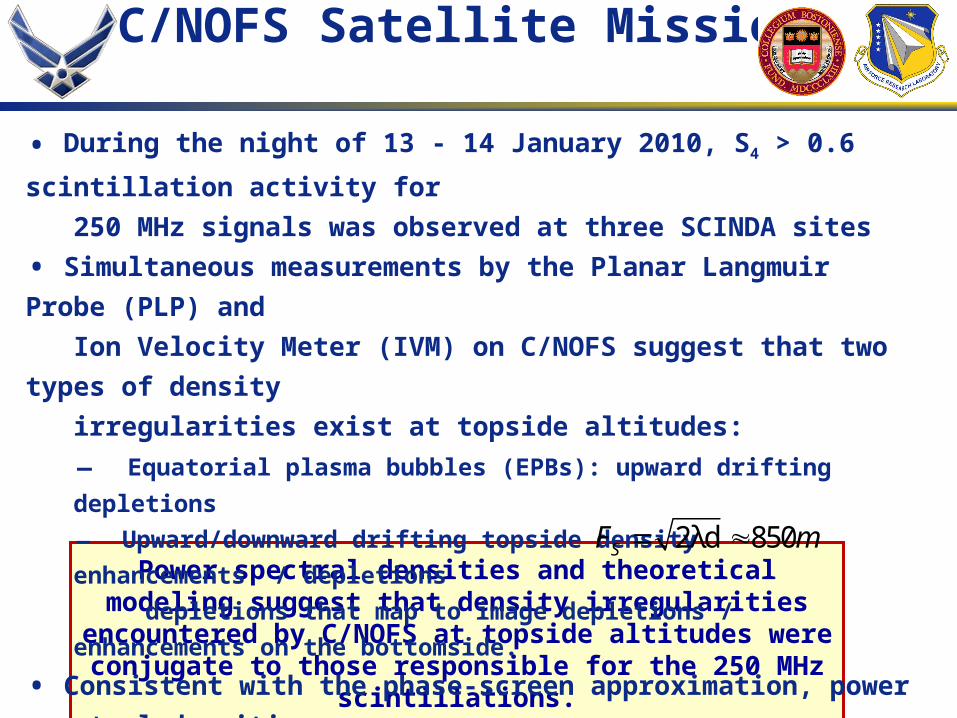
Power spectral densities and theoretical modeling suggest that density irregularities encountered by C/NOFS at topside altitudes
were conjugate to those responsible for the 250 MHz scintillations.
• During the night of 13 - 14 January 2010, S4 > 0.6 scintillation activity for
250 MHz signals was observed at three SCINDA sites
• Simultaneous measurements by the Planar Langmuir Probe (PLP) and
Ion Velocity Meter (IVM) on C/NOFS suggest that two types of density
irregularities exist at topside altitudes:
– Equatorial plasma bubbles (EPBs): upward drifting depletions
– Upward/downward drifting topside density enhancements / depletions
depletions that map to image depletions / enhancements on the bottomside.
• Consistent with the phase-screen approximation, power spectral densities
from PLP and VEFI data streams indicate significant power at Fresnel
scale.
- For 250 MHz carrier and hmF2 300 km, .
2λd 850SF m
C/NOFS Satellite Mission SCINDA - Satellite Comparison
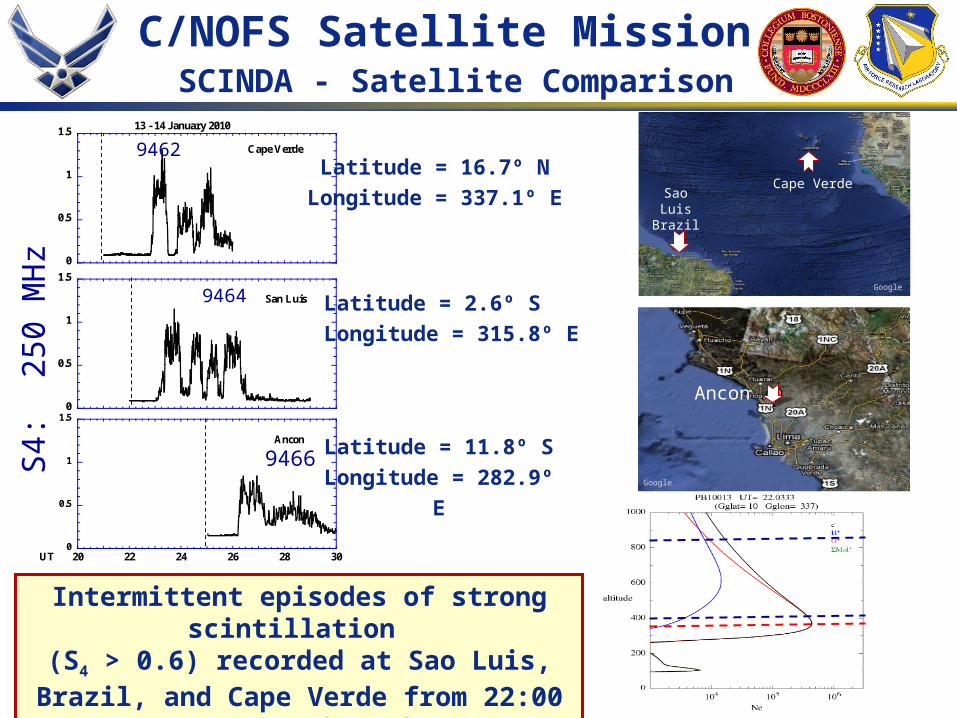
Intermittent episodes of strong scintillation (S4 > 0.6) recorded at Sao Luis, Brazil, and Cape Verde from 22:00 UT on 13 January
through 04:00 UT on 14 January 2010.
Latitude = 2.6º S
Longitude = 315.8º E
0
0.5
1
1.5
Cape Verde
13 - 14 January 2010
0
0.5
1
1.5
San Luis
0
0.5
1
1.5
20 22 24 26 28 30
Ancon
UT
9462
9464
9466 Latitude = 11.8º S
Longitude = 282.9º E
Latitude = 16.7º N
Longitude = 337.1º E
Ancon
S4:
250
MH
z
Sao Luis Brazil
Cape Verde

C/NOFS Satellite Mission SCINDA - Satellite Comparison
Darkness
OrbitMag. Equator
0
5 104
1 105
1.5 105
2 105
2.5 105
3 105
3.5 105
4 105
-150
-100
-50
0
50
100
150
23.2 23.22 23.23 23.25 23.27 23.28 23.3
13 January 2010 23:12 - 23:18 UT
IonDensity (cm^-3) Vz (km/s)
Ion
Den
sity
(cm
-3)
VZ (km
/s)
23:12 23:13 23:14 23:15 23:16 23:17 23:18
• IVM crossed a sequence of upward drifting density depletions with embedded small scale irregularities
• C/NOFS crossed equatorial plasma bubbles at topside altitudes.
• VEFI data indicate return of PRE.
13 January 2010 Orbit 9462 23:05:05 UT
PLP detected density irregularities near perigee while skimming close to the magnetic equator
Fresnel Scale

C/NOFS Satellite Mission SCINDA - Satellite Comparison
Spectral intensity is high at the Fresnel scale (~850 m) inside all depletions.
Densities1 s Resolution
Power at Fresnel scale
Density Variations
Power Spectral Density
13 January 2010 23:10:54 UT
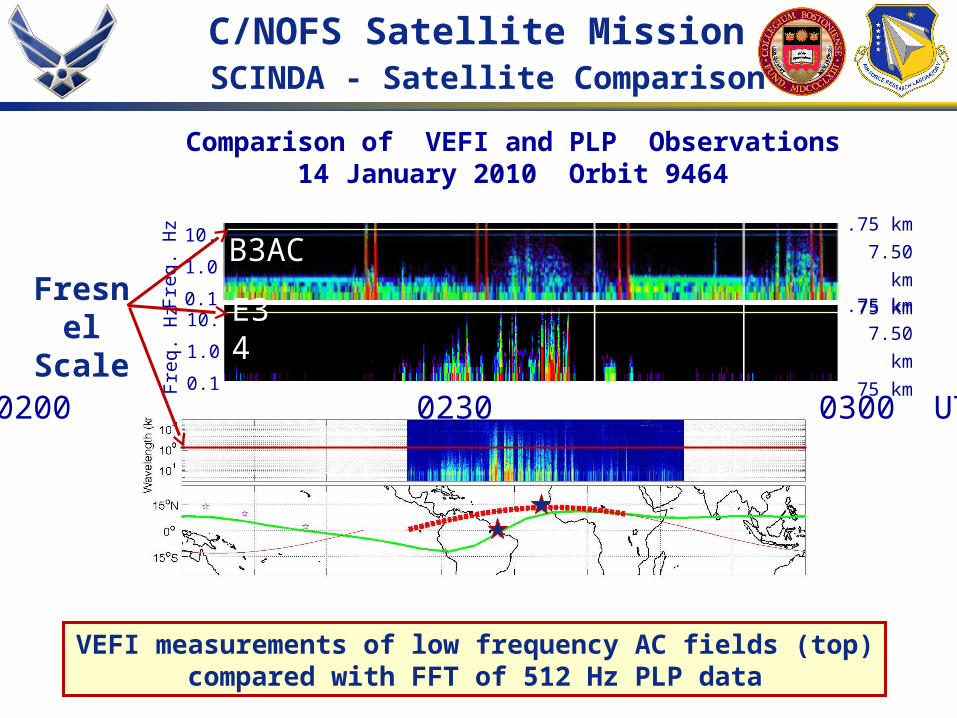
VEFI measurements of low frequency AC fields (top) compared with FFT of 512 Hz PLP data
0200 0230 0300 UT
10.
1.0
0.110.
1.0
0.1
Fre
q. H
zF
req.
Hz
B3AC
E34Fresnel Scale
.75 km
7.50 km
75 km.75 km
7.50 km
75 km
Comparison of VEFI and PLP Observations14 January 2010 Orbit 9464
C/NOFS Satellite Mission SCINDA - Satellite Comparison

C/NOFS Satellite Mission SCINDA - Satellite Comparison
VEFI measures quasi DC E-fields 1024 s-1 that are reported 16 s-1. - Low pass AC fields < 6 Hz. - High pass AC fields 3 to 8,000 Hz (burst data) - Fresnel scale of 850 m corresponds to a frequency of ~ 8 Hz.
FsFsFs
Both plasma densities and AC electric fields showsignificant power at and near the Fresnel scale.
13 January 2010 23:11:51 UT

IVM measurements indicate local depletions moving
downward with respect to plasma on adjacent flux tubes.
0
5 104
1 105
1.5 105
2 105
2.5 105
3 105
3.5 105
-100
-50
0
50
100
2.54 2.56 2.58 2.6 2.62 2.64
14 January 2010 02:32 - 02:39 UT
Ion Density (cm^-3) Vz (km/s)
Ion
Den
sity
(cm
-3)
VZ (km
/s)
02:32:24 02:33:36 02:34:48 02:36 02:37:12 02:38:24
14 January 2010 Orbit 9464 02:18:56 UT
Altitude
Density
Darkness
OrbitMag. Equator
C/NOFS perigee north of the magnetic equator
PLP and IVM Measurements
C/NOFS Satellite MissionSCINDA-Satellite Comparison
Equatorial Electrodynamics
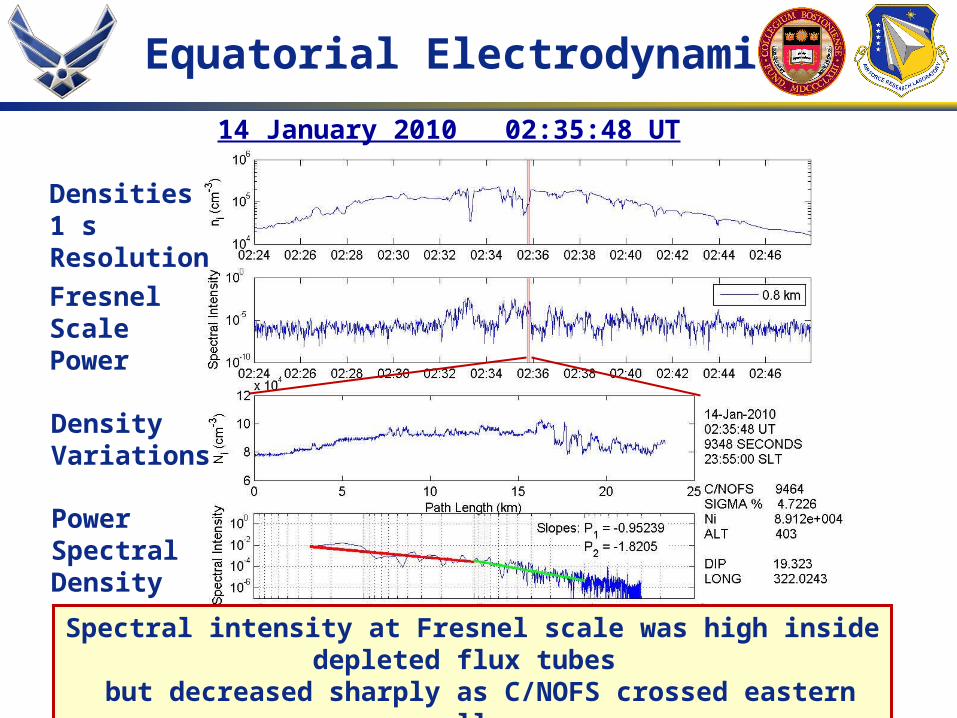
Densities 1 s Resolution
Fresnel Scale Power
Density Variations
Power Spectral Density
14 January 2010 02:35:48 UT
Spectral intensity at Fresnel scale was high inside depleted flux tubes but decreased sharply as C/NOFS crossed eastern walls.
Equatorial Electrodynamics
Darkness
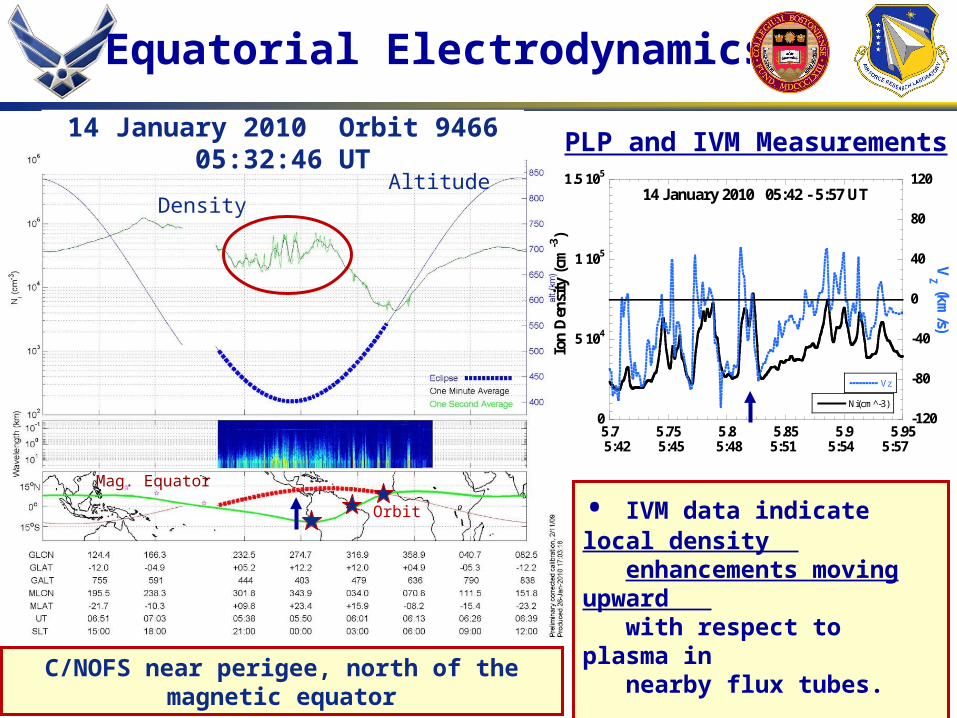
14 January 2010 Orbit 9466 05:32:46 UTAltitude
Density
Orbit
Mag. Equator
• IVM data indicate local density enhancements moving upward with respect to plasma in nearby flux tubes.
• Scintillations at Ancon relatively weak, S4 0.4 AT 05:48 UT.
0
5 104
1 105
1.5 105
-120
-80
-40
0
40
80
120
5.7 5.75 5.8 5.85 5.9 5.95
14 January 2010 05:42 - 5:57 UT
Ni(cm^-3)
Vz
Ion
Den
sity
(cm
-3)
VZ (km
/s)
5:42 5:45 5:48 5:51 5:54 5:57
C/NOFS near perigee, north of the magnetic equator
PLP and IVM Measurements

C/NOFS Satellite Mission SCINDA - Satellite Comparison
Spectral intensity at Fresnel scale relatively high within upward moving density enhancement.
Densities:1 s Resolution
Fresnel Scale Power
Density Variations
Power Spectral Density
0
100
200
300
400
500
600
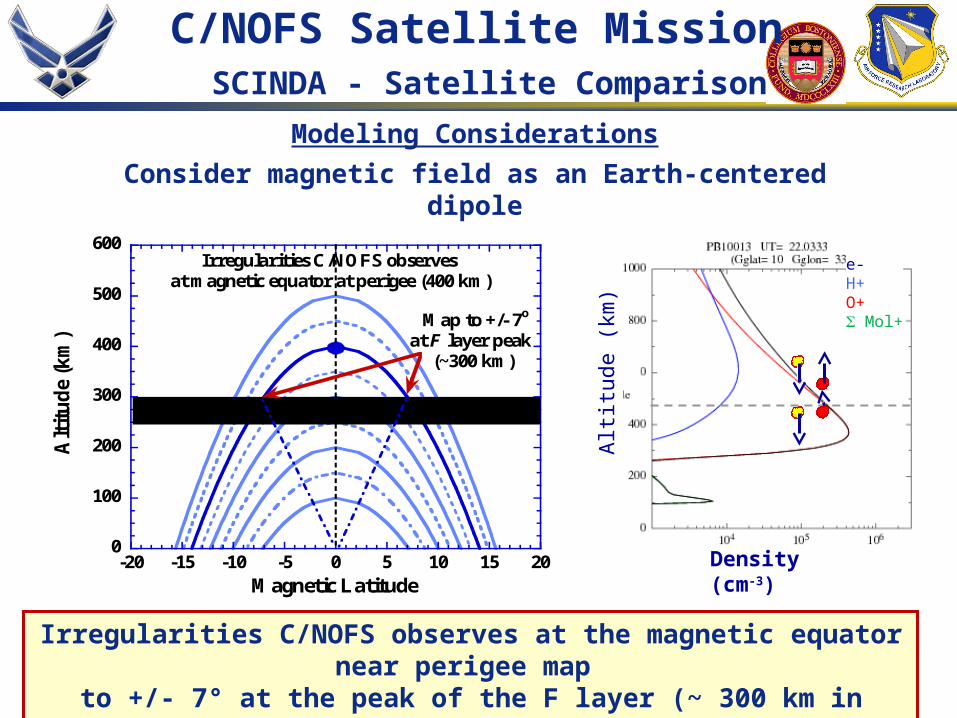
-20 -15 -10 -5 0 5 10 15 20
Alt
itu
de
(km
)
Magnetic Latitude
Map to +/- 7o at F layer peak
(~300 km)
Irregularities C/NOFS observes at magnetic equator at perigee (400 km)
Modeling Considerations
Consider magnetic field as an Earth-centered dipole
Irregularities C/NOFS observes at the magnetic equator near perigee map to +/- 7° at the peak of the F layer (~ 300 km in solar minimum).
C/NOFS Satellite Mission SCINDA - Satellite Comparison
Density (cm-3)
Alt
itud
e (k
m)
e- H+O+ Mol+

B
V
E
Unperturbed Bottomside
Perturbed Bottomside
jg = ni M (g B)/B2
jg = ni M (g B)/B2
VA
magnetic equator
B0
B0
C/NOFS Satellite Mission SCINDA - Satellite Comparison
Transmission Line Modeling Considerations
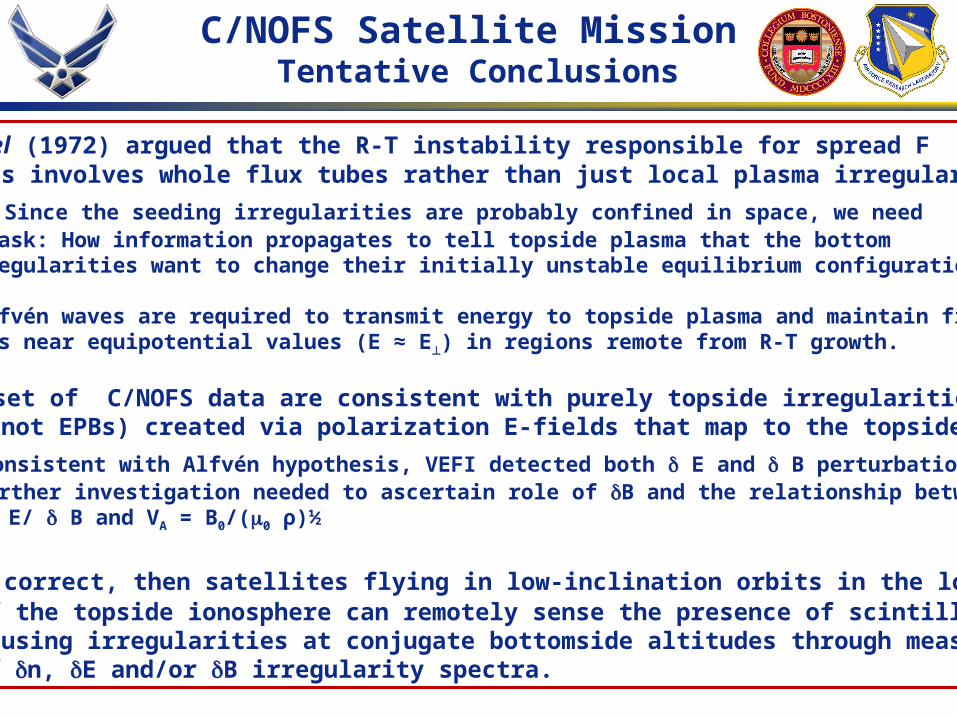
C/NOFS Satellite Mission Tentative Conclusions
• Haerendel (1972) argued that the R-T instability responsible for spread F and EPBs involves whole flux tubes rather than just local plasma irregularities.
- Since the seeding irregularities are probably confined in space, we need to ask: How information propagates to tell topside plasma that the bottom irregularities want to change their initially unstable equilibrium configuration? - Alfvén waves are required to transmit energy to topside plasma and maintain field lines near equipotential values (E ≈ E) in regions remote from R-T growth.
• A subset of C/NOFS data are consistent with purely topside irregularities, (i.e. not EPBs) created via polarization E-fields that map to the topside.
- Consistent with Alfvén hypothesis, VEFI detected both E and B perturbations. - Further investigation needed to ascertain role of B and the relationship between E/ B and VA = B0/(0 ρ)½
• If correct, then satellites flying in low-inclination orbits in the lower reaches of the topside ionosphere can remotely sense the presence of scintillation- causing irregularities at conjugate bottomside altitudes through measurements of n, E and/or B irregularity spectra.