wind energy achievements and benchmarks - nwtc information
TRANSCRIPT

NREL Wind Turbine Condition Monitoring WorkshopOctober 8/9, 2009
Advances in Real Time Wind Turbine Rotor and Tower Monitoring to Reduce the Cost of Energy
Jason WoodHead of Sales, Moog Insensys Ltd

Contents
Why monitor the rotor and blades?
What can be measured?
Sample data and results
Tower Load Monitoring
What is the business case?
What does the future hold?
Slide 2
NREL CM Workshop - October 2009

Why Monitor the Rotor?
Most of the loads on turbine components originate in the rotor:• The loads that generate power• The loads that damage the drive train• The loads that could generate power, but don’t
By measuring these loads, our hypothesis is that we can:• Change operational behaviour and reduce the cost of energy
generated.• Change operational behaviour and improve turbine
reliability/longevity• Validate (or not) design calculations and improve future
turbine designs
Slide 3
NREL CM Workshop - October 2009

What Can Be Measured?
Strains – Time Domain data• Measurement of strain at strategic locations enables
calculation of edgewise and flapwise bending moments, in real time
• Uses strain gauges (resistive or fibre optic)
Resonances – Frequency Domain data• Enables calculations of blade resonances (fundamental
and higher order)• Uses accelerometers, or strain gauges, plus Fourier
Transform techniques
Both techniques can be combined for extra sensitivity and error correction
Slide 4
NREL CM Workshop - October 2009

So What?
As turbines become larger, imbalances, lost generating revenue and blade damage have become much more important O&M issues
Blade bending moments, strains and resonances are related (by more or less complex numerical methods) to:
• Blade mass (e.g. Ice accretion, blade mass imbalances, gross blade damage, hydraulic leaks etc.)
• Blade torque (e.g. Pitch calibration error, stiffness imbalances, aerodynamic imbalances, leading edge wear)
• Asymmetric loading (e.g. Yaw misalignment, Wind shear)• Time domain effects (e.g. Turbulent conditions)• Rotor Bending moment (transmitted to bearings and
gearbox, causing secondary damage over time)
Slide 5
NREL CM Workshop - October 2009

RMS, from Insensys, provides cost-effective, real-time monitoring of the turbine rotor, providing relevant operational information to the turbine OEM / operator, including:
Blade ice detection and measurement Rotor imbalance and Yaw misalignmentBlade damage detection
System can be retrofitted, to existing operational turbines, in 1 or 2 days, without affecting any existing turbine components
System measures the blade root strains at 20-100 Hz, and analyses the data in real time, in both time and frequency domains
Rotor Monitoring System - Overview
6
NREL CM Workshop - October 2009

•All measurements are based on the Insensys fibre optic load sensing technology – all solid state, immune to interference and lightning – 1200+ units installed since 2004
•Communicates with Turbine or Operator SCADA system, 3rd
Party CM system (e.g. SKF WindCon) or direct to customer/Insensys via GSM
•This provides instant feedback on turbine operating parameters, anywhere in the world
•Only requirements from turbine infrastructure are mounting holes and 24V DC power in hub
Rotor Monitoring System - Overview
7
NREL CM Workshop - October 2009

Typical RMS Load Measurement System
Typical instrumentation scheme for Rotor Monitoring Applications
Insensys strain sensors at 4 locations
around blade rootSolid state interrogator
located in hub, with GSM interface
8
NREL CM Workshop - October 2009
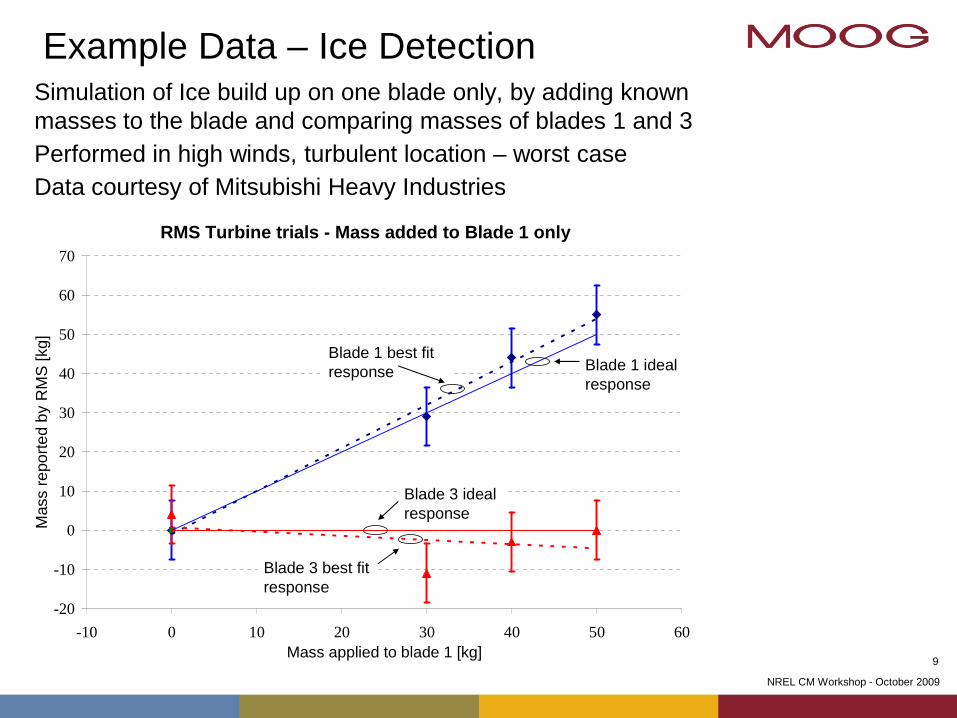
Simulation of Ice build up on one blade only, by adding known masses to the blade and comparing masses of blades 1 and 3Performed in high winds, turbulent location – worst caseData courtesy of Mitsubishi Heavy Industries
Example Data – Ice Detection
RMS Turbine trials - Mass added to Blade 1 only
-20
-10
0
10
20
30
40
50
60
70
-10 0 10 20 30 40 50 60Mass applied to blade 1 [kg]
Mas
s re
porte
d by
RM
S [k
g]
Blade 1 ideal response
Blade 1 best fit response
Blade 3 ideal response
Blade 3 best fit response
9
NREL CM Workshop - October 2009

Ice detection - Example installation and benefits analysis
• Customer observe significant icing on Wind turbines in Northern Germany
• They believe they may be losing generating revenue through un-necessary shutdowns
• Customer funded installation of Insensys RMS system in turbine• System was installed in February 2009• Array of 4 optical strain sensors at blade root• Fibre-optic interrogator located in hub with integral data logger• Data logged for approx. 2 months (March/April 2009) on SD card• Data processed using Insensys Ice Detection Algorithm• Cusomer provided data on icing-related shutdowns (based on Labco
sensor) during March 2009, for comparison• NOTE: No Data from SCADA or Meteorological Data at the time of
processing
10
NREL CM Workshop - October 2009

VESTAS 2009
Icing O&M Strategy
Current O&M Strategy• Stop turbine when ‘icing conditions’ are detected, based on Labko sensor
• Only restart when manual inspection of turbine confirms loss of ice (generally too late, especially in rural settings)
• Customer estimates that they lose at least € 10,000 / WTG / Year due to unnecessary and overlong stoppages when “icing conditions” are detected but an examination shows that none is present
O&M Strategy using Insensys System• Stop WTG only when Blade Mass Ice threshold exceeded, or when Blade
Mass Imbalance threshold exceeded
• System can now measure ice mass even when turbine is stationary
• Start WTG as soon as Blade Mass and Imbalance are within limits
11
NREL CM Workshop - October 2009

• Strain Sensor Signals from one blade – example showing 2 flapwise (red and turquoise) and 2 edgewise (blue and green) traces
• Turbine initially ‘drifting’ very slowly, then starts up
Raw Data Example
Sample number
Stra
in (A
rbitr
ary
units
)
12
NREL CM Workshop - October 2009

Sample Processed Data• Example showing mass changes for the three blades over 11 hours,
including one stoppage for icing. • Resolution is around 0.2 – 0.3% of blade mass, which is about 20 – 30 kg• Signals from the three blades generally track one another well
Sample Number
13
NREL CM Workshop - October 2009

Imbalance
• System detects differences between the blade masses, leading to imbalance• Most turbines have a specification limit on the blade imbalance permitted
Sample Number
Note one blade mass diverging from the others (earlier ice loss?) 20 kg probably not significant,
but 100 kg would be
14
NREL CM Workshop - October 2009

• Example showing single blade mass with Ice Alarm signal, over 35 hours• All negative noise removed• Alarm threshold set at 80 kg of ice sustained for 7 minutes
Sample Alarm threshold Data
Time (total duration 35 hours)
15
NREL CM Workshop - October 2009

Shutdown Results for March 2009Existing “Icing Conditions Detected” System
• ~83 Hours total shutdown in March 2009
Insensys Blade Mass Algorithm - Conservative(80 kg for 7 minutes – equivalent to approx. 4 mm thickness on leading edge)
• ~26 Hours total shutdown in March 2009
DIFFERENCE PER TURBINE
• Approx. 56 Hours in March 2009
Note that Insensys Alarm level is configurable, for example:• Alarm set to 120 kg over 7 minutes ~5 Hours total shutdown in March ‘09
• Alarm set to 180 Kg over 7 minutes ~1.25 Hours total shutdown
16
NREL CM Workshop - October 2009

NREL CM Workshop - October 2009
17
• Blade mass change shown in blue• Comparison between Insensys alarm (red) and Labko alarm (purple) on 12/13th March• Labko alarm appears to shut down when ice mass is reducing, missing peak ice mass• This is a consistent pattern
Comparison Data
Time (total duration 35 hours)
Bla
de m
ass
chan
ge (k
g)
Labko sensor shuts turbine down (purple)
Insensys alarm threshold triggered
(red)
17

NREL CM Workshop - October 2009
18
Comparison Data (cont.)
Time (total duration 35 hours)
Bla
de m
ass
chan
ge (k
g)
• Blade mass change shown in blue• Comparison between Insensys alarm (red) and Labko alarm (purple) on
25/26th March• Again, Labko sensor shuts turbine down when no significant ice mass
observed, but misses peak ice mass
Labko sensor shuts turbine down (purple)
Insensys alarm threshold triggered
(red)

NREL CM Workshop - October 2009
Stationary Blade Ice Mass Measurement (1)
• Algorithm outputs based on static blades during turbine shutdown• Demonstrates that turbine was shut down un-necessarily
19

NREL CM Workshop - October 2009
Stationary Blade Ice Mass Measurement (2)
• Algorithm outputs based on static blades during turbine shutdown• Demonstrates that turbine was shut down un-necessarily
20

NREL CM Workshop - October 2009
21
Comparison Data (cont.)
Time (total duration 38 hours)
Bla
de m
ass
chan
ge (k
g)
• Blade mass change shown in blue• Again, Labko sensor shuts turbine down when no significant ice mass
observed, but misses peak ice mass• Superimposing static algorithm results clearly shows that turbine was shut
down un-necessarily, losing 38 hours of production• Assuming 22% Capacity Factor, and 0.08 Eurocents / kWh, this
shutdown ALONE lost €1340 in generating revenue
Static Mass algorithm shows no significant ice
level throughout shutdown
Insensys alarm threshold triggered
(red)
Operating strategy
Optimal power generation obtained through fully automatic shutdown and restart
• Set thresholds for individual blade mass and blade mass imbalance (can be based on turbine specification or risk-based approach)
• Connect output from Insensys system into turbine control system• Turbine will shut down automatically when a threshold is exceeded
(warnings and alarms can also be seen in the control room)• Blade mass can now be monitored while turbine is stationary, and
alarms can be updated every 15 minutes• Turbine can restart as soon as ice mass and imbalance below
thresholds• Thresholds can be adjusted remotely, if desired
22
NREL CM Workshop - October 2009

Restart strategy
• Insensys have recently developed the ability to measure ice mass while the turbine is stationary, based on processed blade vibrations
• Currently validating with calibrated weights on a 2.4 MW turbine• This considerably simplifies the restart strategy
Theory would predict a square root response
Change in vibration frequency with blade mass from 0 – 100 kg
Frequency
dB (p
ower
)
23
NREL CM Workshop - October 2009

Business Case for OperatorOperator Benefits
• Assume Additional Generation / Turbine / Winter Month (5 months) = 56 Hours
• Assume 2 MW turbine, 35% Capacity Factor and € 0.08 / kWh
• Additional generating revenue therefore approx. € 3,000 / Winter Month
• ANNUAL SAVING OF UP TO € 15,000
• PAYBACK TIME EXPECTED TO BE LESS THAN 1 YEAR
Possible Additional Benefits of RMS System:• SAVINGS on Labour & Transportation for each “icing conditions detected” event
• REDUCTION in Blade Damage from Overloading, due to optimised O&M strategy
• REDUCTION in Drive Train Damage due to Blade Overloading and/or Blade Imbalance
• REDUCTION in long-term O&M Costs
• REDUCTION in potential Health and Safety, Third Party, and adverse Publicity issues
• INCREASE in Generating capacity through reduction in yaw misalignment
24
NREL CM Workshop - October 2009

VESTAS 2009
Business Case for Turbine Manufacturer
Potential Benefits to Turbine Manufacturer of Insensys Ice Detection System (during and after warranty)
• Competitive differentiation, and increased sales price, in cold weather environments
• Optional extra revenue
• T&M costs of blade inspection and resets
• Removal of Labco sensor and associated costs
• Manufacturer aware of true ice build up at an early stage through SCADA and/or Condition Monitoring, if desired
• Manufaturer aware of blade mass Imbalances & gross blade damage. Almost all of these imbalances can quickly and easily be corrected
• Repairs to ice detector
25
NREL CM Workshop - October 2009

Clear increase in noise on raw data caused by turbulent wind (bottom)Higher frequency components could shorten fatigue lifeData courtesy of Garrad Hassan Limited
26
Example Data – Turbulence
NREL CM Workshop - October 2009

Tower Load Monitoring
Increasing interest is currently being seen from WT OEMs for measurement and monitoring of Tower loads.
• As turbines increase in size, as well as loads seen in blades, rotors and drive trains, significant loading can be encountered in the tower structure.
•Tower sway•Tower nod•Rotational loadings (torque) at tower base.
•Some OEM’s are now extensively monitoring tower loads during the prototype phases of their development programmes. Opportunities also exist for operational monitoring of tower loading for O&M reasons (particularly offshore).
•Benefits of fibre optic strain gauges for tower load monitoring•Many multiples of sensors can be incorporated in a single serial cable routing resulting in significantly simpler cable management•Ruggedised deployment make immune from harsh environmental conditions and from EMI concerns.•Sensors can be installed more reliably and cost effectively than other methods
27
NREL CM Workshop - October 2009

28
NREL CM Workshop - October 2009
0 degree axis
-45 degree axis
+45 degree axis
Temp compensation
Typical tower sensor installation
Glass fibre laminate base
FO connection cables
•Sensors typically installed below yaw rings and towards tower base
•At 0, 90, 180 & 270 degree location around cylinder
•Mid height sensors sometimes required
•All sensors connected in series and interrogator unit located in a suitable tower base position.

SO WHAT – How can it save me money?
Data only valuable if converted to information that is used to modify operational strategy
No change in O&M strategy = NO BENEFIT = NO PAYBACK
Most of these features result in direct changes to O&M strategy, and hence, immediate savings
Other, harder to quantify, benefits include R&D design validation and performance comparisons across windfarm
Most operators look for payback of CM systems in 5 years or less
29
NREL CM Workshop - October 2009

Business Case – Ice Detection
Current O&M strategy• Stop turbine either when ‘icing conditions’ are detected (too
early) or when ice loads are so great that turbine can no longer generate (too late)
• Only restart when manual inspection of turbine confirms loss of ice (much too late, especially in rural settings)
Insensys suggested O&M strategy• Only shuts down when blade ice mass threshold exceeded
• Restarts generation as soon as ice no longer present
Operator benefit example• Wind farm in Northern Germany
• Operator estimates reduced revenue due to early shut down and late restart to be $10,000 per turbine in 2008 alone
• Payback in 1-2 years30
NREL CM Workshop - October 2009
Business Case - Yaw Misalignment
Current O&M ActionsNone – not detected, due to inaccuracy of wind vane data –typically +/- 10°A 10° yaw misalignment reduces the effective rotor swept area and reduces power by ~5% when running below rated power (Source: CENER)
O&M Response with Insensys SystemInsensys RMS provides instant feedback on yaw misalignment, which can be fed into control system if desired
Estimated Benefit10° misalignment for 20% of the time results in around $15,000 lost revenue, per 2.5 MW turbine, per year (assuming generation below rated power for 70% of the time)Payback in around 1 year
31
NREL CM Workshop - October 2009

Business Case - Aero / Mass imbalance
Approx. 20% of turbines have a significant mass or aerodynamic imbalance1
Even a pitch calibration error of +/- 1° causes 1-3% reduction in output powerIf not corrected, imbalances can also cause catastrophic damageMany more turbines have significant leading edge erosion– can cause up to 10% reduction in output powerBUT, rarely correctly diagnosed as it happens so slowly:
• Often, the correlation between wind speed and power output is not closely monitored from year to year
• ‘Must be deterioration of the bearings/gearbox/generator’• ‘It doesn’t seem to be as windy this year as it was last’
1. Source – Windguard GmbH. ‘Significant’ means pitch error of 1° or more
32
NREL CM Workshop - October 2009

Business Case - Aero / Mass imbalance
Current O&M ActionsNone, as imbalance not detected until nacelle vibrations become severe
O&M Response with Insensys systemAlmost all imbalances can quickly and easily be corrected
• Corrections of pitch calibration errors takes minutes• Adding mass to balancing chambers in blades• Repairs to leading edge
Estimated Benefit1% increase in output in of 2.5 MW turbine is worth ~ $15,000 per year, per turbine, assuming generating below rated power 70% of the timePayback in around 1 year
33
NREL CM Workshop - October 2009

Business Case – Other Applications
Turbulence• Stop turbine in highly turbulent conditions to prevent
reduction in blade life etc.
• If turbulence caused by wake effects, shut down every other turbine when wind direction dictates
Resonances• Adjust pitch angle, power output and/or yaw angle to move
blades away from resonance and prevent deterioration in residual fatigue life
34
NREL CM Workshop - October 2009

What is the Future of Rotor Monitoring?
Several applications show promise – key is to demonstrate compelling business cases Economic climate demands maximising energy output from turbinesSince the hardware is the same, the business case grows rapidly for each new applicationSeveral other capabilities under development:
• Minor blade damage detection and residual life prediction• Combining Independent Pitch Control, Yaw control and
RMS to automatically correct pitch imbalances, yaw misalignment and torque imbalance
• Lightning detection and measurement
Ultimate goal is that demand drives OEM’s to fit Rotor Monitoring as standard on all machines
35
NREL CM Workshop - October 2009

Thank you!Jason WoodHead of Sales, Moog Insensys
[email protected]@moog.com
www.insensys.comwww.moog.com