wind energy - the facts part ii - home / about the · pdf filewind energy penetration and...
TRANSCRIPT

WIND ENERGY - THE FACTS
PART II
GRID INTEGRATION
1565_Part II.indd 153 2/17/2009 7:11:57 PM

Acknowledgements
Part II was compiled by Frans Van Hulle of EWEA and
Paul Gardner of Garrad Hassan and Partners.
We would like to thank all the peer reviewers for
their valuable advice and for the tremendous effort
that they put into the revision of Part II.
Part II was carefully reviewed by the following
experts:
J. Charles Smith UWIG, USA
Alex De Broe 3E
Ana Estanquiero INETI
Guillaume DUCLOS ENR
1565_Part II.indd 154 2/17/2009 7:12:02 PM

SETTING THE SCENEII.1
Wind Energy Penetration and Integration
In Part II, we consider the large-scale integration of
wind energy in the context that wind will meet a sub-
stantial share of the European electricity demand in
the future. While wind energy will cover around 4 per
cent of electricity demand in 2008, EWEA targets for
2020 and 2030 estimate penetration levels of up to
14 per cent and up to 28 per cent respectively (EWEA,
2008a).
Europe’s wind power resources are enormous and
could easily cover a larger share of the electricity
demand. This is already the case, notably in a few
regions in Germany, Denmark and Spain. The key
issue is how to develop the future power system so
that wind power can be integrated effi ciently and
economically. Since integration efforts, such as costs
and decision-making, are related directly to the pen-
etration level of wind power, it is essential to have a
commonly defi ned term. Wind energy penetration can
be defi ned in a number of ways.
WIND ENERGY PENETRATION
This looks at the percentage of demand covered by
wind energy in a certain region, normally on an annual
basis (see Figure II.1.1).
Wind energy penetration (%)
= Total amount of wind energy produced (TWh) /
Gross annual electricity demand (TWh)
WIND POWER CAPACITY PENETRATION
This looks at how the total installed wind power capa-
city in a certain region is related to the peak load in
this region over a certain time period.
Wind capacity penetration (%)
= Installed wind power capacity (MW) /
Peak load (MW)
MAXIMUM SHARE OF WIND POWER
This looks at the power balance in a certain region,
taking into account the minimum demand, the maxi-
mum wind power generated and the exchange with
neighbouring regions or countries. This fi gure must
remain below 100 per cent to ensure the correct power
balance in the region; the nearer to 100 per cent, the
closer the system is to its limits (when wind power
would need to be curtailed).
Maximum share of wind power
= Maximum wind power generated (MW) /
Minimum load (MW) + power exchange
capacity (MW)
Throughout Part II, when reference is made to wind
power penetration, the fi rst defi nition will be used
unless specifi ed otherwise.
As shown in Figure II.1.1, the wind energy pene-
tration levels vary throughout Europe. For the EU-27,
the overall penetration in 2020 will be around 12–14
per cent according to present EWEA and European
Commission (EC) targets.
Table II.1.1 shows the wind power capacity pene-
tration values (second defi nition), at the beginning of
2007 for a number of countries in the Union for the
Co-ordination of Transmission of Electricity (UCTE)
area. These values are related to the reference load,
as set out in the UCTE System Adequacy Forecast
(January 2007). The installed wind power capacity
refers to the situation at the end of 2006.
The share of wind power (third defi nition) is already
high in certain areas of Europe, for example West
Denmark (57 per cent) and the German state of
1565_Part II.indd 155 2/17/2009 7:12:05 PM

Schleswig-Holstein (44 per cent), but the system can
absorb additional wind power before it reaches full
capacity. However, with increasing amounts of wind
power installed, improvements are required in the
power exchange capacities between various countries.
This will be discussed in more detail later in Part II.
European Policy Framework Relevant for Wind Power Integration
The electricity system in Europe needs to be modifi ed
in order to ensure security of supply, a fair and low elec-
tricity price for the consumer, and sustainable and
climate-friendly electricity generation. These objectives
form the basis of European energy policy. As wind power
will play an ever more important role in the electricity
supply, this section looks at some of the important
policy developments at the EU level which are vital for
the process of grid integration of wind power in Europe.
RENEWABLE ENERGY DIRECTIVE
A new Renewables Directive, agreed by the European
Union in December 2008, sets a 20 per cent target for
the EU as a whole for the share of energy demand to
be covered by renewables by 2020. In order to achieve
this target, the European Commission estimates that
wind power will have to cover 12 per cent of total
European electricity demand by 2020, although the
individual national and sectoral targets have yet to be
established. The Renewables Directive:
stipulates that Member States take ‘the appropri-•
ate steps to develop transmission and distribution
grid infrastructure … to accommodate the further
development’ of renewable electricity; and
includes a clause relating to priority or guaranteed •
access and priority dispatch for wind power and
other renewables, on condition that the reliability
and safety of the grid is maintained.
Table II.1.1: Wind power capacity penetrations in various
European countries
Reference load (GW)
Wind power capacity (GW)
Capacity penetration
West Denmark 3.8 2.5 66%
Germany 74.0 20.6 28%
Spain 43.0 11.6 27%
Portugal 8.5 1.7 20%
The Netherlands 16.1 1.6 10%
France 80.0 1.6 2%
Source: EWEA
Figure II.1.1: Overview of wind energy penetration levels in
Europe at the end of 2007
Denmark
Spain
Por tugal
Ireland
Germany
EU-27
Greece
Netherlands
Austria
UK
Estonia
Italy
Sweden
France
Lithuania
Luxembourg
Latvia
Belgium
Bulgaria
Poland
Czech republic
Hungary
Finland
Slovakia
Romania
Slovenia
Malta
Cyprus
21.3%
11.8%
9.3%
8.4%
7.0%
3.8%
3.7%
3.4%
3.3%
1.8%
1.8%
1.7%
1.3%
1.2%
1.1%
1.1%
0.9%
0.7%
0.5%
0.4%
0.4%
0.4%
0.3%
0.0%
0.0%
0.0%
0.0%
0.0%
Source: EWEA (2008a)
156 WIND ENERGY - THE FACTS - GRID INTEGRATION
1565_Part II.indd 156 2/17/2009 7:12:05 PM

INTERNAL ELECTRICITY MARKET LEGISLATION
A series of legal measures (the so-called ‘Third
Liberalisation Package’) were proposed in 2008. The
intention is to create a single electricity market in
Europe, with more coordinated regulation, improved
system operation at international level and fair access
for renewable energy sources (RES) generators. The
measures include stronger international cooperation
of transmission system operators (TSOs) under the
European Network of Transmission System Operators
for Electricity (ENTSO).
In principle, this could provide a changed framework
for the future development of harmonised grid codes in
the coming years. The implementation of the proposed
Liberalisation Package could also improve the inter-
connection between Member States. The future
Agency for the Coordination of Energy Regulators in
Europe (ACER), as proposed by the Liberalisation
Package, needs to ensure that TSOs submit appropri-
ate transmission development plans and that the regu-
lation in the market is improved, strengthened and
harmonised.
THE TEN-E PROGRAMME
The Trans-European Energy Networks (TEN–E) pro-
gramme addresses transmission development issues
at the European level, in order to support the further
development of the internal electricity market. A Green
Paper on transmission issues was published in the
third quarter of 2008, which will form the basis for
European policies for transmission development and
should give guidance on the national policy frame-
works. The TEN-E programme is currently being com-
plemented by a European Commission initiative to
explore and possibly implement grid reinforcements,
including offshore grid transmission lines to enable
the connection of the predicted offshore wind power
capacity. A European coordinator has been appointed
for this purpose.
Brief Outline of the Main Integration Issues
Given the current levels of wind power connected to
electricity systems, it is clearly feasible to integrate
wind power to a signifi cant extent without major sys-
tem changes. The 60 GW of wind power already
installed in Europe shows:
areas of high, medium and low penetration levels;•
where different conditions exist; and•
where bottlenecks and challenges occur.•
Wind power as a generation source has specifi c char-
acteristics, including variability, geographical distribution,
favourable economics, and, above all, abundance and
environmental benefi ts. Large-scale integration of both
onshore and offshore wind raises challenges for the vari-
ous stakeholders involved, ranging from generation, trans-
mission and distribution to power trading and consumers.
In order to integrate wind power successfully, a number
of issues need to be addressed in the following areas:
design and operation of the power system:• reserve
capacities and balance management, short-term
forecasting of wind power, demand-side management
and storage, and optimisation of system fl exibility;
grid infrastructure issues:• optimisation of present
infrastructure, extensions and reinforcements,
offshore grids, and improved interconnection;
grid connection of wind power:• grid codes, power
quality and wind power plant capabilities;
market redesign issues:• market aggregation and
adapted market rules increasing the market fl exibil-
ity, particularly for cross-border exchange and oper-
ating the system closer to the delivery hour; and
institutional issues:• stakeholder incentives, non-
discriminatory third party grid access and sociali-
sation of costs.
WIND ENERGY - THE FACTS - SETTING THE SCENE 157
1565_Part II.indd 157 2/17/2009 7:12:05 PM

WIND POWER VARIABILITY AND IMPACTS ON POWER SYSTEMS
II.2
A wind farm does not operate all the time, so backup
capacity is needed for when it does not and differences
between forecast and actual production have to be bal-
anced. Balancing and backup come at a cost, as does
building new infrastructure. These facts apply to wind
energy just as they apply to other power producing tech-
nologies that we integrate into the electricity grids. But
for reasons that are diffi cult to grasp, balancing and
backup of wind energy is generally perceived to be prob-
lematic whereas balancing and backup for other tech-
nologies seems as easy as breathing. Certainly, most of
the mainstream media does not fi nd it interesting to
report the complexities of balancing a constant supply
of nuclear power or infl exible coal-fi red power against
the demand from millions of consumers, with their con-
stantly changing and unpredictable demands for power.
There is nothing simple about operating a power
grid. Delivering electricity to consumers is a logistical
challenge larger than for any other product market.
Transmission system operators (TSOs) are tasked with
delivering an invisible product, which cannot be stored,
to customers who expect to receive it at the exact
same second they need it. Grid operation is just-in-
time management in its most extreme form; when you
think about it, it seems an unrealistic task for anybody
to undertake. Nevertheless, European grid operators
are simultaneously servicing 500 million fi ckle con-
sumers with unpredictable behaviour every second of
every hour of every day. They have done so for a hun-
dred years with minimal supply disruption. If it was not
for the fact that we experience it every day, we would
say that it was impossible.
Just like an individual consumer, a wind turbine is
variable in output and less predictable than most other
technologies. However, from a system operations per-
spective, the supply behaviour of a single wind farm is
just as irrelevant as the demand behaviour of a person.
The collective behaviour of consumers and the collec-
tive behaviour of all generating plants are what mat-
ters. That has been the guiding principle of grid
operation since its inception and is likely to remain so
regardless of which technologies we use. If operating
a grid is inherently diffi cult, we are fortunate in having
system operators in Europe who understand what the
rest of us fi nd diffi cult to comprehend. Wind power is,
admittedly, different from other power technologies,
and integrating large amounts of it in the existing
power system is a challenge. But whatever the gener-
ating technology, the basic principles of balancing,
backing up, aggregation and forecasting still apply.
Changes to the way we construct and operate the
future European electricity grids are still needed if we
are to meet one-third of Europe’s power demand with
renewables within 12 years, as projected by the
European Commission. But the challenge is by no
means any greater or more costly than the one system
operators faced when politicians thought that nuclear
was the answer and expanded its share to 30 per cent
of European demand in two decades. Today the answer
happens to be wind, and of course the grid needs to be
adapted to that new reality.
TSOs employ some of the most skilled people in the
power sector. Nevertheless, they too need practical
experience to acquire knowledge when new technolo-
gies are introduced in large amounts. European TSOs
are gaining vast experience and knowledge about
managing over 30 per cent wind power shares for long
periods of time. In Denmark, a mind-blowing 140 per
cent is sometimes managed.
Understanding Variable Output Characteristics of Wind Power: Variability and Predictability
WIND POWER: A VARIABLE OUTPUT SOURCE EMBEDDED IN A VARIABLE ELECTRICITY SYSTEM
Since wind energy is a technology of variable output, it
needs to be considered as just one aspect of a variable,
1565_Part II.indd 158 2/17/2009 7:12:05 PM

dynamic electricity system. At modest penetration
levels, the variability of wind is dwarfed by the normal
variations of the load. It is impossible to analyse wind
power in isolation from other parts of the electricity
system, and all systems differ. The size and the inher-
ent fl exibility of the power system are crucial aspects
in determining the system’s capacity to accommodate
a large amount of wind power.
The variability of wind energy needs to be examined
in the wider context of the power system, rather than at
the individual wind farm or wind turbine level. The wind
does not blow continuously at any particular site, but
there is little overall impact if the wind stops blowing in
a certain area, as it is always blowing elsewhere. This
lack of correlation means that at the system level, wind
can be harnessed to provide stable output regardless of
the fact that wind is not available all the time at any
particular site. So in terms of overall power supply, it is
largely irrelevant to consider the curve when a wind
power plant produces zero power for a time, due to local
wind conditions. Moreover, until wind becomes a sig-
nifi cant producer (supplying around 10 per cent of elec-
tricity demand), there is a negligible impact on net load
variability.
Wind power varies over time, mainly under the
infl uence of meteorological fl uctuations. The variations
occur on all timescales: seconds, minutes, hours, days,
months, seasons and years. Understanding these
variations and their predictability is of key importance
for the integration and optimal utilisation of wind in
the power system. Electric power systems are inher-
ently variable in terms of both demand and supply, but
they are designed to cope effectively with these varia-
tions through their confi guration, control systems and
interconnection.
SHORT-TERM VARIABILITY
The analysis of data available from operating wind
farms and meteorological measurements at typical
wind farm locations allows us to quantify the varia-
tions in net wind power output that can be expected
for a given time period (within the minute or hour, or
during the course of several hours). The distinction
between these specifi c timescales is made since this
type of information corresponds to the various types of
power plants for balancing. The results from analyses
show that the power system can handle this short-
term variability well. System operators only need to
deal with the net output of large groups of wind farms,
and the wind power variability is viewed in relation to
the level and variation in power demand.
Variations within the Minute
The fast variations (seconds to minute) of aggregated
wind power output (as a consequence of turbulence or
transient events) are quite small, due to the aggrega-
tion of wind turbines and wind farms, and hardly impact
the system.
Variations within the Hour
The variations within an hour are much more signifi -
cant for the system. However, they should always be
Box II.2.1: Variable output versus intermittency
Wind power is sometimes incorrectly considered as an intermittent energy source; however, this is misleading. At power system level, wind power does not start and stop at irregular intervals (a characteristic of conventional generation), as is suggested by the term intermittent. Even in extreme conditions, such as storms, it takes hours for wind turbines in a system area to shut down, Moreover, periods with zero wind power production are predictable and the transition to zero power is gradual.
Also worthwhile considering is the technical availability of wind turbines, which is at a very high level (98 per cent) compared to other technologies. Another advantage of wind power in this respect is its modular and distributed installation in the power system. Breakdown of a single unit has a negligible effect on overall availability.
So, the term ‘intermittent’ is inappropriate for system-wide wind power and the term ‘variable output’ should be used instead.
WIND ENERGY - THE FACTS - WIND POWER VARIABILITY AND IMPACTS ON POWER SYSTEMS 159
1565_Part II.indd 159 2/17/2009 7:12:05 PM

considered in relation to demand fl uctuations. Local
variations are largely equal to geographical diversity,
and will generally remain inside ±5 per cent of installed
wind power capacity at the regional level.
The most signifi cant variations arise from the pas-
sage of storm fronts, when wind turbines reach their
storm limit (cut-out wind speed) and shut down rapidly
from full to zero power. However, due to the averaging
effect across a wind farm, the overall power output
takes several minutes to reduce to zero. And in general,
this is only signifi cant in relatively small geographical
areas, since in larger areas it takes hours for the wind
power capacity to cease during a storm. For example,
in Denmark – a small geographical area – on 8 January
2005, during one of the biggest storms for decades,
it took six hours for the installed wind power in the
West Denmark area to drop from 2000 to 200 MW
(5 MW/minute) (see Figure II.2.1). The passage of a
storm front can be predicted and technical solutions
are available to reduce the steep gradient, such as the
provision of wind turbines with storm control.1
These intra-hour variations will be an issue for power
system reserves used for balancing when wind power
penetration reaches the point at which variations in
supply are equal to variations in demand (when 5–10
per cent of annual electricity demand is produced by
wind power).
Variations from Hour to Hour
The variations between forecast and actual wind energy
production several hours ahead affect the scheduling
of the power system. For system operation, the varia-
tion in itself is not a problem; it is the uncertainty of
how accurately the variation can be predicted that is
signifi cant. The uncertainty of wind power predictions
should always be considered in relation to the errors in
demand forecasts. There is much work being conducted
in this area and it is clear that solutions are available.
LONG-TERM VARIABILITY
The slower or long-term variations of wind power rele-
vant for integration in the power system include the
seasonal and inter-annual variations, caused by cli-
matic effects. These are not particularly important for
Figure II.2.1: Denmark: The storm on 8 January is recorded between hours 128 and 139
4000.0
3500.0
3000.0
2500.0
2000.0
1500.0
1000.0
500.0
0.01 21 41 61 81 101 121 141 161 181 201 221 241 261 281 301 321 341 361 381 401 421 441 461 481 501
WindLoad(MW)
Source: www.energinet.dk
160 WIND ENERGY - THE FACTS - GRID INTEGRATION
1565_Part II.indd 160 2/17/2009 7:12:05 PM

the daily operation and management of the grid, but
play a role in strategic power system planning.
Monthly and Seasonal Variations
These variations are important for electricity traders
that have to deal with electricity forward contracts,
where wind power volume has an infl uence on price.
They are also important for power system planning.
However, it appears that for both electricity trading
and system planning purposes, these deviations,
resulting from annual statistics of wind power pro-
duced, can be suffi ciently hedged.
Inter-annual Variations
These variations are relevant for long-term system
planning, rather than daily power system operation.
The annual variability of long-term mean wind speeds
at sites across Europe tends to be similar, and can be
characterised by a normal distribution with a standard
deviation of 6 per cent. The inter-annual variability of
the wind resource is less than the variability of hydro
infl ow. In addition, at the power system level, the annual
variations are infl uenced by the market growth of wind
power and the projected onshore/offshore ratio.
EFFECTS OF AGGREGATION AND GEOGRAPHICAL DISPERSION
Due to the wide regional distribution of wind plants,
short-term and local wind fl uctuations are not corre-
lated and therefore largely balance each other out. As
a result, the maximum amplitudes of wind power
fl uctuations experienced in the power system are
reduced. This phenomenon has been extensively stud-
ied throughout Europe.
Whereas a single wind farm can exhibit hour to hour
power swings of up to 60 per cent of capacity, the
maximum hourly variation of 350 MW of aggregated
wind farms in Germany does not exceed 20 per cent
(ISET, 2004). For larger areas, such as the Nordel sys-
tem, which covers four countries, the largest hourly
variations would be less than 10 per cent of installed
Figure II.2.2: Average, maximum and minimum values of monthly capacity factors, Germany, 1990–2003, showing the
long-term pattern of wind power variability
50
40
30
20
10
0Jan
Maximum values1990–2003Mean values1990–2003Minimum values1990–2003
Feb Mar Apr May Jun Jul Aug Sep Oct Nov Dec
Cap
acity
fac
tor
(%)
Source: ISET (2004)
WIND ENERGY - THE FACTS - WIND POWER VARIABILITY AND IMPACTS ON POWER SYSTEMS 161
1565_Part II.indd 161 2/17/2009 7:12:05 PM

wind power capacity if the capacity was distributed
throughout all the countries. The geographical spread
of wind farms across a power system is a highly effec-
tive way to deal with the issue of short-term variabil-
ity: the more widespread the wind farms, the lower the
impact from variability on system operation.
The effect of reduced wind power variability
increases with the size of the area considered. Ideally,
to maximise the smoothening effect, the wind speeds
occurring in different parts of the system should be as
uncorrelated as possible. Due to the typical sizes of
weather patterns, the scale of aggregation needed to
absorb a storm front is in the order of 1500 km. By
aggregating wind power over large regions of Europe,
the system can benefi t from the complementarities of
cyclones and anticyclones over Europe (Figure II.2.3).
The economic case for smoothing wind power fl uctua-
tions by utilising transmission capacity (rather than by
other means) is an important area of investigation, for
example in the TradeWind project.2
In addition to the advantage of reducing the fl uctua-
tions, the effect of geographically aggregating wind
farm output is an increased amount of fi rm wind power
capacity in the system. This will be explained further
in Chapter II.6.
LOAD DURATION CURVE
One method of representing the smoothing effect of
aggregation on system scale is the load duration curve
of wind farms, which gives the frequency distribution
of the partial load states of generated wind power
(see Figure II.2.5). The effect of aggregating wind
power is a fl attening of the duration curve. This means
that when wind power is aggregated over a large area:
the effective number of hours when wind power is •
available increases; and
the number of hours with zero or low power dimin-•
ishes, while the maximum value of instantaneous
aggregated power produced is decreasing.
Figure II.2.3: Example of smoothing effect by geographical dispersion
100%
90%
80%
70%
60%
50%
40%
30%
20%
10%
0%
Netherlands 7000 MWBeNeLux+France+Germany 111,500 MW
UCTE 226,000 MW
UCTE+GB+Nordel268,300 MW
1 169 337 505 673
December 2000 wind speeds, 2030 MW amounts
Note: The fi gure compares the hourly output of wind power capacity in four situations, calculated with simulated wind power. The simulations are based on December 2000 wind speeds and wind power capacity estimated for the year 2030.
Source: www.trade-wind.eu
162 WIND ENERGY - THE FACTS - GRID INTEGRATION
1565_Part II.indd 162 2/17/2009 7:12:06 PM

Figure II.2.4: Combined wind energy production from Europe and Northern Africa (Morocco) produces a monthly pattern that
matches demand in Europe and Norway
1.0
0.9
0.8
0.7
0.6
0.5
0.4
0.3
0.2
0.1
0.01 2 3 4 5 6 7 8 9 10 11 12
Months
1.5
1.2
0.9
0.6
0.3
0.0
Mon
thly
mea
n W
T –
Pow
er (P M
ean/
P rat
ed)
Mon
thly
mea
n el
ectr
ic d
eman
d (P
Mea
n/P r
ated
)
Combination of production in all regions Electric demand within EU and Norway
Source: Czisch (2001)
Figure II.2.5: Duration curves for the ‘wind year 2000’, Denmark and Nordic countries, assuming equal wind capacity in each
of the four countries
100%
80%
60%
40%
20%
0%0
Nordic, average27%
DK West, average25%
Single turbine,average 26%
1000 2000 3000 4000 5000 6000 7000 8000 9000
Prod
uctio
n %
of ca
paci
ty
Hours
Source: Holttinen et al. (2007)
WIND ENERGY - THE FACTS - WIND POWER VARIABILITY AND IMPACTS ON POWER SYSTEMS 163
1565_Part II.indd 163 2/17/2009 7:12:06 PM

As part of the TradeWind project, a simulation was
made for the EU-27, with an assumed wind capacity
distribution for 2020 and 2030. The effect of geograph-
ical aggregation means that the maximum aggregated
instantaneous wind power is only 60 per cent of the
total capacity of 200 GW (Tande et al., 2008).
THE NEED FOR INTERCONNECTION
It is impossible to optimally aggregate large-scale
wind power without a suitably interconnected grid. In
this context, the grid plays a crucial role in aggregat-
ing the various wind farm outputs installed at a vari-
ety of geographical locations, with different weather
patterns. The larger the integrated grid – especially
beyond national borders – the more pronounced this
effect becomes. This effect is equivalent to using the
grid to aggregate demand over interconnected areas.
In order to make best use of this effect, the present
transmission system in Europe needs to be upgraded.
Ideally, the interconnection capacity should be
increased, and the rules governing the power exchange
between countries should be adapted to ensure that
interconnectors are always available for physical fl ow.
Variability Versus Predictability of Wind Power Production
Accurate forecasts of the likely wind power output, in
the time intervals relevant for generation and trans-
mission capacity scheduling, allow system operators
and dispatch personnel to manage the variability of
wind power in the system. Predictability is key to
managing wind power’s variability and improved accu-
racy of wind power prediction has a benefi cial effect
on the amount of balancing reserves needed, so the
accurate forecasting of wind power is important for
its economic integration into the power system.
Today, wind energy forecasting uses sophisticated
numerical weather forecast models, wind power plant
generation models and statistical methods to predict
generation at 5-minute to 1-hour intervals, over periods
of up to 48 to 72 hours in advance and for seasonal
and annual periods.
Forecasting wind power production differs from
forecasting other generation forms or forecasting the
load.3 Wind, being a natural phenomenon, is better
suited to reliable statistical treatment and physical
forecasting than conventional plants which are sub-
ject to physical faults.
Wind power prediction can be quite accurate for
aggregated wind power, as the variations are levelled
out; and the larger the area, the better the overall pre-
diction. The extent to which prediction error decreases
with the size of the region4 considered is shown in
Figure II.2.6. It should be noted that the forecast accu-
racy is reduced for longer prediction periods.
The quality of the short-term forecast should be
considered in relation to the gate closure times in the
power market. Reducing the time needed between
scheduling supply to the market and actual delivery
Figure II.2.6: Decrease of forecast error of prediction for
aggregated wind power production, due to spatial
smoothing effect
1
0.8
0.6
0.4
0.2
00 500 1000 1500 2000
Region size (km)
Erro
r re
duct
ion
Source: Energy and Meteo Systems
164 WIND ENERGY - THE FACTS - GRID INTEGRATION
1565_Part II.indd 164 2/17/2009 7:12:06 PM

(gate closure time) would allow shorter-term forecasts
to be used, which could dramatically reduce unpre-
dicted variability and lead to more effi cient system
operation without compromising system security.
Changing from day-ahead to intraday commitments
has a dramatic impact on accuracy and the cost of
balancing the system. It is important to understand
that for system operation, it is not just wind forecast-
ing accuracy that is relevant for balancing the system,
but also the sum of all demand and supply forecast
errors relevant for system operation.
Impacts of Wind Power on Power Systems
The impacts of wind power in the electricity system
depend to a large extent on the:
level of wind power penetration;•
grid size; and•
generation mix of electricity in the system.•
Wind energy penetration at low to moderate levels
is a matter of cost, as demonstrated by various national
and regional integration studies. And the integration
costs related to the impacts listed above are fairly
modest.
For low penetration levels of wind power in a sys-
tem, system operation will hardly be affected. Currently
(in 2008) wind power supplies less than 4 per cent of
the overall EU electricity demand, but there are large
regional and national differences in penetration, as
shown in Figure II.1.1.
The established control methods and system
reserves available for dealing with variable demand
and supply are more than adequate for dealing with
the additional variability at wind energy penetration
levels of up to around 20 per cent, depending on the
nature of a specifi c system. For higher penetration lev-
els, some changes to systems and their method of
operation may be required to accommodate the fur-
ther integration of wind energy.
SHORT- AND LONG-TERM IMPACTS
The impacts of wind power on the power system can
be categorised into short- and long-term effects. The
short-term effects are caused by balancing the sys-
tem at the operational timescale (minutes to hours),
whereas the long-term effects are related to the
contribution wind power can provide to the system
adequacy (its capability to reliably meet peak load
situations).
IMPACTS IN THE SYSTEM: LOCAL AND SYSTEM-WIDE
Locally, wind power plants interact with the grid volt-
age, just like any other power station. In this context,
steady-state voltage deviations, power quality and
voltage control at or near wind farm sites must all be
taken into consideration. Wind power can provide volt-
age control and active power (frequency) control. Wind
power plants can also reduce transmission and distri-
bution losses when applied as embedded generation.
On the system-wide scale, there are other aspects
to consider.
Wind power plants affect voltage levels and power •
fl ows in the networks. These effects can be benefi -
cial to the system, especially when wind power
plants are located near load centres, and certainly
at low penetration levels. For example, wind power
plants can support the voltage in the system during
fault (low voltage) situations. Also, wind plants
that have a reactive power control system installed
at the end of long radial lines benefi t the system,
since they support the voltage in (normally) low
voltage quality parts of the grid.
Wind power may need additional upgrades in trans-•
mission and distribution grid infrastructure, as is
the case when any power plant is connected to a
grid. In order to connect remote high-resource sites,
such as offshore wind farms or very large wind
plants in remote areas, to the load centres, new
WIND ENERGY - THE FACTS - WIND POWER VARIABILITY AND IMPACTS ON POWER SYSTEMS 165
1565_Part II.indd 165 2/17/2009 7:12:06 PM

lines need to be constructed (just as new pipelines
had to be built for oil and gas). In order to maximise
the smoothing effects of geographically distributed
wind, and to increase the level of fi rm power, addi-
tional cross-border transmission is necessary to
reduce the challenges of managing a system with
high levels of wind power.
Wind power requires measures for regulating con-•
trol, just like any other generation technology, and,
depending on the penetration level and local net-
work characteristics, it affects the effi ciency of
other generators in the system (and vice versa).
In the absence of suffi cient intelligent and well-•
managed power exchange between regions or coun-
tries, a combination of (non-manageable) system
demands and production may result in situations
where wind generation has to be constrained.
Finally, wind power plays a role in maintaining sys-•
tem stability and contributes to the system ade-
quacy and security of supply.
For an overview and categorisation of the power sys-
tem effects of wind power, see Table II.2.1 below.
A graphical overview of the various impacts of wind
power in the power system is given in Figure II.2.7.
It shows the local and system-wide impacts, as well as
the short- and long-term impacts, for the various
affected aspects of the power system, which include
grid infrastructure, system reserves and system
adequacy.
Table II.2.1: Power system impacts of wind power causing integration costs
Effect or impacted element Area Timescale Wind power contribution
Short-term effects
Voltage management Local/regional Seconds/minutes Wind farms can provide (dynamic) voltage support (design dependent).
Production effi ciency of thermal and hydro
System 1–24 hours Impact depends on how the system is operated and on the use of short-term forecasting.
Transmission and distribution effi ciency
System or local 1–24 hours Depending on penetration level, wind farms may create additional investment costs or benefi ts. Spatially distributed wind energy can reduce network losses.
Regulating reserves System Several minutes to hours
Wind power can partially contribute to primary and secondary control.
Discarded (wind) energy System Hours Wind power may exceed the amount the system can absorb at very high penetrations.
Long-term effects
System reliability (generation and transmission adequacy)
System Years Wind power can contribute (capacity credit) to power system adequacy.
Source: EWEA
Figure II.2.7: System impacts of wind power
System-wide1000–5000 km
ms…s
Regional100–1000 km
Local10–50 km
s…min min…h 1…24h years
Power quality
Voltagemanagement Distribution
efficiency
Congestionmanagement
Transmissionefficiency
Gridstability
Primaryreserve
Secondaryreserve
Reducedemissions
Hydro-thermalefficiency
Adequacyof power
Adequacyof grid
Area relevant for impact studies
Timescale relevant for impact studies
Note: Issues which are within the scope of Task 25 are circled in black.
Source: Holttinen et al. (2007)
166 WIND ENERGY - THE FACTS - GRID INTEGRATION
1565_Part II.indd 166 2/17/2009 7:12:06 PM

DESIGN AND OPERATION OF EUROPEAN POWER SYSTEMS WITH LARGE AMOUNTS OF WIND POWER
II.3
In order to integrate wind power effi ciently at higher
levels of penetration, changes to the operating meth-
ods of various parts of the power system, such as
generators and transmission systems, are required.
Moreover, active management at the demand side of
the power system can be used to facilitate wind power
integration. Wind power, with its variable output char-
acteristics, affects other generators in the system. As
well as reducing their required output, wind power also
requires other plants in the system to be scheduled
differently.
In order to effi ciently integrate large amounts of wind
power, it is essential for the system design to be more
fl exible, which can be achieved by a combination of:
fl exible generating units;•
fl exibility on the demand side;•
availability of interconnection capacity; and•
more fl exible rules in the power market.•
Balancing Demand, Conventional Generation and Wind Power
EFFECT OF WIND POWER ON SCHEDULING OF RESERVES
In this section, we outline the way in which wind
affects the operation of the other generators in the
system. Further information on power system operat-
ing principles is provided in Appendix H.
Primary Reserves
Wind power development will have little or no infl u-
ence on the amount of primary reserves required. On
second/minute timescales, rapid variations in the
total wind power capacity output occur randomly, such
as existing load variations. When aggregated with
load and generation variations, the increase in variabil-
ity due to wind is very small. Furthermore, the amount
of primary reserve allocated in the power systems is
dominated by potential outages of large thermal gen-
eration plants, meaning it can easily cope with these
rapid variations.
Secondary and Tertiary Reserves
The impact of wind power on the need for secondary
reserves will only be increasingly signifi cant from wind
energy penetrations levels of 10 per cent upwards.
The main impact of wind power will be on how conven-
tional units are scheduled to follow load (hour to day
timescales). If the output from a wind plant could be
accurately predicted one to two days in advance,
schedulers could more easily determine units that
would need to be committed. The lack of an accurate
forecast adds further uncertainty to the commitment
decision, on top of the uncertainty associated with
load forecasting. The result is that a unit might be
unnecessarily committed, or that it may not be com-
mitted when this is required. In this case, the genera-
tion mix of the power system determines scheduling in
view of expected wind power production – the greater
the fl exibility of power units, the later unit commit-
ment decisions can be made.
The estimate for extra reserve requirements due to
wind power (EWEA, 2005a; Holttinen et al., 2007) is in
the order of 2–4 per cent of the installed wind power
capacity at 10 per cent penetration of gross consump-
tion, depending on how far ahead wind power forecast
errors are corrected by reserves (this is dependent on
the gate closure times).
Short-term Forecasting of Wind in System Operation
Clearly, short-term forecasting becomes increasingly
important for system operation as wind power penetra-
tion increases. In regions with high penetration levels,
such as certain areas of Spain, Germany, Denmark and
1565_Part II.indd 167 2/17/2009 7:12:06 PM

Ireland, wind farm operators routinely forecast output
from their wind farms. These forecasts are used by
system operators to schedule the operation of other
plant and for trading purposes. The benefi ts of the
application of short-term forecasting depend, to a
large extent, on national regulatory, technological and
site-specifi c issues. The main advantages are cost
reductions and improved system security.
ADDITIONAL BALANCING CAPACITIES AND BALANCING COSTS: OVERALL RESULTS FROM SYSTEM STUDIES
The amount of additional reserve capacity and the cor-
responding costs associated with increasing wind power
penetration are being explored in many countries by
means of system studies carried out by power engineers.
This involves the simulation of system operation, whereby
the effect of increasing amounts of wind power is analy-
sed for different scenarios of generation mix. In 2006,
international cooperation was established under the
IEA’s Task 25 to compare and analyse the outcome of
different national system studies. Task 25’s fi rst report
provides general conclusions, based on studies from
Denmark, Finland, Norway, Sweden, Germany, Ireland,
Spain, The Netherlands, Portugal, the UK and the US.
Both the allocation and the use of reserves imply
additional costs. The consensus from most studies
carried out so far is that the extra reserve require-
ments needed for larger wind power penetrations are
already available from conventional power plants in
the system, so in fact no new reserves are required.
This means that only the increased use of dedicated
reserves, or increased part-load plant requirement,
will create extra costs for the energy part.
The studies calculate additional costs, compared
to a situation without wind power. Most results are
based on comparing the costs of system operation
without wind power and then adding varying amounts
of wind power into the equation (see Figure II.3.1).
The costs of variability are also addressed, by
comparing simulations assuming constant (fl at) wind
energy to those with varying wind energy.
Estimates of the extra cost of reserves (mainly sec-
ondary load-following reserves) suggest €1–4/MWh
for a wind power penetration of up to 10 per cent of
gross consumption. This cost is normalised per MWh
of wind energy produced. The cost per MWh at the
consumption level is around €0.1–0.4/MWh at 10 per
cent wind energy penetration, which is typically around
0.1 per cent of the electricity consumption price.
These fi ndings indicate that the additional system
Figure II.3.1: Results for the increase in reserve requirement
due to wind power, as summarised by IEA Task 25
10%
9%
8%
7%
6%
5%
4%
3%
2%
1%
0%
Nordic 2004Finland 2004SwedenIreland 1 hourIreland 4 hours
10%
Incr
ease
as
% o
f w
ind
capa
city
Wind penetration (% of gross demand)
5% %52%02%51%0
Increase in reserve requirement
UKSweden 4 hoursDENA Germany
Note: Major factors explaining the difference in results between various studies are assumptions with respect to forecast uncertainties (resulting from length of forecast horizon/gate closure time) and the geographical size of the area considered.
Source: Holttinen et al. (2007)
168 WIND ENERGY - THE FACTS - GRID INTEGRATION
1565_Part II.indd 168 2/17/2009 7:12:06 PM

operation costs, in terms of balancing additional vari-
ability due to large-scale integration of wind power,
are only a small fraction (typically less than 10 per
cent) of the generation costs of wind power. The effect
on the consumer price is close to zero.5
System Operation Aspects
TRANSMISSION LEVEL
Balancing and securing system operation by the trans-
mission system operator (TSO) involves the use of
transmission lines in the system area and intercon-
nections to neighbouring systems. The issues include
congestion management, priority access and priorities
in curtailment in critical situations, such as low demand
or high winds.
High penetration levels of wind power production
affect the operation of the transmission system. Voltage
control in the system may be required (for example near
large wind farms) in order to cope with unwanted volt-
age changes, which might be enhanced by variable out-
put wind power. This voltage support could be supplied
by the wind farm if adequate wind energy technology
were to be used; otherwise dedicated equipment would
need to be installed, such as FACTS devices.6
Another issue is the management of power fl ows
and possible congestion in the grid. Specifi c combina-
tions of both the level and geographical location of
wind power production and demand can cause changes
in the size and direction of power fl ows in the transmis-
sion grid. This results in changing cross-border fl ows.
In order to manage these cross-border power fl ows,
TSOs also need high-quality wind forecasting tools.
FACTS devices and phase-shifting transformers may
be used for the management of power fl ows.
DISTRIBUTION LEVEL
Until now, the connection of wind power to the grid has
usually been at distribution level. A particular feature
of distribution grids is that there is no active manage-
ment, for example, at transmission level. The distribution
grids have to cope with greater distributed generation
levels, without reducing the quality of supply to other
customers.
The ‘embedded generation’ of wind power benefi ts
the grid: weak grids may be supported by wind power,
and users on the line may be better served, as wind
power can help to control grid voltage. Power electron-
ics of wind farms can also improve power quality char-
acteristics in the grid. The power, if consumed within
the distribution network, goes directly to the user and
transmission costs can be reduced. Finally, depending
on the grid code requirements of the relevant control
area, wind power may maintain operations in parts of
the system in the event of transmission failures, which
would otherwise cause blackouts.
Adding wind power to distribution grids results in
similar effects as in the transmission grid: a change in
the direction and quantity of real (active) and reactive
power fl ows, which may interact with the operation of
grid control and protection equipment. The design and
operation practices at the distribution level may need
to be modifi ed as additional distributed generation,
such as wind power, is added. Distribution grids may
have to become more ‘actively managed’, which would
require the development of suitable equipment and
design principles. However, the improved grid brings
collateral benefi ts to the distribution grid operator.
WIND POWER CLUSTER MANAGEMENT
The pooling of several large wind farms into clusters
in the GW range provides new options for optimising
the integration of variable output generation into
electricity supply systems. Concepts for cluster
management (Rohrig et al., 2004; Estanqueiro et al.,
2008) include the aggregation of geographically dis-
persed wind farms, according to various criteria, for
optimised network management and (conventional)
generation scheduling. The clusters will be operated
WIND ENERGY - THE FACTS - DESIGN AND OPERATION OF EUROPEAN POWER SYSTEMS 169
1565_Part II.indd 169 2/17/2009 7:12:06 PM

and controlled in the same way as large conventional
power plants.
The implementation of these operating methods will
signifi cantly increase wind energy’s economic value to
the system, by keeping additional costs for balancing
to a minimum. Based on innovative wind farm opera-
tional control, a control unit between system operators
and wind farm clusters (so-called ‘wind farm cluster
management’, WFCM) will enable a profi le-based
generation. WFCM combines and adjusts wind plant
control systems, based on forecasts, operating data,
online-acquired power output and defaults from system
operators.
Options for Increasing Power System Flexibility
The availability of fl exible balancing solutions (genera-
tion capabilities, load management and energy storage)
in power systems is an important facilitating factor
for the integration of wind power. Even though power
system balancing is not new, wind power provides new
challenges at high penetration levels, since its vari-
able nature requires additional fl exibility in the power
system – the capability to adequately respond to fast
and signifi cant net system load variations.
By increasing the fl exibility of the power system, its
ability to integrate variable output generation can be
enhanced. In a more fl exible system (for example
systems with large amounts of hydro- or gas-powered
electricity), the effort required to reach a certain wind
energy penetration level can be lower than in a less
fl exible system (for example systems with a high share
of nuclear power). In a system that covers a larger
geographical area, a larger amount of fl exibility
sources are usually available. The differences in the
size of power systems, dispatching principles and sys-
tem fl exibility explain the differences in integration
costs in different countries. For example, Denmark
has a high level of fl exibility as it is well intercon-
nected, thus enabling a high penetration level without
signifi cant additional costs. Portugal is another exam-
ple of a fl exible power system enabling easy and low-
cost wind power integration, due to the large amount
of fast responding, reversible hydropower plants in the
system.
A serious consideration in the planning to integrate
substantial amounts of wind power is the provision
(fl exibility sources) for additional fl exibility needs in
the system, compared to a situation without wind
power. In the assessment of the required additional
fl exibility, a distinction has to be made in the different
market timescales (hour/day ahead).
The main sources for additional fl exibility are:
fast markets (markets with short gate closure •
times);
fl exible generation (for example gas and hydro);•
demand-side management (DSM);•
energy storage; and•
interconnection.•
Fast Markets
There is considerable diversity in European power mar-
ket rules, but day-ahead markets exist in most coun-
tries. The day-ahead forecast error for wind has been
signifi cantly reduced in recent years, due to improved
weather forecast models, but the error is still higher than
for intraday forecasts. In the interest of wind power
integration, gate closure times should be reduced, in
order to minimise forecasting uncertainty, and therefore
reducing last-minute balancing adjustments. Organising
markets throughout Europe to operate faster and on
shorter gate closure times (typically three hours ahead)
would favour the economic integration of wind power.
A recent study (Milligan and Kirby, 2008), based on
the situation in the state of Minnesota in the US,
calculates the savings in balance power that could be
achieved by balancing areas and assuming the
presence of an energy market with a fi ve-minute
re-dispatch. In the hourly timescale, balance area con-
solidation reduces ramp requirements of balancing
170 WIND ENERGY - THE FACTS - GRID INTEGRATION
1565_Part II.indd 170 2/17/2009 7:12:06 PM
plants by 10 per cent, while in the fi ve-minute times-
cale this reduction is double – more than 20 per cent.
This has considerable effects on the balancing costs,
and thus on the integration of wind power.
Flexible Generation
Existing balancing solutions mostly involve conven-
tional generation units: hydropower, pumped hydro and
thermal units. Hydropower is commonly regarded as a
very fast way of reducing power imbalance, due to its
fast ramp-up and ramp-down rates. It also has a mar-
ginal cost, close to zero, making it a very competitive
solution. Pumped hydro accumulation storage (PAC,
see below) also allows energy storage, making it pos-
sible to buy cheap electricity during low-load hours and
to sell it when demand and prices are higher.
Of course, thermal units are also commonly used for
power system balancing (primary control and secondary
control). In the category of thermal generation, gas-fi red
units are often considered to be most fl exible, allowing
rapid production adjustments. There is also potential in
making existing power plants more fl exible.
Storage Options
There is increasing interest in both large-scale storage
implemented at transmission level and smaller-scale
dedicated storage embedded in distribution networks.
The range of storage technologies is potentially wide.
For large-scale storage, PAC is the most common
and best-known technology. PAC can also be set up
underground.
Another large-scale technology option is compressed-
air energy storage (CAES). On a decentralised scale,
storage options include:
fl ywheels;•
batteries (lead-acid and advanced), possibly in •
combination with electric vehicles;
fuel cells (including regenerative fuel cells, ‘redox •
systems’);
electrolysis (for example hydrogen for powering •
engine-generators or fuel cells); and
super-capacitors.•
An attractive solution would be the installation of
heat boilers at selected combined heat and power
(CHP) locations, in order to increase the operational
fl exibility of these units.
Storage involves a loss of energy. If a country does
not have favourable geographical conditions for hydro
reservoirs, storage is not the fi rst solution to look at
due to the poor economics at moderate wind power
penetration levels (up to 20 per cent). In certain
cases, it can even have an adverse effect on system
operation with respect to CO2 emissions (Ummels
et al., 2008). In fact, the use of storage to balance
variations at wind plant level is neither necessary nor
economically viable.
Demand-side Management
With demand-side management (DSM), loads are con-
trolled to respond to power imbalances by reducing or
increasing power demand. Part of the demand can be
time-shifted (for example heating or cooling) or simply
switched off or on according to price signals. This
enables a new balance between generation and
consumption, without the need to adjust generation
levels.
Today, the adjustment of generation levels is more
common than DSM. The availability of this solution
depends on load management possibilities (for example
in industrial processes such as steel treatment) and
the fi nancial benefi ts offered by fl exible load contracts
(cost of power cuts and power increases versus lower
bills). Attractive demand-side solutions in combination
with decentralised storage are:
heat pumps combined with heat boilers (at domes-•
tic or district level);
cooling machines combined with cold storage; and•
plug-in electric vehicles.•
WIND ENERGY - THE FACTS - DESIGN AND OPERATION OF EUROPEAN POWER SYSTEMS 171
1565_Part II.indd 171 2/17/2009 7:12:07 PM

Each of these solutions permits the separation of
the time of consumption of electricity from the use of
the appliance, by means of storage.
Interconnection
Available interconnection capacity for exchange of
power between countries is a signifi cant source of
fl exibility in a power system. However, the capacity
should be technically as well as commercially avail-
able. Data on available interconnection capacities are
published at www.etso-net.org. See also the section
on interconnection on page 164.
172 WIND ENERGY - THE FACTS - GRID INTEGRATION
1565_Part II.indd 172 2/17/2009 7:12:07 PM

GRID INFRASTRUCTURE UPGRADE FORLARGE-SCALE INTEGRATION
II.4
European Transmission and Distribution Networks
Electricity networks can be split into two major subsec-
tions: transmission networks and distribution networks.
TRANSMISSION NETWORKS
The transmission network usually consists of high to
very high voltage power lines designed to transfer bulk
power from major generators to areas of demand; in
general, the higher the voltage, the larger the transfer
capacity. Only the largest customers are connected to
the transmission network.
Transmission network voltages are typically above
100 kV. The networks are designed to be extremely
robust, so they can continue to fulfi l their function
even in the event of several simultaneous network
failures. Failure of a single element, such as a trans-
former or transmission line, is referred to as an ‘N-1’
event, and transmission systems should be capable of
withstanding any such events. More complex cases
of simultaneous failures of multiple elements (for
example the failure of a transmission line when a par-
allel line has been disconnected for maintenance),
are termed ‘N-2’ or similar. Transmission systems
should also be capable of withstanding any such
credible combinations.
Transmission consists mainly of overhead lines.
Although underground lines offer the advantages of
being less visually intrusive and raising less environ-
mental objections, they incur higher initial investment
costs and have a lower transmission capacity.
Transmission systems are operated by transmis-
sion system operators (TSOs) or independent system
operators (ISOs). Responsibility for constructing or
owning the physical network may belong to other
organisations.
Transmission systems are actively managed through
power system control centres, also known as dispatch
centres. Balancing power entering and leaving the
high voltage network, and reconfi guring the network
to cope with planned and forced outages, is a 24-hour
activity.
The European grid (Figure II.4.1) is divided into fi ve
synchronous regions and fi ve relevant organisations:
NORDEL (Organisation for the Nordic Transmission
System Operators), BALTSO (Cooperation Organization
of Estonian, Latvian and Lithuanian Transmission
System Operators), UKTSOA (United Kingdom
Transmission System Operators), ATSOI (Association of
Transmission System Operators in Ireland) and UCTE
(Union for the Co-ordination of Transmission of
Electricity). Each of these organisations coordinates
the TSOs involved at both operational and planning
stages. The creation of the future European Network
for Transmission System Operators for Electricity
(ENTSO-E) will provide a new framework aimed at facil-
itating coordination between the different areas.
DISTRIBUTION NETWORKS
Distribution networks are usually below 100kV and their
purpose is to distribute power from the transmission
network to customers. At present, with the exception of
wind and other renewable power plants, little generation
is connected to distribution networks, but this is chan-
ging rapidly, for example in Germany and Denmark.
Generation connected to distribution networks is
often termed ‘embedded generation’ or ‘distributed
generation’. Distribution networks are less robust than
transmission networks and their reliability decreases
as voltage levels decrease. For example, a connection
at 33 kV could expect to lose only a few minutes of
connection per year on average, whereas a low voltage
connection at 230 V for an individual domestic consumer
1565_Part II.indd 173 2/17/2009 7:12:10 PM

in a rural area would, on average, expect to lose at
least an hour. As with transmission networks, distribu-
tion networks are operated (in some cases also owned)
by distribution system operators (DSOs).
There is very little ‘active’ management of distribu-
tion networks. Rather, they assume a ‘fi t and forget’
philosophy, in other words they are designed and con-
fi gured on the basis of extreme combinations of cir-
cumstances (for example maximum demand in
conjunction with high ambient temperatures, which
reduce the capacity of overhead lines), to ensure that
even in these extreme circumstances the network
conditions experienced by customers are still within
agreed limits.
Network Planning for Wind Power: Benefi ts of and Options for Increasing Transmission Capacity
THE NEED FOR IMPROVED NETWORKS
Liberalisation, market conditions, technology and the
environment create fundamental changes and chal-
lenges for the European transmission and distribution
Figure II.4.1: Different synchronous regions in Europe
EU membersAT
UCTE
NORDEL
UKTSOA
ATSOI
BALTSO
GBIE
NO SE
FI
EE
LV
LT
PL
DK-W
DE
NL
BE
LU
FR
ES
PT
CH AT
CZSK
HU
RO
BG
GR
MK
RS
ME
BAHR
SI
DK-E
IT
UK & Ireland
Northern
Baltic
Central East
South EastCentralSouth
South West
CentralWest
Source: UCTE Transmission Development Plan 2008
174 WIND ENERGY - THE FACTS - GRID INTEGRATION
1565_Part II.indd 174 2/17/2009 7:12:10 PM

networks. One of the major drivers is the emerging
internal electricity market in Europe, which requires
an adequate transport capacity between control
regions and Member States to enable effective com-
petition and trade of physical electricity. Therefore,
enhancing the suitability of the grid for increased trans-
national and regional electricity transport is both in
the interest of the wind industry and crucial for the
development of the internal electricity market.
In addition, the specifi c nature of wind energy as a
distributed and variable-output generation source
requires specifi c infrastructure investments and the
implementation of new technology and grid manage-
ment concepts. The impacts of wind power on trans-
mission, as described in Chapter II.2 (and see Figure
II.2.1), are related to grid stability, congestion man-
agement, and transmission effi ciency and adequacy.
The large-scale integration of wind power requires a
substantial increase in transmission capacity and
other upgrade measures within and between the
European Member States.
IMPROVING NETWORKS FOR INTEGRATING WIND POWER
The typical additional grid improvement measures
required at increasing levels of wind power penetration
can be classifi ed into the following categories, in order
of increasing effort and cost.
Soft Measures
In the short term, and at relatively low levels of
wind power penetration, transmission upgrades coin-
cide to a large extent with methods for congestion
management and optimisation in the transmission
system. Soft measures do not involve extensive
expenditure, but rather avoid or postpone network
investments.
The utilisation of existing power lines can often be
increased by operating them at a higher capacity,
assisted by temperature monitoring. Improving the
cross-border electricity exchange procedures, and thus
the manner in which power is fl owing between different
countries, is also a method for alleviating congestion.
If controllable power plants are available within the
congested area, coordinated automatic generation
control (AGC) may be applied. DSM, controlled accord-
ing to the wind energy and transmission situation, is
another option. Applying control systems that limit the
wind power generation during critical hours should be
considered as a last resort, because it is both environ-
mentally and economically ineffi cient.
Investments Other Than the Construction
of New Lines
At signifi cant penetration levels, there is a need for
additional voltage management in the grids, which can
be achieved by devices such as FACTS6 and also by
the technical capabilities of the wind farms them-
selves, in particular with technologies that enable
expanded MVAR capabilities.7
Studies in the UK (Strbac et al., 2007) have con-
cluded that it may be preferable to insist on suffi cient
fault ride-through (FRT)8 capability from large wind
power plants. In certain cases, and in order to ensure
power system security at higher penetration levels,
this would be more economical than modifying the
power system operation and not insisting on FRT capa-
bility from wind turbines.
It can be argued that the additional costs associ-
ated with the improved wind power plant capabilities
at the wind farm level should also be materialised,
such as in the 2008 amendment of the German
Renewable Energy Law.
There are several ways in which the transmission
capacity of the network can be increased (UCTE, 2008).
These include:
adding transformers to existing substations, thus •
enabling a higher load feed and in some cases evac-
uating higher generated power;
WIND ENERGY - THE FACTS - GRID INFRASTRUCTURE UPGRADE 175
1565_Part II.indd 175 2/17/2009 7:12:10 PM
upgrading assets: for example operating a line at •
higher voltage (within its design limits) or increasing
the transmission capacity of a power line by tighten-
ing the conductors and reinforcing the towers;
installing new facilities in grid substations to •
improve the distribution of power fl ows among dif-
ferent parallel paths and to fi t better with the line
capacities: for example series reactors, phase-
shifting transformers or devices to increase voltage
support (shunt reactive devices and static VAR
compensators);
improving the utilisation of existing assets when •
possible: for example replacing line conductors
with high temperature conductors or adding a sec-
ond circuit on an existing line (within the design
limit of the towers); and
replacing existing assets with those of a higher •
transmission capacity: for example replacing an
existing 225 kV line with a 400 kV double-circuit
line.
Construction of New Lines
Grid reinforcement is necessary to maintain adequate
transmission as wind power penetration increases.
This reinforcement is preceded by extensive power
system analysis, including both steady-state load fl ow
and dynamic system stability analysis. The construc-
tion of new lines is also a prerequisite for reaching
regions with a high wind resource, for example off-
shore locations. Nowadays, in many areas of Europe,
the construction of new overhead lines may take as
long as 10 to 12 years from the initial concept to
implementation, mainly because of lengthy planning
and permission procedures.
Several studies at national and European level are
now underway to back up the plans for upgrading the
European transmission system in order to facilitate
large-scale integration. The most important interna-
tional studies are the European Wind Integration
Study (EWIS) and TradeWind, which will provide
recommendations in 2009. Initiated in 2007, EWIS
investigates the grid measures necessary to enable
the wind power capacity foreseen for 2015 in a
cooperative effort between European TSOs. The
EWEA-coordinated project, TradeWind, started in
2006 and investigates the grid upgrade scenarios at
the European level that would be necessary to enable
wind energy penetration of up to 25 per cent, using
wind power capacity scenarios up to 2030.
ENSURING ADEQUATE TRANSMISSION CAPACITY AND ACCESS FOR WIND POWER
From the above, it can be seen that in order to inte-
grate wind power, suffi cient transmission capacity
needs to be available to carry the power to the demand
centres. This capacity must be provided by transmis-
sion lines and a proper legal framework for accessing
this capacity is required.
At the European level, two major initiatives contain
basic elements of such a framework (see also ‘European
policy framework relevant for wind power integration’
in Chapter II.1):
The newly agreed European Renewable Energy •
Directive (2008) stipulates that national govern-
ments and TSOs should guarantee suffi cient trans-
mission capacity and fair access for renewables to
the transmission network.
The mandatory ownership unbundling of generation •
and transmission, as required by the proposed Third
Energy Package (2008), should provide the legal
basis to guarantee a level playing fi eld with other
generators.
In practice, the construction of the required network
upgrades, especially new lines, is a very lengthy pro-
cess. Also, because of the difference in speed between
wind power development and transmission develop-
ment, there is a need to implement fair access rules
for cases where lines have to be shared between wind
and other generators. As yet, there are no established
176 WIND ENERGY - THE FACTS - GRID INTEGRATION
1565_Part II.indd 176 2/17/2009 7:12:10 PM
rules at the European level and grid access for wind
energy is presently solved in a rather pragmatic way.
Some countries, such as Germany and Spain, take into
account the recommendations from the 2001 RES
Directive, and grant priority access to wind power to a
certain extent. In practice, in case available grid
capacity is limited, the principle of ‘connect and
manage’ is often used.
INTEGRATING WIND POWER IN DISTRIBUTION NETWORKS
The addition of embedded generation, such as wind
power, to distribution networks is quite common and
was at the origin of wind power development in most
countries. However, when wind generation reaches
very high levels, it brings new challenges, for the fol-
lowing reasons:
The distributed generation adds a further set of •
circumstances (full generation/no generation)
with which the network must cope without nega-
tively affecting the quality of supply seen by
customers.
The direction and quantity of real and reactive •
power fl ows change, which may affect the opera-
tion of network control and protection equipment at
local level.
Design and operational practices are no longer suit-•
able and may need to be modifi ed.
In contrast to these challenges, distributed genera-
tion systems (DGSs) also bring benefi ts to distribution
networks, including:
a reduction in network losses in many situations; •
and
the avoidance of network reinforcement which •
would otherwise be required to achieve standards
for quality of supply.
To address these issues, distribution networks may
become more ‘actively managed’. This implies cost
and requires the development of suitable equipment
and design principles. Active management of the net-
works by DSOs may be assisted by introducing new
concepts, such as ‘clusters of wind farms’ that aggre-
gate and enable the monitoring of generation (see also
page 161). In the future, it is expected that distributed
wind generation will be fully controlled and operated
as a virtual power station (VPS).
Transnational Offshore Grids
THE CASE FOR AN OFFSHORE GRID
The exploitation of the offshore wind potential in
Europe brings new challenges and opportunities for
European power transmission. The long-term European
offshore potential amounts to up to 150 GW in 2030,
according to EWEA estimates in 2008. The majority of
the currently projected offshore wind plants will be
situated close to the European coastlines, not further
than 100km from the shore, due to the high costs of
grid connection, limited grid availability and the lack of
regulatory frameworks. Looking at the North Sea alone,
with a potential of hundreds of GW of wind power, an
offshore grid connecting different Member States
would enable the transfer of this wind power to
load centres and, at the same time, facilitate the com-
petition and the trade of electricity between countries.
A multi-terminal offshore grid would reach offshore
wind plants far from shore, as foreseen for German and
UK waters.
The project developer Airtricity introduced the off-
shore Supergrid® concept in 2005. Supergrid® com-
bines the following:
the connection of offshore wind plants;•
the balancing of wind power variations; and•
the provision of transmission of electricity between •
different markets for cross-border trade.
A commercial proposal has been worked out for a
fi rst phase of 10 GW of wind power – the construction
WIND ENERGY - THE FACTS - GRID INFRASTRUCTURE UPGRADE 177
1565_Part II.indd 177 2/17/2009 7:12:11 PM

of an offshore ‘super grid’ which would be on a modu-
lar basis. The fact that wind farms will be able to oper-
ate collectively at variable speed and frequency,
independent of the land-based grid, is expected to
optimise turbine generating effi ciency and offset
losses incurred as a result of the increased transmis-
sion distances.
At fi rst, large, multi-GW offshore arrays would con-
nect to nearby networks, before being modularly
extended and ultimately interconnected. A further
advantage of this system will be the full controllability
of power fl ows, eventually allowing an ‘all-European’
market for electricity, including ‘fi rm’ wind power.
Presently, the idea of a transnational offshore grid
is being addressed by several other parties. The
Norwegian TSO Statnett proposes the progressive
development of a grid linking Scandinavia with UK,
Germany and The Netherlands (Figure II.4.3). On its
way, it would connect offshore wind farms, as well as
existing offshore oil installations that need to reduce
their CO2 emissions. The technology to be used is a
HVDC VSC (see ‘Ensuring adequate transmission
capacity and access for wind power’ above).
Greenpeace (Woyte et al., 2008) has studied the con-
cept of an offshore grid serving electricity trade between
European countries around the North Sea and at the
same time providing transmission of up to 70 GW of
offshore wind power capacity – a target that could be
achieved between 2020 and 2030 (Figure II.4.4). The
study has also evaluated the smoothing effect of aggre-
gating the offshore wind power using such a grid. The
offshore grid topology proposed seeks the maximum
synergy between existing plans and reinforcements,
aiming to improve the cross-border exchange between
countries. For example, it includes the East Connector
in the UK, which alleviates the heavy north–south con-
gestions, as well as an offshore connection along the
French, Belgian and Dutch coasts.
Figure II.4.2: Vision of high voltage ‘super grid’ to transmit
wind power through Europe
Source: Dowling and Hurley (2004)
Figure II.4.3: Offshore grid proposal by Statnett
Ekofisk
VindparkSK 1,2,3
SK 4
Nord.Link/NorGer
NorNed
Source: Statnett (2008)
178 WIND ENERGY - THE FACTS - GRID INTEGRATION
1565_Part II.indd 178 2/17/2009 7:12:11 PM

The effects of grid confi gurations described above
on the power fl ows in the European transmission sys-
tem are being analysed in the TradeWind project. A
common element to all these proposals is the fact that
the offshore grid would provide multiple functions and
serve the functioning of the European electricity mar-
ket. Therefore, it should be considered as an exten-
sion of the existing onshore grid, falling under the
responsibility of the various governments, TSOs and
regulators involved.
TECHNICAL SOLUTIONS FOR THE OFFSHORE GRID
Compared to onshore sites, offshore wind farms will
have large power capacities and be comparable in size
to conventional power plants, typically in excess of
400 MW. Modern transmission technologies operating
at high and extra high voltage levels will be required to
transmit high levels of power over longer distances.
Two main types of offshore transmission systems
exist, based on either alternating or direct currents
(HVAC or HVDC).
For wind farms close to shore, the HVAC system
offers the best solution, as it provides the simplest,
least expensive and proven technology for grid con-
nection and is similar to the transmission network
used on land. However, as transmission distances
increase, the losses from the HVAC system increase
signifi cantly. To avoid ineffective operation, AC cable
length should be limited to a length of approximately
120 km. HVDC technology offers a number of advan-
tages, but has a distinct investment cost structure, as
it involves the installation of expensive converter sta-
tions. The break-even distance (now around 90 km)
depends on the cost developments, and will move
closer to the shore as HVDC system costs decrease.
Conventional thyristor-based HVDC technology has
generally been used for point-to-point power transmis-
sion. Offshore wind farm arrays would benefi t from a
multi-terminal transnational offshore grid system.
Recent advances in HVDC technology, using insulated
gate bipolar transistor (IGBT)-based converters, seem
to offer a solution and facilitate the cost-effective con-
struction of multi-terminal HVDC networks. These
modern HVDC-IGBT systems offer clear technological
advantages, especially in the area of controllability
and effi ciency. A specifi c advantage of HVDC systems
is reactive power control capability, favouring grid
integration and system stability. The technical and
economic aspects of offshore transmission systems
are being actively investigated by the supply industry
Figure II.4.4: Offshore grid examined in the Greenpeace study
N o r t h S e a
France
Belgium
Netherlands
Germany
Denmark
Norway
UnitedKingdom
Principle HVDC substationsWind farm(installed planned capacity<1000 MW)
Wind farm(installed planned capacity>1000 MW)
Grid(proposed or discussed inthe public domain)
Grid(in operation or planning)
Installed planned capacity (MW)
MW TWhBelgium 3850 13.1Denmark 1580 5.6France 1000 3.4Germany 26,420 97.5United Kingdom 22,240 80.8Netherlands 12,040 41.7Norway 1290 4.9
Total 68,420 247
250km
Source: Woyte et al. (2008)
WIND ENERGY - THE FACTS - GRID INFRASTRUCTURE UPGRADE 179
1565_Part II.indd 179 2/17/2009 7:12:13 PM

and by electric power companies in order to be ready
with the most cost-effective solutions when large-
scale offshore wind power takes off.
Coordinated Network Planning at the European Level
Besides the grid upgrades required in various coun-
tries in view of the integration of wind power, there is
also the need for a coordinated effort in network plan-
ning at the European level. At higher wind energy pen-
etration levels, cross-border power fl ow will increase,
which:
reduces wind power variability;•
improves the predictability of wind power;•
reduces balancing costs; and•
increases wind energy’s contribution to the genera-•
tion adequacy.
However, this increased cross-border fl ow increases
the need for coordinated network planning and common
technical regulations. In this respect, there are several
relevant ongoing initiatives and developments:
The Trans-European Energy Networks (TEN-E) •
programme was set up to promote the improve-
ment of interconnection in Europe. Coordinated by
the European Commission (DG TREN), TEN-E
focuses on those network aspects that improve
electricity trade within Europe. Several bottle-
necks in the transmission system have been iden-
tifi ed by TEN-E as projects of European interest.
Despite the launch of this programme, however,
though with a few exceptions, there has been little
progress in increasing interconnection capacity.
In 2007, as part of the measures proposed in
the Priority Interconnection Plan of the European
Energy Policy, a specifi c European Coordinator
was appointed by the European Commission with
the mandate to mediate in the interconnection
projects required to enable the integration of wind
power in northern Europe.
As recommended in the Third Energy Package in •
2008, the European Transmission Operators foun-
ded a new organisation, the European Network of
Transmission System Operators for Energy (ENTSO-E),
with the aim of improving the coordination of their
operations. Another Third Package requirement is
the obligation for joint TSOs to publish a transmis-
sion development plan (UCTE, 2008) on a regular
basis.
Within the EWIS study (FP6), The European TSOs •
are currently examining the technical and market
aspects that will arise from wind power integration
(time horizon 2015) in the European transmission
system. This should result in recommendations for
transmission planning at the European level. The
TradeWind project coordinated by EWEA, which
runs in parallel with EWIS, will provide recommen-
dations for interconnection and power market
improvements with a time horizon of up to 2030, at
which point 300 GW of wind power is expected to
be integrated in Europe. Having established a com-
mon platform for the exchange of information and
fi ndings, both EWIS and TradeWind will provide
quantitative input for coordinated transmission
planning for the future of wind power.
180 WIND ENERGY - THE FACTS - GRID INTEGRATION
1565_Part II.indd 180 2/17/2009 7:12:13 PM

GRID CONNECTION REQUIREMENTSII.5
Regulatory and Legal Background
All customers connected to a public electricity net-
work, whether generators or consumers, must comply
with agreed technical requirements, in order for the
network to operate safely and effi ciently. Electricity
networks rely on generators to provide many of the
control functions, and so the technical requirements
for generators are unavoidably more complex than for
demand customers.
These technical requirements are often termed ‘grid
codes’, though the term should be used with care, as
there are often different codes, depending on the volt-
age level of connection, or the size of the project. Also,
there may be technical requirements that are not
referred to in the grid code, but which apply to the
project through the connection agreement or the
power purchase agreement or in some other way.
The purpose of these technical requirements is to
defi ne the technical characteristics and obligations of
generators and the system operator, meaning that:
electricity system operators can be confi dent that •
their system will be secure regardless of the gen-
eration projects and technologies applied;
the amount of project-specifi c technical negotia-•
tion and design is minimised;
equipment manufacturers can design their equip-•
ment in the knowledge that the requirements are
clearly defi ned and will not change without warning
or consultation;
project developers have a wider range of equipment •
suppliers to choose from;
equivalent projects are treated fairly; and•
different generator technologies are treated equally.•
In the past, with vertically integrated utilities, the
same organisation was responsible for the planning
and operation of networks and generators, so the
technical requirements did not need to be particularly
clearly defi ned or fair. Nowadays, in order to avoid
distortions of competition and to comply with a
liberalised energy market in Europe, there is a trend
towards the legal separation of generators and system
owners/operators. As a result, the technical require-
ments governing the relationship between generators
and system operators need to be more clearly defi ned.
The introduction of renewable generation has often
complicated this process signifi cantly, as these gen-
erators have physical characteristics that are different
from the directly connected synchronous generators
used in large conventional power plants. In some
countries, this problem has caused signifi cant delays
in the development of fair grid code requirements for
wind generation.
In some countries, a specifi c grid code has been
produced for wind farms, and in others, the aim has
been to defi ne the requirements as far as possible in
a way which is independent of the power plant
technology.
There are benefi ts to requirements that are as gen-
eral as possible, such as treating all projects equally.
However, this can result in small projects facing the
same requirements as the largest projects, which may
not be technically justifi able.
Requirements are usually written by the system
operator, often overseen by the energy regulator body
or government. The requirement modifi cation process
should be transparent and include consultation with
generators, system users, equipment suppliers and
other affected parties.
Wind Power Plant Capabilities
Wind turbine technology is discussed in detail in Part I.
Turbine technology is also covered briefl y in this sec-
tion, to provide some background to the information
that follows.
The traditional Danish stall-regulated wind turbine
concept uses an induction generator. Its rotational
speed is fi xed by the frequency of the electricity net-
work to which it is connected. The blades are fi xed – in
other words do not pitch – so the output power and
1565_Part II.indd 181 2/17/2009 7:12:13 PM

structural loads in high winds are limited by passive
stall regulation. Unfortunately, this concept, though
cheap, simple and reliable, has several negative
effects on the electricity network:
lack of power control, meaning that system fre-•
quency cannot be controlled; this is achieved rela-
tively simply by conventional power plants;
limited control of reactive power, making it more •
diffi cult to control network voltages; and
during network disturbances (such as a sudden •
fault on the network), a wind turbine is likely to
aggravate the situation.
The fi xed-speed, pitch-regulated concept (in other
words the possibility to control active power output by
pitching the blades) resolves the fi rst of these issues,
and the limitations of the stall-regulated wind turbine
concepts can be mitigated with the addition of termi-
nal equipment in the substation.
The development of variable-speed wind turbines,
using power electronic converters, was undertaken
largely to reduce mechanical loads. This introduces
additional control of reactive power as a by-product,
and in the majority of cases also reduces the wind tur-
bine’s effect on the network during a sudden fault.
The larger the power electronic converter (relative
to the size of the wind turbine), the greater the control
over reactive power. So variable-speed, pitch-regulated
wind turbines, based on the full-converter principle,
now allow the desired control of wind turbines within
the required limits.
The currently available wind turbines do not make
full use of this capability, however, and grid codes
do not yet take advantage of the full capabilities. As
wind penetration increases, and network operators
gain experience with the behaviour of their systems,
grid codes will possibly become more demanding. New
technical requirements should be based on:
a detailed assessment of requirements;•
the technical potential of all the power plant’s •
technology; and
the optimal way in which to meet these demands, •
both technically and economically.
Grid Codes and Essential Requirements for Wind Power Plants
The arrangement of the technical requirements within
grid codes and related documents varies between
electricity systems. However, for simplicity the typi-
cal requirements for generators can be grouped as
follows:
tolerance – the range of conditions on the electri-•
city system for which wind farms must continue to
operate;
control of reactive power – often this includes •
requirements to contribute to voltage control on
the network;
control of active power;•
protective devices; and•
power quality.•
It is important to note that these requirements are
often specifi ed at the point of common coupling (PCC)
between the wind farm and the electricity network. In
this case, the requirements are placed at the wind farm
level, and wind turbines may be adapted to meet them.
Often, wind turbine manufacturers specify the perfor-
mance of their wind turbines, rather than that of the
entire wind farm.
It is also possible for some requirements to be met
by providing additional equipment, separate from the
turbines; this is indicated, where relevant, in the
following discussion.
TOLERANCE
The wind farm must continue to operate between
minimum and maximum voltage limits. Usually, this is
stated as steady-state quantities, though short-term
limits are not unknown (in other words a wider range
may apply for a limited duration).
182 WIND ENERGY - THE FACTS - GRID INTEGRATION
1565_Part II.indd 182 2/17/2009 7:12:13 PM

The wind farm must also continue to operate
between minimum and maximum frequency limits.
Often there is a range which applies continuously, and
several further more extreme short-term ranges.
In systems with relatively high wind penetration levels,
a common requirement is for wind farms to continue to
operate during severe system disturbances, during
which the voltage can drop to very low levels for very
short periods of time. This is termed ‘fault ride-through’
(FRT) or ‘low voltage ride-through’. The requirements
can be complex, and depend on the technical charac-
teristics of the electricity system. Proving compliance
with the requirements may be diffi cult and costly.
It is feasible to use wind turbines that do not comply
with FRT requirements, and to meet these require-
ments by installing additional equipment which can
produce or consume reactive power at turbine level, or
centrally within the wind farm.
REACTIVE POWER CONTROL
Reactive power production and consumption by gen-
erators allows the network operator to control volt-
ages throughout their system. The requirements can
be stated in a number of ways.
The simplest is the fi xed power factor. The wind
farm is required to operate at a fi xed power factor
when generating, often equal to 1. Often, the required
accuracy and integration intervals for the verifi cation
of the power factor are not stated. And the fi xed value
may be changed occasionally, for example for winter
and summer or peak and no-load periods.
Alternatively, the wind farm may have to adjust its
reactive power consumption or production in order
to control the voltage to a set point. This is usually
the voltage at the PCC, but other locations may be
specifi ed. There may be requirements on the accu-
racy of control and the speed of response. Fast con-
trol may be diffi cult to achieve, depending on the
capabilities of the wind farm’s SCADA communica-
tions system.
Some wind turbine designs can fulfi l these functions,
even when the wind turbine is not generating. This is
potentially a very useful function for network opera-
tors, but is not yet a common requirement.
FRT requirements can be met with central reactive
power compensation equipment.
ACTIVE POWER CONTROL
With pitch-regulated turbines, it is possible to reduce
the output at any moment by pitching the blades. This
could also be done with stall-regulated turbines, by
shutting down individual turbines within a wind farm.
Although this only provides relatively crude control,
the output from the power system operator’s point of
view is effective and valuable.
All forms of active power control in a wind turbine
require a reduction in output power, which means a
reduction in revenue. This is less of an issue for con-
ventional power stations, where the lost revenue will
be compensated, to some extent, by a reduction in
fuel cost. Therefore, system operators and energy reg-
ulators recognise that a reduction in wind farm output
should be used as a last resort.
The simplest method is a cap, which means that the
wind farm (or a group of wind farms) is instructed to
keep its output below a certain level. A more complex
version of the cap is to insist that output is kept at
a fi xed level (delta), below the unconstrained output
available from wind.
In parallel with a cap, the wind farm may also be
instructed to control ramp rate, in other words to limit
the rate at which the output power can increase (due
to increasing wind speed or turbines returning to ser-
vice after some outage). The ramp rate is defi ned over
periods of, for example, one minute or ten minutes.
This limits the network operator’s demands on other
forms of generation to adjust output rapidly.
Clearly, it is not possible for wind generation to con-
trol automatically the ‘negative ramp rate’ if the wind
drops suddenly. However, with good wind forecasting
WIND ENERGY - THE FACTS - GRID CONNECTION REQUIREMENTS 183
1565_Part II.indd 183 2/17/2009 7:12:13 PM
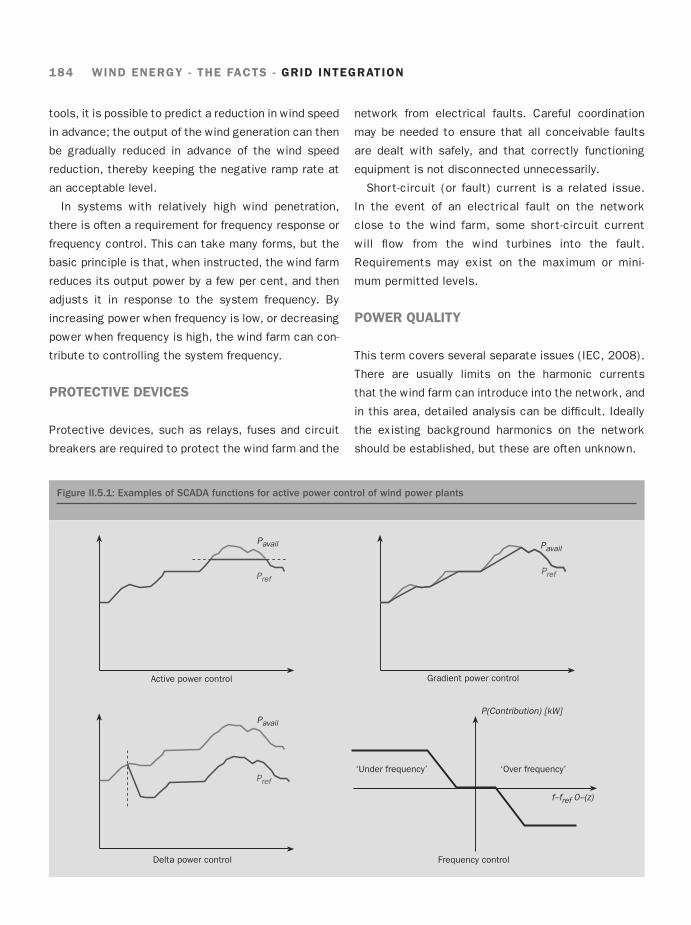
tools, it is possible to predict a reduction in wind speed
in advance; the output of the wind generation can then
be gradually reduced in advance of the wind speed
reduction, thereby keeping the negative ramp rate at
an acceptable level.
In systems with relatively high wind penetration,
there is often a requirement for frequency response or
frequency control. This can take many forms, but the
basic principle is that, when instructed, the wind farm
reduces its output power by a few per cent, and then
adjusts it in response to the system frequency. By
increasing power when frequency is low, or decreasing
power when frequency is high, the wind farm can con-
tribute to controlling the system frequency.
PROTECTIVE DEVICES
Protective devices, such as relays, fuses and circuit
breakers are required to protect the wind farm and the
network from electrical faults. Careful coordination
may be needed to ensure that all conceivable faults
are dealt with safely, and that correctly functioning
equipment is not disconnected unnecessarily.
Short-circuit (or fault) current is a related issue.
In the event of an electrical fault on the network
close to the wind farm, some short-circuit current
will fl ow from the wind turbines into the fault.
Requirements may exist on the maximum or mini-
mum permitted levels.
POWER QUALITY
This term covers several separate issues (IEC, 2008).
There are usually limits on the harmonic currents
that the wind farm can introduce into the network, and
in this area, detailed analysis can be diffi cult. Ideally
the existing background harmonics on the network
should be established, but these are often unknown.
Figure II.5.1: Examples of SCADA functions for active power control of wind power plants
Pavail
Active power control Gradient power control
PrefPref
Pavail
Delta power control
Pavail
Pref
Frequency control
‘Under frequency’ ‘Over frequency’
f–fref 0–(z)
P(Contribution) [kW]
184 WIND ENERGY - THE FACTS - GRID INTEGRATION
1565_Part II.indd 184 2/17/2009 7:12:13 PM
On weak networks, voltage steps, caused by wind
turbines starting or stopping, or the energisation of
transformers, can be a problem. A related problem is
voltage fl icker, which can be caused by wind turbines
starting or stopping, or even when they are in continu-
ous operation.
FUTURE DEVELOPMENTS
As noted above, as wind penetration increases,
future technical requirements may well become more
onerous.
One possible requirement is for an ‘inertia function’.
The spinning inertias of a conventional power plant
provide considerable benefi t to the power system by
acting as a fl ywheel, and thereby reducing the short-
term effects of differences in supply and demand.
Variable speed wind turbines have no such equivalent
effect, but theoretically their control systems could
provide a function that mimics the inertia effect.
There may also be a move towards markets for con-
trol services, rather than mandatory requirements.
This would make sense economically, as the generator
best able to provide the service would be contracted.
Also, due to the very low marginal cost of renewable
energy sources, such as wind energy, it would be more
environmentally and economically effective. For exam-
ple, if a wind farm provided a useful service to the
network operator in terms of voltage control (in other
words it did more than just make up for its negative
effects), then the wind farm could be paid for this ser-
vice. This may be cheaper than other options available
to the network operator.
HARMONISATION OF GRID CODES
The way in which grid code requirements in Europe
have developed has resulted in gross ineffi ciencies
and additional costs for consumers, manufacturers
and wind farm developers. With the increasing
penetration of wind energy, there is an increasing
need to develop a harmonised set of grid code require-
ments. Harmonised technical requirements will maxi-
mise effi ciency for all parties, and should be employed
wherever possible and appropriate. However, it is not
practical to completely harmonise technical require-
ments immediately, since this could lead to the
unnecessary implementation of the most stringent
requirements from each Member State, which would
not be effi cient or economically sound.
EWEA has established a Grid Code Working Group
among its members. The group consists of wind tur-
bine manufacturers, wind farm operators, service pro-
viders, certifi cation bodies and engineering companies.
There is a consensus in the industry that there is an
urgent need to carry out a harmonisation exercise, as
wind penetration is forecast to increase signifi cantly
in the short to medium term. The working group is
working on a two-step approach:
1. a structural harmonisation exercise, with the aim
of establishing a grid code template with common
defi nitions, parameters, units and fi gures, as well
as a common structure; and
2. a technical harmonisation exercise, with the aim of
adapting existing grid code parameters to the new
grid code template.
This harmonisation strategy will be of particular
benefi t to:
manufacturers, who will be required to develop only •
common hardware and software platforms;
developers, who will benefi t from reduced costs; and•
system operators, especially those who have yet to •
develop their own grid code requirements for wind
power plants.
The technical basis for the requirements will be fur-
ther developed by TSOs and the wind power industry.
WIND ENERGY - THE FACTS - GRID CONNECTION REQUIREMENTS 185
1565_Part II.indd 185 2/17/2009 7:12:14 PM

WIND POWER’S CONTRIBUTION TO SYSTEM ADEQUACYII.6
This chapter discusses the extent to which installed
wind power capacity statistically contributes to the
guaranteed generation capacity at peak load. This fi rm
capacity part of the installed wind capacity is called
‘capacity credit’, and is relevant since total wind power
capacity will be a substantial fraction of the total gen-
eration capacity. At the European level, this will represent
30–40 per cent of total generating capacity, corre-
sponding to the wind power targets for 2020 and 2030.
However, in 2008, wind power capacity only represents
around 10 per cent of European generation capacity.
Substantial amounts of new capacity need to be
built in the coming decades to meet increasing demand
in Europe and to replace old plants. UCTE estimates
that, by 2015, generating capacity in its area will
increase by 90 GW, with 60 GW coming from renew-
ables, the majority of which will be wind power.
As for all renewable sources that cannot be stored,
wind has a capacity credit that is lower than that of
conventional generation technologies. However, there
is a certain amount of fi rm wind capacity that contrib-
utes to the adequacy of the power system. Before
expanding on the capacity credit of wind power, a brief
explanation will be given of the current methods of
estimating power system adequacy.
Security of Supply and System Adequacy
The peak demand (or peak load) of electricity in Europe
is constantly increasing. Over the coming years, UCTE
expects a rise in peak demand of around 1.6–1.7 per
cent per year (compared with 2 per cent up to 2007)
(Figure II.6.1). The peak demand is a strategic param-
eter, since it determines the required generating
and transmission capacities. As a matter of conven-
tion, for system design purposes, peak load values at
specifi c points during the year – in January and July –
are considered.
The way in which the power system can match the
evolution in electricity demand is expressed as ‘system
adequacy’. System adequacy measures the ability of a
power system to cope with its load in all the steady
states it may operate in under standard conditions.
This adequacy has different components:
the ability of the generation assets to cover the •
peak load, taking into account uncertainties in the
generation availability and load level; and
the ability of the transmission system to perform, •
considering the fl exibility provided by interconnec-
tion and import and export fl ows.
System operators are responsible for maintaining
system adequacy at a defi ned high level. In other
words, they should ensure that the generation system
is able to cover the peak demand, avoiding loss-of-load
events, for a given security of supply. The various
national regulations regarding this ‘security of supply’
range from a 99 per cent security level (in 1 out of 100
years the peak load cannot be covered, such as in
Germany) to 91 per cent (1 event in 10 years, such as
in the UK).
As the whole European system is interconnected, it
is logical for national TSOs to harmonise their
approaches towards system adequacy. This is
addressed mainly by the larger systems, such as UCTE,
the Nordic system, and the British and Irish systems.
The assessment methods of generation adequacy can
be deterministic or probabilistic, or a combination of
both. Even from a national point of view, the system
adequacy assessment involves transnational issues.
This is because, at the moment of peak load, it may be
necessary to have access to power produced by a
neighbouring country, so the transmission system
should be able to carry and direct these transnational
power fl ows.
The UCTE system’s adequacy is being annually
reviewed over a period of ten years. Generation ade-
quacy assessment is based on the estimation of
‘remaining capacity’, which can be interpreted as:
the capacity needed by the system to cover the dif-•
ference between the peak load of each country and
1565_Part II.indd 186 2/17/2009 7:12:14 PM

the load at the UCTE synchronous reference time
(‘margin against peak load’); or
exceptional demand variation and unplanned out-•
ages that the system operators have to cover with
additional reserves.
Generation adequacy assessment underscores how
each country could satisfy its interior load with the
available national capacity. Transmission adequacy
assessment then investigates whether the transmis-
sion system is large enough to enable the potential
imports and exports resulting from various national
power balances, thus improving the reliability of the
European power system.
In the Nordel zone, TSOs still conduct these reviews,
but theoretically the electricity market price signals
are considered suffi cient to trigger the building of new
capacity to fulfi l adequacy needs. As long as the
results of the reviews are positive, there is no need to
keep reserves in the power system. However, in many
countries, a number of contracts are drawn up to
ensure that there is spare capacity available in extreme
loading situations, often with older plants or loads that
can be switched on or off in critical situations.
Figure II.6.1: Overview of growth in electricity demand in the UCTE area
EU membersAT
>3%
1%–3%
<1%
GBIE
EE
LV
LT
PL
DK-W
DENL
BE
LU
FR
ESPT
CH AT
CZSK
HURO
BG
GR
MK
RS
ME
BAHR
SI
IT
UA-W
AL
SE
TR
MD
BY
RU
TN
NO
DZMA
Source: UCTE (2008)
WIND ENERGY - THE FACTS - WIND POWER’S CONTRIBUTION TO SYSTEM ADEQUACY 187
1565_Part II.indd 187 2/17/2009 7:12:14 PM
In the adequacy estimation, each power plant is
assigned a typical capacity value. This takes into
account scheduled and unscheduled outages. There
are no plants with a capacity value of 100 per cent,
since there is always the possibility that capacity will
not be available when required. In its forecast, UCTE
is looking at increasing shares of wind power in the
coming years. It is clear from the UCTE system ade-
quacy forecasts that there is not yet a national TSO
standard for the determination of wind power’s
capacity credit.
Capacity Credit of Wind Power
CAPACITY CREDIT IS THE MEASURE FOR FIRM WIND POWER
The contribution of variable output wind power to sys-
tem security, that is the capacity credit of wind, is
estimated by determining the capacity of conventional
plants displaced by wind power, whilst maintaining the
same degree of system security, in other words an
unchanged probability of failure to meet the reliability
criteria for the system. Alternatively, it is estimated by
determining the additional load that the system can
carry when wind power is added, maintaining the same
reliability level.
Many national wind integration studies have been
giving special attention to the capacity credit of wind,
as in some ways it is a ‘synthetic’ indicator of the
potential benefi t of wind as a generator in the system.
Sometimes the capacity credit of wind power is mea-
sured against the outage probabilities of conventional
plants.
CAPACITY CREDIT VALUES OF WIND POWER
Despite the variations in wind conditions and system
characteristics among the European countries and
regions, capacity credit calculations are fairly similar
(Giebel, 2005).
For low wind energy penetrations levels, the relative
capacity credit of wind power (that is ‘fi rm’ capacity as
a fraction of total installed wind power capacity) will be
equal or close to the average production (load factor)
during the period under consideration, which is usually
the time of highest demand. For north European coun-
tries, this is at wintertime and the load factor is typi-
cally at 25–30 per cent onshore and up to 50 per cent
offshore. The load factor determining the capacity credit
in general is higher than the average yearly load factor.
With increasing penetration levels of wind energy
in the system, its relative capacity credit reduces.
However, this does not mean that less conventional
capacity can be replaced, but rather that a new wind
plant added to a system with high wind power penetra-
tion levels will substitute less than the fi rst wind plants
in the system. This is illustrated in Figure II.6.2, where
the relative capacity credit tails off towards a value
depending mainly on the minimum load factor.
Table II.6.1 summarises the factors leading to higher
or lower levels of capacity credit. Figure II.6.2, which
is based on calculations in the DENA 1 study (DENA,
2005), shows the effect on capacity credit of expected
improved load factors in Germany resulting from
improved wind power technology (more effi cient
rotors) and the use of sites with higher wind speeds
(offshore).
Wind power thus displaces conventional capacity
in the system. The fraction of wind power that displaces
conventional capacity may be limited, but the corre-
sponding absolute capacities are signifi cant. The aggre-
gated capacity credit of the wind power plants in a
system depends on many factors. Major decisive factors
depend on the power system being considered (reliabil-
ity level and fl exibility of the generation mix) and the
penetration level of wind power in the system. Other
factors are related to wind and wind technology, such
as the average capacity factor9 and the geographical
dispersion of wind plants in the system. The relative
capacity credit decreases from a value approximately
equal to the load factor at high load (25–35 per cent) for
188 WIND ENERGY - THE FACTS - GRID INTEGRATION
1565_Part II.indd 188 2/17/2009 7:12:14 PM

low penetrations to approximately 10–15 per cent at
high penetrations.
Although wind power has a capacity credit both
physically and technically, this characteristic currently
has no value in the power market as wind power pro-
ducers are not generally rewarded for providing fi rm
capacity in the system.
Figure II.6.2: Relationship of installed wind power and capacity credit in Germany
30%
25%
20%
15%
10%
5%
0%0
Wind powerconfiguration 2003
Wind powerconfiguration 2020
49464340372822197
Rel
ativ
e ca
paci
ty c
redi
t
Wind power capacity (GW)
3431251613104 GW
Source: DENA (2005)
Table II.6.1: Factors affecting positively and negatively the value of the capacity credit of a certain amount of wind power
in the system
Higher capacity credit (%) Lower capacity credit (%)
Low penetration of wind power High penetration of wind
Higher average wind speed; high wind season when demand peaks Lower average wind speeds
Lower degree of system security High degree of system security
Higher wind power plant (aggregated) capacity factor or load factor (determined by wind climate, plant effi ciency and specifi c rated power per m2)
Lower aggregated capacity factor (or load factor) ofwind power
Demand and wind are correlated Demand and wind uncorrelated
Low correlation of wind speeds at the wind farm sites (often related to large size of area considered)
Higher correlation of wind speeds at wind farm sites; smaller areas considered
Good wind power exchange through interconnection Poor wind power exchange between systems
Source: EWEA
WIND ENERGY - THE FACTS - WIND POWER’S CONTRIBUTION TO SYSTEM ADEQUACY 189
1565_Part II.indd 189 2/17/2009 7:12:15 PM

ECONOMIC ASPECTS: INTEGRATION COSTS AND BENEFITSII.7
The introduction of signifi cant amounts of wind energy
into the power system brings a series of economic
impacts, both positive and negative. At power system
level, two main factors determine wind energy integra-
tion costs:
1. balancing needs; and
2. grid infrastructure.
The additional balancing cost in a power system
arises from the inherent variable nature of wind power,
requiring changes in the confi guration, scheduling
and operation of other generators to deal with unpre-
dicted deviations between supply and demand. Here,
we demonstrate that there is suffi cient evidence avail-
able from national studies to make a good estimate
of such costs (see page 168). Furthermore, they are
fairly low in comparison with the generation costs of
wind energy and the overall balancing costs of the
power system.
Network upgrade costs are necessary for a number
of reasons. First, additional transmission lines and
capacity need to be provided to reach and connect
existing and future wind farm sites and to transport
power fl ows in the transmission and distribution
networks. These fl ows result both from an increasing
demand and trade of electricity and from the rise of
wind power. At signifi cant wind energy penetrations,
depending on the technical characteristics of the wind
projects and trade fl ows, the networks must also be
adapted to improve voltage management. Furthermore,
limited interconnection capacity is often a barrier for
optimally capturing the benefi ts of the continental
nature of the wind resource, other renewable energy
sources and electricity trade in general. In this respect,
any infrastructure improvement will provide multiple
benefi ts to the system, and therefore its cost should
not be allocated only to wind power generation.
The cost of modifying the power system with signi-
fi cant amounts of wind energy increases in a linear
fashion, and identifying its ‘economic optimum’ is not
evident, as costs are accompanied by benefi ts. From
the studies carried out so far, and the extrapolation of
their results to high penetration levels, it is clear that
the integration of more than 20 per cent of wind power
into the EU power system would be economically as
well as environmentally benefi cial.
Additional Balancing and Network Costs
ADDITIONAL BALANCING COSTS
Additional balancing requirements in a system depend
on a whole range of factors, including:
the level of wind power penetration in the system, •
as well as the characteristic load variations and
the pattern of demand compared with wind power
variations;
geographical aspects, such as the size of the •
balancing area, geographical spread of wind power
sites and aggregation;
the type and marginal costs of reserve plants (such •
as fossil and hydro);
costs and characteristics of other mitigating •
options present in the system, such as storage;
the possibility of exchanging power with neighbour-•
ing countries via interconnectors; and
the operational routines of the power system, for •
example how often the forecasts of load and wind
energy are updated (gate closure times) and the
accuracy, performance and quality of the wind
power forecast system used.
At wind energy penetrations of up to 20 per cent of
gross demand, system operating cost increases by
about €1 –4/MWh of wind generation. This is typically
10 per cent or less of the wholesale value of wind
energy. Note that these fi gures refer to balancing
costs; costs given earlier (page 168) were for the
reserves requirement.
Figure II.7.1 illustrates the costs from several stud-
ies as a function of wind power penetration. Balancing
1565_Part II.indd 190 2/17/2009 7:12:15 PM

costs increase on a linear basis with wind power pen-
etration; the absolute values are moderate and always
less than €4/MWh at 20 per cent level (and more
often in the range below €2/MWh).
There are several major contributing factors to lower
balancing costs:
Larger areas• : Large balancing areas offer the ben-
efi ts of lower variability. They also help decrease
the forecast errors of wind power, and thus reduce
the amount of unforeseen imbalance. Large areas
favour the pooling of more cost-effective balancing
resources. In this respect, the regional aggregation
of power markets in Europe is expected to improve
the economics of wind energy integration. Additional
and better interconnection is the key to enlarging
balancing areas. Certainly, improved interconnec-
tion will bring benefi ts for wind power integration,
and these are presently quantifi ed by studies such
as TradeWind.
Reducing gate closure times• : This means operating
the power system close to the delivery hour. For
example, a re-dispatch, based on a four- to six-hour
forecast update, would lower the costs of integrat-
ing wind power compared to scheduling based on
only day-ahead forecasts. In this respect, the emer-
gence of intraday markets is good news for the
wind energy sector.
Improving the effi ciency of the forecast systems• :
Balancing costs could be decreased if the wind fore-
casts could be improved, leaving only small devia-
tions to the rest of the power system. Experience in
different countries (Germany, Spain and Ireland) has
shown that the accuracy of the forecast can be
improved in several ways, ranging from improve-
ments in meteorological data supply to the use of
ensemble predictions and combined forecasting. In
this context, the forecast quality is being improved
by making a balanced combination of different data
sources and methods in the prediction process.
ADDITIONAL NETWORK COSTS
The consequences of adding more wind power into the
grid have been analysed in several European countries
(see, for example, Holttinen et al., 2007) (Table II.7.1).
The national studies quantify grid extension measures
and the associated costs caused by additional genera-
tion and demand in general, and by wind power produc-
tion in particular. The analyses are based on load fl ow
simulations of the corresponding national transmission
and distribution grids and take into account different
scenarios for wind energy integration using existing,
planned and future sites.
It appears that additional grid extension/reinforce-
ment costs are in the range of €0.1–5/MWh wind,
Figure II.7.1: Estimates for the increase in balancing and
operating costs due to wind power
4.5
4.0
3.5
3.0
2.5
2.0
1.5
1.0
0.5
0.0
Nordic 2004Finland 2004UKIreland
10%
Euro
s/M
Wh
win
d
Wind penetration (% of gross demand)
5% 25%20%15%0%
Increase in balancing cost
Greennet GermanyGreennet DenmarkGreennet FinlandGreennet NorwayGreennet Sweden
Source: Holttinen et al. (2007)10
WIND ENERGY - THE FACTS - ECONOMIC ASPECTS: INTEGRATION COSTS AND BENEFITS 191
1565_Part II.indd 191 2/17/2009 7:12:15 PM

typically around 10 per cent of wind energy generation
costs for a 30 per cent wind energy share. As for the
additional balancing costs, the network cost increases
with the wind penetration level. Grid infrastructure
costs (per MWh of wind energy) appear to be around
the same level as additional balancing costs for
reserves in the system to accommodate wind power.
The costs of grid reinforcement due to wind energy
cannot be directly compared, as circumstances vary
signifi cantly from country to country. These fi gures also
tend to exclude the costs for improving interconnection
between Member States. This subject is now being
investigated by the TradeWind project (www.trade-wind.
eu/), which investigates scenarios up to 2030.
Allocating Grid Infrastructure Costs
There is no doubt that the transmission and distribu-
tion infrastructure will have to be extended and
reinforced in most EU countries when large amounts of
wind power are connected. However, these adapta-
tions are necessary not only to accommodate wind
power, but also to connect other electricity sources to
meet the rapidly growing European electricity demand
and trade fl ows.
However, the present grid system is not used to its
full capacity and present standards and practices of
transmission lines by TSOs are still largely based on
the situation before wind energy came into the pic-
ture. As wind power is producing in a whole range of
partial load states, wind farms will only utilise the full
rated power transmission capacity for a fraction of the
time. In some cases, where there is adjustable power
production (such as hydropower with reservoir), the
combination of wind and hydro can use the same trans-
mission line.
The need to extend and reinforce the existing grid
infrastructure is also critical. Changes in generation
and load at one point in the grid can cause changes
throughout the system, which may lead to power con-
gestion. It is not possible to identify one (new) point of
generation as the single cause of such diffi culties,
other than it being ‘the straw that broke the camel’s
back’. Therefore, the allocation of costs required to
accommodate a single new generation plant to one
plant only (for example a new wind farm) should be
avoided.
In the context of a strategic EU-wide policy for long-
term, large-scale grid integration, the fundamental own-
ership unbundling between generation and transmission
is indispensable. A proper defi nition of the interfaces
between the wind power plant itself (including the
‘internal grid’ and the corresponding electrical equip-
ment) and the ‘external’ grid infrastructure (new grid
connection and extension/reinforcement of the exist-
ing grid) needs to be discussed, especially for remote
wind farms and offshore wind energy. This does not nec-
essarily mean that the additional grid tariff components,
due to wind power connection and grid extension/
reinforcement, must be paid by the local/regional
Table II.7.1: Grid upgrade costs from selected national system studies
Country Grid upgrade costs, €/kW Installed wind power capacity, GW Remarks
Portugal 53–100 5.1 Only additional costs for wind power
The Netherlands 60–110 6.0 Specifi cally offshore wind
UK 45–100 8.0
UK 62–85 26.0 20% wind power penetration
Germany 100 36.0 DENA 1 study
Source: Holttinen et al. (2007)
192 WIND ENERGY - THE FACTS - GRID INTEGRATION
1565_Part II.indd 192 2/17/2009 7:12:15 PM

customers only. These costs could be socialised within
a ‘grid infrastructure’ component at national or even EU
level. Of course, appropriate accounting rules would
need to be established for grid operators.
Future System Cost Developments
Assessment of the way in which integration costs
beyond the present ‘low to moderate’ penetration level
will increase depends on how the future evolution of
the power system is viewed. A ‘static power system’
assumption becomes less plausible with increasing
wind penetration, as wind serving a substantial (higher
than 25 per cent) fraction of the demand will cause
the system to evolve over time. Furthermore, the
generation mix is likely to change signifi cantly during
this long period of wind development. For example, it
is predicted that gas power generation will increase
dramatically (depending on fuel costs), which will
make the power system more fl exible. Hence the inte-
gration costs of wind energy increase smoothly and
proportionally as penetration levels increase.
Costs beyond penetration levels of about 25 per
cent will depend on how the underlying system archi-
tecture changes over time, as the amount of installed
wind gradually increases, together with other generat-
ing technologies. For example, in order to accommo-
date high amounts of wind power, a system with a
generation mix dominated by fast-ramping gas turbines
or hydro is much more fl exible than a system domi-
nated by nuclear or coal, as it can respond quickly to
changes in supply and demand.
Up to a penetration level of 25 per cent, the integra-
tion costs have been analysed in detail and are consis-
tently low. The economic impacts and integration
issues are very much dependent on the power system
in question. Important factors include:
the structure of the generation mix and its fl exi-•
bility;
the strength of the grid;•
the demand pattern;•
power market mechanisms; and•
structural and organisational aspects.•
Technically, methods that have been used by power
engineers for decades can be applied for integrating wind
power. But for large-scale integration (penetration levels
typically higher than 25 per cent), new power system
concepts may be necessary, and it would be sensible to
start considering such concepts immediately. Practical
experience with large-scale integration in a few regions
demonstrates that this is not merely a theoretical dis-
cussion. The feasibility of large-scale penetration has
already been proved in areas where wind power currently
meets 20, 30 and even 40 per cent of consumption
(Denmark and regions of Germany and Spain).
Wind Power will Reduce Future European
Power Prices
In a 2008 study (Skytte, 2008), Econ-Pöyry used its
elaborate power model to investigate the electricity
price effects of increasing wind power in Europe to
13 per cent in 2020.
In a business-as-usual scenario, it is assumed that
the internal power market and additional investments
in conventional power will more or less levelise the
power prices across Europe up until 2020 (reference
scenario). However, in a large-scale wind scenario (wind
covering 13 per cent of EU electricity consumption)
this might not be the case.
In areas where power demand is not expected to
increase very much and in areas where the amount of
new deployment of wind energy is larger than the
increase in power demand, wind energy will substitute
the most expensive power plants. This will lower the
price levels in these areas, the study shows.
In the EU, the expected price level is around 5.4c€/
kWh on average in 2020 for the reference case
(Figure II.7.2) with a slightly higher price on the conti-
nent than in the Nordic countries, but with smaller
price differences than today.
WIND ENERGY - THE FACTS - ECONOMIC ASPECTS: INTEGRATION COSTS AND BENEFITS 193
1565_Part II.indd 193 2/17/2009 7:12:15 PM

In the wind scenario, the average price level in the
EU decreases from 5.4 to 5.1c€/kWh compared to
the reference scenario. However, the effects on power
prices are different in the hydropower-dominated
Nordic countries than in the thermal-based countries
on the European continent.
In the wind scenario, wind energy reduces power
prices to around 4c€/kWh in the Nordic countries.
Prices in Germany and the UK remain at the higher level.
In other words, a larger amount of wind power would
create larger price differences between the (hydro-
dominated) Nordic countries and the European continent.
One implication of price decreases in the Nordic coun-
tries is that conventional power production becomes
less profi table. For large-scale hydropower the general
water value decreases. In Norway, hydropower counts
for the major part of the power production. However,
large-scale implementation of wind creates a demand
for fl exible production that can deliver balancing
services – opening up a window of opportunities for
fl exible production such as hydropower.
With large amounts of wind in the system, there will
be an increased need for interconnection. This is also
confi rmed by the fact that, in the Econ-Pöyry model
runs, with 13 per cent wind in the system compared to
the reference scenario, the congestion rent (i.e. the
cable income) increases on most transmission lines.
This is also something one would expect: with more
Figure II.7.2: Price levels in 2005 and in the 2020 reference and wind scenarios
9
8
7
6
5
4
3
2
1
0
Austria
c/k
Wh
Belgi
um
Czec
h Re
publi
c
Denmar
k – Ju
tland
Denmar
k – Zea
land
Finlan
d
Franc
e
German
y
Hunga
ryIta
ly
Nethe
rland
s
Norway
Polan
d
Portu
gal
Slov
akia
Slov
enia
Spain
Swed
en
Switz
erlan
d UK
Euro
pe
5.45.1
4.0
Base 2005
2020 reference
2020 wind scenario
Source: Econ-Pöyry
194 WIND ENERGY - THE FACTS - GRID INTEGRATION
1565_Part II.indd 194 2/17/2009 7:12:15 PM
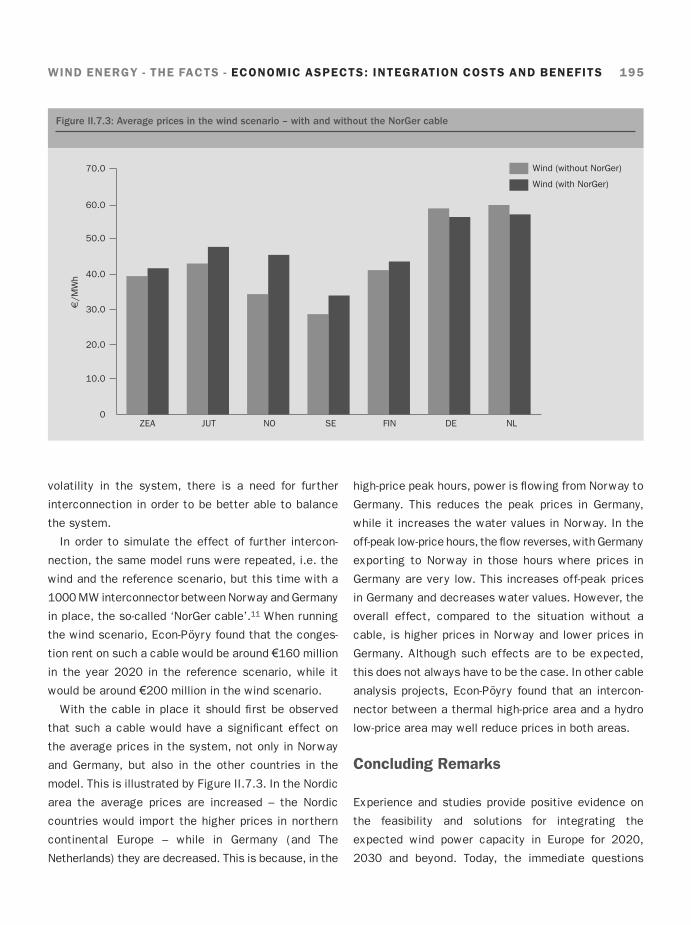
volatility in the system, there is a need for further
interconnection in order to be better able to balance
the system.
In order to simulate the effect of further intercon-
nection, the same model runs were repeated, i.e. the
wind and the reference scenario, but this time with a
1000 MW interconnector between Norway and Germany
in place, the so-called ‘NorGer cable’.11 When running
the wind scenario, Econ-Pöyry found that the conges-
tion rent on such a cable would be around €160 million
in the year 2020 in the reference scenario, while it
would be around €200 million in the wind scenario.
With the cable in place it should fi rst be observed
that such a cable would have a signifi cant effect on
the average prices in the system, not only in Norway
and Germany, but also in the other countries in the
model. This is illustrated by Figure II.7.3. In the Nordic
area the average prices are increased – the Nordic
countries would import the higher prices in northern
continental Europe – while in Germany (and The
Netherlands) they are decreased. This is because, in the
high-price peak hours, power is fl owing from Norway to
Germany. This reduces the peak prices in Germany,
while it increases the water values in Norway. In the
off-peak low-price hours, the fl ow reverses, with Germany
exporting to Norway in those hours where prices in
Germany are very low. This increases off-peak prices
in Germany and decreases water values. However, the
overall effect, compared to the situation without a
cable, is higher prices in Norway and lower prices in
Germany. Although such effects are to be expected,
this does not always have to be the case. In other cable
analysis projects, Econ-Pöyry found that an intercon-
nector between a thermal high-price area and a hydro
low-price area may well reduce prices in both areas.
Concluding Remarks
Experience and studies provide positive evidence on
the feasibility and solutions for integrating the
expected wind power capacity in Europe for 2020,
2030 and beyond. Today, the immediate questions
Figure II.7.3: Average prices in the wind scenario – with and without the NorGer cable
70.0
60.0
50.0
40.0
30.0
20.0
10.0
0
/MW
h
ZEA
Wind (without NorGer)
Wind (with NorGer)
JUT NO SE FIN DE NL
WIND ENERGY - THE FACTS - ECONOMIC ASPECTS: INTEGRATION COSTS AND BENEFITS 195
1565_Part II.indd 195 2/17/2009 7:12:15 PM
concern how to address a number of issues in the most
cost-effective manner.
There is now a clearer understanding regarding the
behaviour of aggregated wind plants at the power
system level, as well as how system costs evolve
with increasing wind energy penetration. In the range
of expected wind energy penetration levels for the
coming decades, the cost increments for additional
reserves in the system, to deal with increased variabil-
ity, remain moderate. Additional impacts that wind
power may impose on the system, due to its variability
and limited predictability, should be reduced by:
making use of geographical aggregation;•
improved control of wind plants at both local and •
system levels;
using state-of-the-art forecasting, monitoring and •
communication techniques; and
reinforcing network.•
Specifi c grid code requirements are now being
imposed for wind farms, taking into account the con-
tinuous development of wind power plant capabilities.
In this respect, a more proactive involvement of the
wind power industry in the development of harmonised
grid code requirements in Europe is essential.
A substantial upgrade of transmission networks is
required, and the creation of a transnational offshore
grid would bring additional benefi ts. This network devel-
opment goes hand-in-hand with the necessary upgrades
to achieve a more effi cient European Inter nal Electricity
Market and improved competition in European power
markets. In this respect, a defi nite challenge is the cre-
ation of appropriate market rules, including incentives
to make power generation and transmission evolve in a
direction that facilitates variable output and decentra-
lised generation, by increasing fl exibility and providing
additional network capacity, not only within the national
grids, but also at the transnational level.
There is also a need for studies at the European
level to provide a technical and scientifi c basis for grid
upgrades and market organisation.
Part II Notes
1 Instead of shutting down the wind turbine above cut-out, the power curve above cut-out wind speed (25 m/s) decreases gradually to reach zero power at 35 m/s.
2 See www.trade-wind.eu.
3 Except for unplanned outages of conventional plants, which by nature are not predictable. In this respect, wind power has an advantage, due to its modular nature and the low levels of capacity that are lost at one time during outages.
4 The error reduction in the graph is defi ned as the ratio between the RMSE (root-mean-square-error) of regional prediction and the RMSE of a single site, based on the results of measured power production at 40 wind farms in Germany.
5 The effect of the additional balancing costs at consumer level should take into account the benefi ts of wind power. Several studies show that the overall effect (resulting from costs and benefi ts) of integrating wind power is to reduce the price of electricity to the consumer.
6 FACTS (Flexible AC Transmission Systems): power electronic devices locally implemented in the network, such as STATCOMs and static VAR compensators (SVCs).
7 The MVAR capability is the capability to control reactive power by generation or controlled consumption.
8 FRT is the ability for generators to remain stable and connected to the network when faults occur in the transmission network.
9 Capacity factor depends on the relationship between rotor size and generator rating.
10 The currency conversion used in this fi gure is EUR1 = GBP0.7 = US$1.3. For the UK 2007 study, the average cost is presented; the range for 20 per cent penetration level is from €2.6–4.7/MWh.
11 Classic model runs were repeated with a NorGer cable in place, in order to obtain investment fi gures for 2020, and to be consistent in methodology and approach. It should be noted that the NorGer cable does not have too pronounced an effect on investment levels. The size of the cable has not yet been decided, but a 1000 MW cable is probably a fair estimate and suffi cient in order to simulate the effects of further interconnections.
196 WIND ENERGY - THE FACTS - GRID INTEGRATION
1565_Part II.indd 196 2/17/2009 7:12:15 PM