wind resource assessmentwind.nrel.gov/.../01-05_elliott_wind-resource-assessment.pdfwind resource...
TRANSCRIPT

NREL is a national laboratory of the U.S. Department of Energy, Office of Energy Efficiency and Renewable Energy, operated by the Alliance for Sustainable Energy, LLC.
Wind Resource Assessment
Dennis Elliott
Presentation to:
BLM WEATS
August 31, 2010

National Renewable Energy Laboratory Innovation for Our Energy Future
Wind Resource Assessment Topics for BLM
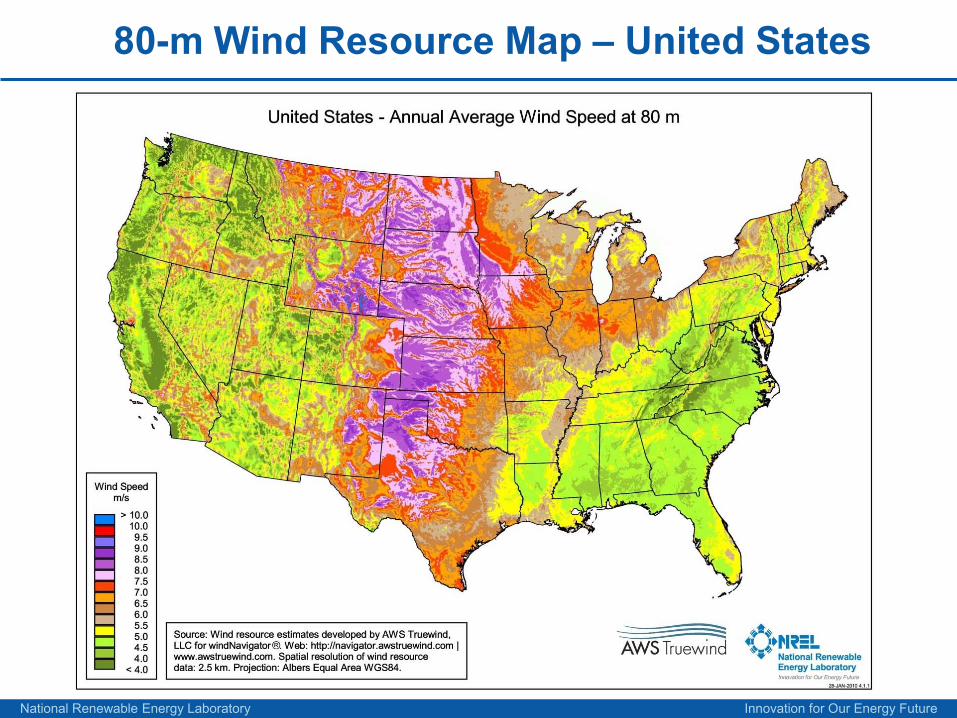
• New Wind Resource Maps and Potential Estimates (Land Areas):– 48 contiguous states, 80-100 m heights, wind speed maps, wind potential from model
capacity factor data, environmental and land-use exclusions– NREL validation of model wind speeds with 300+ tall tower measurement sites– How to use the new maps and potential estimates - not to be used for micrositing, not to be
substituted for measurement data
• Important Wind Characteristics:– Wind shear, spatial and temporal variations, terrain influences– Seasonal and diurnal wind patterns– Wind direction and speed frequencies– Turbulence and importance of measuring, terrain influences
• Tower Measurements and Remote Sensing Measurements:– What tower measurements are most appropriate, when and how long– What is Remote Sensing (Sodar/Lidar) technology, when and how to use it– Best practices for remote sensing, when and how to use with towers

National Renewable Energy Laboratory Innovation for Our Energy Future
US Wind Mapping - Statement of the Problem
Accurate information about the wind resource in each state required• For federal and state policy
discussion, analysis, and implementation
• To support the 20% wind future• To facilitate wind prospecting • To support state, regional and
national wind integration analyses
NREL validation of resource maps is essential to ensure confidence by stakeholders in accuracy of map estimates
Supports the Program’s mission of eliminating barriers to wind energy.

National Renewable Energy Laboratory Innovation for Our Energy Future
Technical Approach - Wind Mapping & ValidationMapping is based on: • Numerical modeling (AWS
Truewind)• Empirical and analytical methods
(NREL validation) • 1 km2 or finer horizontal resolution
wind resource maps
Preliminary maps are validated by NREL and modified using public and private wind measurement data
Develop and validate maps at 50-m height for 39 states
Expand mapping to 48 states with wind speed maps at 80-m height• Develop wind potential estimates
(net of exclusions) at 80 and 100-m heights based on capacity factors
Publish on WPA website
Provide related TA to stakeholders

National Renewable Energy Laboratory Innovation for Our Energy Future
US Wind Mapping – Accomplishments / Results
50-m mapping and validation – total of 39 states & 2 territories• Culmination of a long-term project that began in 2001 jointly funded by states and other
organizations
• Updated the national 50-m wind map
• 50-m wind potential estimates for selected states and US (to support 20% vision study)
• Discussed at WPA summit meetings and key regional/state meetings
80-m mapping and potential estimates (2009-2010) • New products for the contiguous United States and each state developed through a
collaborative project with AWS Truewind• Wind speed maps at 80 m• Selected state maps validated using tower measurement data from 300+ locations• Wind potential estimates at 80 and 100 m based on capacity factor categories• Posted new products to WPA web site (broke all-time records for most hits)• Hosted webinar to discuss new products and methodology (almost 100 attendees)• Presented at Windpower 2010 conference• Responded to many media and stakeholder requests about the new products
National Renewable Energy Laboratory Innovation for Our Energy Future
80-m Wind Resource Map – United States

National Renewable Energy Laboratory Innovation for Our Energy Future
AWS Truewind’s MesoMap Process
GeophysicalData Mesoscale
Simulations(MASS)
MicroscaleSimulations (WindMap)
Wind Maps
MetData
Data Bases
Validation
full equations of motiondynamic366 days from15 years2.5 km resolution
mass-conservingadjusts for localterrain and roughness200 m resolution
global reanalysisrawinsondesurface met data
topographyroughnessvegetation greennesssea temps
comparisonswith met dataadjustmentserror estimates

National Renewable Energy Laboratory Innovation for Our Energy Future
Validation of Wind Resource Estimates
• NREL’s validation of model 80-m wind speeds– Purpose to identify gross disagreements between model
estimates and measured data– Limited to 19 states (6 western, 6 midwestern, 7 eastern)– Data from 304 towers at 45 m and higher used in validation– Average wind speed from towers compared to model estimates
• Results of validation– No gross differences found between measured and model data to
preclude use of these model data for wind potential estimates– National network of measurements near turbine hub-height
needed to estimate wind potential with greater accuracy– Regions where additional measurements are crucial
– Ridge crests sites in eastern U.S.– Interior sites in western U.S.

National Renewable Energy Laboratory Innovation for Our Energy Future
AWS Truewind’s Estimation of Plant Output
For each point, wind speed distribution created from from12 years of weather simulations (windTrends)
Then gross turbine output calculated for a generic IEC Class 2 turbine power curve, corrected for air density
0%
2%
4%
6%
8%
10%
12%
14%
0 2 4 6 8 10 12 14 16 18 20 22 24 >25.5
Wind Speed (m/s)
Freq
uecn
y
Speed FreqWeibull Freq
0%
10%
20%
30%
40%
50%
60%
70%
80%
90%
100%
0 5 10 15 20 25 30
Cap
acity
Fac
tor
Speed (m/s)
Composite IEC Class II Power Curve

National Renewable Energy Laboratory Innovation for Our Energy Future
Development of Wind Potential Estimates
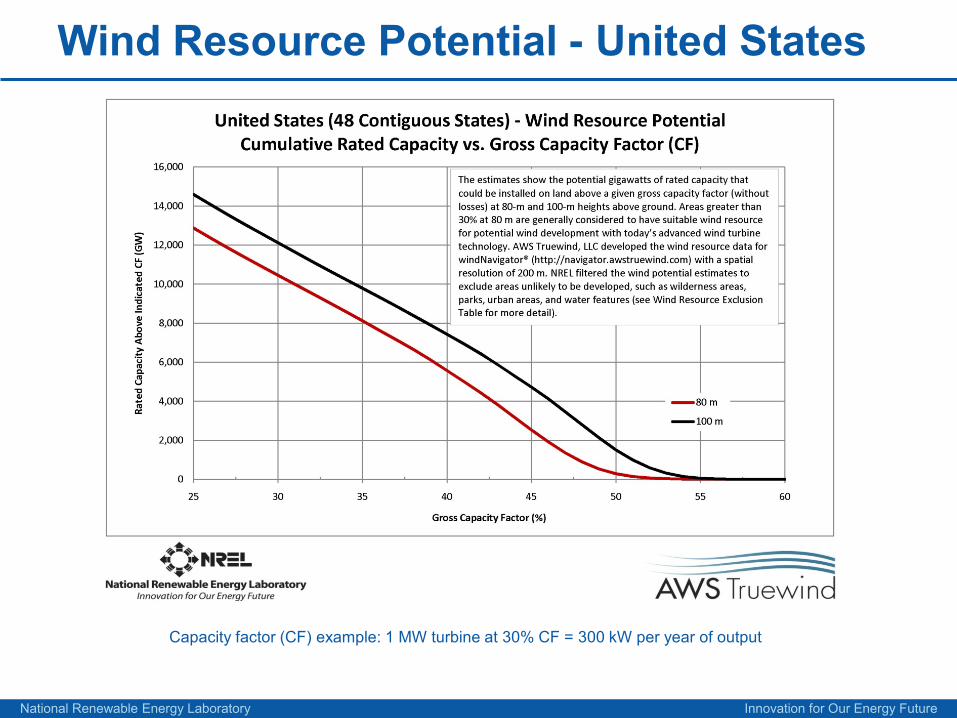
• AWS Truewind produced a national dataset of estimated grosscapacity factor (not adjusted for losses)
– Spatial resolution of 200 m– Heights of 80 m and 100 m– Land-based areas only (no offshore), 48 contiguous states
• NREL used the gross capacity factor (CF) data to estimate the land area and wind potential for each state
– Windy land defined as areas with >= 30% CF, which are generally considered to be suitable for wind energy development
– Areas with CF >=30% have mean annual wind speeds of about 6.4 m/s and greater– Excluded sensitive environmental lands and incompatible land-use areas (see
map)– For wind potential, assumed 5 MW/km2 of installed nameplate capacity

National Renewable Energy Laboratory Innovation for Our Energy Future
National Exclusion Map
National Renewable Energy Laboratory Innovation for Our Energy Future
Wind Resource Potential - United States
Capacity factor (CF) example: 1 MW turbine at 30% CF = 300 kW per year of output

National Renewable Energy Laboratory Innovation for Our Energy Future
Colorado Wind Map and Potential

National Renewable Energy Laboratory Innovation for Our Energy Future
Arizona – Wind Map and Potential

National Renewable Energy Laboratory Innovation for Our Energy Future
Montana – Wind Map and Potential

National Renewable Energy Laboratory Innovation for Our Energy Future
Oregon Wind Map and Potential

National Renewable Energy Laboratory Innovation for Our Energy Future
Capacity Factor vs Wind Speed and Power
WS WPD1.5 2 2.5 3 1.5 2 2.5 3
25% 5.65 5.82 5.98 6.11 25% 300 231 207 19730% 6.28 6.34 6.44 6.55 30% 412 298 259 24235% 6.96 6.87 6.92 6.97 35% 561 379 320 29240% 7.71 7.43 7.39 7.41 40% 763 480 391 34945% 8.56 8.03 7.89 7.85 45% 1044 605 475 41750% 9.57 8.69 8.42 8.32 50% 1460 769 578 496
Weibull k Weibull k
Capa
city
Fac
tor
Capa
city
Fac
tor
Mean Wind Speed (WS) and Wind Power Density (WPD) as functions of Capacity Factor and Weibull k
0
0.05
0.1
0.15
0.2
0.25
0 5 10 15 20 25
Freq
uenc
y
Speed (m/s)
Wind Speed Frequency Distributions
1.502.002.503.50
Weibull k

National Renewable Energy Laboratory Innovation for Our Energy Future
Variation of Wind Power Class and Capacity Factor
Mean wind speed = 7.0 m/s but different Weibull k
California wind corridorWeibull k = 1.5, Power Class = 5, Capacity Factor = 35%
Eastern U.S. Weibull k = 2, Power Class = 4, Capacity Factor = 36%
Midwest U.S.Weibull k = 2.5, Power Class = 3, Capacity Factor = 36%
Specific areasWeibull k = 3, Power Class = 2, Capacity Factor = 35%
Note: Capacity factors are rounded to the nearest whole percent

National Renewable Energy Laboratory Innovation for Our Energy Future
Wind Monitoring Equipment and Measurement Programs
National Renewable Energy Laboratory Innovation for Our Energy Future
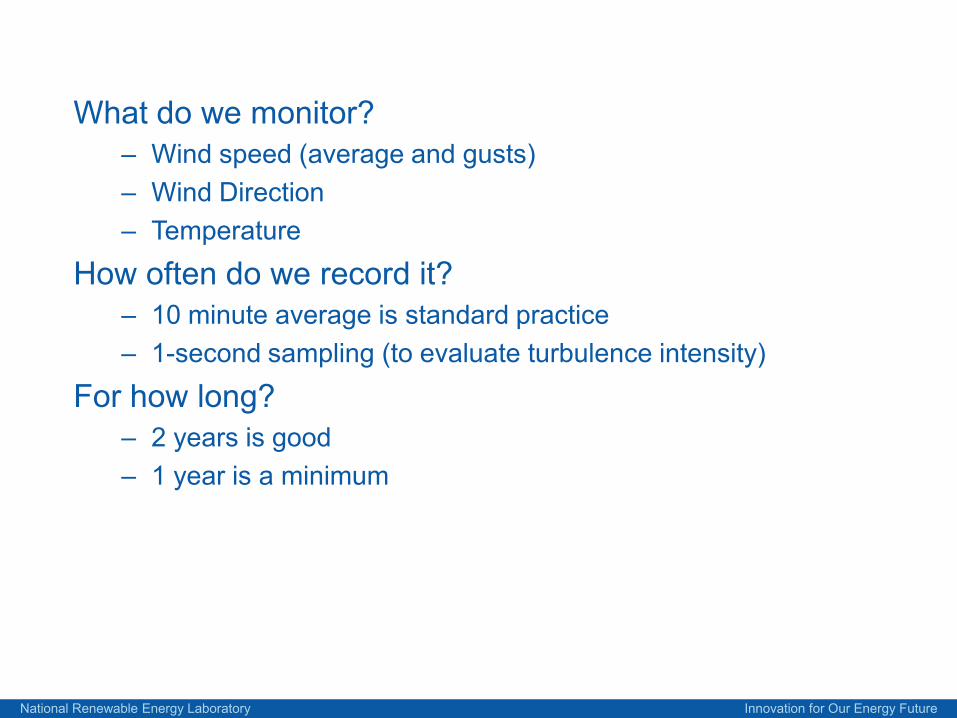
What do we monitor?– Wind speed (average and gusts)– Wind Direction– Temperature
How often do we record it?– 10 minute average is standard practice– 1-second sampling (to evaluate turbulence intensity)
For how long?– 2 years is good– 1 year is a minimum

National Renewable Energy Laboratory Innovation for Our Energy Future
How do we analyze the data?– Spreadsheets (e.g., Excel)– Custom software (e.g., WindPro, Windographer)
Quality Control– Remove periods of bad data (icing, etc.)
Statistics– Average wind speed and wind power density– Seasonal and diurnal variations– Variation with height above ground– Turbulence intensity– Frequencies of wind direction and wind speed– Many others

National Renewable Energy Laboratory Innovation for Our Energy Future
Sample data report for wind measurement site

National Renewable Energy Laboratory Innovation for Our Energy Future
• Sensors (Speed, Direction,Temperature)• Data Loggers• Towers
Wind Monitoring Equipment

National Renewable Energy Laboratory Innovation for Our Energy Future
Tower with Logger and Sensors

National Renewable Energy Laboratory Innovation for Our Energy Future
Anemometer & Wind Vane
$205
Standard anemometer (SecondWind C3) $115Calibrated anemometer (NRG Max40 or SecondWind C3) $295Heated anemometers and vanes for very cold climates $970 each!

National Renewable Energy Laboratory Innovation for Our Energy Future
Temperature Sensor
$195Helps determine periods of icing

National Renewable Energy Laboratory Innovation for Our Energy Future
Towers for Wind Resource Assessment

National Renewable Energy Laboratory Innovation for Our Energy Future
Tubular Towers– Most common for wind evaluation– Tilt-up– Up to 60m (or even 80m)– 20m = $1000, 60m = $10000-
12000Booms hold sensors away from tower

National Renewable Energy Laboratory Innovation for Our Energy Future
Lattice Towers– Existing communications
towers (broadcast, cell phone, etc.)
– Up to 120m– Need permission from
owner

National Renewable Energy Laboratory Innovation for Our Energy Future30
•Tall towers and remote sensing measurements are needed to validate model data at 80-100m and produce high-confidence wind resource data•Tall towers (100 m + in height)
– New towers ($100K/tower for 3 years data)– Existing towers ($50K/tower for 3 years data)
•Remote sensing instruments– Sodar– Lidar– Radar
Tall towers and remote sensing measurements

National Renewable Energy Laboratory Innovation for Our Energy Future31
Annual average shear exponents can vary from 1/7 to 0.25, causing considerable uncer tainty in ver tical extrapolations of wind resource

National Renewable Energy Laboratory Innovation for Our Energy Future32
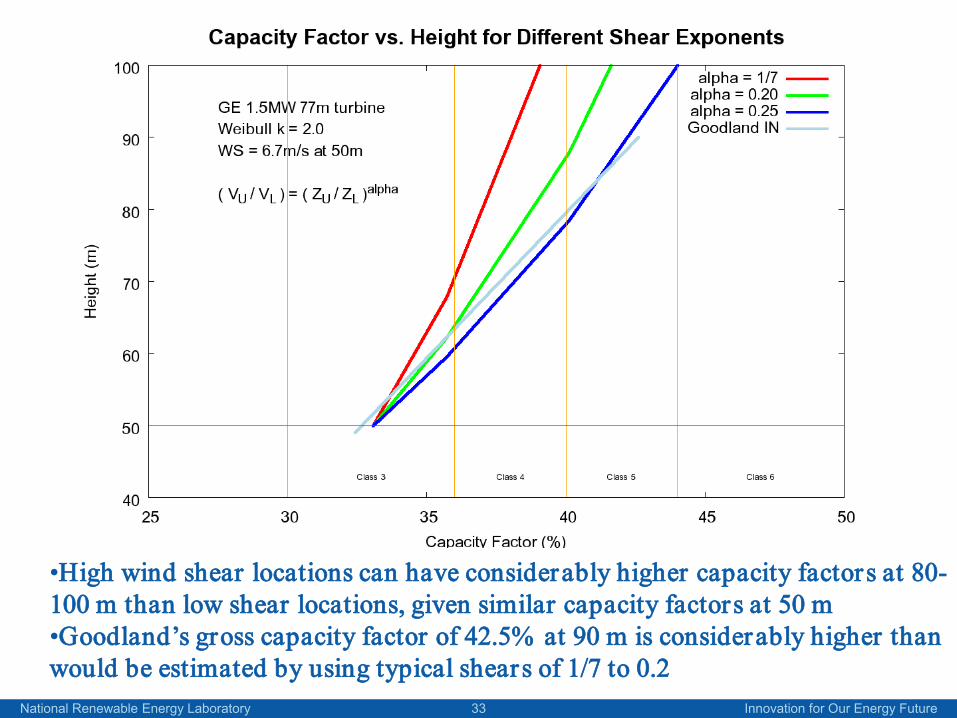
•Even if 50-m wind resource is known, potential var iations in shear exponents cause considerable uncer tainty in wind resource at heights of 80-100 m•Measured shear exponent at Goodland is 0.235, with much higher wind resource at 90 m than estimated by 1/7 shear estimate
National Renewable Energy Laboratory Innovation for Our Energy Future33
•High wind shear locations can have considerably higher capacity factors at 80-100 m than low shear locations, given similar capacity factors at 50 m•Goodland’s gross capacity factor of 42.5% at 90 m is considerably higher than would be estimated by using typical shears of 1/7 to 0.2

National Renewable Energy Laboratory Innovation for Our Energy Future
Southeast Colorado Tower - Wind Power Density by Hour(normalized to midlevel average)
0
0.5
1
1.5
2
2.5
3
0 3 6 9 12 15 18 21 24
Hour of Day
Nor
mal
ized
Win
d Po
wer
Den
sity
3m agl50m agl100m agl
Diurnal Wind Profiles vs Height
•Diurnal wind profiles can change dramatically with height above ground•Without adequate data, hub-height profile estimate is uncertain

National Renewable Energy Laboratory Innovation for Our Energy Future
Seasonal Wind Profiles – Geographic Variations
Seasonal Wind Profiles for Two Locations near Denver, CO
0
200
400
600
800
1000
1200
Jan Feb Mar Apr May Jun Jul Aug Sep Oct Nov Dec
Month
Win
d Po
wer
Den
sity
(W/m
2 )
Maxwell RanchHolcolm Hills
• Seasonal wind profiles can change over short distances depending geography and terrain
• Without adequate data, estimates of seasonal profiles may be uncertain

National Renewable Energy Laboratory Innovation for Our Energy Future
Why Remote Sensing?
80 Meter Diameter RotorOn 80 Meter Tower
60 MeterTilt-Up Mast
Remote SensingInstruments
< 20% of Swept Area
> 100% of Swept Area

National Renewable Energy Laboratory Innovation for Our Energy Future
What is Sodar?
•Sonic detection and ranging•Audible Chirp•Sends a sound signal into the air•Upon return of signal, record changes and calculates wind speed, direction, shear

National Renewable Energy Laboratory Innovation for Our Energy Future
Sodar
• Operates by detecting back-scattered sound (4 to 6 kHz)
• Range 15 m to 200 m above ground (with 5 to 10m resolution)
• Can measure wind at greater levels than tall towers but needs consistent oversight
• Power requirements 10 – 60 Watts

National Renewable Energy Laboratory Innovation for Our Energy Future
Commercially-Available Sodars
39
Second WindTriton
ASC4000
ARTVT-1
ScintecSFAS
Representative Examples of Mini-Sodars
Mini-Sodars Mid-Range Sodars
Nominal operating frequency 4500 Hz 2000 Hz
Measurement range 15-200 m 30-1000 m
Minimum vertical resolution 5-10 m 20 m
Averaging times 2 to 60 minutes 2 to 60 minutes
Claimed accuracy 0.3 to 0.5 m/s 0.3 to 0.5 m/s

National Renewable Energy Laboratory Innovation for Our Energy Future
What is Lidar?
•Laser detection and ranging•Infrared laser•Send a pulsed / swept signal into the air•Upon return of signal, record changes and calculates wind speed, direction, shear

National Renewable Energy Laboratory Innovation for Our Energy Future
Lidar
•Range 10m to150m above ground•Operates by detecting back-scattered light•Similar to sodar, lidar can measure wind at greater heights than towers but needs consistent oversight•Power requirements >100 Watts

National Renewable Energy Laboratory Innovation for Our Energy Future
Commercially-Available Lidars for Wind Energy ApplicationsExamples
42
Natural PowerZephIR
NRG Systems/LeosphereWindCube
Continuous Wave (CW) Lidar
Pulsed Coherent Lidars
Lockheed-MartinWindTracer
Wind Profiling Lidar Scanning Lidars
HALOPhotonics
Catch the WindVindicator
National Renewable Energy Laboratory Innovation for Our Energy Future
Remote Sensing / Tall Tower Data Analysis
Example of Technical Assistance: Cooperative Research and Development Agreement (CRADA)between NREL and Second Wind(a private U.S. company)
NREL analyzed almost 7 months of wind measurement data from a sodar unit and compared these data to measurements from a tall (80-m) meteorological tower.
Results: Generally good agreement between sodar and tower measurements.

National Renewable Energy Laboratory Innovation for Our Energy Future
International Collaboration on Remote Sensing Techniques for Wind Resource Assessment
Technical Assistance
Hosted International Energy Agency Task 11Base Technology Information ExchangeTopical Experts Meeting at NRELRemote Wind Speed Sensing Techniques using SODAR and LIDAROctober 15 & 16, 2009
31 Participants from 11 Countries

National Renewable Energy Laboratory Innovation for Our Energy Future
IEA Meeting on Remote Sensing Using Sodar and Lidar
The IEA Topical Expert Meeting on Remote Sensing at NREL in October 2009 recommended:
• Need for more experience from remote sensing• To increase the accuracy and the repeatability of measurements• Especially comparing the performance of Sodar and Lidar with tower
measurements• Development of IEA Recommended Practices for Sodar and Lidar
• Two ad-hoc groups were formed to put together proposals for the proper operation of Sodar and Lidar
• Draft documents are in preparation• Arrange a new expert meeting to discuss pertinent issues and
new research on this topic

National Renewable Energy Laboratory Innovation for Our Energy Future
Opportunities for Wind Energy Industry
How and when remote sensing is being used?– Fields of application
• Wind Resource Assessment Prelim. siting / Reduce bias-uncertainty
• Site Suitability Curtailment issues• Project Performance Understand underperformance• Offshore Reduce cost of WRAP
– Fields of research• Wind shear Effect on AEP• Wind veer Effect on aeroelastic loading• Turbulence intensity Design improvement• Flow angle Control algorithm• Wake Simulation refinement
Standard update(power curve/site suitability)
How and when should remote sensing be used ?

National Renewable Energy Laboratory Innovation for Our Energy Future
80 Meter Diameter RotorOn 80 Meter Tower
60 MeterTilt-Up Mast
$38K
80 MeterTilt-Up Mast
$65K
Lidar$200K
Sodar$50K-75K
< 20% of Swept Area
< 50% of Swept Area>100% of Swept Area
Met Tower vs. Remote Sensing$$$
5y OPEX=$128k
5y OPEX=$209k
5y OPEX=$82k5y OPEX=$250k

National Renewable Energy Laboratory Innovation for Our Energy Future
Thank you