winter outlook - united states energy association · switching sustained since 2008 . 11 ... last...
TRANSCRIPT

Winter Outlook Heating Season
2014-2015
1

Review: How did we do last winter?
Looking ahead to winter 2014-2015
Market pressure points:
economy, weather, storage & production
Wild card factors
Winter expectations
Summary
2
Winter Outlook: Outline
3
Price
Pressure Predicted Actual Score
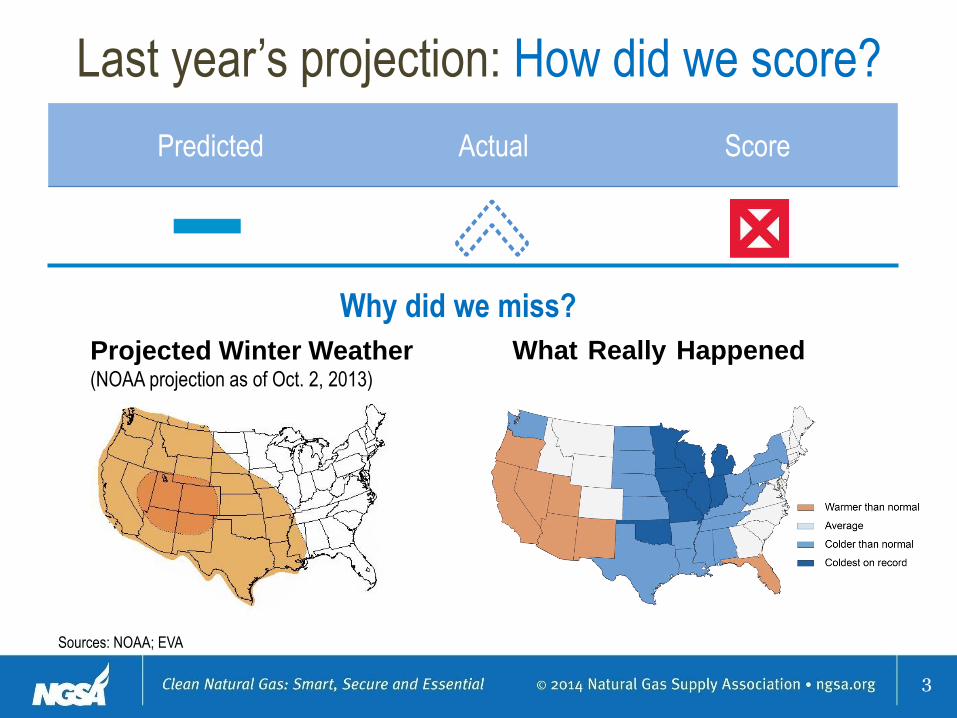
Last year’s projection: How did we score?
Projected Winter Weather (NOAA projection as of Oct. 2, 2013)
What Really Happened
Sources: NOAA; EVA
Why did we miss?

Market Pressure Points 2014-2015
4
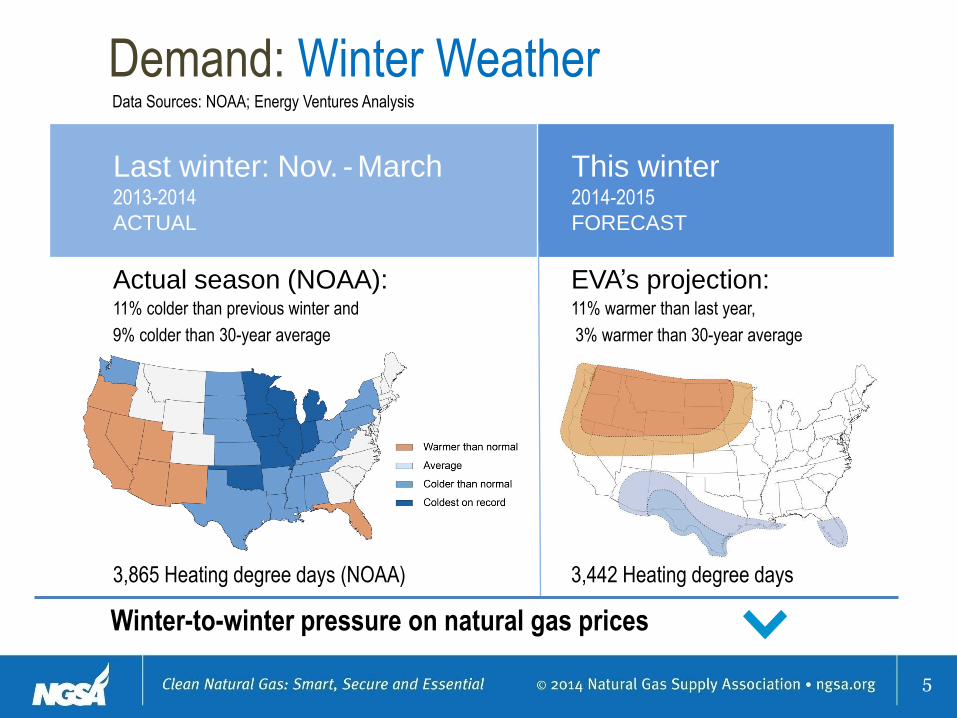
Last winter: Nov. - March 2013-2014
ACTUAL
This winter 2014-2015
FORECAST
Actual season (NOAA): 11% colder than previous winter and
9% colder than 30-year average
3,865 Heating degree days (NOAA)
EVA’s projection: 11% warmer than last year,
3% warmer than 30-year average
3,442 Heating degree days
5
Demand: Winter Weather Data Sources: NOAA; Energy Ventures Analysis
Winter-to-winter pressure on natural gas prices

Winter season Last winter Period-to-period change 2013-2014
Data source: IHS Economics ACTUAL
This winter 2014-2015
FORECAST
Economy Expanded Solid growth
GDP growth 2.5% 2.7%
Unemployment rate 6.8% 5.9%
Manufacturing 2.6% 4.7%
CPI 1.3% 2.0%
Consumer Sentiment Index 78.9 87.3
6
Demand: Economy
Winter-to-winter pressure
on natural gas prices
Winter Season Last winter Period-to-period change 2013-2014
Data source: EVA ACTUAL
This winter 2014-2015
FORECAST
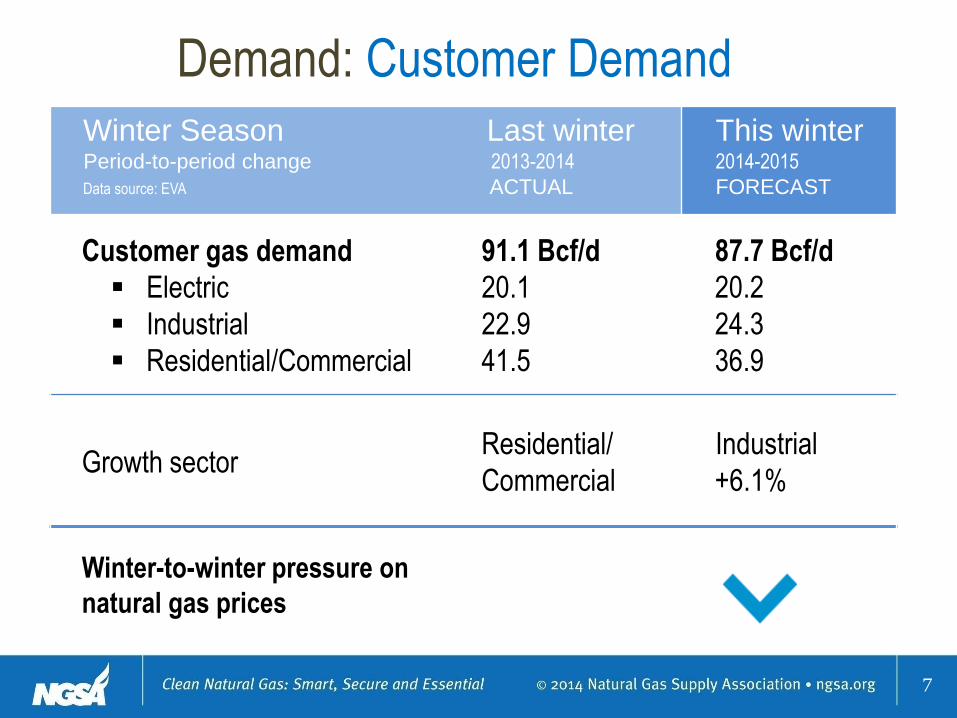
Customer gas demand
Electric
Industrial
Residential/Commercial
91.1 Bcf/d
20.1
22.9
41.5
87.7 Bcf/d
20.2
24.3
36.9
Growth sector Residential/
Commercial
Industrial
+6.1%
Winter-to-winter pressure on
natural gas prices
7
Demand: Customer Demand
8
Sources: EIA and EVA, Inc.
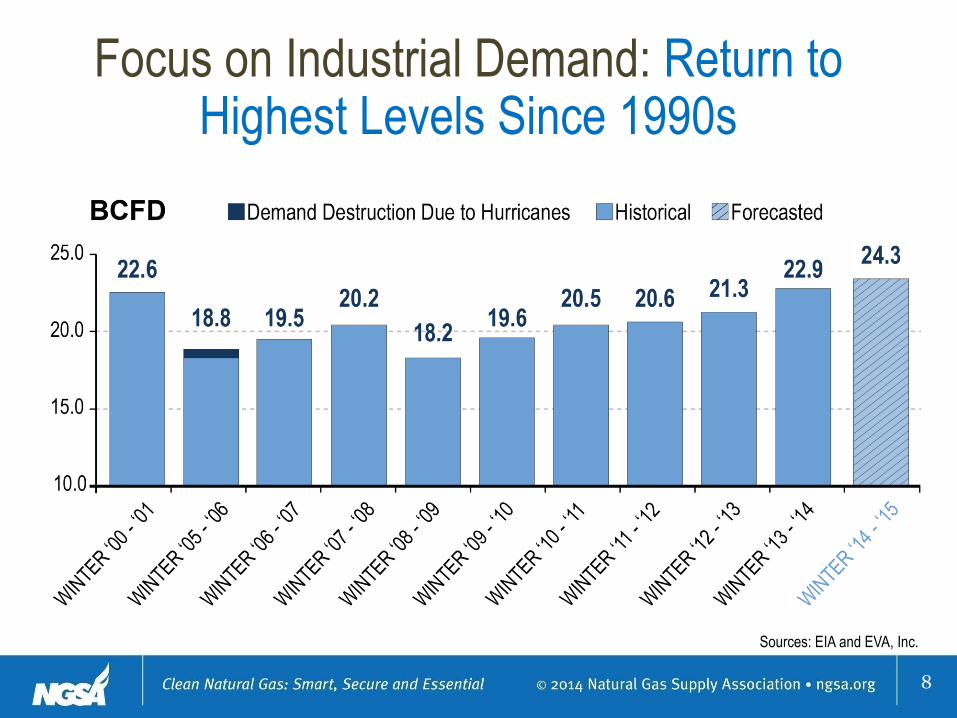
Focus on Industrial Demand: Return to Highest Levels Since 1990s
9
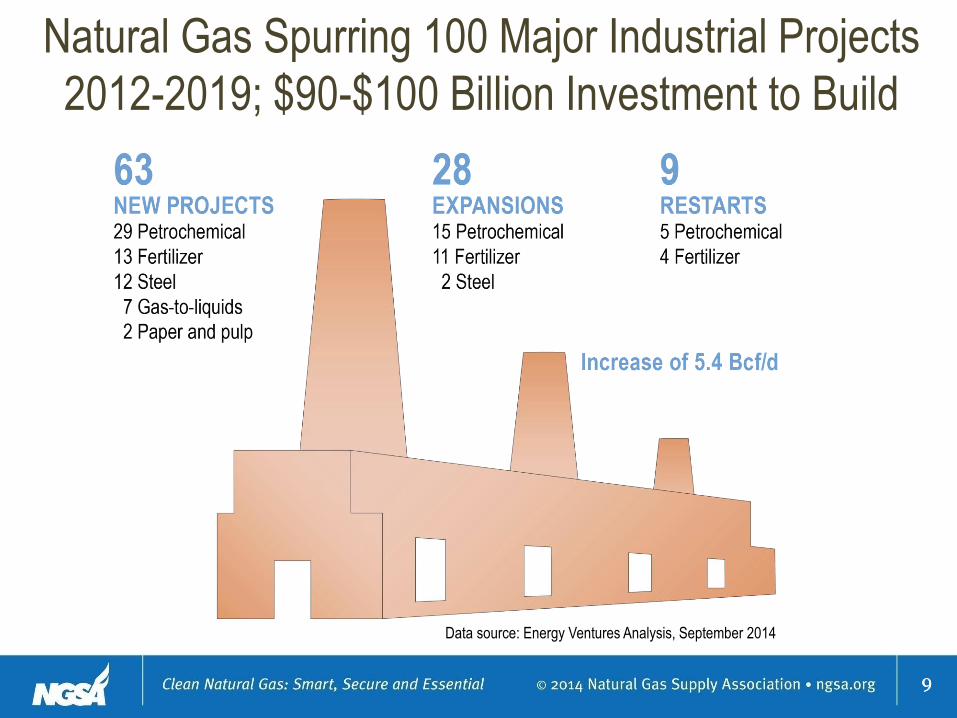
Natural Gas Spurring 100 Major Industrial Projects
2012-2019; $90-$100 Billion Investment to Build
9
Data source: Energy Ventures Analysis, September 2014

10
Source: Energy Ventures Analysis, 2014
Electric Demand: Monthly Coal-to-Gas Switching Sustained Since 2008

11
Winter Season Period-to-period change Data sources: EVA; Energy Information Administration
Last winter 2013-2014
ACTUAL
This winter 2014-2015
FORECAST
End of injection season 3,816 Bcf 3,440 Bcf
Percent of average fill
(Five-year average) 95% 85%
New storage capacity 68 Bcf Est. 5 Bcf
Winter-to-winter pressure on
natural gas prices
Supply: Winter Storage

Winter season Last winter Period-to-period change 2013-2014
Data source: Energy Ventures Analysis ACTUAL
This winter 2014-2015
FORECAST
Annual natural gas well completions (Lower 48)
7,971 7,397
Winter average production (Lower 48)
67.2 Bcf/d 70.8 Bcf/d
Canadian imports (net) 5.7 5.3
LNG imports 0.1 0.1
Mexican exports (net) 1.7 2.2
Supply: Winter Production
12
Winter-to-winter pressure
on natural gas prices
13
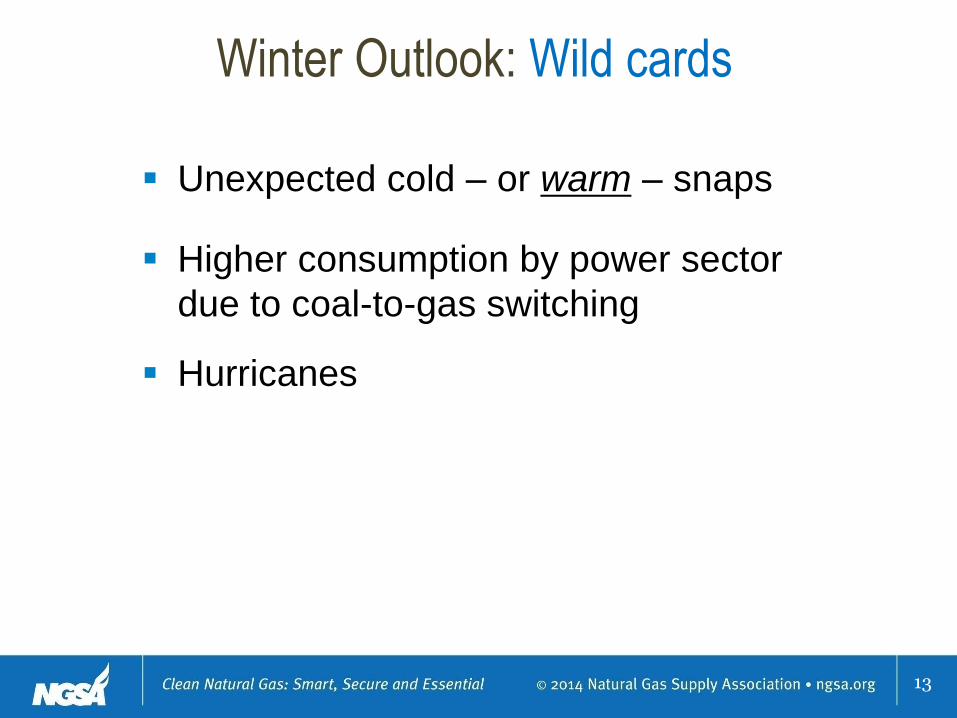
Winter Outlook: Wild cards
Unexpected cold – or warm – snaps
Higher consumption by power sector
due to coal-to-gas switching
Hurricanes

Winter season Period-to-period change
This winter 2014-2015
FORECAST
Weather
Economy
Overall demand
Storage
Winter production
Winter-to-winter pressure
on natural gas prices
14
This Season’s Winter Outlook
Winter Outlook Heating Season
2014-2015
15
Contact:
Daphne Magnuson
@natgas_ngsa
www.ngsa.org
