wood mackenzie alaska lng competitiveness study aug 2016
TRANSCRIPT
Alaska LNG Competitiveness StudyAugust 2016
Strategy with substancewww.woodmac.com

© Wood Mackenzie 2
Disclaimer
This report has been prepared for BP (Exploration) Alaska Inc , ExxonMobil Alaska LNG LLC and Alaska Gasline Development Corporation (“the Clients”) by Wood Mackenzie Limited. The report is intended solely for the benefit of the Clients and its contents and conclusions are confidential and may not be disclosed to any other persons or companies without Wood Mackenzie’s prior written permission.
The information upon which this report is based comes either from public domain sources or from our own experience, knowledge and databases. The opinions expressed in this report are those of Wood Mackenzie. They have been arrived at following careful consideration and enquiry but we do not guarantee their fairness, completeness or accuracy. The opinions, as of this date, are subject to change. We do not accept any liability for your reliance upon them.

© Wood Mackenzie 3
Agenda
1. Project Overview and Scope
2. Alaska LNG Base Cost of Supply Competitiveness
3. Non Capex/Opex Options to Reduce the Cost of Alaska LNG Supply
a. Third-party owned Tolling utility
b. State-owned tolling utility
c. Changes to the Fiscal Regime
4. Conclusions
© Wood Mackenzie 4
Scope of Project
A consortium of interested parties (specifically BP, ExxonMobil and Alaska GaslineDevelopment Corporation) has engaged Wood Mackenzie to undertake an analysis of the competitiveness of the Alaska LNG project
The analysis undertaken relies on Wood Mackenzie’s own internal databases and publicly available information. We have not been provided with any proprietary information by any of the companies for whom this study is being provided. The following are the areas that are addressed in this report:
» Establish Alaska LNG base case Cost of Supply (CoS) and define the target range for a competitive CoS for Alaska LNG
» Identify viable options in addition to base capital cost (capex) and operating cost (opex) reductionto reduce the project's CoS
» Consider the way forward to allow for a globally competitive LNG project in Alaska

© Wood Mackenzie 5
Executive Summary
Currently the competitiveness of the Alaska LNG project ranks poorly when compared to competing LNG projects that could supply North Asia, specifically, Japan, South Korea, China and Taiwan.
This ranking also means that not only will the project not make sufficient returns for investors at current LNG market prices, but it may struggle to make acceptable returns even under a US$70/bbl price
There are certain levers that could be used to improve the competitiveness of the Alaska LNG project and potentially also improve the competitiveness compared with other jurisdictions

© Wood Mackenzie 6
Agenda
1. Project Overview and Scope
2. Alaska LNG Base Cost of Supply Competitiveness
3. Non Capex/Opex Options to Reduce the Cost of Alaska LNG Supply
a. Third-party owned Tolling utility
b. State-owned tolling utility
c. Changes to the Fiscal Regime
4. Conclusions

© Wood Mackenzie 7
Several projects targeting 2016 FID have already pushed their timetables back
Projects where FID was envisaged by WM in 2016 (as of January 1st 2016)
Sabine Pass T6
Mozambique Area 1 LNG
Participants decided not to progress the development at
this time considering the current economic and market
environment
Tangguh Train 3
Elba Liquefaction
Browse FLNG
Douglas Channel
Jordan Cove
Expected FID in 2016
‘Wildcard’ FID in 2016
Corpus Christi T3
Magnolia LNG extended CP date in Meridian and EPC Agreements to 31
Dec 2016
Lake CharlesMagnolia
Fortuna GoFLNG
Golden Pass
Pacific North West
Coral FLNG
LNG Canada
LNG Canada FID postponed beyond end ‘16 in context of global energy industry
challenges.
FERC ruling expected to set project
back
Other developments Abadi FLNG moved onshore and FID pushed back to 2020 from 2018 Oregon LNG funding pulled Triton LNG cancelled Cameroon LNG put on-hold Sempra indicated FID on Cameron LNG Expansion may be delayed
beyond planned H1 2017 window
PNW ‘hard FID’ delayed as Government needs more time to review
environmental impact. Petronas position on FID
increasingly unclearDC LNG deferred
due to market conditions
FID target pushed back to Q4 2016 following
Schlumberger’s decision not to farm-in
FID taken on July 1st
Lake Charles FID delayed, no
revised target

© Wood Mackenzie 8

© Wood Mackenzie 9
Approach to Analysis – Breakeven Cost of Supply
The basis of our analysis is to determine the breakeven delivered cost of supply for the Alaska LNG project
The analysis provides the price that would be required (in US$/mmBtu) for a project (or different elements of the project) to break even i.e. the price required for the project to generate a deemed rate of return » For the purposes of this analysis a return of 12% is used as a base case

© Wood Mackenzie 10
Assumptions – Costs and Volumes
In line with published cost cases, two capital cost cases have been run covering transmission lines, gas treatment plant, pipeline and LNG liquefaction plant costs» Low Case US$45 billion» High Case US$65 billion
Upstream costs are estimated by WoodMac at around US$10 billion to cover future capex for gas development at Prudhoe Bay and Point Thomson
Shipping costs from Alaska to North Asia assumed at US$0.60/mmbtu» Point of reference: US Gulf Coast LNG projects’ shipping to North Asia ~US$2/mmbtu
Upstream production 3 bcf/day
Assumed losses 11%
Domestic Market allocation: 300 mmcf/day

© Wood Mackenzie 11
Estimated Delivered Breakeven Cost for pre-FID projects (to North Asia) Vs. Asian DES Price Range at $70bbl
Comparison of Breakeven cost of supply for delivery into North Asia
(12%-14%)+US$0.80/mmbtu @$70/bbl(Asia DES Price contract price range)
Long-term@$70/bbl
Today@$45/bbl
0
2
4
6
8
10
12
14
16
Asian Brownfield Niche FLNG Other USGC (pre-FID)
East Africa Canada LargeScale
Australia FLNG &Greenfield
Alaska LNG
$/m
mbt
u
Gas cost Liquefaction/Other Shipping Range
Notes:Breakeven costs are calculated on the basis of a 12% return UG Gulf Coast (USGC) LT HH ~$3.41 avg real price 2019-2030; gas cost is grossed up at 15% for losses etc
2016
Rea
l
© Wood Mackenzie 12
Comparison of competing projects
Of the peer group of projects, Alaska LNG has amongst the highest break-even cost of supply, even at the lowest capex estimate
None of the listed projects break even at current oil prices of around US$45/bbl
Under a long term price assumption of US$70/bbl, more would break even. However, the most economically challenged projects are:
» Canada Large Scale
» Australia FLNG and Greenfield
» Alaska LNG
© Wood Mackenzie 13
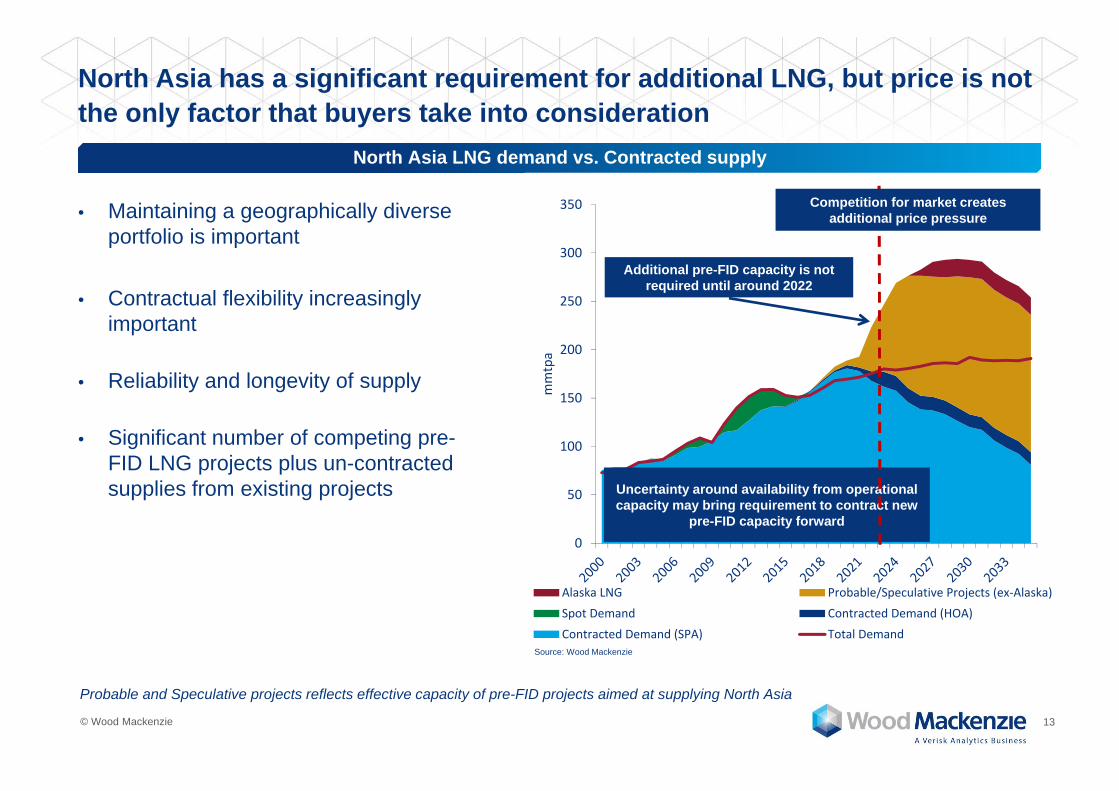
North Asia has a significant requirement for additional LNG, but price is not the only factor that buyers take into consideration
• Maintaining a geographically diverse portfolio is important
• Contractual flexibility increasingly important
• Reliability and longevity of supply
• Significant number of competing pre-FID LNG projects plus un-contracted supplies from existing projects
North Asia LNG demand vs. Contracted supply
Probable and Speculative projects reflects effective capacity of pre-FID projects aimed at supplying North Asia
0
50
100
150
200
250
300
350
mmtpa
Alaska LNG Probable/Speculative Projects (ex‐Alaska)
Spot Demand Contracted Demand (HOA)
Contracted Demand (SPA) Total DemandSource: Wood Mackenzie
Additional pre-FID capacity is not required until around 2022
Uncertainty around availability from operational capacity may bring requirement to contract new
pre-FID capacity forward
Competition for market creates additional price pressure
© Wood Mackenzie 14
Agenda
1. Project Overview and Scope
2. Alaska LNG Base Cost of Supply Competitiveness
3. Non Capex/Opex Options to Reduce the Cost of Alaska LNG Supply
a. Third-party owned Tolling utility
b. State-owned tolling utility
c. Changes to the Fiscal Regime
4. Conclusions
© Wood Mackenzie 15
Approach
We have considered what other options may allow a reduction in the project breakevens
A reduction in costs is an option that will undoubtedly reduce breakevens and two costs cases are considered
The following options are covered within this section of the report:» The effect on competitiveness by including a conventional non-recourse debt structure in a tolling plant
structure» Restructuring the project to increase the Alaska State's share» Relief from federal or state taxes
© Wood Mackenzie 16
Agenda
1. Project Overview and Scope
2. Alaska LNG Base Cost of Supply Competitiveness
3. Non Capex/Opex Options to Reduce the Cost of Alaska LNG Supply
a. Third-party owned Tolling utility
b. State-owned tolling utility
c. Changes to the Fiscal Regime
4. Conclusions

© Wood Mackenzie 17
0
2
4
6
8
10
12
14
16
Current Project Third Party-owned tolling utility
$/m
mbt
u
Upstream Pipe and plant Shipping Range
The introduction of a debt funded third party tolling structure will reduce the cost of supply
The debt structure assumed is:» 70:30 – debt:equity» 15 year repayment term» Interest rate of Libor + 3.5%
A third party tolling company could require a ‘utility rate of return’ which is typically around 8%» This reduced requirement for a
return reduces the cost of supply
Today@$45/bbl
(12%-14%)+US$0.80/mmbtu @$70/bbl(Asia DES Price contract price range)
Long-term@$70/bbl

© Wood Mackenzie 18
Agenda
1. Project Overview and Scope
2. Alaska LNG Base Cost of Supply Competitiveness
3. Non Capex/Opex Options to Reduce the Cost of Alaska LNG Supply
a. Third-party owned Tolling utility
b. State-owned tolling utility
c. Changes to the Fiscal Regime
4. Conclusions

© Wood Mackenzie 19
0
2
4
6
8
10
12
14
16
Current Project Third-Party Owned tolling utility SoA-owned tolling utility (Notax)
$/m
mbt
u
Upstream Pipe and plant Shipping Range
The introduction of State ownership
In addition to a third party toller, the State of Alaska (SoA) could further reduce the cost of supply with a potential tax exemption
SOA-ownership shown as fully tax exempt
(12%-14%)+US$0.80/mmbtu @$70/bbl(Asia DES Price contract price range)
Long-term@$70/bbl
Today@$45/bbl

© Wood Mackenzie 20
Agenda
1. Project Overview and Scope
2. Alaska LNG Base Cost of Supply Competitiveness
3. Non Capex/Opex Options to Reduce the Cost of Alaska LNG Supply
a. Third-party owned Tolling utility
b. State-owned tolling utility
c. Changes to the Fiscal Regime
4. Conclusions

© Wood Mackenzie 21
Changes to the Fiscal Regime
Targeted fiscal changes are often used around the world to encourage the development of a specific asset or a type of asset and there are many examples of this
Typically relief will be granted for assets that are » high cost, » found in unhospitable locations, or» have low profitability under existing terms
The Snøhvit LNG project in Norway and the Yamal LNG project in Russia are examples of LNG projects where governments have targeted fiscal reliefs to enable these projects to progress
Details of the changes used, plus examples of other targeted and more broadly applied fiscal reliefs are included within the Appendix

© Wood Mackenzie 22
0
2
4
6
8
10
12
14
16
Current Project No Federal take Pre-take
$/m
mbt
u
Upstream Pipe and plant Shipping Range
Impact of Federal and State fiscal change on integrated structure
The chart illustrates the cost of supply impact of changes to the fiscal regime on the integrated 100% equity project
Even the removal of all taxes on pipeline and plants is insufficient to reduce the cost of supply below the current level of LNG prices» The pre-take case excludes all
levels of government take on the plants and pipelines but includes 25% RIK/TAG
Today@$45/bbl
(12%-14%)+US$0.80/mmbtu @$70/bbl(Asia DES Price contract price range)
Long-term@$70/bbl

© Wood Mackenzie 23
Agenda
1. Project Overview and Scope
2. Alaska LNG Base Cost of Supply Competitiveness
3. Non Capex/Opex Options to Reduce the Cost of Alaska LNG Supply
a. Third-party owned Tolling utility
b. State-owned tolling utility
c. Changes to the Fiscal Regime
4. Conclusions
© Wood Mackenzie 24
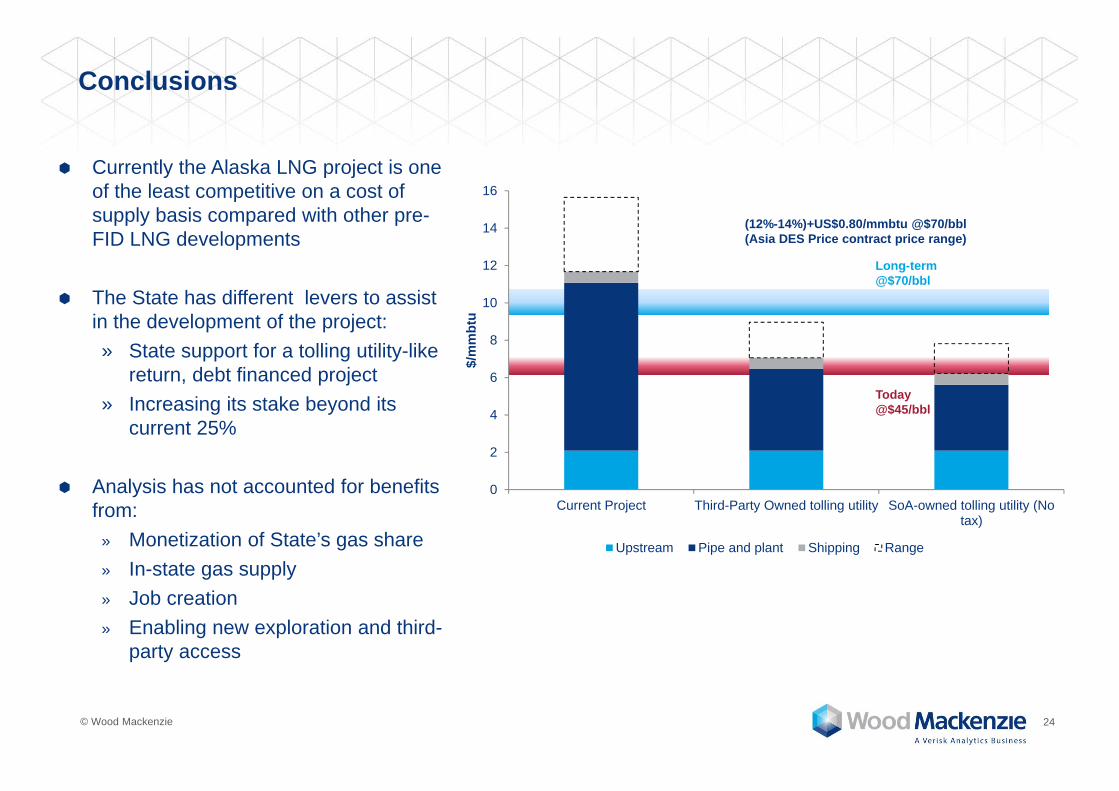
Conclusions
Currently the Alaska LNG project is one of the least competitive on a cost of supply basis compared with other pre-FID LNG developments
The State has different levers to assist in the development of the project:» State support for a tolling utility-like
return, debt financed project » Increasing its stake beyond its
current 25%
Analysis has not accounted for benefits from:
» Monetization of State’s gas share» In-state gas supply» Job creation» Enabling new exploration and third-
party access
0
2
4
6
8
10
12
14
16
Current Project Third-Party Owned tolling utility SoA-owned tolling utility (Notax)
$/m
mbt
u
Upstream Pipe and plant Shipping Range
(12%-14%)+US$0.80/mmbtu @$70/bbl(Asia DES Price contract price range)
Long-term@$70/bbl
Today@$45/bbl
Appendix
© Wood Mackenzie 26
Targeted reliefs originally driven by a specific project – LNG Projects
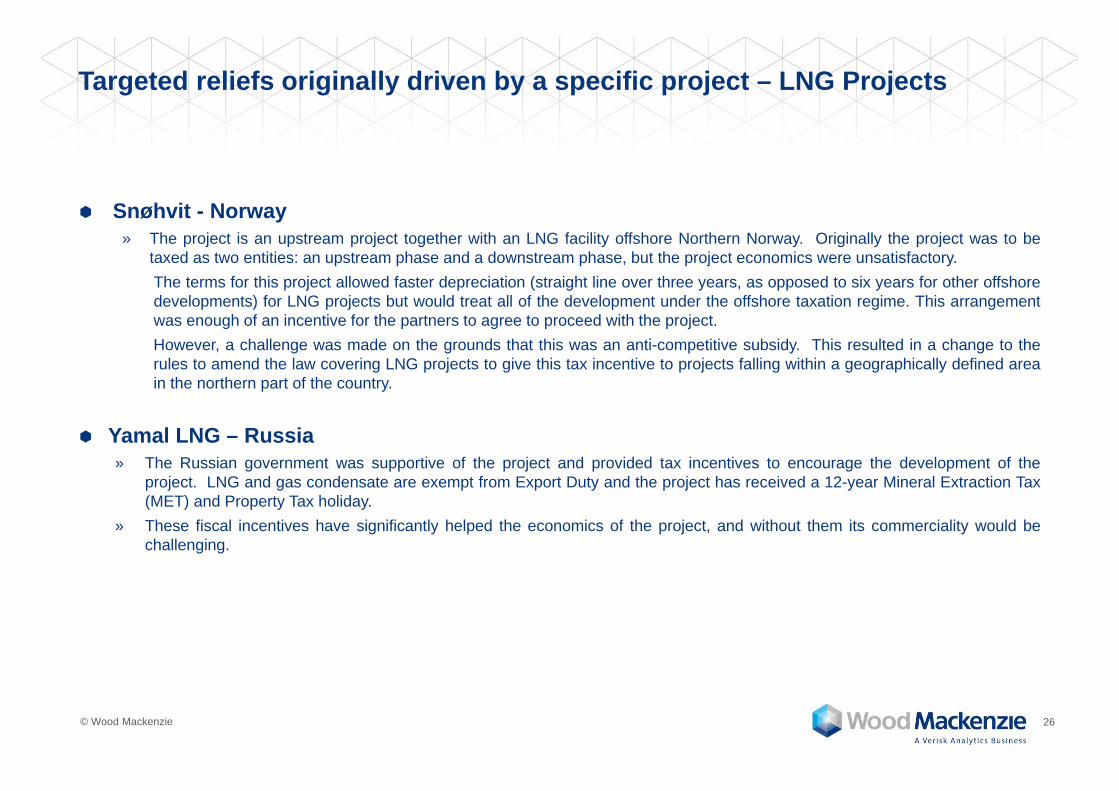
Snøhvit - Norway» The project is an upstream project together with an LNG facility offshore Northern Norway. Originally the project was to be
taxed as two entities: an upstream phase and a downstream phase, but the project economics were unsatisfactory.The terms for this project allowed faster depreciation (straight line over three years, as opposed to six years for other offshoredevelopments) for LNG projects but would treat all of the development under the offshore taxation regime. This arrangementwas enough of an incentive for the partners to agree to proceed with the project.However, a challenge was made on the grounds that this was an anti-competitive subsidy. This resulted in a change to therules to amend the law covering LNG projects to give this tax incentive to projects falling within a geographically defined areain the northern part of the country.
Yamal LNG – Russia» The Russian government was supportive of the project and provided tax incentives to encourage the development of the
project. LNG and gas condensate are exempt from Export Duty and the project has received a 12-year Mineral Extraction Tax(MET) and Property Tax holiday.
» These fiscal incentives have significantly helped the economics of the project, and without them its commerciality would bechallenging.

© Wood Mackenzie 27
General Reliefs – targeted across a broad range of assets
US Gulf of Mexico» Historically reliefs were given against royalty for deeper water developments» For awards made in the period up to July 2007 the royalty rate for developments in over 400 metres
of water was 12.5% compared to 16.67% for shallower water projects» For awards made up to July 2010 royalty suspension volumes were granted generally for leases
located in over 400 metres of water, with progressively higher volume reliefs granted for leases awarded in deeper water
Colombia» Lower royalty rates are charged for heavy oil developments (API<15o)» Unconventional oil and gas projects have even lower royalty rates and High Price Payments do not
commence until a higher price is achieved» Deepwater projects have a higher threshold for the commencement of High Price Payments and will
typically have a higher exempt volume threshold
© Wood Mackenzie 28
Targeted reliefs originally driven by a specific project – Non LNG Examples
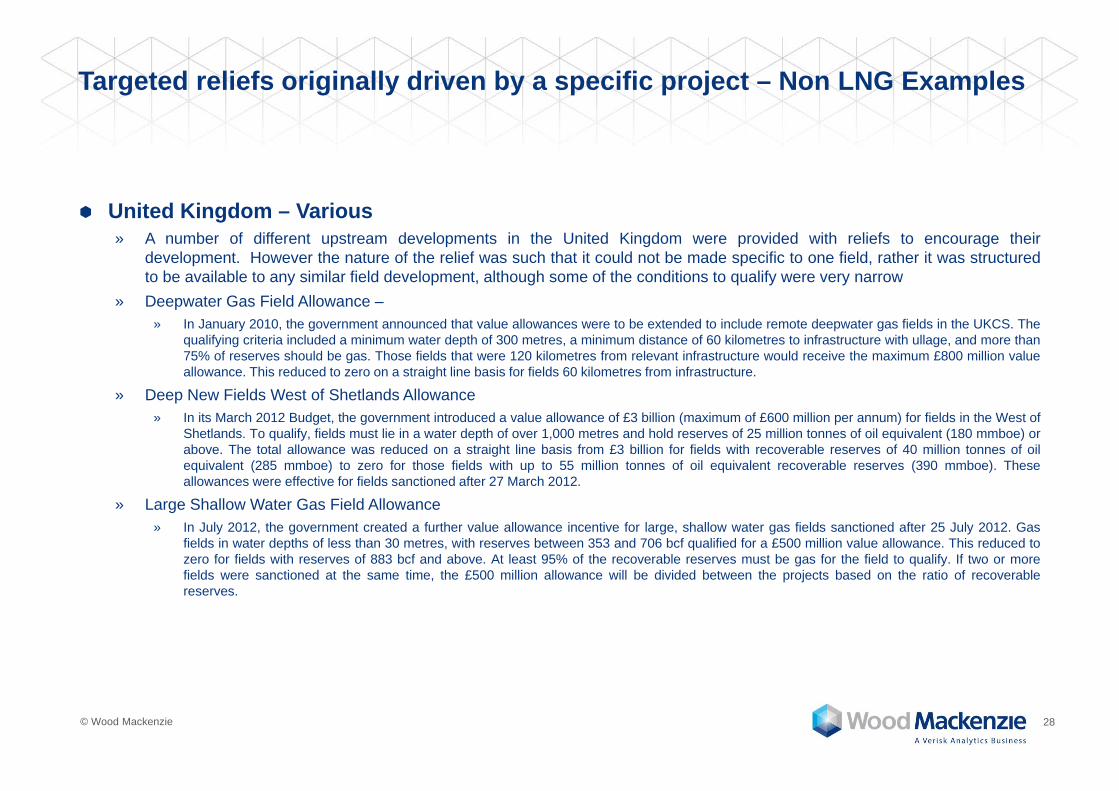
United Kingdom – Various» A number of different upstream developments in the United Kingdom were provided with reliefs to encourage their
development. However the nature of the relief was such that it could not be made specific to one field, rather it was structuredto be available to any similar field development, although some of the conditions to qualify were very narrow
» Deepwater Gas Field Allowance –» In January 2010, the government announced that value allowances were to be extended to include remote deepwater gas fields in the UKCS. The
qualifying criteria included a minimum water depth of 300 metres, a minimum distance of 60 kilometres to infrastructure with ullage, and more than75% of reserves should be gas. Those fields that were 120 kilometres from relevant infrastructure would receive the maximum £800 million valueallowance. This reduced to zero on a straight line basis for fields 60 kilometres from infrastructure.
» Deep New Fields West of Shetlands Allowance» In its March 2012 Budget, the government introduced a value allowance of £3 billion (maximum of £600 million per annum) for fields in the West of
Shetlands. To qualify, fields must lie in a water depth of over 1,000 metres and hold reserves of 25 million tonnes of oil equivalent (180 mmboe) orabove. The total allowance was reduced on a straight line basis from £3 billion for fields with recoverable reserves of 40 million tonnes of oilequivalent (285 mmboe) to zero for those fields with up to 55 million tonnes of oil equivalent recoverable reserves (390 mmboe). Theseallowances were effective for fields sanctioned after 27 March 2012.
» Large Shallow Water Gas Field Allowance» In July 2012, the government created a further value allowance incentive for large, shallow water gas fields sanctioned after 25 July 2012. Gas
fields in water depths of less than 30 metres, with reserves between 353 and 706 bcf qualified for a £500 million value allowance. This reduced tozero for fields with reserves of 883 bcf and above. At least 95% of the recoverable reserves must be gas for the field to qualify. If two or morefields were sanctioned at the same time, the £500 million allowance will be divided between the projects based on the ratio of recoverablereserves.

© Wood Mackenzie 29
Europe +44 131 243 4400Americas +1 713 470 1600Asia Pacific +65 6518 0800
Email [email protected] www.woodmac.com
Wood Mackenzie™, a Verisk Analytics business, is a trusted source of commercial intelligence for the world'snatural resources sector. We empower clients to make better strategic decisions, providing objective analysisand advice on assets, companies and markets. For more information visit: www.woodmac.comWOOD MACKENZIE is a trade mark of Wood Mackenzie Limited and is the subject of trade mark registrations and/or applications inthe European Community, the USA and other countries around the world.