woodstock state school · woodstock state school is a small rural school situated 40 km west of...
TRANSCRIPT

Woodstock State School
ANNUAL REPORT
2018 Queensland State School Reporting
Every student succeeding State Schools Strategy
Department of Education

2018 Annual Report 1 Woodstock State School
Contact information
Postal address c/- Post Office Woodstock 4816
Phone (07) 4780 2333
Fax
Email [email protected]
Webpages Additional information about Queensland state schools is located on:
the My School website
the Queensland Government data website
the Queensland Government schools directory website.
Contact person Allison Greenaway

2018 Annual Report 2 Woodstock State School
From the Principal
School overview
Woodstock State School is a small rural school situated 40 km West of Townsville in northern Queensland. The school has three multi-aged classes in modern, well-equipped facilities, including ready access to computer technologies. Cattle, orchards and market gardens form the basis of local industry with children coming from a 20 km radius around the school utilising one of our two bus services. A focus on literacy and numeracy through real-life learning, ensures a rich curriculum which includes hands-on activities at school as well as during field trips and camps. Sporting involvement is encouraged through our involvement in the Townsville interschool sports, athletics and swimming competitions.Community involvement in the school is high. An extremely active and supportive P and C Association ensures key school events are major community events as well.
School progress towards its goals in 2018
Our school community is dedicated towards achieving excellent results for our students and our school. “Every day is a chance to do better” is the philosophy of the strong school community which works together to support our students’ learning.
Core Priorities Targets Progress
Reading and Writing
90% of students A-C English
45% A-B English
On-going
94% of students A-C English
32% A-B English
Effective pedagogy and Data Discussions
90% of students A-C English
45% A-B English
100% teacher PD
Ongoing
Culture that promotes learning
Share student writing through the newsletter
Inform community members of school activities
Increase SOS results Ongoing
Future outlook
Core Priorities Targets Progress
Students to demonstrate independent high quality work
Increase students in U2B
Increase reading and writing outcomes
Continued work on GTMJ’s and reading/writing requirements across curriculum areas
Work towards a greater understanding of the literacy continuum and goal setting
Work with cluster for transition to high school and improved understanding of writing demands of the curriculum
Improve students’ NAPLAN and A-E writing data
Involvement in transition to high school with William Ross High School writing project.
Positive Behaviour for Learning Reduce the number of students with major behaviours
Revise and update current Responsible Behaviour Plan to develop a range of strategies to encourage students.

2018 Annual Report 3 Woodstock State School
Our school at a glance
School profile
Coeducational or single sex Coeducational
Independent public school No
Year levels offered in 2018 Prep Year - Year 6
Student enrolments
Table 1: Student enrolments at this school
Enrolment category 2016 2017 2018
Notes:
1. Student counts are based on the Census (August) enrolment collection.
2. Indigenous refers to Aboriginal and Torres Strait Islander people of Australia.
3. pre-Prep is a kindergarten program for Aboriginal and Torres Strait Islander children, living in 35 Aboriginal and Torres Strait Islander communities, in the year before school.
Total 63 60 45
Girls 25 26 14
Boys 38 34 31
Indigenous 6 12 6
Enrolment continuity (Feb. – Nov.) 91% 91% 95%
In 2018, there were no students enrolled in a pre-Prep program.
Characteristics of the student body
Overview
Most of our students are from rural families who live within a 20km radius of the school. They are involved in farming activities including, cattle, horses and crops. In many cases one adult in the family may have a job in addition to the farming activities of the family farm. English is the first language spoken in almost 100% of the families. Generally the student population is very stable, with the majority of students completing all of their primary education at our school. 10% of our school population are indigenous.
Average class sizes
Table 2: Average class size information for each phase of schooling
Phase of schooling 2016 2017 2018
Note:
The class size targets for composite classes are informed by the relevant year level target. Where composite classes exist across cohorts (e.g. year 3/4) the class size targets would be the lower cohort target.
Prep – Year 3 20 20 15
Year 4 – Year 6 23 17 18
Year 7 – Year 10
Year 11 – Year 12

2018 Annual Report 4 Woodstock State School
Curriculum delivery
Our approach to curriculum delivery
A whole school curriculum framework detailing units of work in all learning areas on a two or three yearly cycle, to ensure appropriate curriculum coverage year to year in multi-age classrooms, will be reviewed and updated to cater to our 3 multi-age classrooms. This will ensure that the Version 8 Australian Curriculum will be implemented by 2020.
Access to ICT devices was further increased through the acquisition of the purchase of 7 laptop computers in 2018 to increase our ‘Laptop Labs’. Reading will continue to be promoted as a leisure activity and student access to the school library resources, called the Learning Hub, will be increased for formal research lessons and allowing access for buddy reading, quiet reading or work.
Our distinctive curriculum offerings
Children work within multi-age groupings across all year levels.
Individual and small group instructions occur on a daily basis.
Individualised intervention programs including: a phonemic awareness program, support-a-reader, one-to-one instructions with Teacher Aides and Support Teachers, levelled age appropriate reading resources.
School-wide reading program involving students being grouped for targeted teaching at each child’s instructional level and targeting specific reading and comprehension skills.
Workshops delivered by local sports associations to support the sports development of the students.
Our older class is involved in yearly 3 day camps including self-discovery, leadership and environmental study.
Co-curricular activities
Woodstock State School provided a variety of extra curricula opportunities for all students, from Prep to Year 6. These include:
Interschool Sports, and Sports Clinics, Transition to Prep and Playgroup each week, Transition Program to William Ross State High school, Leadership Camp and Leadership Development Days, Premier’s Reading Challenge, Readers Cup Challenge, Fun Run, Book Fairs and Book Week, Council Tree Planting Art in a Suitcase, Walk to school Day Grandparents Day, Inside-out Day, Under 8’s Day, and Whole school end of year concert presentation
How information and communication technologies are used to assist learning
Woodstock has a computer lab with whole class capability. All classrooms, including the library have interactive whiteboards. All classrooms have internet connectibility and all students have passwords that enable them to work on our network. All classes have access to XO’s and laptops as required and the student in the upper grades have both readily available in the room. Students use the internet to research information for projects, learning websites, develop games used in coding programs and access emails. They utilise available software programs to complete assessment tasks. Students also have access to robotic kids and have been engaging in STEM lessons using BeeBots and robots. Students in the upper class participated in the Qld virtual STEM academy, Global Tropics Future.

2018 Annual Report 5 Woodstock State School
Social climate
Overview
Being a small rural school where everyone knows everyone, there is a real “family” feel about the school. Older students help younger students when they are distressed over an issue or have no one to play with. Parents are likely to “pop in for a quick chat” when picking up their child. The P&C is very active and supporting of the belief that activities involving payment should be subsidized to ensure affordability to all families. To this end they often provide part or full payment for excursions and camps. Our School Chaplain works 2 days a week to support our school community and many volunteers enhance our learning environment.
Parent, student and staff satisfaction
Tables 3–5 show selected items from the Parent/Caregiver, Student and Staff School Opinion Surveys.
Table 3: Parent opinion survey
Percentage of parents/caregivers who agree# that: 2016 2017 2018
their child is getting a good education at school (S2016) 89% 43% 75%
this is a good school (S2035) 89% 50% 67%
their child likes being at this school* (S2001) 95% 43% 58%
their child feels safe at this school* (S2002) 95% 57% 67%
their child's learning needs are being met at this school* (S2003) 89% 50% 75%
their child is making good progress at this school* (S2004) 89% 36% 67%
teachers at this school expect their child to do his or her best* (S2005) 100% 50% 75%
teachers at this school provide their child with useful feedback about his or her school work* (S2006)
89% 43% 67%
teachers at this school motivate their child to learn* (S2007) 89% 43% 67%
teachers at this school treat students fairly* (S2008) 79% 43% 58%
they can talk to their child's teachers about their concerns* (S2009) 89% 50% 67%
this school works with them to support their child's learning* (S2010) 89% 29% 67%
this school takes parents' opinions seriously* (S2011) 74% 21% 50%
student behaviour is well managed at this school* (S2012) 84% 43% 50%
this school looks for ways to improve* (S2013) 84% 43% 50%
this school is well maintained* (S2014) 100% 43% 58%
* Nationally agreed student and parent/caregiver items.
# ‘Agree’ represents the percentage of respondents who Somewhat Agree, Agree or Strongly Agree with the statement.
DW = Data withheld to ensure confidentiality.
Table 4: Student opinion survey
Percentage of students who agree# that: 2016 2017 2018
they are getting a good education at school (S2048) 100% 94% 96%
they like being at their school* (S2036) 92% 94% 100%
they feel safe at their school* (S2037) 92% 94% 100%
their teachers motivate them to learn* (S2038) 100% 94% 87%
their teachers expect them to do their best* (S2039) 100% 94% 100%
their teachers provide them with useful feedback about their school work* (S2040)
85% 94% 96%

2018 Annual Report 6 Woodstock State School
Percentage of students who agree# that: 2016 2017 2018
teachers treat students fairly at their school* (S2041) 85% 82% 87%
they can talk to their teachers about their concerns* (S2042) 92% 94% 87%
their school takes students' opinions seriously* (S2043) 85% 94% 96%
student behaviour is well managed at their school* (S2044) 85% 88% 96%
their school looks for ways to improve* (S2045) 100% 94% 96%
their school is well maintained* (S2046) 85% 94% 100%
their school gives them opportunities to do interesting things* (S2047) 100% 94% 83%
* Nationally agreed student and parent/caregiver items.
# ‘Agree’ represents the percentage of respondents who Somewhat Agree, Agree or Strongly Agree with the statement.
DW = Data withheld to ensure confidentiality.
Table 5: Staff opinion survey
Percentage of school staff who agree# that: 2016 2017 2018
they enjoy working at their school (S2069) 100% 100% 100%
they feel that their school is a safe place in which to work (S2070) 100% 100% 100%
they receive useful feedback about their work at their school (S2071) 90% 100% 89%
they feel confident embedding Aboriginal and Torres Strait Islander perspectives across the learning areas (S2114)
100% 100% 100%
students are encouraged to do their best at their school (S2072) 100% 100% 100%
students are treated fairly at their school (S2073) 100% 100% 100%
student behaviour is well managed at their school (S2074) 100% 100% 89%
staff are well supported at their school (S2075) 100% 100% 78%
their school takes staff opinions seriously (S2076) 90% 100% 78%
their school looks for ways to improve (S2077) 100% 100% 100%
their school is well maintained (S2078) 100% 100% 100%
their school gives them opportunities to do interesting things (S2079) 100% 100% 100%
* Nationally agreed student and parent/caregiver items.
# ‘Agree’ represents the percentage of respondents who Somewhat Agree, Agree or Strongly Agree with the statement.
DW = Data withheld to ensure confidentiality.
Parent and community engagement
Parents are encouraged to be involved in their child’s education through a range of activities. Adjustments are made to curriculum pedagogy to assist students with diverse needs to access and participate fully at our school and parents and care-givers are fully involved in the consultation process. Open communication between school staff and parents is seen as pivotal, and the introduction of diaries as a form of communication has been very successful. Parents are encouraged to contact classroom teachers or the principal in the early stages of a problem and to keep in touch at any time. The school has a clear process by which this is done. Staff make constant efforts to ensure positive involvement with parents and the community, by welcoming them into the school for whole school planned activities or simply inviting them into the classroom for a quick chat about their child. Parents and community members are also encouraged to participate in a range of “hands on” activities including:
P&C activities
P&C meetings
Tuckshop
In class support
2018 Annual Report 7 Woodstock State School
School/ class presentations
Attendance at school camps or excursions if needed
Fundraising activities
Spectators/ assistance at sporting events
ISP or EAP meetings
Meet and Greets, Grandparents Days and invitations to parades and events
Regular Parent/Teaching meetings
Involvement in the community ANZAC Day ceremonies.
Respectful relationships education programs
The school has developed and implemented a program to focus on appropriate respectful, equitable and health relationships.
The implementation of the Positive Behaviour for Learning Framework at Woodstock has aligned with our Parent and Community Engagement Framework and our Learning and Wellbeing Framework. Parents, community members and students meet regularly to ascertain and track the learning culture of the school.
Peer support programme introduced in 2017 was continued in 2018.
Whole school participation to raise awareness of well-being, safety, anti-bullying, tolerance and respect during free dress days and explicit teaching occurs during Day for Daniel, Strive to be Kind Day, White Ribbon Day, Harmony Day and National Action against Bullying and Violence.
Our student council, representing our student body meet regularly and organised activities as does our active P&C, classroom teachers and the school as a whole.
The school’s behaviour matrix, based on Safety, Learning and Responsibility focus on appropriate, respectful and health relationships and are explicitly taught each week, shared in the weekly newsletter and demonstrated by students on parade. Respectful Relationships are modelled and fostered within our community.
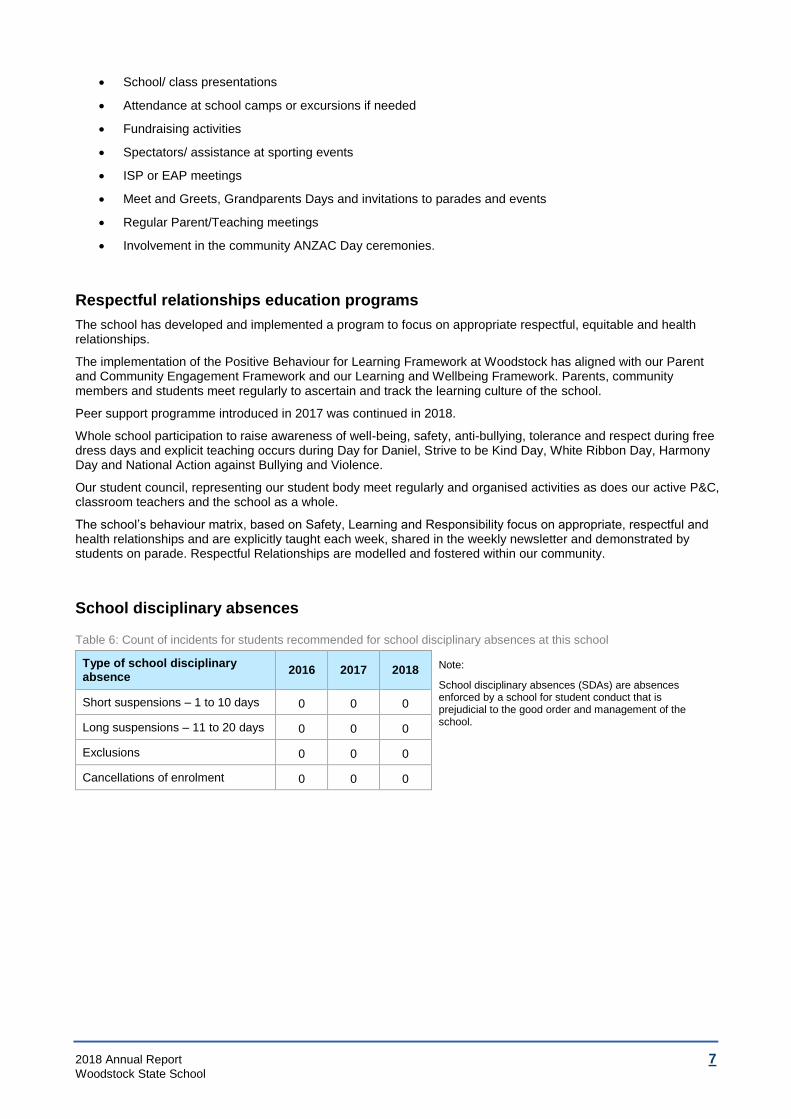
School disciplinary absences
Table 6: Count of incidents for students recommended for school disciplinary absences at this school
Type of school disciplinary absence
2016 2017 2018
Note:
School disciplinary absences (SDAs) are absences enforced by a school for student conduct that is prejudicial to the good order and management of the school.
Short suspensions – 1 to 10 days 0 0 0
Long suspensions – 11 to 20 days 0 0 0
Exclusions 0 0 0
Cancellations of enrolment 0 0 0

2018 Annual Report 8 Woodstock State School
Environmental footprint
Reducing this school’s environmental footprint
Our school is completely self-sufficient in terms of our water supply and waste water treatment. Water from bores and rain are both treated and sued for all normal purposed including, drinking, irrigation, cleaning and waste water treatment. Rainwater is captured and stored in a total of 7 tanks. Bore water is treated and stored in 2 tanks, one of which is on at all stand providing a “head” for gravity feed water should the power be cut off. Food and garden waste is recycled through compost bins and worm farms for use in the junior school’s vegetable patch. Our school collects for recycling: batteries, aluminium cans, poppers and other plastics. Through the installation of a waterfall, grasses, plants, bird boxes we have provided a wild life corridor for the black throated finch, a threatened species in the area. Trees and shrubs have been planted near the staff car park to provide shade and encourage bird life.
Table 7: Environmental footprint indicators for this school
Utility category 2015–2016 2016–2017 2017–2018
Note:
Consumption data is compiled from sources including ERM, Ergon reports and utilities data entered into OneSchool* by schools. The data provides an indication of the consumption trend in each of the utility categories which impact on this school’s environmental footprint.
*OneSchool is the department's comprehensive software suite that schools use to run safe, secure, sustainable and consistent reporting and administrative processes.
Electricity (kWh) 48,424 16,116 59,411
Water (kL)
School funding
School income broken down by funding source
School income, reported by financial year accounting cycle using standardized national methodologies and broken down by funding source is available via the My School website at.
How to access our income details
1. Click on the My School link http://www.myschool.edu.au/.
2. Enter the school name or suburb of the school you wish to search.
3. Click on ‘View School Profile’ of the appropriate school to access the school’s profile.
4. Click on ‘Finances’ and select the appropriate year to view the school financial information.

2018 Annual Report 9 Woodstock State School
Note:
If you are unable to access the internet, please contact the school for a hard copy of the school’s financial information.
Our staff profile
Workforce composition
Staff composition, including Indigenous staff
Table 8: Workforce composition for this school
Description Teaching staff* Non-teaching staff Indigenous** staff
Headcounts 5 4 0
Full-time equivalents 3 3 0
*Teaching staff includes School Leaders.
** Indigenous refers to Aboriginal and Torres Strait Islander people of Australia.
Qualification of all teachers
Table 9: Teacher qualifications for classroom teachers and school leaders at this school
Highest level of qualification Number of qualifications
*Graduate Diploma etc. includes Graduate Diploma, Bachelor Honours Degree, and Graduate Certificate.
Doctorate
Masters
Graduate Diploma etc.* 5
Bachelor degree
Diploma
Certificate 3
Professional development
Expenditure on and teacher participation in professional development
The total funds expended on teacher professional development in 2018 were $3500.
The major professional development initiatives are as follows:
Reading and writing modules on line
AEDC
Learning Fairs
PBL training
Reading workshops
One sentence at a time On line training.
The proportion of the teaching staff involved in professional development activities during 2018 was 100%.

2018 Annual Report 10 Woodstock State School
Staff attendance and retention
Staff attendance
Table 10: Average staff attendance for this school as percentages
Description 2016 2017 2018
Staff attendance for permanent and temporary staff and school leaders. 98% 97% 100%
Proportion of staff retained from the previous school year
From the end of the previous school year, 85% of staff were retained by the school for the entire 2018.
Performance of our students
Key student outcomes
Student attendance
The overall student attendance rate in 2018 for all Queensland state Primary schools was 92%.
Tables 11–12 show attendance rates at this school as percentages.
Table 11: Overall student attendance at this school
Description 2016 2017 2018
Overall attendance rate* for students at this school 95% 93% 93%
Attendance rate for Indigenous** students at this school 95% 89% 85%
* Student attendance rate = the total of full-days and part-days that students attended divided by the total of all possible days for students to attend (expressed as a percentage).
** Indigenous refers to Aboriginal and Torres Strait Islander people of Australia.
Table 12: Average student attendance rates for each year level at this school
Year level 2016 2017 2018 Year level 2016 2017 2018
Notes:
1. Attendance rates effectively count attendance for every student for every day of attendance in Semester 1.
2. Student attendance rate = the total of full-days and part-days that students attended divided by the total of all possible days for students to attend (expressed as a percentage).
3. DW = Data withheld to ensure confidentiality.
Prep 97% 97% 95% Year 7
Year 1 95% 94% 97% Year 8
Year 2 93% 94% 94% Year 9
Year 3 94% 94% 93% Year 10
Year 4 97% 91% 93% Year 11
Year 5 98% 93% 90% Year 12
Year 6 94% 91% 94%

2018 Annual Report 11 Woodstock State School
Student attendance distribution
Graph 1: Proportion of students by attendance rate
Description of how this school manages non-attendance
Queensland state schools manage non-attendance in line with the Queensland Department of Education procedures: Managing Student Absences and Enforcing Enrolment and Attendance at State Schools; and Roll Marking in State Schools, which outline processes for managing and recording student attendance and absenteeism.
Electronic class rolls are marked twice daily. Teachers and/or the Administration Officer follow up unexplained absences by phone call to the parents. If a satisfactory explanation cannot be gained the Principal will contact the parents/caregivers. Letters of unexplained absences are sent home regularly to be updated in OneSchool. If a satisfactory resolution to the child’s attendance is still not reached, formal notifications as per the Northern Regions Attendance Policy, are issued. The attendance figures are heavily affected by the wet season as numerous students are restricted to their residential property due to flooding creeks and attendance. The school’s “Gold Card” programme and Attendance and Behaviour Certificates acknowledge children’s behaviour, work effort and attendance. An end of term activity called “Gold Card Day” is provided for that term’s successful Gold Card Holders. Over attendance rate is equal or above the region target of 93%.
NAPLAN
Our reading, writing, spelling, grammar and punctuation, and numeracy results for the Years 3, 5, 7 and 9 NAPLAN tests are available via the My School website.
How to access our NAPLAN results
1. Click on the My School link http://www.myschool.edu.au/.
2. Enter the school name or suburb of the school you wish to search.
3. Click on ‘View School Profile’ of the appropriate school to access the school’s profile.
4. Click on ‘NAPLAN’ to access the school NAPLAN information.
Notes:
6
10
5
15
10
5
33
30
23
46
51
68
0% 20% 40% 60% 80% 100%
2018
2017
2016
Proportion of Students
Attendance Rate: 0% to <85% 85% to <90% 90% to <95% 95% to 100%

2018 Annual Report 12 Woodstock State School
1. If you are unable to access the internet, please contact the school for a hard copy of the school’s NAPLAN results.
2. The National Assessment Program – Literacy and Numeracy (NAPLAN) is an annual assessment for students in Years 3, 5, 7 and 9.