world bank/undp/bilateral aid energy sector management...
TRANSCRIPT

GgM- 5X as.
World Bank/UNDP/Bilateral AidEnergy Sector Management Assistance Program
SYRIA
ENERGY EFFICIENCY IMPROVEMENT IN THE CEMENT SECTOR
VOLUME II
CONSULTANTS' REPORT
JULY 1989
Energy Efficiency and Strategy UnitIndustry and Energy DepartmentWorld BankWashington, DC 20433
Pub
lic D
iscl
osur
e A
utho
rized
Pub
lic D
iscl
osur
e A
utho
rized
Pub
lic D
iscl
osur
e A
utho
rized
Pub
lic D
iscl
osur
e A
utho
rized
Pub
lic D
iscl
osur
e A
utho
rized
Pub
lic D
iscl
osur
e A
utho
rized
Pub
lic D
iscl
osur
e A
utho
rized
Pub
lic D
iscl
osur
e A
utho
rized
SYRIA
ENERGY EFFICIENCY IMPROVEMENT IN THE CEMENT SECTOR
VOLUME II
CONSULTANTS' REPORT
JULY 1989
Energy Efficiency and Strategy UnitIndustry and Energy DepartmentWorld BankWashington, DC 20433

FOREWRD
The Energy Assessment report on Syria 1/ identified the rapidrise in energy demand and the decline of energy supplies (particularlyoil) as major issues in the energy sector, other issuei being the low gasutilization compared to potential and the need to strengthen theinstitutional framework in overall energy planning and coordination inrecining, planning of the powfr sector, and capability to handle largeintegrated gas development projects. Subsequently, the Government ofSyria requested assistance from the Joint UNDP/World Bank Energy SectorManagement Program (ESMAP) to evaluate the potential for increasing theefficiency of energy use in the industrial sector. The cement industry,under the Ministry of Industry, received first priority as the mostenergy intensive activity. The evaluation was to include measures toconserve the use of energy and to substitute less costly fuels,particularly natural gas.
In 1983, the cement industry in Syria accounted for 34% ofindustrial energy consumption. The General Organization of Cement andConstruction Materials (GOC), under the Ministry of Industry, comprisesseven cement companies involving eleven factories, all subsidiaries ofGOC. The GOC produces approximately 86% of Syria's total cementproduction, the balance being made up by the cement company under theMilitary Housing Corporation. A rough comparison of the energyconsumption of the GOC with European standards indicates a difference inefficiency of more tha:. 15%.
This report, "Syria: Energy Efficiency Improvement in theCement Sector: Consultants' Report" (Volume II) presents the results ofin-depth energy audits of three companies and ou'ines various measuresand recommendations to improve operations and energy efficiencyutilization. It was prepared by a team of specialized consultants fromthe firm Holderbank Management and Consulting Ltd. of Switzerland. 2/ Itis a companion to a separately bound report prepared by the World Bank"Syria: Energy Efficiency Improvement in the Cement Sector" (Volume I),which presents an overview of the cement industry and evaluates theeconomic and financial feasibility of the consultants' recommendedmeasures to improve its performance and make it viable. Funding for thebulk of the consulting firm work and the World Bank supervision was
I/ "Syria: Issues and Options in the Energy Sector", Report No. SYR-5822 of the Joint UNDP/World Bank Energy Sector Assessment Pro0ram,May 1986.
2/ Messrs. Pfister (Project Manager), Kupper (Cement Specialist), Lohr(Team Leader), Hediger (Energy Efficiency Specialist), Chevalley(Pyroprocessing Specialist), Frei (Power Fevices and ControlSpecialist), and Roth (Grinding Systems Specialist).

provided by the UNDP under the project "Energy Efficiency Improvement inthe Cement Sector" (DP/SYR/86/003). The consultants were supervisedjointly by the ESMAP staff, GOC and the Government of Syria.
Two points should be noted about the report. First, the Syriancement industry was studied by selecting three of the seven Syrian cementcompanies, Tartous, Arabian and Adra, and visiting three of theirplants. Second, the focus was on identifying production constraints andenergy consumption patterns, and defining improvements to the areas ofthe cement production process that consume large amounts of thermalenergy and electric power for the three plants studied. Therefore, theconsultants' findings should be interpreted and implemented carefullybefore investment projects are selected for detailed feasibility analysisand engineering design. This requires a thorough analysis, and a globaland rational approach to the cement industry in Syria and its future.
This report (Volume II) confirms the above-indicated potentialin energy savings, and details specific measures to achieve theidentified energy efficiency improvements on three levels:
(a) by operational improvements;
(b) by modifications requiring small investments; and
(c) by long term investments.
Volume I confirms the viability of the cement industry andsummarizes the specific measures recommended by the consultants toachieve energy efficiency improvements.
The report presents the consultants' findings and does notnecessarily represents the views of either the Government of Syria, theUNDP or the World Bank. It has been distributed to the Syrianauthorities and selected donor agencies. Additional copies of the reportare available on request.

ABBREVIATIONS AND ACRONYMS
cli cement clinker
ESMAP Joint UNDP/World Bank Energy Sector ManagementAssistance Program
GOC General Organization of Cement
t/a metric tonnes per annum
UNDP United Nations Development Programme
GLOSSARY OF TMS
Units used throughout this report conform to the SystemInternational (SI) using the following standard abbreviations andconversion factors. Where other units are used they are explained in thetext.
Consultants "Holderbank" Management and Consulting Ltd. (HMC)a subsidiary of "Holderbank' Financiere Glarus Ltd.
Phase I Phase I of this study reviewed the performance of allthe GOC cement plants which provided data in response tothe questionnaire in order to:
(a) Determine the financial and economic status of theindustry.
(b) Identify the areas with an energy efficiencyimprovement potential and indicate the magnitude bycomparison with the performance figures ofcomparable "Holderbank" group plants.
(c) Identify the plants for in-depth analyses andenergy audit in the following Phase II.
Phase II In-depth analyses of the three largest cement plantsTartous, Arabian and Adra.
EXCHANGE RATES
US$ 1.00 = Syrian Pound (LS) 11.25 -- 1987LS 1.00 = 100 Piaster (ps)

PRICE BASES FOR CALCULATIONS
1 tonne (1,000 kg) fuel oil 840.00 LS1 kWh power = 0.36 LS
HEAT VALUE
1 kg fuel oil (lower calorific value) = 9,600 kcal or 40.22 NJ
ENERGY CALCULATIONS
Energy consumption and energy saving potential are initially calculatedon the bases of the actual process, e.g. raw material grinding, clinkerburning, cement grinding.
To summarize consumption and savings, fuel consumption is converted toclinker bases and power consumption is converted to cement bases, as ismost common in the cement industry.
The following formulas for conversion are used:
Fuel Oil
Specific fuel oil savings in raw material preparation are converted toclinker bases by:
k Cal/kg raw meal x raw meal/clinker factor (e.g. 1.8) = k Cal/kg clinker
Power
Specific power savings in raw material preparation are converted tocement bases as follows:
kWh/t raw meal x raw meal/clinker factor (e.g. 1.8) = kwh/t cement1,045 (e.g. addition of 4.5 % gypsum to clinker)
Specific power savings in clinker production are converted to cementbases as follows:
kWh/t clinker kWh/t cement1.045 (e.g. 4.5 X gypsum

TABLE OP CONTENTS
Page
SUMMARY AND FINDINGS ..................... ... i
I. MAIN PROBLEMS AND ISSUES IN THE CEMENT PLANTS ................ 1
General Aspects................................................. 1Plant Maintenance.... 9Spare Parts .................... ................ 11
Electrical Equipment ...... . ........... *0@000@ 12Triig.................0.0.0........ .............. .. 0........... 18Alternative ................... .... 19
II. TARTOUS CEMENT COMPANY (TMrtous cement plant)................ 21
Production Figures..................0...... 22Raw Materials and Raw Material Preparation ............... 23Raw Meal Preparation......................................0.0...... 26Clinker Burning Process. o..*..o.*o.............. .0.......o 29Cement Grindingo 00....o................... 32Asuxiliaries ................... ................... 00000000000 00 35Electrical Equipment0. .. 0................ ............ 37Proposal for Operational Improvements.................... 41Proposal for Modifications Requiring Small Investments... 43Proposal for Long-Term Investments....................... 46
III. ARABIAN CEMENT COMPANY (Sheikh Said plant) ................... 49
Production Figures.................000....... 49Raw Materials and Raw Material Preparaion................ 50Raw Meal Preparation..... .. 0000000000000000 00 52Clinker Burning Process. .00000.00.0 0 o ......*.......oo. 000 55Cement .......................... 00....... 60Auxilis 00.0.0................................................. 62Electrical Equipment............... ................. .O.oo.. 63Proposal for Operational Improvements .................... 66Proposal for Modifications Requiring Small Investments... 70Proposal for Long-Term Investments....................... 73

ADRA CEMENT COMPANY (Adra cement plant)...................... 75
Production Figures........................ .......... ..... 75Raw Materials and Raw Material Preparation............... 75Raw Meal Preparation ............. * * ............ . 78Clinker Burning Process................ .................. 80Cement Grinding.......................... ............... 84
Electrical Equipment ................................. .... 88Proposal for Operational Improvements.................... 91Proposal for Modifications Requiring Small Investments... 94Proposal for Long-Term Investments....................... 97
TABLES
1 Potential Energy Savings and Expected ProductionIncrease by Implementing Operational Improvements...... vi
2 Potential Energy Savings and Expected ProductionIncrease by Implementing Small Investments............. vii
3 Potential Energy Savings and Expected ProductionIncrease by Implementing Long-Term Investments9........ viii
4 Production Figures and Capital Costs for All Lines:Operational Improvements..................... ix
5 Production Figures and Capital Costs for All Lines:Small Investment Modifications........ ... .. ............ ix
6 Production Figures and Capital Costs for All Lines:Long-Term Investments.............. . .................... x
1.1 Ration No-Load/Nominal Load for typical cement plant^-quipment ...... , ~~~~~~~13
2.1 Summary of Project Proposals and Recommandations:Tattous Cement Plant - Raw Mill No. 4 ............. ..... 42
2.2 Summary of Project Proposals and Recommendations:Tartous Cement Plant - Kiln No. 4...................... 45
2.3 Summary of Project Proposals and RecommendationssTartous Cement P .......... ..... 47
3.1 Raw Material Moisture Levels at the Sheikh SaidPlant (Arabian), 1986................................... 52
3.2 Summary of Project Proposals and Recommendations:Arabian Company - Raw Mill No. l.................... 68
3.3 Summary of Project Proposals and Recommendations:Arabian Company - Cement Mill No. 1....... ............. 69
3.4 Summary of Project Proposals and Recommendations:A£abian Company - Kiln No. ........................... 72
3.5 Summary of Project Proposals and RecommendationsArabian Company--Long-Term Investments................. 74

TABLES (continued)
4.1 Raw Material Moisture Levels at the Adra CementPlant, 1986 .......... ............. .4*O ............ 77
4.2 Summary of Project Proposals and Recommendations:Adra Cement Company........................................... 92
4.3 Summary of Project Proposals and Recommendations:Adra Cement Company - Cement Mill No. 3................ 93
4.4 Summary of Project Proposals and Recommendations:Adra Cement company - Kiln No. 3....................... 96
4.5 Summary of Project Proposals and Recommendations:Adra Cement Company - Long-Term Investments............ 99
ANNEXES
1 Aide-M4moire... .... ...... ..... ... .... o..o.............. ... 1002 Questions raised by GOC. .................... 1013 Consultants' Answers..oooo... . ... o.......... ......o..*. 1054 Tartous Cement Plant, Flow Charts and Test Results....... 1085 Arabian Cement Company (Sheikh Said plant), Flow
Charts and Test Results................................ 1176 Adra Cement Plant, Flow Charts and Test Results.......... 129

SUMMARY AND FINDINGS
Introduction
1. The Energy Assessment Report on Syria identified industriulenergy efficiency improvements as an important potential opportunity forreducing Syria's energy demand. 3/ A rapid increase in energy demand ofover 10 X per year during the iast decadet during which oil productioncould not be increased significantly, has led to a sharp reduction of netearnings from oil exports. This constrained the availability of foreignexchange and contributed to a slowdown of economic growth. It appearsthat partly because of the historical emphasis on energy supply projectsand inappropriate energy pricing policy, the prospects for energy demandmanagement in Syria have not been explored in much detail. However, thepreliminary analyses carried out during the Assessment as well as in thecontext of other exercises in the energv sector suggest that thepotential savings from a concerted energy demand management program aresubstantial.
2. Although the Energy Assessment did not deal in detail withenergy efficiency issues, it nevertheless concluded that further detailedassessment work on energy efficiency improvements was warranted in thecement, fertilizer and general manufacturing subsectors. Thesesubsectors together accounted for 1,550 thousand TOE in 1983 or 26% ofthe country's total domestic energy consumption. The cement industryalone accounted for 34X of the 1983 industrial energy consumption, andabout 9% of the total energy consumption. It is the most energy intensiveindustry in the country. In comparison, the cement subsector indeveloping countries generally accounts for an estimated 2% to 61 of thetotal industrial/commercial energy consumption. Energy efficiencyimprovements in the Syrian cement industry would thus have a significantimpact on the reduction of energy demand of the country.
3. Between 1979 and 1985, Syria's cement production increased from1.8 million tons to 4.4 million tons. In 1986, the cement subsector 4/with an installed capacity of about 5 million tons per year (tpy) ofclinker in twelve plants and employing more than 9,000 people, produced4.3 million tons of cement. The new plants use the dry process system(3.5 million tons of cement in 1986), while the older factories use thewet process (0.8 million tons in 1986)4 Consequently, energyrequirements vary greatly, ranging from 0.13 TOE per ton of cement in the
3/ Syria: Issues and Options in the Energy Sector, Report of the JointUNDP(World Bank energy Sector Assessment Program, May 1986, ReportNo. 5822-SYR.
4/ Excluding one 1,000 tons/day cement plant which is controlled by theMilitary Housing Corporation under the Ministry of Defense.

- ii -
new dry process Tartous plant to 0.18 TOE per ton of output in the oldwet process Dummar factory. These figures compare to 0.095 TOE per tonof cement achieved in other developing countries in plants using the dryprocess system and 0.14 TOE per ton of cement using the wet process.This comparison indicates that the Syrian cement industry has significantscope for rationalizing output and conserving energy. Experience hasshown that savings of 10% to 152 in energy consumption in the cementindustry in developing countries can be achieved through improvements inoperating procedures, maintenance and management, attainable in the shortterm without major investments. Further savings usually requiresubstantial investments involving plant modifications or replacement ofspecific operational units. A savings of 102 to 15X in energyconsumption in the Syrian cement industry, which is readily feasiblethrough improvements in operating procedures and relatively minorinvestments alone, would, therefore, imply an estimated annual reductionin the country's energy consumption of at least 160 thousand TOE or about$23.5 million per year in economic terms at mid-1987 international oilprices.
4. This report presents the Consultants' findings based on anenergy audit of three cement plants, Tartous, Sheikh Said (Arabian CementCompany) and Adra, conducted in June 1987. It outlines the scope forviable energy conservation projects in the cement industry and presentsproposals for energy efficiency improvements in the three plants studied,with recommendations on industry-wide project proposals that could serveas a basis for project appraisal covering the cement industry as awhole. The recommendations focus on operation, management, training,housekeeping measures, interfuel substitution, and eventual processchanges.
5. Volume I of this report, which is bound . -irately, elaborateson the financial and economic performance of the cement industry inSyria, evaluates the economic and financial viability of the Consultants'energy saving proposals, and presents a plan of action for the industry.
6. This energy efficiency study on the Syrian Cement Industryunder the Ministry of Industry was greatly supported by the GeneralDirector of GOC, Mr. Charif Aroudaki and in particular by the TechnicalDirector, Mr. Tayssir Basbous. The constructive support of the FinancialDirector, Mr. Fayez Suddi, the Production Director, Mr. Hani Nobulsi andother GOC officials and the representatives of the cement plants'management contributed to this straightforward and uncoloured report.
Tartous, Arabian, Adra
7. Tartous, Arabian and Adra were jointly selected by GOC, ESMAPand the Consultants for an in-depth analysis during Phase II of thisstudy. All three plants are less then ten years old and operate on themore fuel-efficient dry process. They represent 68X of GOC's nominalproduction capacity and employ the largest individual production units.Energy efficiency measures in these large plants have the biggest impact

- iii -
on the total fuel consumption of the GOC. Similar measures may beintroduced at Hama 2 and Musulmieh 2 and 3, which operate similar oridentical equipment and employ the same process.
8. GOC's future cement production will depend on these more moderndry process plants.
Plant Management
9. The duties and activities of the plant management and engineershave a direct impact on plant operation, maintenance and housekeeping.Thus, they also supervise energy consumption.
10. The managers and engineers need to spend a good part of theirworking time actively in the plant to exercise their leadership andsupervisory function on the spot and obtain first-hand information oncurrent operations.
11. In order to save energy, closer supervision of operation andmaintenance is needed. The nomination of an energy manager (or team) for"Total Energy Consumption and Cost Analysis" (TECCA), as a part-tim.* job,is recommended for each factory. Senior management should give fullsupport to energy saving proposals and efforts.
12. It is further recommended that an Energy Saving committee beformed consisting of the energy managers of the plants and one member ofGOC responsible for energy efficiency. The committee should have thefollowing tasks:
(a) instruction on energy saving potential and possibilities,installations, experiments, recording and calculation;
(b) training and assistance to committee members and other plantmanagement staff and engineers in identification andimplementation of energy saving possibilities, measurements,calculations and recording, etc., in the various plants; and
(c) reporting on actions taken and results achieved (savings inenergy and operating costs) for the benefit of other plants.
In order to evaluate and compare energy consumption, consequent andconstant (shift, day, month) measurement, recording, reporting andcalcu.ation of specific figures for consumption of power and thermalenergy, consumables, etc. is necessary. These data have then to beanalyzed and compared with standard and design data as well as examinedfor trends (graphical presentation). The managers and engineers shoulddraw permanent conclusions for improved operation, maintenance and energysaving from their findings.
- iv -
Plant Operation
13. Improvements in plant operation can save considerable amounts ofenergy in the form of power and fuel oil. Equipment running idle andprocess groups operating under partial loads consume unnecessary power.Proper operation of the grinding departments is the key to acceptablepower consumption levels. Unnecessary drying or overdrying of rawmaterial is a waste of fuel oil.
14. Quality control throughout the production process with animmediate feed back from the laboratory to the operators is aprecondition for energy efficient operation. Process instrumentation andcontrollers and process data recording equipment have to be fullyfunctional to permit optimum operation. The main obstacles to efficientoperation of the cement plants studied, which seem to be typical for theSyrian cement industry, are lack of maintenance and of well-trained andmotivated plant personnel. The number of plant personnel is too high,resulting in a very low specific installed capacity of only 550tpy/capita for the entire cement industry in 1986.
15. To ensure a thorough understanding of the process by theoperators and the establishment of optimum process parameters anintensive training program is needed.
16. Regular training of the plant's personnel should be organizedon all levels (engineers, operators, maintenance and laboratorypersonnel, and auxiliary formations) using the excellent methods andauxiliaries available from experienced consultants.
17. Technical assistance could be made available from a third partydelegating a team of experienced operating personnel to the plant duringthe implementation of the proposed measures. The team could consist ofup to. 12 persons operating the plant over a period of not less than oneyear. This team should be authorized to run the plant, assisted byselected experienced plant personnel. "On the job training" of plantstaff will be a welcome additional benefit of this procedure.
Plant Maintenance
18. Plant maintenance is essential for continuous operation atnominal capacity, which in turn is a precondition for optimumoperation. Optimum operation is achieved by attaining energy efficiencywithin the limits of the given equipment and process. Preconditions forproper maintenance are good housekeeping, proper training and supervisionof personnel, proper technical documentation and sufficient wear andspare parts.
19. In the plants studied, maintenance varies considerably fromplant to plant and department to department. In general plant main-tenance is insufficient and there is ample room for improvement despitethe difficulties in obtaining wear and spare parts.

v
Spare Parts
20. The GOC and the individual plant managers named the lack ofadequate quality and quantity of spare and wear parts as a key factor inthe plants' limited performance. In 1986 the GOC prepared a budget ofUS$ 30 Million for wear and spare parts. Only US$ 3.9 Million or 131 ofthe budget was approved due to a shortage of hard currency.
21. The Consultants' observations confirm the need for spare andwear parts. But improvements in operation, maintenance and spare partsmanagement could reduce parts requirements considerably.
Alternative Fuel
22. The Syrian Cement Industry uses fuel oil (Bunker-C-Oil)exclusively for clinker burning and raw material drying. A small fuelsavings of approximately 5 kcal/kg clinker or roughly 0.5% is possible byusing crude oil with the necessary viscosity for burning withoutpreheating. Whether the fuel saving compensates for the possible higherprice remains to be confirmed.
23. The use of petrol coke and/or oil shale is ruled out for thetime being due to the high transport and grinding costs and the plantmodifications that would be needed were these fuels to be used.
24. Natural gas with a sufficiently low sulphur content and a netheat value of not less than 7000 kcal/Nm could totally substitute forthe use of fuel oil. The transport of natural gas from the gas fields tothe cement plants or at least to the nearest plant(s) deserves to beevaluated in an overall energy scheme.
Proposed Energy Efficiency Measures
25. The Consultants' investigations in the selected cementfactories concentrated primarily on the main consumers of thermal energyand power, the raw mills, cement mills and kiln systems. The results ofthe investigations confirmed a high potential for energy savings.
26. Energy savings potential in other departments and auxiliaryinstallations are also identified in the report. The respective minorsavings are, however, not considered in these calculations.
27. The energy savings proposals are divided into three categories:
(a) operational improvements;
(b) modifications requiring small investments; and
(c) long-term investments.

- vi -
The three categories of measures are in principle independent of eachother and may be implemented step by step or all together. The long-terminvestment proposals lead in all cases to a considerable increase inproduction capacity by partially utilizing the spare capacity ofoversized main equipment combined with the proposed modifications. Theseproposals supersede some of the modifications recommended for category(b)--modifications requiring small investments. Some of the modificationsunder category (b) are therefore not recommended if the implementation ofthe long-term investment program is already envisaged.
28. Some of the modifications requiring small investments and moreparticularly the long-term investment proposals require thoroughengineering by experts and a review of their feasibility prior to aninvestment decision.
Operational Improvements
29. The measures proposed under this heading include improvement ofmaintenance and repair work and plant operation, to be carried out by theplants' own personnel. The costs would be covered by the budget forregular maintenance and repair work.
30. The estimated potential energy savings and expected productionincrease to be achieved by implementing the operational improvements aresummarized in Table 1. The production increase is calculated for thewhole plant on the basis of detailed measurements and investigations madefor one production line.
Table 1: POTENTIAL ENERGY SAVINGS AND EXPECTED PRODUCTIONINCREASE BY IMPLEMENTING OPERATIONAL IWPROVEMENTS
OperationalImprovements TARTOUS ARABIAN ADRA
Specific fuel oilsavings 2.3 kg/t cli 1.6 kg/t cli 4.7 kg/t cilin % 2.3 1.3 4.4
Specific power savings 23.6 kWh/t cem 3.6 kWh/t cem 34.2 kWh/t cemIn % 16.1 9.1 18.7
Cement productionIncrease 238,000 t/a 277,730 t/a 269,590 t/aIn % 18.5 43.0 39.0
For further details see Table 4.

- vil -
Modifications Requiring Small Investments
31. Modifications considered under this heading are expected tolead to savings in thermal energy and power and to increase the plants'capacity at least to the rated capacity, while increasing theirutilization to approximately 85X. The modifications mainly consist ofthe installation of more efficient drives and small modifications to theequipment to improve operating conditions.
32. The estimated potential energy savings and expected productionincrease to be achieved by implementing these modifications aresummarized in Table 2. Energy savings and production increases arecalculated based on the level of operational improvement obtained.Production figures and capital cost are calculated for all lines.
Table 2: POTENTIAL ENERGY SAVINGS AND EXPECTED PRODUCTIONINCREASE BY IWPLE?MENTATION OF SMALL INVESTMENT MODIFICATIONS
Small InvestmentModifications TARTOUS ARABIAN ADRA
Specific fuel oilsavings 4.2 kg/t eli 2.6 kg/t cli 5.7 kg/t cliin % 4.3 2.2 5.6
Specific powersavings 5.7 kWh/t eam 8.5 kWh/t cem 11.0 kWh/t cemin % 4.6 6.2 7.4
Cement productionIncrease 82,000 t/a 56,700 t/a 60,000 t/ain % 5.4 6.2 6.3
Capital costforeign US S 11,769,600 3,926,000 6,348,400Local SL 4,920,000 640,000 2,415,000
For further details see Table 5.
Long Term Investment
33. The proposed long-term investment measures should contribute tothe overall efficiency of the cement plants both through energy savingsand a considerable increase in plant capacity.

- viii -
34. The anticipated modifications require moderate investment inthe range of US$ 33 to US$ 45 per t/a of cement produced. The majorchanges comprise the installation of efficient preheater systems for thekiln plants and roller presses for the ratu mills and cement mills. ForTartous and Adra additional prehomogenizing storage is foreseen.
35. The potential energy savings and expected production increaseto be achieved hy implementing the long term investment proposals aresummarized in Table 3. Energy savings and production increases arecalculated from the level reached by the small investment modifica-tions. Production figures and capital cost are calculated for all lines.
Table 3: POTENTIAL ENERGY SAVINGS AND EXPECTED PRODUCTION INCREASESBY IMPLEMENTING LONG-TERN INVESTMENT PROPOSALS
Long Term Investment TARTOUS ARABIAUJ ADRA
Specific fuel oilsavings 4.2 kg/t ciI 2.1 kg/t cli 4.2 kg/t ciIIn % 4.5 1.8 4.4
Specific powersavings 12.3 kWh/t cem 12.3 kWh/t cem 12.0 kWh/t cemin % 10.5 9.6 8.7
Cement productionIncrease 983,600 t/a 323,500 t/a 508,800 t/ain % 61.0 33.3 49.9
Capital costforeign US S 48,090,000 8,900,000 18,249,000Local SL 54,220,000 15,200,000 28,041,000
For further details see Table 6.

- is -
Table 4: PRODUCTION FIGUMS AND CAPITAL CMST FOR ALL LINES:OPERATIONAL INPROVEIENTS
Operational lmprovements TARTOUS ARABIAN ACRA1 Llne 4 Lines I Line 2 Lines 1 Line 3 Lines
1986 cIinAwer productlon t/a 311,083 1,244,331 302,402 604,804 225,153 675,4601986 cement productlon t/. 322,000 1,288,001 321,034 642,067 230,137 690,410
Expected clinker production t/a 365,000 1,460,000 436,000 876,000 292,000 876,000Expected cemnt production t/a 381,500 1,526,000 459,900 919,800 320,000 960,000
Specific fuel oil savings 22 kcali/kg cli I 2.3 kg/t cil5 kca Ikg cii * 1.6 kg/t c1145 keal AG ciIa 4.7 kg/t cll
Speclfic power savings 23.6 kWh/t cem 13.6 kWh/t cern 34.2 kWh/t cem
Fuel oil savings t/a 836.5 3,346 684 1,368 1,369 4,107Powe savings 1 h/a 8,991 35,964 6,242 12,484 10,940 32,820
Energy savings In LS 3,939,385 15,757,50 2,821,815 5,643,630 5,088,010 15,264,030Energy savings In US S 350,170 1,400,680 250,800 501,600 452,270 1,356,810
Capital cost foreIgn US S - - -- -
Capital cost local LS - - - - - -
Table 5: PRODUCTION FIGURES AND CAPITAL COSTS FOR ALL LINES:SMALL INWESTMENT MODIFICATIONS
Small Investment TARTOUS ARABIAN ACRA
Modifications 1 Line 4 Lines 1 Line 2 Lines 1 Line 3 Llnes
Table I clinker productlon t/e 365,083 1,460,000 438,000 876,000 292,000 76,000Table I cee"nt productlon t/e 381,500 1,526,000 459,000 919,800 320,000 960,000
Expected ci nker production t/a 385,000 1,540,000 465,000 930,000 310,000 930,000Expected ceewnt productlon t/a 402,000 1,608,000 488,250 976,500 340,000 1,020,000
Specific fuel oll savings 40 kcal/kg cii * 4.2 kg/t cil 25 kcalAhg cil a 2.6 kg/t cil 55 kcal/kg
cil a 5.7 kg/t cllSpecific power savings 5.7 kMh/t cer 8.5 kWh/t cem 11.0 kwil/t coo
Fuel ol savings t/a 1,604 6,416 1,210 2,420 1,776 5,328Power savings Wh/a 2,310 9,240 4,139 8,278 3,720 1,1r0
Energy savings In LS 2,179,100 8,716,400 2,507,050 5,014,100 2,830,950 8,492,850Energy savings In US S 193,680 774,720 222,840 445,680 251,640 754,920
Capital cost foreign US S 2,942,400 11,769,600 1,963,000 3,926,000 2,126,800 6,380,400
Capital cost local LS 1,230,000 4,920,000 320,000 640,000 805,000 2,415,000

- 3t -
Table 6: PRODUCTION FIGURES AND CAPITAL COSTS FOR
ALL LINES: LONG-TERM INVESTMENTS
Long Term Investment TARTOUS ARAalAN ADRA
1 Line 4 Lines I Line 2 Lines 1 Line 3 Lines
Table It clinker production t/a 385,000 1,540,00 465,000 930,000 310,000 930,000
Table 11 cement production t/a 402,000 1,608,000 488,250 976,500 340,000 1,020,000
Expected clinker production t/a 620,000 2,480,000 620,000 1,240,000 465,000 1,395,000
Expected cement production t/a 647,900 2,591,600 651,000 1,302,000 509,600 1,528,800
Specific fuel oil savings 40 kcal/kg cli = 4.2 kg/t cli|20 kcal/kg cli = 2.1 kg/t clif40 kcal/kg
cli a 4.2 kg/t cilSpecific power savings 12.3 kWh/t cem *2.3 kWh/t cem 12.0 kWh/t cem
Fuel oil savings t/a 2,583.3 10,333 1,292 2,584 1,938 5,814
Power savings MWh/a 7,979 31,916 7,998 15,996 6,127 18,381
Energy savings in LS 5,042,580 20,170,320 3,964,280 7,928,560 3,833,080 11,499,240
Energy savings in US $ 448,230 1,792,920 352,340 704,680 340,670 1,022,010
Capital cost foreign US S 9,272,300 37,090,000 4,450,000 8,900,000 6,083,000 18,249,000
Capital cost local LS 12,325,000 49,300,000 7,600,000 15,200,000 9,347,000 28,041,000

I. MAIN PROBLOMS AND I SSUES IN THE CEMENT PLANTS
General Aspects
1.1 The inspection and test program for each plant and thenecessary preparatory work to be performed, particularly by thefactories, was discussed during the initial meeting with GOC and thefactory representatives.
1.2 The Consultants explained the inspection and test programagain, in more detail, to the plant managers and section heads on thefirst day of each plant visit.
1.3 Unfortunately, none of the plants was able to fully cooperatein this demanding task (lack of maintenance, non-availability ofpersonnel, non-functioning instruments, lack of test organization). Themission had to make additional efforts to obtain as much data as possibleand concentrate on the most important items. Reconciliation of data hadto be made in many cases and not all of the conflicting information(information versus data given, instrument readings or own measurements)could be clarified and the relevant cause for data divergence detected.
1.4 During the short time available in each plant, it was of courseimpossible to make an assessment of all production lines, The plantmanagers decided which line should be investigated in more detail.
1.5 The findings and results presented here are based mainly on theConsultants' observations, data collection and measurements during theperiod of the test rather than on information received from the factorystaff on previous measurements with operating conditions unknown to theConsultants' team. As identical equipment does not necessarily performequally, depending on many variable operating parameters, the findingsfor one production line may not always be representative of the overallplant operation.
1.6 Some of the shortcomings observed in all plants will bediscussed in more detail in paragraphs 1.7 to 1.10.
Plant Management
1.7 The activities and duties of the plant managers and engineershave a direct impact on the operation of the plant, on maintenance, andconsequently on the plant's energy consumption.
1.8 During the visit, the team observed that the plant managers andengineers spend very little of their working time actively in theplant. Unqualified personnel are therefore left without adequateleadership and supervision. This leads to non-optimal operation,negligence and unsufficient or inadequate maintenance.

1.9 On the other hand, some of the supervisory staff seem to betied down by inferior work, leading to the conclusion that there is noproper distribution of duties and responsibilities, i.e., no jobdescription for the managers and engineers. Daily operation andmaintenance should be performed under the direct leadership and immediateaction of management and supervisory staff on-site, rather than by time-consuming reporting and meetings. The necessary authority should begiven accordingly.
1.10 The team observed that awareness of defects, malfunctioning andthe need for maintenance is very low, and therefore necessary actions aredelayed or not taken at all.
1.11 All these facts cannot be directly quantified in terms ofenergy, production losses and cost. However, some of the figurespresented in this report are directly related to the management problemsmentioned above.
1.12 In order to save energy, closer supervision of operation andmaintenance is required. The nomination of an energy manager (or team)for "Total Energy Consumption and Cost Analysis" (TECCA), as a part-timejob, is recommended for each factory. Full top-management support forenergy saving proposals and efforts is required.
1.13 It is recommended that an Energy Saving committee be formedconsisting of the energy managers of each plant and one member of C.O.C.responsible for energy. The committee should have the following tasks:
(a) instruction on energy-saving potential, possibilities,installations, experiments, recording and calculation;
(b) training and assistance to committee members and other plantmanagement staff and engineers in identification andimplementation of energy saving possibilities, measurements,calculations and recording, etc., in the various plants; and
(c) reporting on actions taken and results achieved (savings inenergy and operating costs) for the benefit of other plants.
In order to evaluate and compare energy consumption, consequent and con-stant (shift, day, month) measurement, recording, reporting and calcula-tion of specific figures for consumption of power and thermal energy,consumables, etc. is necessary. These data have then to be analyzed andcompared with standard and design data as well as examined for trends(graphical presentation). Managers and engineers should draw permanentconclusions for improved operation, maintenance and energy saving fromthe analyses.

Plant Operation
1.14 A number of poor operating procedures were observed in allthree of the plants visited. Since this list cannot be complete, someexamples of energy waste will be highlighted to serve as illustration.
Equipment Running Idle
1.15 One complete crushing plant including the transport system forone component was running idle half the time since only one truck wasassigned for raw material transport. At the same time the crushingplants for other components were in operation, maybe also under partialload. Assuming an installed power of 1,000 kW for two crushers(2 stages), transport and dust collection, the power consumption whileequipment runs idle will be around 20%. The additional running time isone shift, or 2,500 h/y. The calculation with 0.36 LS/kWh leads to energycost savings of 16,000 US$/y that can be obtained just by switching offequipment that is running idle. Additional savings in maintenance andpersonnel can be made if, by reorganization, the total running period canbe reduced by one shift.
1.16 During the shutdown of one line, because of localizedoverheating, the cooling water system was kept running. Assuming a powerdemand of 150 kW for pumping of make up water, water treatment,circulation, cooling tower, etc., the daily savings with 0.36 LS/kWhamount to 113.2 US$; or with sixty days' kiln stop to 6,900 US$/y.
1.17 Similar to the above, other plants or parts of plants(transport, dust collection, etc.) were observed running idle. A simpleunit running idle may not seem important at the time, but the sum ofseveral machines running idle for long periods represents a considerableamount of energy waste and cost.
Constant Operating Parameters
1.18 After the Consultants informed the kiln operator about theresult of the gas analyses at preheater exit (1% CO was measured, theindication in the control room being 0X), the plant operator reduced thefuel input by 15% in one step and without any adaptation of the otheroperating parameters. This reaction shows that some plant operators donot understand basic kiln control philoscphy and also indicates the rangeof fluctuation of the operating parameters. Both situations lead toincreased heat consumption and reduced refractory lifetime.
1.19 In addition, exact production targets and relevant optimumoperating parameters are missing or not adhered to. Part of thenecessary instrumentation is not working or gives wrong readings (seealso paragraphs 1.56, 1.65 and 1.77). Constant operation has to be onetarget of the operators; however, major differences occur from shift toshift for no obvious reason.

- 4 -
1.20 Recording of operating parameters is incorrect, incomplete andinsufficient to establish a chronological history of plant performance.
1.21 Performance figures and records are not examined, compared,analyzed and interpreted. Some of the process parameters are meaninglessto the operators--they are not understood (see paras. 1.112 to 1.114,Training).
1.22 Not all of the items above can be-easily quantified, but all ofthem contribute to waste of energy and money.
Quality Control, Fineness, Moisture Content, Cement Moisture
1.23 Sampling, analyzing time and feed back, quality of analyses,etc., are not performed with the necessary care. It seems that materialproperties are only of interest when problems arise, not during "normal"operation. However, material properties have an important impact onenergy consumption, and adequate reaction and adjustment of the operatingparameters depend on proper quality control.
1.24 Quality control is not limited to raw materials and finishedgoods. It also includes sawpling of intermediate products fromseparators, mills, dryers, etc., at regular intervals. One of theprerequisites for proper quality control is accessible and propersampling points and adequate tools for collecting samples. An indicationthat quality control is not taking place is that some sampling points hadnot been used for a long time.
1.25 The energy and cost saving factor of good quality controlcannot be measured directly, but the considerable impact of qualitycontrol on improvements and savings during plant operation will bevisible.
1.26 The particle size distribution of raw material, raw meal,cement, and intermediate products, is important both for product qualityand for process and operating cost (energy consumption for milling,burning). Crushing is cheaper than grinding. Excessive fineness is awaste of energy and money, while insufficient fineness of the raw mealhas a negative effect on the burning process.
1.27 All of the plants visited have to deal at times with rawmaterial that has a high moisture content. Two plants have raw materialdryers, and one plant has a dryer-crusher ahead of the raw mill. Allplants are equipped with auxiliary heaters. The Consultants found that alot of thermal energy contained in the kiln exhaust gases is wasted andnot used for drying. On the other hand, the installed machinery and rawmaterial storage is not well designed for humid material, resulting inoperational problems and high operating cost (energy and personnel).
1.28 Humidity values in all plants show that from a pure energypoint of view the moisture content could be handled by the raw mills andthe auxiliary firing systems even in extreme periods.

- 5 -
1.29 But this would imply considerable design changes such asreplacement of raw material silos by active preblending beds, modifica-tion of raw mills for drying/grinding, optimum integration of kilnexhaust gases, and auxiliary firing.
1.30 At present, the drying operations are not controlled byhumidity measurements, but by manual "feeling". This lack of precisionleads to an enormous waste of energy. The investigation revealed thatthe most recent records of drying efficiency were some days old, or evendated from the trial runs carried out during commissioning of theplants. There is no direct, immediate feedback from the laboratory tothe operator. The consequences are that: (a) material is dried unneces-sarily, (b) material is dried to too-low moisture levels, and (c) dustproblems are created.
1.31 In any energy-saving design, consideration of drying shouldhave top priority. As a guess, half of the energy and cost of thisoperation (approximately 5 million LS a year) could be saved by changesin plant organization and operation (constant humidity control of thedrying process) without additional investment or changes to the presentdesign.
1.32 Cement moisture becomes a problem when pozzo'.ana of highhumidity is added or when cement storage temperatures are too high. Thiscan lead to dehydration of the gypsum. Cement moisture not only causesproblems during storage, it also affects the cement quality. Bothparameters, moisture and outlet temperature, should therefore beimportant aspects of permanent quality control. Replacement of clinkerby pozzolana is an indirect but efficient way to save energy and shouldbe applied to the full extent allowed by the standards and the market.
Quarry Design
1.33 Quarry investigation in all plants is limited to a number ofdrillholes made at random. No plant has deep knowledge of its quarry,and no quarry design exists despite the fact that all plants have rawmaterial problems (chemical composition, physical properties, humidity).
1.34 In most of the plants raw material preblending is either notdone at all or is insufficient. It is well known that the chemical andphysical properties of the raw material and their fluctuations have amajor influence on plant operation and thus on energy consumption.
1.35 With the given plant design it is most important that rawmaterial feed be as constant as possible. There is a need forcomprehensive quarry investigation, quarry design (selective quarrying),constant monitoring of raw material quality and immediate feedback toeven out fluctuations.

-6-
Mill Operation and Supervision
1.36 As the mills will be discussed for each plant individually,only a few remarks valid for all plants are presented here.
1.37 Inspection of the mills revealed that they have been damaged byrunning under adverse conditions. Because material fill was generallyinsufficient, the ball charge mixed up and the lining and diaphragms weredamaged. The reasons for this are many: lack of understanding of milloperation, incorrect operation, lack and/or poor quality of mainteannce,poor quality of materials (lining, diaphragm), and lack of supervision.
1.38 At many mills, it was observed that lack of access, and lack ofladders and tools make inspection and maintenance difficult. The lack ofsafe equipment and of security leads to increased negligence.
1.39 In one cement mill, only one scale is used to add pozzolana andgypsum to the clinker. As a result, in case of feeder stop or blockage,one component may be missing without provoking an immediate reaction onthe part of the installation or the personnel. The result is poor-quality cement.
1.40 Poor-quality cement obviously represents a production loss andleads to significant waste of energy and other operating costs.
1.41 These examples show once more the need to improve supervisionof the plant operation. Constant, close and rapid cooperation withquality control is also needed to guarantee that production standards aremaintained.
Laboratory Operation
1.42 The laboratory is a very important part of the cement plant.It should be well equipped, maintained and organized.
1.43 The duties of the laboratory are:
(a) regular, correct, representative sampling;
(b) accurate and quick chemical/physical analysis;
(c) immediate feedback to production departments and management;
(d) proper reporting and recording of results; and
(e) preparation of information on developments and trends.
None of the laboratories visited was in a clean, lab-like condition andnone fulfilled the above requIrements. For some operations (e.g., thedryer operation) relations with the plant were not established on aregular basis. Therefore, the laboratory could not contribute toimproving plant operation and lowering energy consumption.

- 7 -
1.44 The x-ray analyzers in two of the plants have been out of orderfor a long time due to a lack of spare parts, depriving the plantlaboratories of an efficient working tool.
Kiln Operation Without Gas Analysis
1.45 The gas analyzer is a vital instrument for every kilnoperation. Without it, optimum kiln operation and energy conservationare impossible. Nevertheless, it was found that most of the gasanalyzers gave incorrect results or were not working at all; in one casepure air was being pumped to the analyzer, which indicated 6X 02.
1.46 Admittedly, this equipment is complex and requires regularmaintenance and calibration. However, it is the most importantinstrument for control of the burning process (complete combustion,excess air, filter operation, etc.).
Control Circuits
1.47 Most of the control circuits in the mill and kiln systems (mWl.feed control, grate cooler control) are either out of order or are notoperating correctly. Consequently, the operating conditions vary widely,e.g., over- or underfilling of the mill and unsteady secondary airtemperature in the kiln, requiring frequent adjustment by the operator.Unfortunately, due to lack of records showing the trend of the operatingparameters, action is often taken too late and tends to be too drastic.
1.48 Basically, each variation in the operating conditions means awaste of energy and deterioration of the equipment (mill liners, grindingmedia, refractory lining, cooler grate plates, etc.).
Kiln Stops
1.49 The yearly average heat consumption not only depends on theoperation of the kiln under stable conditions but also on the number ofkiln stops per year. In a well operated and maintained oil fired planckiln stops should not exceed the numbers given below:
short stops - 2 h: 30medium stops 2h - 24 h: 10long stops ca.- 24 h: 5
In one of the plants visited the kiln was stopped at least once a day.This can explain the difference of over 100 kcal/kg cli between the testresult and the figures for annual average heat consumption.
False Air (Air Infiltration)
1.50 False air is one of the most important causes of energy wastein the cement industry. It affects nearly all plant departments.
(a) In the kiln system (main sources$ kiln hood, kiln seals,preheater) false air drastically affects the heat and powerconsumption of the exhaust gas fans. For instance an increaseof 12 in the oxygen content of the exhaust gases as a result offalse air infiltration at the kiln inlet area (seal, housing)causes an increase in heat consumption of about 25 kcal/kg cliand an increase in the range of 1.5 - 2 kWh/t cli. in the powerconsumption of the kiln exhaust gas fan
(b) In the raw mill system (main sources: mill feed chute, milldischarge casing, separator feed, worn ducting) false airinfiltration greatly influences the drying capacity of the hotgases, and of course the power consumption of the variousfans. For instance an increase from 20% to 302 in the amountof false air entering at the mill inlet causes a loss of dryingcapacity of nearly 12 raw material moisture content.
(c) Further, false air infiltration can cause exhaust gas to coolto a temperature below the dew point, which creates cloggingproblems and ducting corrosion.
(d) In the cement mill system (main sources: mill dischargecasing, separator feed, worn ducting) false air infiltrationaffects the power consumption of the various fans and, as inthe raw mill system, can cause clogging and corrosion.
(e) All over the plant false air infiltration can seriously impairthe efficiency of the dust collection equipment by overloadingthe filter fans or through clogging and corrosion in thefilters.
In the worst cases false air infiltration can even limit plant capacityby overloading the main fans, i.e., kiln exhaust gas fan, BE fan, coolerexhaust air fan, raw mill fan and cement mill fan. All plants visitedwere confronted with the false air problem to a certain extent.
Clinker Quality Control
1.51 The main parameters are the "literweight" and the "Cao free" ,which should be kept constant and within certain limits. Otherwise,negative impacts on clinker quality (e.g., under- or overburning), highfuel consumption and the effects of poor cement grinding are the resultof quality variations.
1.52 Unfortunately, these parameters are too often regarded as "niceto know" without producing any change in kiln operation.
Loss of Production
1.53 Losses negatively affect all production parameters and specificfigures like fuel and energy consumption. Any product or intermediateproduct lost translates into a direct loss of fuel, energy, man-hours,equipment and expense for maintenance.

- 9 -
1.54 The Consultants observed losses along the entire productionlines in the form of leakages of material, transport equipment, and inthe form of excessive dust emission at the dust collection points. Suchlosses should be eliminettd in order to improve plant operation, increasecleanliness, and save energy.
1.55 The same considerations apply for compressed air, steam,condensate, water, etc.
Plant Maintenance
1.56 Housekeeping. Good housekeeping is a prerequisite for goodplant operation and maintenance; unfortunately, this has not yet beenestablished in the cement plants visited. Housekeeping becomesfrustrating if a plant is not well maintained and no efforts are made toavoid spillages and to repair leaking installations without delay. Thesituation ends up in a vicious circle and leaves the plant in a terriblecondition. A few examples may illustrate the situation:
(a) entire raw mill departments are barely accessible due to pilesof dust;
(b) the burner platform and fuel handling installation are coveredwith thick layers of a mixture of oil and clinker dust;
(c) the hot meal duct below the preheater cyclone is not airtight,causing leakage of materials and intake of false air;
(d) the day tank and the piping for the dryer are standing in anoil catch basin, which is overflowing by now;
(e) the gearbox of the cement mill is standing in a deep lake ofoil;
(f) many instruments are unreadable because of caked-on dust;
(g) many handles and manual valves are blocked by caked-on dirt;and
(h) spare parts, screws, safety devices, covers of electricalinstallations are found under piles of dust and thus getdamaged or lost.
As a result of poor housekeeping, all three plants appear older than theyare. It is amazing that certain machines and installations are stilloperating. In such conditions large amounts of energy are wasted.
1.57 Only drastic measures would help to change this situationcompletely:

- 10 -
(a) the plant should be shut down and properly cleaned usingadequate methods;
(b) complete plant rehabilitation is needed (maintenance of machi-nes and electrical equipment, repair or replacement andcalibration of all instruments, repair of all leaks and falseair infiltration, repainting, etc.);
(c) the staff on all levels has to be trained to be aware of and tofight bad housekeeping. They should no longer tolerate pooroperation, lack of maintenance and negligence. Overall respon-sibility has to rest with the engineers, who should spend 70%of their time on site. The plant management has to supervisethe work by reguilar (daily) visits on site;
(d) restarting of the plant should be. used as a new beginning formachinery and personnel, so that the past becomes history andwill never happen again. If needed, this is the mostappropriate time for efficient assistance by an experiencedfirm with operations experience.
Iuplementation of such drastic measures will be difficult as long as themarket demands continuous production. But any possibility for an extendedshutdown should be used to implement the measures at least section bysection.
Preventive Maintenance
1.58 Preventive maintenance is now standard practice in theindustry, as a result of past experiences (breakdowns, losses, etc.) andhas various advantages:
(a) the need and efforts for housekeeping are reduced;
(b) unexpected downtime becomes less frequent;
(c) less material and energy is lost when constant operation ismaintained; and
(d) equipment running conditions (energy consumption) are improved.
This important task requires qualified personnel, engineers and a wellestablished organization including spare parts control.
1.59 As a rule maintenance work is only finished when the place ofwork is cleaned, safety devices and covers fitted, scrap materialremoved, a test run completed and the work done is reported and analyzedto build a record of the machine's history and make the reordering ofspare parts easier.

- 11 -
1.60 Odd bits and pieces lying around in the plants, missing covers,etc., are evidence that this standard of maintenance work has by no meansbeen achieved.
Instructions and Indications in Arabic
1.61 In order to facilitate work at all levels, operatinginstructions, safety instructions, warning signs, etc. should be in agenerally understood language; in this case, Arabic.
Troubleshouting
1.62 Some of the :-marks mentioned under "Housekeeping" could alsobe placed under this heading.
1.63 No matter how well preventive maintenance is done, breakdownsor poor operation will occur. Troubleshooting has to take care of suchproblems by immediate repair, either permanent or temporary. If atemporary repair is made, the final repair should follow as soon aspossible.
1.64 Immediate troubleshooting is important to restore normaloperating conditions, prevent losses, and for good housekeeping. In allthe plants visited by the Consuitants, troubleshooting greatly neededimprovement.
Spare Parts
1.65 Discussions with plant managers indicated that there is acritical shortage of spare parts. GOC confirmed this. The criticalfinancial situation should not be allowed to affect the purchase of smallbut very important items. The Consultants obtained the followingimpressions:
(a) the financial situation, particularly the availability offoreign currency, is difficult. Limits to the purchase ofspares are too strict;
(b) excessive wear and tear consumes additional spare parts. Thisis partly due to incorrect operation, lack of maintenance ordelayed maintenance, and insufficient training. Excessive wearhas been observed on refractories, mill lining, grinding media,kiln roller stations, kiln tyres, etc.;
(c) negligence leads to loss of essential parts that requirereplacement, e.g., welding rods, screws, nuts, scales, grindingmedia, kiln lining material, etc. Some of these items arerendered useless simply by improper handling and storage;
(d) it can be concluded that proper maintenance and spare partsmanagement and handling has a high savings potential. Thesavings are urgently needed for missing spare parts;

- 12 -
(e) under difficult financial conditions the selection ofpriorities and suppliers (quality) becomes most important.Since the plants are operated by instruments, the latter havetop priority. Optimal operation (energy, saving) will in manyways justify their maintenance cost; and
(f) the Consultants were surprised that small but vital items likepaper and ink for recorders are not available in all plantsvisited. As already mentioned, data recording is important fortrend evaluation, plant operation and energy saving.
Electrical Equipment
Power Distribution System
1.66 Power Measurement. A modern power distribution system mustprovide the necessary information on power demand (kW) and energyconsumption (kWh) at both operator and plant management level, enablingboth groups to detect energy saving potential and to fully benefit fromthe tariff structure of the power company.
1.67 The power distribution system should permit metering of theincoming feeders from the power company and of the individual mainconsumers of the process per department such as 6 kV motors and 6 kV/380V distribution transformers as well as metering of the major electricmotor control centers.
1.68 Any modification to an existing power distribution systemshould take into consideration the need for separate metering of thevarious process departments.
1.69 Analysis of the three plants studied showed that the correctmetering of energy consumption is greatly neglected and that separatepower meters are not available to interpret the high overall energyconsumption.
1.70 Voltage Fluctuations. As long as the voltages in the networkstay within their normal tolerances of + 5X, they do not affect regularoperation of the plant.
1.71 The effects of a drop in voltage larger than 5Z cap seriouslydisturb the process and, for instance, impair the volume of productionand thereby increase specific energy consumption.
1.72 Two of the plants, Tartous and Adra, are faced with occasional,unexpected shutdowns, mainly in the winter season, due to networkdisturbances.

- 13 -
1.73 The component that causes a whole section to stop in the eventof a temporary drop in voltage is difficult to identify. In most cases aprotective trip has already taken place and the most sensitive component,which caused the section to stop, cannot be identified.
1.74 The power distribution voltage on the 6 kV level should berecorded and analyzed both during the unintended plant stops and over alonger period of time.
1.75 If the analysis reveals that repeated temporary voltage dropsin the range of 15% with a duration of 0.5 seconds are responsible forplant stops, countermeasures have to be considered. Such measuresnormally comprise support of the motor control center control voltage toavoid unintended tripping of the contactors and a modification of thevoltage-sensitive thyristor control circuit on the DC-drives.
1.76 These measures may be limited to the kiln department.
Motor Control
1.77 Machines Running Idle. Investigations of plant performanceshowed that some equipment in a department was running at no load whilethe main machinery was stopped; e.g., dust collectors in the cement millcontinued running while the mill was at a standstill.
1.78 Running equipment at no load substantially increases thespecific energy consumption and lowers the power factor of the plant.Table 1.1 shows the ratio no-load/nominal-load in percent for sometypical equipment.
Table 1.1: RATIO NO-LOAD/NOMINAL LOAD
Equipment No-load power x 100 %
Nxominal-load power
Electric motor 2%Belt conveyor 30%Screw conveyor 5%Red ler 15%Bucket elevator 5-30%Pneumatic pump 75%Airlift 25%Airslide 90%Dust removal filter 90%
The total energy required to keep a transport system running can thus becalculated by multiplying the different percentage values by the nominalvalues of the respective installation.

- 14 -
1.79 Some equipment may run idle due to the laziness of theoperators who fail to turn it off, but often an inconveniently designedor badly maintained control system does not permit the machines to stopas soon as they reach no-load conditions. Improvements can certainly bemade after detailed investigation of the control systems in alldepartments.
Field Control Devices
1.80 Field devices such as motion detectors, limit switches, safetyswitches, level detectors, etc., are exposed to difficult environmentalconditions. They must be of a good industrial design.
1.81 Elimination of control interlockings, due to lack ofappropriate field devices, is not the correct solution. It results indamage to machines or spillages of material and increases specific energyconsumption. This was noticed in all three plants that the Consultantsvisited.
Instrumentation
1.82 Accurate and reliable measurements enable the control roomoperator or the automatic process control device to optimize the quality,quantity and energy consumption of the cement manufacturing process.
1.83 To achieve this, a certain effort is required in every plant tokeep all measuring equipment in good operating condition. Studies of theperformance of the three plants showed that instrumentation is a weakpoint, mainly due to lack of maintenance.
Maintenance of Instrumentation
1.84 Sensors. Sensors require the largest portion of instrumen-tation maintenance, as they come directly into contact with difficultenvironmental conditions such as hot gases, abrasive materials,insulation from the process due to deposits (clogging), mechanicaldamage, etc.
1.85 Maintenance tasks are:
(a) keep surroundings of sensors clean;
(b) check proper operation of sensors (analog and digital);
(c) maintain accessibility of sensors;
(d) optimize sequence of maintenance for each individual sensor;and
(e) relocate measuring points (in case of continuous disturbances).

- 15 -
1.86 Transmitters. The transmitters, also called converters ortransducers, convert the analog process variables measured by the sensorsinto the transmission signal of, for example, 4 ...20 m A. This signalmust be strictly proportional to the measured variable and within therequired limits of accuracy.
1.87 Maintenance Tasks are:
(a) check zero, span, damping (mechanical transmitters);
(b) recalibrate according to manufacturer's operating manual;
(c) keep surroundings clean;
(d) check ambient conditions; and
(e) optimize maintenance sequence for each individual transmitter.
1.88 Control Circuits. The analysis of the three plants showed thatmost of the controllers are on manual control; therefore, optimization ofthe process is entirely left to the skill of the control room operators.
1.89 If the control circuit was initially working on automatic modeand only failed after a certain time of operation, it could be assumedthat either one of the components of the circuit was faulty or thecontroller setting was changed by mistake. In the latter case, thecontroller would have to be reset according to the manufacturer'soperating manual.
1.90 If the control loop never worked properly, the entire systemwould have to be rechecked, including the arrangeahent of the sensor andthe dimensioning of the actuator.
1.91 Recorders. Recorders are important instruments that recordmeasured analog process values, showing past history and currenttendency.
1.92 A control room operator must rely heavily on the informationgiven by the recorders especially when the control circuits are out ofoperation.
1.93 In several cases, the recorders were not working due to defectsor lack of ink or paper.
Key Instruments
1.94 The following items can be considered as key instruments for anefficient and energy-saving kiln operation.
1.95 Gas Analysis. Reliable gas analysis is necessary both foroptimum kiln operation and for safety. Experience has shown that gas
- 16 -
extraction is the weakest link in the chain. The sampling point isaffected by the high gas temperature and heavy dust load. Dailymaintenance of the system, including calibration, is essential to ensurereliable results. Also, the probe must be properly located if theanalyzer is to operate correctly. In all three plants the gas analyzersgave wrong readings.
1.96 Weighfeeder. Accurate weighing and feeding is very importantfor a steady kiln operation. The weighfeeder is working in a difficult,dusty environment and needs regular maintenance and calibration.
1.97 Fuel Flowmeter. To maintain a constant feed rate (rawmeal/fuel) the operator needs a correct reading on fuel consumption.
1.98 Kiln Drive. Indications on kiln speed and power demand arerequired for a correct kiln feed and to detect possible variations in theburning process.
1.99 Temperatures. The most important values are:
(a) exhaust gas temperature after preheater; and
(b) raw meal temperature at kiln inlet.
In addition to the above, the burning zone and kiln shell temperaturesare valuable information. The latter can be measured by a portablepyrometer.
1.100 Pressure. The most important values are:
(a) kiln hood pressure;
(b) exhaust gas pressure after preheater; and
(c) pressure under grate in clinker cooler.
Note: A complete instrumentation for a clinker burning processcomprises approximately 35 measuring points. The exact numberdepends on the type and size of the plant and its degree ofautomation.
Emissions
1.101 All emissions are considered as production losses and energywaste. Every effort should be made to reduce emissions.
Environmental Aspects
1.102 Industrial countries have introduced strict environmentalprotection regulations, with severe sanctions and penalties for non-compliance. Continued negligence will certainly lead to similar steps in

- 17 -
other countries. It is therefore advisable to make every effort in thisdirection to avoid being in conflict with the laws when regulation isintroduced.
1.103 Dust emissions also have a negative impact on personnel workingconditions and on their motivation. Unjustified additional cleaning workand inefficiency may be resulting from these conditions.
1.104 Product lying around in the plant and its surroundings is moneylost. Thus, there are good financial reasons to protect the environmentfrom dust emissions.
Electrostatic Precipitators
1.105 It was observed that electrostatic precipitators (EP) wereeither frequently out of operation or that their performance wasinsufficient.
1.106 Without electrostatic precipitators about 10-15% of productionis lost, leading to heavy material and energy losses during a year. Thiswill result in a large amount of money lost.
1.107 Proper maintenance and operation of the electrostaticprecipitators is therefore an important energy-saving factor.
Bag Filters
1.108 Considerations for EPs apply also for bag filters. Since thesefilters are used for a variety of dust collection purposes, thepeculiarities of every individual installation have to be considered.
1.109 The dust collection system must be airtight in order to avoidfalse air infiltration and keep the system effective. Also, proper dustcollection contributes to good housekeeping.
Loss at the Packing Plant
1.110 The packing plants were under thick layers and piles ofcement. This end product is lost. It represents a large waste of energyand other operating resources. Economically speaking, cement losses inthe packing plant have to be calculated on the basis of the actual salesprice. There are many reasons for cement losses, including poormaintenance, poor housekeeping, operational adjustments; and design andtype of machines.
Except for machine type, improvements are possible and urgently needed,and do not require investment.

- 18 -
Dust Collection in Silos
1.111 Filters were discussed in paragraph 1.108, but the observationsmade regarding some of the silos (raw meal, cement) call for specificremarks. Silo dust collection is one of the easier tasks in a cementfactory. The following measures should be taken:
(a) the incoming transport has to be airtight;
(b) the silo has to be airtight and all openings closed;
(c) the dust collection system spiping) has to be well designed andmaintained (no false air infiltration); and
(d) the filter and fan have to be of adequate size and in goodoperating condition.
Provided the above conditions are fulfilled, no product will be lostthrough silo dust collection.
Training
1.112 Training at all Levels. Personnel training is needed at alllevels and positions. Basic knowledge is too often missing, so that fullunderstanding of the cement process and the installed equipment cannot beexpected.
1.113 In the "Holderbank" group's plants, regular training of alllevels of personnel is a common practice. The result is an increasedsense of duty and motivation among operators, foremen and engineers aswell as increased efficiency of the labor force.
1.114 Introduction of regular training programs in the Syrian cementplants is an important tool for increasing the efficiency and contri-buting to the motivation of plant personnel, and should lead to energysavings.
1.115 Operation Simulator. Computerized kiln and mill simulatorprograms are available for operator training. As an example,"Holderbank" kiln and mill simulators allow demonstration of plantbehavior and corresponding reactions. Such programs are adaptable to thepeculiarities of each individual plant. The implementation of suchtraining programs in Syria would also serve to emphasize the importanceof reliable process instrumentation.
1.116 Cement Courses. Cement courses are available. "Holderbank"cement seminars provide comprehensive knowledge on the cement processfrom raw material exploitation to dispatch of the cement. Process andequipment performance is explained and discussed in sufficient detail toensure full understanding. Such courses are equally important forengineers, foremen and operators.

- 19 -
1.117 Laboratory, The laboratory's performance depends on thesophistication of its equipment and the way available equipment isoperated and maintained. Personnel should have sufficient knowledge ofthe cement process and plant operation to understand the importance ofproper sampling and analysis.
1.118 The visiting team noted, however, that the lab personnel didnot have the necessary knowledge and care for such an important task.Sampling was vot representative and accurate, sample preparation was notdone carefull) enough, and some results of the analyses were obviouslywrong (contradicting data measured during the test).
1.119 The importance of the laboratory for energy saving has alreadybeen mentioned. Laboratory training courses are also available and canbe arranged for a broad variety of disciplines from quality assurance tolaboratory techniques.
Alternative uels
1.120 General. The cement plants in Syria use fuel oil(Bunker-C-oil) exclusively for clinker hurning and drying of rawmaterial. Small fuel savings could be achi.ved by using crude oil of therequired viscosity for clinker burning instead of Bunker-C-oil. Savingscome from the fact that fuel preparation is not necessary and fuelconsumption for preheating (approximately 5 kcal/kg cli) and maintenanceof the fuel preparation plant (steam boilers and network) can be saved.However, it remains to be proven whether crude oil is in fact the cheaperfuel or, if not, whether the savings achieved would compensate for thehigher price.
1.121 The use of petrol coke and/or oil shale is rejected since itrequires a high investment cost for grinding and transport facilities aswell as for modifications to the burning process (precalciner system).The application of the above-mentioned fuel3 in the Syrian cementindustry will therefore not be considered further in this study.However, it may not be excluded from long-term planning for the cementindustry.
1.122 Natural Gas. Natural gas, which could totally substitute forthe fuel oil presently used, may be a valuable alternative provided thatsufficiqnt gas of good quality (net heat value not less than 7,000kcal/Nmm, low sulphur content) is available from sources not too fardistant from the cement factories.

- 20 -
1.123 The advantages and disadvantages of natural gas, spelled out inPhasa 1 of the energy efficiency study, are repeated here:
Advantages
- easy ignition of the burner;- capacity can be controlled quickly;- low investment cost;- low cost for maintenance;- clean operation and maintenance;- no storage facilities requiredS and- lower price.
However, the following disadvantages should not be neglected:
- gas pipeline required between gas field and cement factory;- slightly higher fuel consumption for the clinker burningprocess (3-5Z);
- slightly higher kiln exit gas volume (1OX);- lower flame temperature;- less favorable radiation of the flame, which, however, can becompensated by modern kiln burners; and
- depending on the alkali/S03-ratio achieved after the changingfrom fuel oil to gas it may either cause coating in the kilnsystem or lead to improved operating conditions resulting ina slightly higher capacity.
Chemical analysis of the natural gas available in Syria proves that noconsiderable disadvantages have to be expected with respect to theburning process (sulphur content).
1.124 Investment costs for modifying the existing kiln burners to gasfiring would be approximately US$ 150,000 plus LS 130,000 for a 1,500 tpdcement plant (Tartous) and US$ 126,000 plus LS 100,00 for a 1,000 tpdcement plant (Adra). Conversion of the Arabian plant (1,500 tpd)requires an investment cost of US$ 290,000 plus LS 280,000, as auxiliaryfiring for the raw mill must be In permanent operation. Modificationcomprises the gas pipe line from the boundary of the plant, the gasfilter, valves and measuring devices, gas reduction (incoming pressureapproximately 8 bar) and a control station as well as a new kilnburner. Erection and commissioning are included in these costs.
1.125 Investment costs for the gas pipeline from the gas field to thecement plant and the high pressure reduction station are not consideredin the above investment costs.
1.126 Considering a present price for Bunker-C oil of LS 840 per ton(LS 87.5 per 1 million kcal) and a payback period of 3 years the pricefor natural gas should be less than LS 79 per 1 million kcal providedthat the natural gas is delivered to the cement plant boundary at aconstant pressure of not more than 8 bar.

- 21 -
II. TARTOU8 CEMENT COMPANY
General
2.1 The main requirements for efficient cement production are:
(a) suitable raw materials;
(b) a well designed cement plant;
(c) reliable production facilities;
(d) well-organized maintenance; and
(e) well-trained plant personnel.
Output and quality of the product as well as consumption figures formaterials and energy depend to a great extent on the fulfilment of theserequirements.
2.2 Moreover, it is impossible to run a modern cement plantefficiently without reliable control equipment.
2.3 By using a modern suspension preheater kiln plant withoutprecalciner, the following can be achieved:
- Capacity per cross section 145 tpd/m2
- Capacity per kiln volume 2.4 tpd/m3
- Fuel consumption 750 to 800 kcal/kg cli
- Effective grate surface ofclinker coolers 35 to 40 tpd/m2
- Amount of cooling air 2.1 to 2.3 (3.0) Nm3/kg cli
2.4 Investigations at the Tartous cement plant revealed that anumnber of problems with the production equipment have a negativeinfluence on the plant's efficiency. A proof of this is the low capacityof the kiln (far below nominal capacity) and the high consumption figuresfor fuel oil, power and refractory. Due to the low capacity achievedwith the kiln plant, the related raw material preparation equipment(crushers, transports and raw mills) and the cement grinding and packingfacilities as well as the infrastructure (auxiliary equipment such asfuel preparation, water treatment plant, etc.) are not fully used andthus contribute to the high specific consumption figures.
2.5 The rotary dryer for basalt is not necessary, considering themoisture content of the raw materials. The hot gas available from the

- 22 -
kiln plant is sufficient for drying the raw material mix in the rawmill. The rotary dryer could be made available for drying slag orpozzolana. Consequently, a higher amount of these materials could beadded to the cement mills. However, the unfortunate design of the rawmaterial preparation of the plant requires drying of basalt during wetperiods to avoid difficulties in material handling.
2.6 Although plant design deficiencies (e.g., lack of raw materialpreblending) cannot be eliminated without considerable investment, energysaving? can be achieved by means of operational improvements and smallinve3tments, e.g., reconditioning of the main equipment as described inparagraph 2.84, and special attention to regular maintenance andhousekeeping. Emphasis should be placed on reducing false air infil-tration, replacing worn equipment parts (crusher hammers, mill liners,diaphragms, etc.) and maintaining the control equipment. The result willbe longer continuous operation of the equipment, fewer small stoppagesand consequently higher productivity and a lower operating cost.
2.7 Further improvements can be achieved by modernization of theeq'ipment as described in paragraphs 2.87 and 2.90. The mission'sfindings and comments about the production process and its operation aregiven in the following paragraphs.
2.8 The documentation (system layouts, flow charts, motor lists,operation manuals, etc.) available at the plant is not updated, i.e., as-built drawings, flow charts, motor lists and layouts showing the presentstatus of the plant are not available. Proper documentation is aprerequisite for successful operation and maintenance.
2.9 In their meeting with plant staff at the conclusion of theinvestigations, the Consultants recommended a number of mechanical andelectrical measures that should be implemented immediately to improveoperation and maintenance of the plant.
Production Figures
2.10 The production figures for the Tartous cement plant reveal thatthe plant is running at only 60X of its rated capacity. Reasons for thislow output are indicated in the following paragraphs.
2.11 The specific fuel consumption data for Tartous do not indicatea remarkable difference between rated and actual figures. However, bothfigures are on the high side and could be reduced by approximately 10 to15 Z through implementation of the measures described in paragraphs 2.84,2.87 and 2.90.
2.12 For reasons unknown, the specific power consumption in 1985 isapproximately 10 % below the rated specific power consumption, whereas1986 figures show little difference between rated and actual consumption.Nevertheless, these figures are rather high and could be reduced to103 to 108 kWh/t cement by implementing the measures described inparagraphs 2.84, 2.87 and 2.90. A further, smaller reduction may be

- 23 -
achieved in other production and auxiliary (steam, compressed air)departments.
2.13 Gasoline is mainly consumed for administrative purposes(transportation of personnel). Therefore, the specific cost will bereduced in proportion to the increase in the output of the entire cementplant. The assessment of other specific consumption figures, unrelatedto energy efficieney, revealed that there is a potential for reducing thevariable operating costs, e.g.:
(a) the specific consumption figure for paper bags (50 kg) shouldbe less than 20.5 bags per ton of cement. Additional savingscan be achieved by increasing the dispatch of bulk cement; and
(b) the specific consumption figure for refractories should be lessthan 1 kg/t of cement. This figure can be achieved byimplementation of the measures proposed in paragraphs 2.84,2.87 and 2.90.
Raw Materials and Raw Material Preparation
2.14 Raw material properties influence energy consumption more orless and are therefore included in the following considerations. TheConsultants inspected the quarry and raw material preparation to gain afirst-hand impression.
2.15 The chemical and physical properties of the raw material forthe Tartous plant are variable. Both have a negative influence on energyconsumption, output, plant operation and the lifetime of the kiln lining.
2.16 Unfortunately, the present raw material preparation process isnot designed to cope with these raw material properties. An adequatedesign would include preblending beds instead of silos. Handlingproblems due to the periodically high humidity would be solved by activestorage with mechanical reclaimers. However, fundamental modification ofthe existing design would require intensive investigation and studies.
2.17 Under the present circumstances exact knowledge of theproperties of the raw material is more important. Chemical variabilitycan then be overcome to some extent by selective quarrying. Thepossibility of preblending raw material in the quarry area would have tobe investigated.
2.18 Such a procedure would also solve handling problems duringrainy seasons, since the passive and problematic storage in the rawmaterial silos could be eliminated.
2.19 A further step in this direction could be an integratedstockpile (mix of limestone and basalt) in the quarry area with only onetransport to the factory instead of two at present, or separatepreblending storage for these raw material components at the factory.

- 24 -
2.20 The present installation for transporting limestone and basaltbetween quarries and factory consists of two separate, long distanttransports resulting in high operating cost (energy, personnel, main-tenance) considering the present capacity of the cement plant.
2.21 However, this system provides for ample transport capacity incase of a possible capacity increase of the cement plant as indicated inthe proposal for long-term investments (compare paragraph 2.90).
2.22 For the reasons stated above relating to chemical variabilityand handling problems, any improvement to the technical and operationaldesign would require basic changes and high investment.
Raw Material Drying (Basalt)
2.23 From the design and technical point of view the installationmatches the raw material preparation system, i.e., it is complex,resulting in high operating cost. Apart from some possibilitiesmentioned under paragraph 2.1, General, there is no room for energysaving from the technical point of view with the present installation.
2.24 However, the dryer operation could be drastically improved anda lot of energy (fuel and electricity) could be saved by an optimumoperation according to the raw material moisture content. The followingobservation confirms this statement:
j(a) Lab results taken from plant records of December 29, 1986.
The moisture content of dryer feed and discharge was recordedas follows:
H20 content feed : (a) 9.5Z (b) 12.5% (c) 10.5%H20 content discharge: (a) 3.5% (b) 3.5% (c) 2.5%
On December 29, 1986 drying of basalt was not necessary sincethe raw mills had sufficient capacity to cope with thismoisture content. If partial drying was still necessary forhandling reasons, the material was definitely overdried, withthe result that energy was wasted in the dryer and dustproblems were created.
(b) Lab results taken from plant records of March 5, 1987.
H20 content feed : 16.5%H20 content discharge : 8.0%
The Consultants assume that the above analyses were made fromsamples taken the day before since records show that the dryerwas not in operation on March S, 1987. Humidity analyses haveto be made without delay to avoid wrong results due to loss ofmoisture in the lab.

- 25 -
On March 5, the raw material feed was 1,110 t and the fuelconsumption 8,850 kg.
The calculation shows that 95 t of water were evaporated at arate of approximately 900 kcal/kg H20 (Hu = 9,600 kcal/kgfuel). This is a very good result, showing good dryerperformance.
(c) On June 4, 1987, during the Consultants' stay at site 896 t ofraw material were dried with 4,890 kg of fuel.
Unfortunately, no humidity test was made that day. At that timethe weather was dry and we must assume that material with a lowmoisture content was "dried".
The dryer operation must be strictly controlled by measuringmoisture levels; manual "feeling" is insufficient and mostlywrong. The incoming material has to be sampled and analyzedregularly to determine when the dryer operation should start.During dryer operation the outgoing material also has to besampled and analyzed to control the burner operation and avoidoverdrying, waste of fuel, and dust problems.
In the plant, there is insufficient knowledge and insufficientcommunication between the lab and the dryer to ensure operationat optimum humidity levels with a minimum of energy (andoperating costs).
The apparently good specific fuel consumption should berechecked regularly by a test spread over several hours withknowr quantities of material and fuel meters and immediate,exact humidity measurement, under constant operatingconditions.
Immediate humidity analysis is important since samples standingaround (e.g., hot material) exchange water with the atmosphere,so that analysis at a later time is useless (generally toolow).
In reference to paragraph 2.29, Raw Material Drying, it shouldbe mentioned that the basalt drying operating is not necessaryin this plant, except for handling reasons (silos).
The use of alternative fuel was discussed under paragraph1.120.

- 26 -
Raw Meal Preparation
2.25 Summary of Test Results. On June 8, 1987, a test was carriedout on the raw material grinding system to assess the items relating toenergy consumption. The main test results are summarized belowS
Test duration 7 h
Raw mix feed
limestone 87.1 t/h, 5.0X H20basalt 21.3 t/h, 10.01 H20sand 4.4 t/h, 1.01 H20total 112.8 t/h, 5.8X H20
Raw meal production 106.0 t/h, 0.3 % H20at 3.4 % R 0.20 mm
17.8 % R 0.09 mm
Mill speed 15.8 rpm
Filling degree (measured) 17 X
Temperature / 02 Content
gas crusher inlet 320 °C / 8.21 02gas mill outlet 125 OC / 13.01 02gas mill inlet 310 °Cgas mill outlet 85 OC / 12.d 02
Pressure
crusher inlet - 40 mm H20crusher outlet - 140 mm H20mill inlet - 40 mm H20mill outlet - 120 mm H20
Particle Size Distribution
The results of the sieve analysis done by the plant laboratory areshown in Annex 4, page 2: Grain Size Distribution.

- 27 -
Power Consumption
The figures below were either calculated from the amperage meterreadings or, when necessary, estimated.
Mill drive 1,040 kW 9.8 kWh/tCrusher drive 89 kW 0.8 kWh/tMill fan (estimated) 80 kW 0.8 kWh/tSeparator (estimated) 50 kW 0.5 kwh/tSeparator fan 582 kW 5.5 kwh/tBucket elevator x 16 kW 0.3 kWh/t
Total 1,873 kW 17.7 kWh/t_===u===2 ==>====-===
For the complete raw meal preparation system, from the raw materialdosing feeders to the mixing silos, the absorbed power calculated fromthe kWh-meter was 2,950 kW, corresponding to 27.8 kWh/t raw meal.
2.26 Raw Meal Production. With a production of 106 t/h at 17.8% R0.09 mm the mill output is far below the nominal capacity of 130 t/h (or145 t/h) at 14% R 0.09 mm. However, this production is amply sufficientto cover the present kiln requirement (around 1,100 t/d cli), but atreduced capacity the mill system cannot be operated under optimumconditions. The meal is rather coarse. The high residue of 3.42 on0.2 mm may be detrimental to the burning process (the R .2 mm diametershould not exceed 21 for a dry process kiln).
2.27 Power Consumption. During a previous performance test aspecific power consumption of 9.2 kWh/t for the mill alone and 14.3 kWh/tfor the complete grinding plant was measured (at 130 t/h and 14.1% R 0.09mm). In comparison the mill power consumption of 9.8 kWh/t is in thesame range, while the total figure of 17.7 kWh/t has increasedsignificantly. In particular, the power absorbed by the separator fan isabnormally high. Without performing a grindability test on arepresentative sample of the raw material mixture it is impossible topredict the lowest achievable power consumption of the mill system.However, assuming a grindability of 9 kWh/t at 141 R 0.09 mm (for crusherand mill together) the power consumption of the whole grinding systemshould not exceed 14-15 kWh/t. The potential energy saving is thereforerelatively small.
Mechanical Condition and Operation
2.28 The following comments are about items that directly orindirectly influence energy consumption:
(a) General Aspects. At various places (airslides, chutes)material is leaking and accumulating on the floor. Most ofthese leaks are of course also a source of false airinfiltration, always harmful to a mill system.

- 28 -
(b) Impact Crusher. The crusher acts as the first compartment ofthe mill system and, as such, its performance is important forthe grinding process in the tube mill.
The crusher impact bars are badly worn out, impairing crushingefficiency. The double flap gate at the material feed isblocked in an open position, and is the source of the largeamount of false air infiltration (60%) into the crusher.
(c) Raw Mill. The 17% degree of fill is very low for an end-discharge mill (normally about 28.2) but can be explained bythe low production requirement. The presence of large balls (90and 80 mm diameter) is surprising considering that the materialfeed size is smaller than 10 mm. The lifter lining and thedischarge diaphragm are still in good mechanical condition.
The material at the mill discharge is rather fine, i.e., themill feed could be increased, particularly when considering thelow degree of fill.
As for the crusher, there is a high percentage of false airinfiltration into the mill (40%). The low pressure drop overthe mill (80 mm H 0) indicates that only a small amount of gasis drawn through &e mill.
(d) Air Separator. The circulating load of 1.25 (see Annex 4, page3: Separator Performance) in the mill system is very low(normally 2 - 2.5), i.e. 802 of the separator feed goes intothe final product. The separator feed is too fine (30% a 0.09mm instead of 50% to 60%) to allow an efficient operation.Further, the high residue of 3.4% on 0.2 mm indicates aninadequate separator adjustment. The material discharge flapsunder the separator cyclones are blocked, affecting separatorefficiency. The rotor is unbalanced, causing the separator toshake.
A large amount of false air is leaking in at the separatorfeed, increasing the quantity of circulating gas, and causingthe drop in pressure.
(e) Mill Control. Many of the pressure gauges are blocked andtherefore not reliable. Also some thermocouples give wrongreadings. In the control room, part of the instrumentation isnot operating, particularly the recorders.
The mill feed control system is not working. Manual controlleads to unstable mill operating conditions, affecting energyconsumption.
2.29 Raw Material Dryinp. The only really humid raw materialcomponent Is basalt, which can contain up to 20% moisture during

- 29 -
winter. As the basalt can be predried separately, raw material drying isnot a problem in the mill system. Part of the energy from the hotpreheater exhaust gases at 410C is lost due to false air infiltrationbetween the preheater exit and the mill inlet, so that the temperatureavailable for drying is only a little above 300°C. Consequently, alarger quantity of kiln gases have to be drawn through the mill system,increasing the drop in pressure and the power consumption. The sameharmful effect is obtained through heavy false air infiltration at thecrusher and mill inlet.
2.30 Basically, from a pure drying point of view, the basaltpredrying operation is not necessary. Assuming that the dimensioning ofthe gas path in the mill system is adequate (this should be investigatedin detail), the kiln exhaust gases could dry the resulting raw materialat a maximum moisture level of 8% in the mill system. A prerequisitewould be to keep the amount of false air ahead of and inside the millsystem within reasonable limits.
2.31 The above statement will remain valid even if kiln heatconsumption is decreased after a kiln optimization program is introduced.
Clinker Burning Process
2.32 Summary of Test Results. On June 8, 1987, a test was carriedout on the kiln system to assess the items related to energy consumption.The main test results are summarized below:
Test duration 10 h (10.00 h - 20.00 h)
Kiln feed quantity 816 tClinker produced (a) 401.7 t (weighing)
(b) 46633 t (kiln feed/cli-ratio = 1.753Fuel consumed 46.19 m at 125 °C - 41.34 t (0.895 t/m )Preheater exhaust gases 410 C / -250 mm H20 / 6.5 Z 02Transition chamber 980 °C / 3 5 % 02Cooling air 140,000 Im'/hPrimary air 7,500 Nm jh (measured)Cooler exhaust air 96,000 Nm /h, 210 °CClinker temperature 100 °CKiln radiation losses 2,67 Gcal/h (3,100 ki)
Power ConsumptionKiln exhaust gas fan 484 kWCooler fans 378 kW in totalCooler exhaust air fan 119 kW
For the complete burning process, including the kiln feed, clinkertransport to silos and electrostatic precipitator, the absorbedpower calculated from the kWh-meter was 1533 kW.

- 30 -
Clinker Production
2.33 A big discrepancy exists between the weighed (401.7 t) and thecalculated (466.3 t) clinker production. The lower value is certainlywrong, because during the test it was impossible to withdraw the wholeclinker flow from the chain conveyor. Therefore an unmeasurable portionof it was still going to the clinker silo. On the other hand, the uppervalue is probably too high. According to the kiln operators, the assumedkiln feed/clinker factor of 1.75 (as posted in the control room) is toolow. A more realistic value should be 1.80. Assuming that the kiln feedquantity was correct, the clinker production would then be 453.3 t, i.e.45.3 t/h or 1,088 t/d.* Subsequent comments will therefore relate to thiscalculated production.
Heat Consumption
2.34 From the above results and on a basis of a lower calorificvalue of 9,600 kcal/ kg fuel, the specific kiln heat consumption amountsto 876 kcal/kg cli (3,668 kJ/kg cli). Considering the general kilnoperation, this result appears to be realistic. The comparison with theyearly average heat consumption of 886 kcal/kg cli (3,710 kJ/kg cli),stated during phase I of this study, also confirms the test result. Forthis type of kiln system, which is still in good mechanical condition,the specific heat consumption under stable operating conditions shouldnot exceed 800 - 820 kcal/kg cli (3,350 - 3,430 kJ/kg cli). The reasonsfor the excessive heat consumption are discussed in the followingparagraphs.
2.35 Oversizing of Equipment. Generally speaking the kiln system isoversized and could produce at least 1,500 t/d (with existing preheater),or even up to 1,800-2,000 t/d for the rotary kiln and the grate cooler(with modified preheater). The equipment is therefore not running atmaximum efficiency when producing only 1,100 t/d, and the specific heatlosses are consequently on the high side.
2.36 Grate Cooler. With specific loads of 18 t/m2 d (total gratearea) and 460 t/m d (grate width at inlet) at 1,100 t/d, the cooler isunderloaded. It is operated with a thin clinker bed, at a low undergratepressure in Chamber 1 of 180-250 mm H O. The heat recovery is thereforenot optimum, e.g., the cooler efficiLency was around 60 Z during thetest. With a secondary air quantity of approx. 1 Nm /kg cli the recoveryefficiency should be over 70Z.
2.37 The automatic control circuits for grate speed and cooling airquantity are not used, i.e., the cooler is controlled manually. A welladjusted automatic cooler control system would allow a more efficientoperation.
2.38 Kiln Firing System. The kiln firing system is not verysophisticated and the flame shape not optimum. A black plume about onemeter long is always visible at the burner tip, which is not normal for

- 31 -
fuel oil firing. The primary air is approximately 17% of the stoechio-metric combustion air, instead of less than 10% for an efficient oilfiring system. Furthermore, 4% of the combustion air is sucked into thekiln hood in the form of false air, at the gap around the burner pipe andat the open inspection door.
2.32 Rotary Kiln. At 1,100 t/d the specific kiln loads are only 79t/m *d and 1.15 t/m *d, which is far below normal figures for suspensionpreheater kilns. This kiln oversizing results in increased specificradiation and convection losses. During the test these losses amountedto 59 kcal/kg cli (247 kJ/kg cli) despite the relatively low kiln shelltemperature profile. The refractory lining consumption in the sinteringzone is on the high side (about 1,000 g/t clinker). Just after the testthe kiln had to be stopped due to localized overheating. The kiln inletand outlet seals are working properly so that not much false air leaksinto the system. On the other kilns, however, the situation was not asgood as for kiln No. 4.
2.40 Excess Air and False Air Infiltration. No gas analyzer isinstalled at the kiln inlet. The operators run the kiln according to theindications of the analyzer located below the top cyclone stage, when itis working. During the test the kiln was operated with an average of4.5% 02 below the top stage (from 3% to 7% 02). Measurements taken witha portable analyzer showed that this value corresponds to 3.5% 02 in thetransition chamber and 6.5% 02 at the preheater top. No CO wasdetected. Both 0 levels are too high for an economical kiln operation,due to excess air in the kiln and false air infiltration into thepreheater. For fuel oil firing, an excess air corresponding to max. 1.5% 02 at kiln inlet is nLrmally sufficient to ensure a complete combustionand, if the preheater is airtight, the 02 content at the preheater exitshould not exceed 3.5% (including kiln feed transport air).
2.41 Preheater. From a heat consumption point of view, a shaftpreheater is generally less efficient than a conventional 4-stage cyclonepreheater. But the main reason for the high exhaust gas temperature isthe high kiln heat consumption. False air is leaking into the system atvarious points, mainly at the cyclone stages (auxiliary stack, mealpipes, etc), affecting the kiln heat consumption. The abnormally highkiln feed/clinker factor of approximately 1.80 denotes a poor dustcollection efficiency of the top cyclone stage, which contributes to theincreased kiln heat consumption.
2.42 Kiln Feed Quality. Since the XRF equipment is out of order,quality control is based on an hourly determination of the kiln feedtitration. During the day of the test the average titration of 14 hourlysamples was 74.9 % with a standard deviation of 0.46 %. Therefore, thefluctuations are already too high to ensure a stable and smooth kilnoperation, resulting in an increased kiln heat consumption.
2.43 Kiln Control. Part of the instruments and recorders, even themost important ones, are either not working properly or not giving

- 32 -
correct readings. This remark applies specially to kilns 1 and M. Thecooler control circuits are not in operation. Frequent and sometimesdrastic adjustments of the fuel are made to maintain stable conditions inthe burning zone, yet the liter weight varies between 1,100 and 1,400g/l. The kiln control philosophy changes from shift to shift. Operatinginstructions are either missing or not followed by the operators.
Power Consumption
2.44 Based on a clinker production of 45.3 t/h the specific powerconsumption for the complete burning process amounts to 34 kWh/t cli.This figure includes the kiln/raw mill dust collection equipment. It istoo high for this type of kiln system. Due to the absence of kWh-meters,the power consumption of the main machines was calculated from theamperage meter readings. A few comments on the results are given below.
2.45 Kiln Exhaust Gas Fan. The kiln exhaust gas fan is greatlyoversized and operates at about half load. Flow control is done by avariable speed hydrodynamic drive, which has a poor efficiencyparticularly in the lower speed range. This explains the high powerconsumption of 10.7 kWh/t cli measured during the test, instead of theapproximately 5-6 kWh/t cli that could be achieved with a well-designedfan/drive system under the same kiln operating conditions.
Further power savings could be made by taking measures aimed at direct orindirect reduction of the quantity of kiln exhaust gas.
2.46 Cooler Fans. About 8.3 kWh/t cli are consumed by the fivecooler fans together, despite the low undergrate pressure. The mainreason for this extremely high consumption is the type of flow control,by a damper located behind the fan. For the same quantity and pressureof cooling air a power consumption of less than 3 kWh/t cli could beachieved with an efficient fan/flow control system.
2.47 Cooler Exhaust Air Fan. The cooler exhaust air fan is equippedwith a variable speed hydrodynamic drive. The power consumption of 2.6kWh/t cli is high considering the low pressure drop of 70 mm H O acrossthe multicyclone and could be reduced by using a more efficient fan/drivesystem.
Cement Grinding
2.48 Summary of Test Result. On June 10, 1987, a test was carriedout on the cement grinding system to assess the items related to energyconsumption. The main test results are summarized below:
Test duration 5 h

-33 -
Mill feed
- clinker 74.4 t/h- gypsum 3.4 t/h
Cement production 77.8 tlh at 3,175 cm2/gaccording to blaine
Mill speed 14.5 rpm
Filling degree (measured) comp. I 25.3 Zcomp. II 24.5 Z
Air flow through mill 40,000 Nm3/h
Water injection no
Temperature
- mill feed 72 °C- cement 135 XC- air mill outlet 125 °C
Pressure
- mill outlet - 50 mm H20- p separator 210 mm H20
Particle Size Distribution
The results of the sieve analysis done by the plant laboratory areshown in Annex 4, page 8: Grain Size Distribution.
Power Consumption
The figures below were calculated from the amperage meter readingsor, when necessary, estimated.
Mill drive 2 x 1,800 kW 46.3 kWh/tMill fan 107 kW 1.4 kWh/tSeparator 50 kW 0.6 kWh/tSeparator fan 217 kW 2.8 kWh/tBucket elevator 2 x 16 kW 0.4 kWh/t
Total 4,006 kW 51.5 kWh/t
For the whole cement grinding plant, from the dosing feeders to thecement belt conveyors, the absorbed power calculated from thekWh-meter was 4,052 kW, correspotiing to 52.1 kWh/t cement.

- 34 -
Cement Production
2.49 With a production of about 78 t/h at 3175 Blaine (correspondingto 85 t/h at 3000 Blaine) the mill output is far below the nominalcapacity of about 110 t/h at 3000 Blaine. The main reasons for this verylow production are the poor mechanical condition of the mill and the pooroperation control.
Power Consumption
2.50 During a previous performance test a specific power consumptionof 35.2 kWh/t for the mill alone and 39.1 kWh/t for the whole grindingplant was measured (at 105 t/h and 3055 Blaine). These values areslightly high but in a normal range. In comparison the mill powerconsumption of 46.3 kWh/t during the present test is extremely high, eventaking into account the higher cement fineness of 3175 Blaine. The powerconsumed by the ancillary equipment is normal. At the required finenessof 3000 Blaine, the optimized mill should be capable of producing 120 t/hwith a specific power consumption of 32 kWh/t (37 kWh/t for the wholesystem). The potential savings in energy are therefore appreciable.
Mechanical Condition and Operation
2.51 The following paragraphs comment on items that directly orindirectly influence energy consumption.
2.52 Cement Mill. In the first compartment the 25.3% degree of fillis rather low (normally 28%). The material level is also too low. Thelifter lining is possibly worn out and partly loose.
2.53 The intermediate diaphragm is in very bad condition:
- 3 liner plates are missing;
- 1/3 of the plates' fastening bolts are missing; and
- some slots have an opening width of up to 18 mm while othersare completely closed due to hammering.
2.54 The degree of fill of the second compartment is also too low(24.5% instead of 28%). The material level is too low as well. Theseparator screen shows heavy wear and the granules are not classified.Large granules passed from the first to the second compartment.
2.55 The discharge diaphragm is 50% clogged and very worn.
2.56 The mechanical condition of the mill drive is alarming. Anabnormal noise can be heard at the gear and lubricant is leaking at themain gear casing.

- 35 -
2.57 The major breakdown that occurred recently at Cement Mill No.1, due to cracks at the mill head, should encourage a careful mechanicalinspection of all other mills.
2.58 The mill ventilation of 40,000 Nm3/h corresponds to an airvelocity of 1,6 m/s inside the mill, within the normal range for aclosed-circuit mill. However, there is not enough air to evacuate theexcess grinding energy so that the cement temperature in rising toalready critical levels.
2.59 Air Separator. No special investigation was made on theseparator, as the mill was recognized as the main bottleneck. However,the comparison of the Blaine value of the mill discharge (2300) with thatof the final product (3175) shows that the separator operation issatisfactory in a first approach. A definitive statement about theseparator can be made at a later stage, once the mill has beenreconditioned.
2.60 Mill Control. In the control room parts of the recorders arenot in operation. The mill control circuit is out of order too. Themill operation is often interrupted for various reasons. The mill oftenruns without feed due to the absence of an interlocking system andinsufficient attention by the operator.
2.61 In particular, operation of the mill without feed has a strongeffect on power consumption and also damages mill liners and diaphragms.
Auxiliaries
2.62 The energy saving potential of the auxiliaries may not be largein terms of quantity; however, it is large in terms of percentage, sincetheir performance is often the most neglected.
Water
2.63 Water is said to be available in excess in this area. Thefactory collects water from 8 wells. It is further processed in thefactories' own water treatment plant (capacity 143 m Ih) for variouspurposes (boiler, cooling, drinking). The following data prevail:
Boiler water feed 5-6 w3/h (max. 8 3/h)Cooling water feed 30 m /h (max. 40 m Ah)
Pumps: - Water treatment 3 x 15 kW (2 standby)- Drinking water 2 x 15 kW (1 standby)- Cooling water 5 x 160 kW (1 standby)
Readings taken by the Consultants over approximately one day (22.7 h) ledto the following results:
Boiler water consumption 6.61 m3/hCooling water consumption 30.66 m3/h
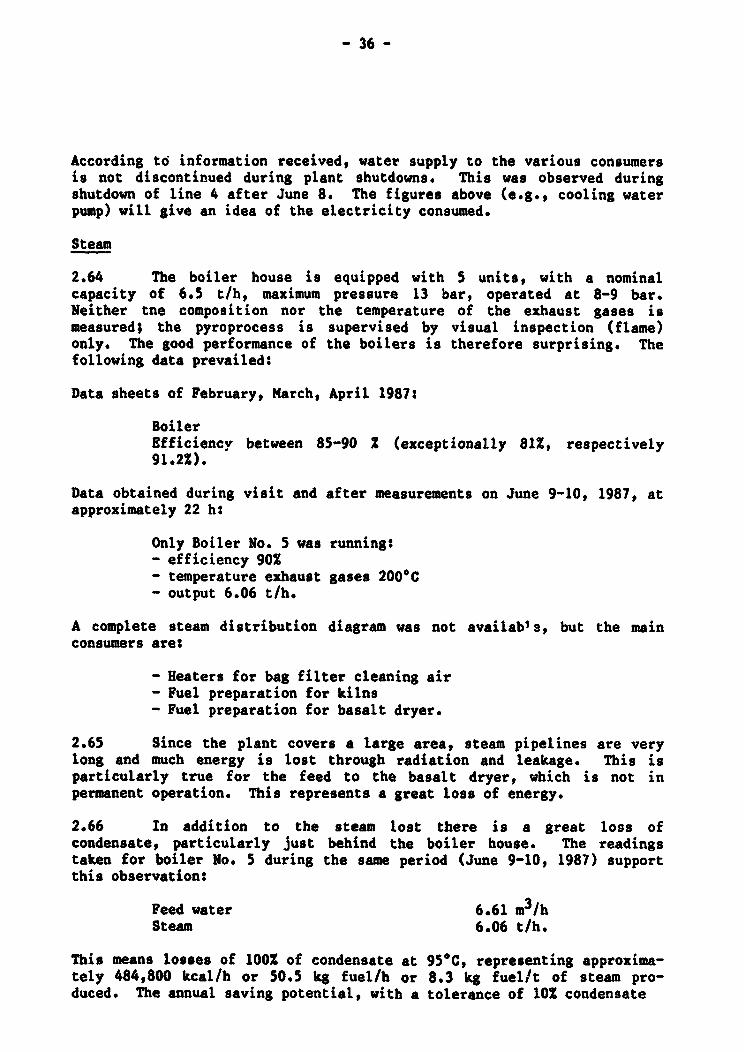
- 36 -
According to information received, water supply to the various consumersis not discontinued during plant shutdowns. This was observed duringshutdown of line 4 after June 8. The figures above (e.g., cooling waterpump) will give an idea of the electricity consumed.
Steam
2.64 The boiler house is equipped with 5 units, with a nominalcapacity of 6.5 t/h, maximum pressure 13 bar, operated at 8-9 bar.Neither tne composition nor the temperature of the exhaust gases ismeasured; the pyroprocess is supervised by visual inspection (flame)only. The good performance of the boilers is therefore surprising. Thefollowing data prevailed:
Data sheets of February, March, April 1987:
BoilerEfficiencv between 85-90 X (exceptionally 81%, respectively91.2%).
Data obtained during visit and after measurements on June 9-10, 1987, atapproximately 22 h:
Only Boiler No. 5 was running:- efficiency 90%- temperature exhaust gases 200°C- output 6.06 t/h.
A complete steam distribution diagram was not availab1s, but the mainconsumers are:
- Heaters for bag filter cleaning air- Fuel preparation for kilns- Fuel preparation for basalt dryer.
2.65 Since the plant covers a large area, steam pipelines are verylong and much energy is lost through radiation and leakage. This isparticularly true for the feed to the basalt dryer, which is not inpermanent operation. This represents a great loss of energy.
2.66 In addition to the steam lost there is a great loss ofcondensate, particularly just behind the boiler house. The readingstaken for boiler No. 5 during the same period (June 9-10, 1987) supportthis observation:
Feed water 6.61 m3/hSteam 6.06 t/h.
This means losses of 100% of condensate at 95C, representing approxima-tely 484,800 kcal/h or 50.5 kg fuel/h or 8.3 kg fuel/t of steam pro-duced. The annual saving potential, with a tolerance of 10% condensate

- 37 -
loss, is estimated to be more than 500 t of fuel. The loss of condensaterepresents only half of the energy lost since the same amount of freshwater haa to be heated up to the same temperature to compensate for theloss. Water preparation, pumping, maintenance etc. must also beconsidered.
Compressed Air
2.67 The plant has two practically identical compressed sirstations, each eqiipped with four 3-stagq-turbo compressors of 8100 m /h(maximum 10,000 m /h) each, at ?.5 kp/cm . The following readings weretaken on June 9, 1987:
pressure (system) 2.3 - 2.4 kp/cm2
temperatures, 1. stage in: 90C out: 60°C(typical) 2. stage in: 105C out: 68C
3. stage in: 110C out: 67C
power consumption 50-55 Amps (motor 630 kW/3,000 rpm)
2.68 According to the information received, five compressors areneeded in the factory for the operation of all four kilns. During theConsultants' plant inspection two kilns were operating and fourcompressors were running. It is assumed that a considerable amount ofcompressed air, the most expensive form of energy, is lost in thesystem. There is no system diagram, showing all consumers, available andthe quantity of air cannot be measured. It is therefore impossible toevaluate the performance of the compressors.
2.69 Judging from the installed capacities, it is obvious that airlosses add up to a considerable amount of energy waste throughout theyear. It has to be pointed out that idle running of pneumatic conveyorsis extremely power-consuming as shown in paragraph 1.77. Idle running,especially of the pneumatic transport systems, must be avoided.
Electrical Equipment
2.70 General. Evaluation of the questionnaire used in Phase 1 ofthe energy efficiency study showed:
(a) a rather high energy consumption (kWh/t); and
(b) operating problems with the instrumentation.
Phase 2 of the energy efficiency study confirmed the above observationsand revealed the following details:
Power Distribution System
2.71 Power Measurem-nt. As mentioned for all plants in paragraph1.69, the power distribution system does not allow for proper metering of

- 38 -
the energy consumption per department, comprising the material flow fromthe respective feed bins to the storage silos.
2.72 Furthermore, the outgoing 6 KV-feeders of the busbars 2 UTS 1to 3, BL.2 were only equipped with A-meters. The power demand (kW) andenergy consumption (kWh) of the individual main consumers such as 6 kVmotors and 6 kV/380 V distribution transformers had to be estimated fromthe A-meter readings. The cost for electrical energy is based on thefollowing tariffs:
- night from 12 p.m. to 7 a.m- (7 h) 29 ps/kWh- day from 7 a.m. to 5 p.m. i10 h) 33 ps/kWh- evening from 5 p.m. to 12 p.m. (7 h) 54 ps/kWh
Total energy consumption from January to April 1987 was as follows:
night (7h) day (lOh) evening (7h)19,882,368 kWh 27,118,872 kWh 18,176,400 kWh
The specific energy consumption during the three tariff periods revealsthe following distribution (100% = daily average):
105% 100% 96%
These figures show that little profit is drawn from the tariffstructure. Energy cost could be reduced by decreasing energy consumptionduring the high-tariff evening hours. The following readings could betaken:
2.73 Raw Meal Preparation. Comprising the material flow from theraw material feed bins to the preheater, including mixing silos.Metering (kWh and KVarh) on 6 kV-panel No. 43, feeding the busbars of 2UTS1, BL.2. Calculation of the specific energy consumption (kWh/t) iscarried out and commented in paragraph 2.27.
2.74 Clinker Burning. Comprising the material flow from thepreheater to the clinker silos including the electrostaticprecipitator. Metering (kWh and kVarh) on 6 kV-panel No. 31, feeding thebusbars of 2 UTS 2, BL.2. The specific energy consumption (kWh/t) iscalculated and commented in paragraph 2.44.
2.75 Cement grinding. Comprising the material flow from the clinkerand gypsum feed bins to the cement transport belt conveyors. Metering(kWh and kVarh) on 6 kV-panel No. 34, feeding the busbars of 2 UTS 3,BL.2. The specific energy consumption (kWh/t) is calculated andcommented in paragraph 2.50.
Voltage Fluctuations
2.76 According to the information received on site from the plantmanagement, voltage fluctuations caused several plant shutdowns last

- 39 -
winter. As explained in paragraph 1.70, improvements can be madefollowing detailed investigation of network conditions.
2.77 The three main 31.5 MVA, 66/6kV transformers are equipped withon-load tap changers but voltage regulation is manually operated onlyfrom the control room of the main station. The installation of anautomatic voltage regulator can improve network conditions and maintainthe voltage within acceptable tolerances provided there are no suddenchanges in the supply voltage. To get more information on the actualvoltage fluctuations, a voltage recorder for the 66 and 6 kV supplyvoltages should be installed.
Power Factor Compensation
2.78 The contract covering the supply of electrical energystipulates a minimum monthly average power factor of 0.85. The figuresreached for 1986 are between 0.9 and 0.93 and no excessive consumption ofreactive energy has had to be charged up to now. The 6 kV-motors aredirectly compensated by capacitors connected in parallel at the motorterminals, and the 380 V-motors are compensated by automaticallycontrolled capacitor banks connected at the low voltage distributions.Some of the 6 kV capacitors failed after a certAin time in operation,causing the respective motor to trip. The 6 kV capacitors should bechecked to verify if they are of the right size and in good condition andblocking circuits installed on the supply side of the capacitors, ifnecessary, to prevent resonances due to harmonics and to protect thecapacitors from current surges.
Layout of Power Distribution System
2.79 As a long term measure and in order to facilitate maintenanceand power measurement per department, all electrical interconnectionsbetween different departments that lead to a stoppage of more than theaffected department should be eliminated.
No-load Operation of Main Transformers
2.80 One of the three main 31.5 MVA, 66/6 kV transformers is runningat no-load as a stand-by transformer, consuming approximately28 kW x 24 h = 672 kW per day unnecessarily. An oil filled transformerwith a well maintained silica gel breather can be switched off for a yearor more without problems. Furthermore, the overall power factor of theplant will be improved by the absence of approximately 1,200 kVarreactive power.
Drives
2.81 Constant speed motors up to 150 kW are 380 V squirrel cage orslipring motors depending on the starting torque requirements. Constantspeed motors above 150 kW are 6 kV slipring motors. Variable speeddrives are either equipped with thyristor controlled DC motors or with

- 40 -
squirrel cage or slipring motors in conjunction with variable speedhydraulic couplings. No special technical or operational problems werenoticed. The following DC-drives are installed:
- dosing feeders- air classifiers for raw mills and cement mills- kiln drive- clinker grate cooler
These drives have an efficiency between 82% and 92 X over the speed rangefrom 401 to 100%. The E.P. - fan (315 kW) and the kiln fan (1,250 kW)are equipped with variable speed hydraulic couplings and constant speedmotors. The efficiency of these drives varies between 60% and 80% in thespeed range of 40% to 100%. Comments on the actual efficiency of thekiln fan are made in paragraph 2.44.
Mot-! Control
2.82 The control system is of a conventional design in 220 V, 50 Hzrelay technique. The raw mills and kilns for lines 3 and 4 arecontrolled from a central control room located near the burnerplatform. The control room for the cement mills for lines 3 and 4 issituated in the mill building. Technical problems in the control systemmainly consist of defective components like relays and field controldevices, as mentioned in paragraph 1.80. Maintenance of the controlsystem must include checking all transport and safety interlocks. Asexplained in paragraph 1.77, machines should not run idle.
Instrumentation
2.83 The instrumentation is of a conventional design. Transmittersfor gas flow are of the ring-scale type and gas flow is shown on remoteindicators in the control room. As described in paragraph 1.83, the mainproblems arise from lack of maintenance. The amount of equipmentinitially installed in the control room, such as indicator instruments,recorders and regulators, is sufficient. The following control circuitsin the raw mill and kiln section are manually instead of automaticallycontrolled:
- differential pressure air classifier- mill charge ratio- cooling air for clinker cooler chambers 1 to 5- pressure below hot chamber grate
The following control circuits were on automatic control:
- raw mill feeders- kiln feedkiln hood pressure

- 41 -
The carriage-type kiln shell temperature scanner and some recorders werenot functioning. Several instruments and recorders gave wrong readings,e.g., gas analyzer. Thorough checking and calibration of all processmeasurements is absolutely necessary.
Proposal for Operational Improvements
2.84 The proposals for operational improvements are for thedepartments investigatedt, (the raw mill, kiln and cement mill systems),the main consumers of energy in a cement plant. The requirements foroperational improvements for the Tartous cement plant are listed in Table2.1. The table shows the potential savings in energy consumption viz.fuel oil (kcal/kg clinker) and power (kWh/t) as well as the capital costand operating costs (if any) related to these operational improvements.
2.85 Normal maintenance executed by the plant's personnel and normalconsumption of wear and spare parts are not considered as extra costs.The potential savings are calculated on the following bases:
Annual raw meal production 657,000 tAnnual clinker production 365,000 tAnnual cement production 381,500 tFuel oil price 840 LS/tPower price 0.36 LS/tExchange rate Syrian pound to US Dollar 11.25
The total calculated savings from operational improvements amount to:
Fuel oil on clinker basis 22 kcal/kg or 2.3 kg/tPower on cement basis 23.6 kWh/t
2.86 Further reductions in energy consumption are possible in otherproduction and auxiliary departments, as mentioned in the precedingparagraphs, and by avoiding no-load running of the main transformers andidle running of equipment. Energy costs can be reduced as well byimproved production and energy management, taking into account the tariffstructure for power (running of equipment at low tariff periods).

- 42 -
Table 2.1: S UNA OF PROJECT PROPOSALS AND RECOMMENDATIONSTARTUS CEMENT PLANT - RAW MILL NO.4
Capitol Cost Operating Cost Potential Savings EffectiveProject Proposal Foreign Local Foreign Local Per Annum Llfetime
USS'OOO LS'OOO USS LS USS Years
Oponotionol ImproveentsExpected production:Clinker 365,000 t/oRaw Ibol 657,000 t/aCement 381,500 t/eAll Items mentioned hereinaftershould be Included In the normalmaintenance program
ReconditIoning of raw mIII systemReplace the crusher Impact bar" a/Adapt the ball charge o/
(no 90 and 50 m dliimeter, moresmaller balIls) 3 kWh/t 63,070
Eliminate all false air leakage o/Ellminate all material leakageBalance the separator rotorAdjust the separator cyclonedischarge flaps
AdJust the separator speedCheck and repair all measuring
equipment and recorders b/put the mill control system
Into operation
Reconditioning of Kiln SystemPut all controi loops Intooperation (ciinker cooler) b/
Eliminate false air leakage atk kiln hood (burner pipe, door) 12 kcal/kg 34,070
3 preheater - upper part 0.6 kWh/t 7,010Operate with lower excess air
(target value 1.5 % 02 at kilnInlet and 3.5 S at preheater top),possibly Installation of gas ana- 10 kcalAkg 28,390lyzer of kiln inlet (compare small 4 kwh/t 46,720Investment modifications - electrical
Improve kiln feed quallty by:- Improvemnt of quarry operation- Improvemnt of raw meal quallty control
Reconditioning of cement mill system- Replace lining 1st + 2nd compartment a/- Replace dlaphragm plates a/ 14 kWh/t 170,910- Adapt ball charge composition- Check and repair the whole
mill drive system- Chek and repair all measuring
equipment and recorders b/- Put the mill control system
Into operation to avoidrunning the mill empty b/
a/ Norml wear parts.b/ Pfssibly some new Instruments and control components required (compare: small Investment
modifications (electrical).

- 43 -
Proposal for Modifications Requiring Small Investments
2.87 Modifications requiring small investments are proposed for thedepartments investigated (the raw mill, kiln and cement mill systems) andthe electrical equipment. Modifications for the Tartous cement plant arelisted in Table 2.2. The table shows the potential savings in energyconsumption (fuel and power) as well as the required capital andoperating costs (if any) related to these modifications.
2.88 As indicated in the table, modifications are only foreseen forthe kiln system and the electrical equipment. The following commentsrelate to the modifications for the electrical equipment:
(a) To get more detailed information on energy consumption all 6 kVoutgoing feeders for raw meal preparation, clinker burning andcement grinding should be equipped with kWh-meters.
(b) To get more information on the effects of voltage fluctuations,a voltage recorder for 66 kV and 6 kV should be installed inthe control room of the main station.
(c) To improve the control system ell transport and safetyinterlocks should be checked and defective components such asrelays and field control devices, e.g. motion detectors, limritswitches, etc., should be repaired or replaced. For newequipment the main emphasis should be on a good industrial typedesign, e.g., electronic proximity switches.
(d) To improve the cement manufacturing process all measurexert.circuits should be checked and defective components such assensors, transmitters, regulators, etc., should be repaired orreplaced.
(e) For new equipment the signal flow of process measurementsshould be standardized, e.g., each analog process variabletransformed by a transmitter into a standard signal of 0-20 orpreferably 4-20 m A.
The expected life of the newly installed and/or modified equipment andinstallations is estimated. The capital costs are determined on thebasis of prices received from reputable equipment manufacturers (pricebasis September 1987). They include the cost for transport to the site,civil and structural steel works, erection and commissioning of theequipment but not customs and taxes, etc., for equipment and personnelimposed by the Syrian authorities.

- 44 -
2.89 Potential savings were calculated on the basis described inparagraph 2.85. However, the expected annual production is considered asfollows:
Raw meal 654,500 tpaClinker 385,000 tpa andCement 402,000 tpa.
Total calculated savings from modifications requiring small investmentsare:
Fuel oil on clinker basis 40 kcal/kg or 4.2 kg/tPower on cement basis 5.7 kWh/t

- 45 -
Table 2.2, SU14ARY PROJECT PROPOSALS AND REOOWMENOATIONSTART0IS CEMENT PLANT - KILN NO. 4
Capital Cost Operating Cost Potential Sevings EffectiveProject Proposal Forolgn Local Foreign Local Per Annum Llfetime
USSOW LSWOOO USS LS USS Years
Small Invetment NodIficotlonsExp eted productionsClinker 385,00C tpaRaw Neal 654.500 tpaCement 402,000 tpa
Modificatlon of Grate Cooler 2,030 720- Adapt eooler grate are and 25 kcal/kg 74,860 t 15design to actual kiln capacity 0.6 kWh/t 7,390 *(operation with thick elinker bed) (kiln fan)
- Replace the outlet dapers with 2.0 kwh/t 24,640 * 15Inlet radial vanes for thecoolIng air flow control
Roplacomnt of kiln firing system 12 Kcal/kg 35,930 * 15-Repace the burner with an ad- 66 60
justable one- Replac the primary air fanModificatlon of Top Staqe Cyclones 3 kcal/kg 8,980 *
o.l kWh/t 1,230 *- Improve efficiency by modification 460 320 (kiln fan) 15
of gas Inlet/thimble designReplaemont of Kiln Fan Drive- Replace the hydrodynamic drive 316 130 3.0 kWh/t 36,960'
with a DC-motor (1,250 P2W)Alternatively to above Item:
Replaeement of Kiln Fan and Drive (445) (380) (5.0 kWh/t) (61,660)* 15- install a new and officient fan
with a DC drive (320,000 m3/h,G00 - H20, 800 kW)
Eloctrical Equlpment a/All 6 kV outgoing feeders for raw 13.5 20meal preparation clinker burningand coemnt grinding to be equippedwith kWh-mters(Total 20 panels).
Install one voltage recorder 1.2 20(66 kV and 6 kV) In the controlroo of the main station.
Replaeo defective control relays 25.3 10and field control devices.
Replace defective components 30.4 10for Instrumentation.
40 kcalAkg 119,770TOtAL 2 2,942.4 1,2 0 clinker
6 kWh/t 73,910clinker b/
REMM: * These savings do not take Into considoration the expecred production Increase towards nominalcapacity and higher utilization.
O/ To be Installed by the plant maintenance personnel.b/ Condition for saving as per sumary.

- 46 -
Proposal for Long Term Investments
2.90 The proposals for long term investments listed in Table 2.3would result in further savings in energy consumption. They would also,considerably increase the production capacity of the kiln plant and wouldaim at improving the production process. In addition they wouldcontribute to better utilization of the equipment and infrastructure ofthe entire plant. A better utilization of crushers, raw mills, cementmills, packing plant and auxiliary equipment would contribute to reducingthe specific power consumption. The increase in the capacity of the kilnsystem of the Tartous cement plant by approximately 230,000 tpa clinkerper production line, with a capital investment of approximately US$ 10.37million would result in an investment cost of only US$ 44.1 per annualton of the additional clinker produced. The investment costs shown inTable 2.3 include the costs for mechanical and electrical equipmentc.i.f. plant site, civil works and structural steel works, erection andcommissioning of the equipment but not customs and taxes for equipmentand personnel imposed by the Syrian authorities. Further savings in fueloil consumption of 40 kcal/ kg cli (4.2 kg fuel oil/t clinker) and 12.3kWh/t cement, respectively, will be achieved.
2.91 The following production figures were used to calculate thesavings:
Raw meal 1,023,000 tpaClinker 620,000 tpa andCement 647,900 tpa.
Considering its size, the rotary kiln of the Tartous cement plant couldproduce approximately 4000 tpd when equipped with a modified kiln driveand a properly dimensioned suspension preheater and precalciner system.However, additional equipment on the raw material side (new raw mills andcrushers) and on the cement side (new cement mills) is required and theclinker coolers require considerable modifications, but thesemodifications are not recommended due to the high investment costinvolved. Moreover, such modifications require a long plant downtime.
2.92 The modifications proposed to increase the kiln capacity toapproximately 2000 tpd are such that they would keep plant downtimewithin an acceptable range.
2.93 Additional grinding capacity will be achieved by replacing thehammer crusher in front of the raw mill with a roller press and byinstalling a roller press in front of the cement mill. The additionalcapacity of the crushed limestone and basalt can be achieved by extendingthe operating hours for the respective crushing plants.
2.94 The installation of prehomogenizing storage for limestone andbasalt is considered essential to improve the operation of the kilnsystem and the quality of the product. One prehomogenizing storage forlimestone is foreseen to serve two production lines whereas one storagefor basalt is foreseen to serve all four production lines.

- 47 -
Table 2.3: SUMMARY OF PROJECT PROPOSALS AND RECOMMENDATIONSPLANT: TARTOUS CEMENT CO. - LONG-TERM INVESTMENTS
Capital Cost Operating Cost Potential Savings EffectiveProject Proposal Foreign Local Foreign Local Per Annum Lifetime
USSIOOO LSOOO USS LS USS Years
LONG TERM INVESTMENTSExpected production:Clinker 620,000 tpaRaw meal 1,023,000 tpaCement 647,900 tpa
Installation of a prehomoge- 2,620.0 2,550 a/ 20nizing storage for limestone (4 x 5.240) (I x 5,100)2 x 30,000 t (1 storage for 2production lines) includingmodification of transport system.
Installation of a prehomoge- 902.5 875 a/ 20nizing storage for basalt 2 x (4 x 3,610) ( x 3.500)15,000 t (1 storage for 4 pro-duction lines) including modi-fication of transport system.
Replacement of hammercrusher of 1,100.0 800 4 kWh/t 130,940 20raw mill with a roller press(170 tph) to Increase the capa-city by approx. 30 S.
Replacement of preheater system 3,300 7,100 40 kcal Ag 192,890 20by a modern 4 stage-preheater systemand modification of kiln drive.
Installation of additionalcooling fans at clinker coolerto increase the capacity to2,000 tpd clinker.
Installation of a roller press 1350 1,000 6 kWh/t 124,400 20In front of the cement mill(150 tph) to Increase the ca-pacity by approx. 25 S.
40 kcal/kg 192,890clinker
Total 9,272.5 12,325 4 kWh/t RM 130,9406 kWh/t 124,400
REMARKS: The main purpose of these modifications Is to increase the capacity of the cement plant.Further minor energy savings more than compensate the required Investment cost. The operationcost remailn In the range achieved by the modifications as per paras. 2.84 and 2.87.
a/ Condition for savings as per the fourth Item, replacement of preheater system.

- 48 -
2.95 The following comments relate to the proposed modifications forthe electrical equipment:
(a) the power distribution system should be modified in such a wayas to eliminate connections between different departments thatlead to unwanted stoppage of more than the affected department;
(b) the control and instrumentation system should be modernized tofacilitate plant operation;
(c) an improved system should automatically start and stop motorsaccording to process requirements. Process failures andwarnings should be displayed in detail in the central controlroom, enabling the operator to take appropriate measures andthus reduce equipment downtime; and
(d) the capacitors should be checked to verify that they are ingood condition and large enough to compensate for the variablepower supply. Faulty equipment should be replaced.

- 49 -
III. ARABIAN CEMENT COMPANY SHEIKIH SAID PLANT)
General
3.1 The general comments on the Tartous plant made in paragraph 2.1are also valid for the Arabian Cement Company's Sheikh Said cementplant. Investigations at the plant showed that the actual kiln capacityis slightly below the rated capacity, but numerous other factors alsonegatively influence the efficiency of the plant. The total productionfigures (yearly average) demonstrate that frequent stoppages reduceutilization of the equipment. Energy savings can be achieved by means ofoperational improvements and small investments as specified in paragraphs3.69 and 3.72. The resulting longer continuous operation of the plantwill help improve productivity and reduce operating costs.
3.2 It is noticeable that in this plant well maintained, clean andwell-operated equipment (crushing plants for limestone and basalt) existsside by side with poorly maintained and operated equipment (raw milldepartment). The design of the storage for limestone and basaltcontributes to the operational problems as it does not adequately takeinto consideration the physical properties of the raw material during thewet season. Changes in material handling and operatirn will help reducesuch problems. The results of the investigatio., ^.'J comments on theproduction process and its operation are gi"s. in the followingparagraphs.
3.3 The documentation (system layouts, flow charts, motor lists,operation manuals, etc.) available at the plant is a model of goodorganization as it is well-filed and accessible. However, it needs to beupdated regularly so that management can compare the actual status of theplant with the as-built documentation. In the meeting held with plantstaff at the conclusion of the investigations, the Consultantsrecommended a number of mechanical and electrical measures that should beimplemented immediately in order to improve plant operation andmaintenance.
Production Figures
3.4 The production figures of the Sheikh Said cement plant arecompiled in Volume I of Part II. The reasons for the low efficiency ofthis cement plant, which in 1986 was running at only 631 of its ratedcapacity, are indicated in the following sections. During the mission'sstudy the capacity of the kiln plant was only slighly below the ratedcapacity. This indicates that numerous kiln stoppages are the reasonsfor this low efficiency.
3.5 The expected savings in fuel consumption are approximately 61,considerably lower than the savings forecast for the Tartous cementplant. The actual specific power consumption is higher than the designedspecific power consumption. Considerable savings of up to 34.4 kWh/t

- 50 -
cemenL are expected through implementation of the measures proposed inparagraphs 3.69, 3.72 and 3.76. Further savings may be achieved inauxiliary departments (fuel oil preparation, compressed air system, watersupply). The specific consumption of gasoline, which is mainly used fortransport of personnel, will be reduced in proportion to the increase inproduction. The assessment of the other specific consumption figuresindicated results similar to those discussed in paragraph 2.10 for theTartous cement plant.
3.6 The specific consumption of paper bags (50 kg bags) is veryhigh. The reasons for the high loss of 9 Z should be investigated.
3.7 The specific consumption figures for refractories in 1985 and1986 are very high. Mechanical deficiencies of the kiln and operationaldeficiencies are the reasons for this high figure. The elimination ofsuch deficiencies is urgently required. Implementation of the measuresproposed in paragraphs 3.69, 3.72 and 3.76 and the elimination of theabove deficiencies will permit a refractory consumption of less than 1kg/t cement.
Raw Material and Raw Material Preparation
3.8 At the Sheikh Said plant, the quarries are ideally located nextto the plant. There is a layer of limestone on top of the basalt.Results from random test holes indicate that the chemical properties ofthe basalt get worse as the quarry progresses. A detailed quarry designto enable plant managers to undertake the measures needed to extend thelifetime of the deposit is highly recommended.
3.9 The plant has raw material humidity problems during the rainyseason. However, they should have no impact on the production capacityof the plant (see below).
Quarry operation (limestone and basalt):
Consumption of explosivesS dynamite 18-20 g/t, AN. 80 g/tNumber of drilling machines 6Number of hydrauli excavators(capacity 2.5 m' 8 (2 standby)
Number of dumpers(capacity 25-30 t) 24 (10 standby)
3.10 The dumpers unload directly onto the apron feeders (two speeddrives) of the crushing plant. Four identical single-shaft hammercrushers (1,800 x 1,800 mm diameter) are installed in one plant. Eachcrusher is driven by a 400 kW, 6 kV motor via a flat belt 46 cm wide.Power consumption varies between 30-35A. The nominal output forlimestone is specified with 350-400 t/h (grain size 50 mm). The plantoutput of basalt is currently 250 t/h, and for limestone it is 300 t/h.The target size distribution is 10% over 50 mm; however, due to theirmaterial properties the distribution of basalt over 50 mm is higher than10%, while the limestone distribution is lower.

- 51 -
3.11 Uniform adjustment of the grates on all crushers providesflexibility in operation and in case of a breakdown. Limestone is arather soft, brittle material. It is crushed to a fine, sandy, dustyproduct with only a few coarse fractions. Basalt on the contrary is hardand crushed to gravel only, with many large granules and practically nofine component. The mix of these two components may not be optimal forthe raw mill, resulting in overgrinding of the limestone. Since crushingis cheaper than grinding (less energy), individual adjustment of thecrushers for the two raw material components should be studied.
3.12 The crushed limestone is then stored stepwise in a raw material hall(2 stockpiles) and emptied again by a side reclaimer. Basalt is storedin a longitudinal hall (1 pile only) with bottom extraction by a wheelreclaimer. Due to its coarse fractions and high humidity, reclaimingproblems often occur and its useful life is reduced to 50 Z of normal.This leads to the need for daily quarrying of basalt. Conversion toactive reclaiming should receive high priority. Under thesecircumstances the the local management are considering installing abasalt dryer. This idea is commented on below.
3.13 There are almost no dust problems in the raw material preparationdue to the humidity of the material; the dust collection equipment to theraw material silos and to the raw mill could even be switched off. Dustis only created when material is discharged from & height in the storagehalls, since the discharge height of the stacking conveyor is notadjustable. As the quarry is extended, transport by dumpers may becomemore and more expensive and energy consumption will increase.
Raw Material Drying (Basalt)
3.14 The following figures on the moisture content of the raw materialswere obtained for 1986:

- 52 -
Table 3.1. RAW MATERIAL MOISTURE LEVELS AT THE SHEIKH SAID PLANT, 1986.
Limestone Basalt Send Mix
Average compositionof raw mix (%) 74.5 24.0 1.5 100
Humidity CS):January 10.7 9.5 3.4 10.3February 11.3 10.7 3.3 11.1March 10.6 10.4 3.0 10.5AprIl 10.1 9.7 2.5 9.9May 9.0 8.9 2.3 8.9June 9.3 8.6 1.9 9.0July 8.9 7.4 1.5 8.6August 9.2 8.4 1.4 8.9September 9.1 8.0 1.5 8.6October 9.6 8.7 2.7 9.8November 10.7 9.6 2.9 10.3December 10.8 9.6 3.8 10.5
Yearly average 10.0 9.1 2.4 9.8
It is stated elsewhere in this report that moisture levels up to 8Z canbe dried in the raw mill with kiln exhaust gases without problems.Higher values require additional hot gas from the auxiliary furnace, anadequate kiln/mill system design, and adequate operating conditions.More detailed information regarding raw material drying is given in therespective paragraphs for raw mill and kiln.
Raw Meal Preparation
3.15 Summary of Test Results. On June 16, 1987, a test was carriedout on the raw material grinding system to assess the items related toenergy consumption. The main test results are summarized below:
Test Duration 8 h
Raw Mix Feed- limestone 64.2 t/h- basalt 19.5 t/h- sand 1.4 t/h,- total 84.9 t/h, 9.0 Z H20- raw meal production 78.0 t/h, 1.0 Z H20
at 2.9 X R 0.20mm17.0 X R 0.09 mm
Mill speed 15.7 rpmFilling degree (calculated) 25.51

- 53 -
Temperature / 02-Content
- gas crusher inlet 185°C / 13.0 % 02- gas crusher outlet 420C / 17.5 % 02- gas mill inlet 290*C / 7.4 X 02- gas mill outlet 580C /11.5 02
Pressure
Most of the time overpressure prevails at the mill inlet (mill fanoverloaded), while underpressure at the crusher inlet allows a highamount of false air to be drawn through the auxiliary furnace,which is not airtight.
Particle Size Distribution
The results of the sieve analysis done by the plant laboratory areshown in Annex 5, page 2: Grain Size Distribution.
Power Consumption
The figures below were calculated from the amperage meter readingsor, when necessary, estimated.
Mill drive 2,300 kW 29.5 kWh/tCrusher drive 142 kW 1.8 kWh/tMill fan 195 kW 2.5 kWh/tCrusher fan 217 kW 2.8 kWh/tSeparator (estimated) 70 kW 0.9 kWh/tSeparator fan 304 kW 3.9 kWh/tBucket elevator (estimated 20 kW 0.3 kWh/t
Total 3,248 kW 41.7 kWh/t
For the whole raw meal preparation system, from the raw materialdosing feeders to the mixing silos, including the electrostaticprecipitator, the absorbed power calculated from the kWh-meter was3,717 kW, corresponding to 47.7 kWh/t raw meal.
Raw Meal Production
3.16 With a production of 78 t/h at 17 X R 0.09 mm the mill outputis 40 Z below the nominal capacity of 130 t/h at 12-16% R 0.09 mm.Therefore, the mill capacity is a serious bottleneck for the clinkerproduction (the kiln could produce 1,800 t/d cli). The meal is rathercoarse and the high residue of 2.9% on 0.2 mm may be detrimental to thekiln operation (the R 0.2 mm should not exceed 2% for a dry processkiln). Drying of the raw material is a critical point, as the raw mixcan contain up to 12% moisture. Drying will be treated separately inparagraph 3.24.

- 54 -
Power Consumption
3.17 A power consumption of 29.5 kWh/t for the mill alone and 41.7kWh/t for the whole mill system is extremely high for raw materialgrinding. Without performing a grindability test on a representativesample of the raw material mixture it is impossible to predict the lowestachievable power consumption of the mill system. The installed milldrive power of 3200 kW for a nominal capacity of 130 t/h (24.6 kWh/t)indicates poor grindability. However, a saving of 15-20X on the presentpower consumption appears possible, i.e., the saving potential is in therange of 6-8 kWh/t raw meal.
Mechanical Condition and Operation
3.18 Comments are made in the following paragraphs on items thatdirectly or indirectly influence energy consumption.
3.19 General Aspects. The grinding plant is particularly dirty,with numerous material leaks, and heaps of material lying around. Thismakes access to the machines difficult. Due to overpressure in thesystem, the atmosphere in the mill building is very dusty.
3.20 Hammer Crusher. The crusher acts as the first compartment ofthe mill system and, as such, its performance is important to thegrinding process in the tube mill. The crusher rotor is severelyunbalanced, maybe due to irregular wear on the hammers. The double flapgate at the material feed is not sealed properly and the one at thecrusher discharge is blocked in an open position. This explains theextremely high amount of false air (130 X) leaking into the crusher,reducing the drying capacity of the system considerably.
The coarse material separated in the crusher cyclones is fed to the millinstead of to the mill air separator. However, inspection revealed thatthese cyclones are clogged so that the material is carried in the gasstream to the electrosta.ic precipitator. Clogging of the cyclone is notsurprising considering the low gas outlet temperature of only 42'C.
3.21 Raw Mill. The 25.5X degree of fill results from a calculationbased on a ball charge of 140 t indicated in the questionnaire used inPhase I of this study. The ball charge of 220 t mentioned by the plantstaff would -lead to a 40X degree of fill and an absorbed power of about2800 kW, which is impossible.
The intermediate diaphragm originally installed has been removed and now,without a separator screen, the ball charge is completely mixed up. Thelifter lining is possibly worn out and it is already planned to replaceit with a separator screen (as for raw mill No. 2). The more than 40%false air sucked into the system is one reason for the very low gasoutlet temperature of 58'C (danger of clogging in the mill dust collec-tion cyclone).

- 55 -
3.22 Air Separator. The circulating load of 1.1 (see Annex 5, page 3:Separator Performance) in the mill system is extremely low (normally2-2.5), i.e., 90X of the separator feed goes into the final product. Thereason is that the very fine separator feed (24% R 0.09 mm instead of50-60 %) hinders efficient operation. Further, the high residue of 2.91on the 0.2 mm sieve indicates inadequate separator adjustment. The rotorspeed control is out of order.
3.23 Mill Control. Not all readings on the control panel arereliable. Due to lack of paper and ink, not a single recorder isoperating, so that the tendencies of the various operating parameterscannot be detected. Under these circumstances optimum control of themill is impossible.
Raw Material Drying
3.24 In winter the raw material moisture content can reach 121 andeven in summer it does not fall below 7%. A 4-stage suspension preheaterkiln running under good operating conditions can dry material with amoisture content of approximately 81 in the raw mill by using thepreheater exhaust gases, provided all gases go through the mill systemand the mill is operating for at least 80% of the kiln operating time.Of course, this requires an adequate design of the mill system and aminimum amount of false air infiltration.
3.25 The latter condition does not obtain. From 320-340'C at thepreheater exit, the temperature falls to 290C at the mill inlet and even185C at the crusher inlet, mainly due to false air infiltration (heatlosses in the gas duct are covered by the kiln exhaust gas fan power).False air infiltration drastically reduces the drying capacity, parti-cularly in the crusher where most of the moisture should be evaporated.
3.26 But even without false air infiltration, the kiln exhaust gaseswould be insufficient to dry material with a moisture content of 121.This requires either a higher quantity of gas than is produced by thekiln or a much higher temperature at the crusher and the mill inlet,which can only be delivered by an auxiliary furnace.
3.27 This auxiliary furnace exists (capacity 20 Ccal/h) but is notfunctioning. It is half full of dust and the connecting duct to the millsystem is not airtight. In order to solve the raw material dryingproblem, the auxiliary furnace should be put back into operation, todeliver hot gases (more than 400C) to the crusher. Separate predryingof the raw materials, e.g., by a rotary dryer for basalt, is notnecessary and is not recommended.
Clinker Burning Process
3.28 Summary of Test Results. On June 16, 1987, a test was carriedout on the kiln system to assess the items related to energy consump-tion. The main test results are sunmarized below:

- 56 -
Test Duration 8 h (7.00 h - 15.00 h)
Kiln feed quantity 100 t/h during 7 h 52' *
Clinker produced a) 427.3 t (weigh belt)b) 476.8 t (kiln feed/cli ratio = 1.65)
* During the test the kiln was stopped twice, for a total of 8minutes.
Fuel consumed 45.53 m3 at 110 °C = 41.2 t (0.905 t/m3)
Preheater exhaust gases 93,300 Nm3/h (measured)320 °C / -380 mm H 02.9 X 02 I 0.05 Z
Transition chamber 960 °C / 1.3 X 02
Cooling air 127,000 Nm3/h
Primary air 6,200 Nm3/h
Cooler exhaust air 76,000 Nm3/h, 330 °C
Clinker temperature 110 °C
Kiln radiation losses 3.35 Gcal/h (3,900 kW)
Power Consumption
Kiln exhaust gas fan 736 kW
Cooler exhaust air fan 235 kW
For the whole burning process (outlet storage silos to inletclinker silos) the absorbed power calculated from the kWh-meter was1,584 kW.
Clinker Production
3.29 There was a large discrepancy between the reading of 427.4 t onthe counter of the recently installed Hasler clinker-weighbelt and thecalculated production from the kiln feed (476.8 t). At first sight thefigure obtained from the weighbelt seems to be more reliable than the onefrom the kiln feed. But other operating data, particularly the preheaterexhaust gas quantity, 02 content and temperature, show that theproduction calculated from the kiln feed is more realistic. Therefore,further comments on the kiln operation will be based on a clinkerproduction of 476.8 t, i.e., 59.6 t/h or 1,430 t/d. Both the kiln feederand the clinker weighbelt should be recalibrated to remove anyuncertainty.

- 57 -
Heat Consumption
3.30 Assuming that the fuel counter reading was correct and based ona lower calorific value of 9600 kcal/kg fuel, the specific kiln heat con-sumption amounts to 830 kcal/kg cli (3475 kJ/kg cli). Considering thegeneral kiln operation, this result appears to be realistic. Thecomparison with the yearly average heat consumption of 850-900 kcal/kgcli (3560 - 3770 kJ/kg cli) stated during phase I of this study confirmsthe test result. But according to the plant records, the yearly averagefuel consumption in 1986 was 120.9 kg/t cli for the total plant and 104.7kg/t cli for the kilns alone. This corresponds to 1005 kcal/kg cli (4208kJ/kg cli). Such a big difference between the test result and the yearlyaverage can only be explained by a very high number of kiln stops duringthe year. Provided it is in good mechanical condition, such a kilnsystem should not consume more than 780-800 kcal/kg cli (3265-3350 kJ/kgcli) under stable operating conditions. The reasons for the excessiveheat consumption are discussed below.
3.31 Oversizing of Equipment. Generally speaking the kiln system isoversized. It could produce up to 1800 t/d or even more with only minormodifications (such as kiln fan, kiln drive, cooler fans). The equipmentis therefore not running at maximum efficiency when producing only 1400t/d, and the specific heat losses are consequently on the high side.
3.32 Crate Cooler. The grate cooler was modified in 1985 byClaudius Peters AC and has new grates, new hydraulic drives and 3 of the5 fans are new. Its design therefore includes the latest developmentswith respect to grate shape and aeration. According to the plant staff,its operation has greatly improved since these modifications were made.However, the cooler was rebuilt for a capacity of 2000 t/d and is stilltoo big for a clinker production of 1400 t/d. It shows a specific loadof only 29 t/m d (total grate area). The cooler is operated with anundergrate pressure in Chamber 1 of 280-340mm H20, corresponding to amedium clinker bed depth, and with a low cooling air quantity of about2.1 Nm3/kg cli. Heat recovery is not optimum and the cooler efficiencywas around 60% during the test. With a secondary air quantity ofapproximately 0.85 Nm /kg cli the recovery efficiency should be over65Z. Only the grate speed is controlled automatically. No other controlcircuit is in operation. The cooling air quantity and the kiln hoodpressure are adjusted manually. A well-designed automatic cooler controlsystem would allow a more efficient cooler operation.
3.33 Kiln Firing System. The two-channel burner is not verysophisticated and does not allow an optimum flame adjustment. A blackplume is sometimes visible at the burner tip, which is not normal forfuel firing. The primary air is approximately 12% of the stoechiometriccombustion air. To ensure low heat consumption a value below 10% shouldbe aimed at. Furthermore 4X of the combustion air is sucked into thekiln hood in the form of false air at the gap around the burner pipe.The fuel preparation plant on the burner platform and the kiln firing

- 58 -
equipment are covered by a thick layer of dirt, and most of the pressuregauges and thermometers are out of order.
3.34 Rotary Kiln. With specific loads of 101 t/m2 d and 1.35 t/m3 dat 1,400 t/d the rotary kiln is clearly underloaded. The kiln oversizingresults in increased specific radiation and convection losses. Duringthe test these losses amounted to 56 kcal/kg cli (234 kJ/kg cli) despitethe relatively low kiln shell temperature profile. A total refractorylining consumption of 1,800 g/t cli (1986) is considered as very high fora dry process kiln of this size. Possible explanations for the poorlining lifetime are the many short kiln stops and the practice of keepinga strong flame (1,000-1,500 1/h fuel) inside the kiln during the stops inorder to maintain the kiln system in operating condition.
While the kiln outlet seal appears to be in an acceptable condition, themechanical kiln inlet seal does not work properly, because the sealingplates are blocked in an open position by hardened meal. Therefore,false air is entering at the inlet seal. The kiln tyres and rollers arein very bad shape (incurved contact surface, strong pitting), probablydue to a poor alignment and the absence of axial kiln motion (no kilnthrust device). As the situatio.. will certainly deteriorate in future,corrective measures should be taken as soon as possible to avoid a majorbreakdown.
3.35 Kiln Drive. The kiln is equipped with two drives designed asvariable speed drives. However, only one of them is operating but atconstant speed. For a proper kiln operation the kiln should be providedwith a variable speed drive (preferably DC-drive) to cope with thechanging operating conditions.
3.36 Excess Air and False Air Infiltration. A gas analyzer isinstalled at the kiln inlet but it gave a totally wrong reading: theanalyzer was sucking in pure air from the probe instead of kiln gases,but the analyzer reading stayed constant at 6% O2e In reality,measurements taken with a portable analyzer showed that the oxygencontent in the transition chamber is in the range of 1-2 X, and certainlyless at the kiln inlet, due to false air entering at the kiln seal and atthe kiln inlet housing. At the preheater exit another gas analyzer isinstalled which indicated a nearly constant value of 2.8 X °2 during thetest, probably due to a too-high damping of the signal. This low levelwas confirmed by the portable analyzer, which indicated variationsbetween 2.5% and 3.3 X 02 with an average of 2.9 Z 0°2
During the test the excess air was therefore kept to a minimum resultingin low exhaust gas quantity and temperature with an acceptableCO-level. On the previous day, the kiln was operated with 1 Z 02 more inthe preheater exhaust gases. The small 02 increase of only 1.6 X overthe preheater (including kiln feed transport air) proves its airtightnessand, apart from the kiln inlet area, false air infiltration is not aproblem.

- 59 -
3.37 Preheater. The temperature profile in the preheater is low fora 4-stage preheater kiln with a heat consumption of 830 kcal/kg cli. Thereason for this is the low gas temperature at the kiln inlet (below 1,000°C) resulting from oversizing of the rotary kiln. From plant experiencethe kiln feed/clinker factor is around 1.65, i.e. the dust collectionefficiency of the top cyclone stage is acceptable.
3.38 Kiln Feed Quality. During the test, samples of the kiln feedwere taken and analyzed with the XRF equipment. Over a 24 hour periodthe standard deviation of the main quality control parameters was withinthe tolerable range for a smooth kiln operation.
3.39 Kiln Control. Many of the important instruments are either outof order or give wrong reading. There is no paper and no ink in anyrecorder, so that it is impossible for the operator to follow the trendof the kiln condition. Not all cooler control circuits are in opera-tion. The kiln spee.td, an important control parameter, can no longer beadjusted.
Power Consumption
3.40 Based on a clinker production of 59.6 t/h the specific powerconsumption for the whole burning process amounts to 27 kWh/t cli. Thisvalue is too high for this type of kiln system. Due to the absence ofkWh-meters, the power consumption of the main machines was calculatedfrom the amperage meter readings. Comments on the results are givenbelow.
3.41 Kiln Exhaust Gas Fan. At 1,400 t/d the kiln exhaust gas fan isoperating at about 2/3 of its design capacity. A damper at constant fanspeed controls exhaust gas flow. With respect to power consumption, thisis the worst method. This explains the very high power consumption of12.3 kWh/t cli measured during the test, instead of the approximately 5-6kWh/t cli that could be achieved with a well-designed fan/drive systemunder the same kiln operating conditions.
3.42 Cooler Fans. The power absorbed by the cooler fans could notbe measured. Four of the five fans are equipped with an inlet vane flowcontrol, which is an acceptable solution. Variable speed drives wouldfurther reduce power consumption.
3.43 Cooler Exhaust Air Fan. The cooler exhaust air fan is alsoprovided with flow control by damper. The power consumption of 3.9 kWh/tcli is extremely high considering the low pressure drop of 50 mm H 0across the multicyclone as indicated in the log sheets. It could Sereduced by using a more efficient fan/drive system.
Waste Heat Recovery
3.44 A radiation absorber has just been installed above thesintering zone of kiln No. 2. The recovered heat will be used to heat

- 60 -
water for sanitary uses. Even if the absorber covers only one half ofthe kiln circumference, the shell temperature will increase by some tendegrees. As no radiation pyrometer is installed to monitor the kilnshell temperature, great care has to be taken in case of localizedoverheating.
Cement Grinding
3.45 Summary of Test Results. On June 17, 1987, a test was carriedout on the cement grinding system to assess the items related to energyconsumption. The main test results are summarized below:
Test duration 6.5 h
Mill feed
- clinker 86.6 t/h- gypsum 4.6 t/h- pozzolana 10.2 t/h
Cement production 100.6 t/h at 2,130 cm2/gaccording to Blaine (?)
Mill speed 15.7 rpm
Filling degree (calculated) comp. I 32 %comp. II 29 X
Air flow through the mill 18,700 Nm3/h
Water injection no
Temperature
- mill feed ca. 70 °C- cement ca. 105 ec- air mill outlet 103 eC
Pressure
- mill outlet - 110 mm H20
Particle Size Distribution
The results of the sieve analysis done by the plant laboratory aregiven in Annex 5, page 9: Grain Size Distribution. The indicatedBlaine values, particularly that of the final product, are nottypical compared with the result of the sieve analysis. A Blainevalue in the range of 2,800 - 2,900 would be more characteristic ofthe product fineness.

- 61 -
All considerations made below are based on the assumption that thecement produced during the test met the usual quality requirements.
Power Consumption
The figures below were either calculated from the amperage meterreadings or estimated when necessary.
Mill drive 2 x 1,425 kW 28.3 kWh/tMill fan 140 kW 1.4 kWh/tSeparator (estimated) 75 kW 0.7 kWh/tSeparator fan 202 kW 2.0 kWh/tBucket elevator (estimated) 40 kW 0.4 kWh/tTotal 3,307 kW 32.8 kWh/t
The kWh-meter for the total cement grinding plant was not inoperation during the test. But the plant production records show apower consumption for the cement mills of 30.8 kWh/t in 1986 and37.0 kWh/t up to May 1987, which confirm the results found duringthe test.
Cement Production
3.46 The production of 101.4 t/h at about 2,800 Blaine achievedduring the test is clearly above the nominal capacity of 80 t/h at 2,800Blaine. One reason for the higher production is that 10 X pozzolana wasmixed into the cement.
Power Consumption
3.47 The specific power consumption of 28.3 kWh/t for the mill aloneand 32.8 kWh/t for the whole system would be normal for an OPC at 2,800Blaine. However, for cement containing 10 Z pozzolana it is on the highside. A power consumption of 26 kWh/t for the mill and 30 kWh/t for thewhole mill system should be achievable. The saving potential istherefore limited to about 2 kWh/t.
Mechanical Condition and Operation
3.48 Items that directly or indirectly influence energy consumptionare commented on in the following paragraphs.
3.49 General Aspects. Compared with other departments of the plant thecement grinding area is very clean and leaves a good impression.
3.50 Cement Mill. The first compartment is rather long (39 Zinstead of normally 30-35 U). The result of the longitudinal sievingtest (see Annex 5, page 10: Mill Performance Test) shows that at SamplingPoint No. 1 the material is already fine enough to be discharged to thesecond compartment. Very little grinding is performed in the remainingpart of the first compartment. A ball charge of 70 t corresponds to a

- 62 -
degree of fill of 32 Z, at the upper limit of the normal range. Thelifter lining is considerably worn and some plates are cracked. Theintermediate diaphragm is half choked. Some slots have an opening of upto 16 mm. Several slot plates and blind plates are cracked and bolts aremissing.
The ball charge of 100 t in the second compartment corresponds to a deg-ree of fill of 29 Z, which is acceptable. However, the ball charge com-position is not correct; there are balls of 90, 80 and 70 mm in diameter(probably they once came through the broken plates of the intermediatediaphragm) but no small balls of 0 20 mm. The mill discharge product isconsequently too coarse (1,545 Blaine instead of about 2,000). There isno separator screen installed in this compartment. The dischargediaphragm is 75% clogged. The mill ventilation of 18,700 Nm-/hcorresponds to an air velocity of 0.9 m/s inside the mill. A higherventilation is not needed to evacuate the grinding heat due to theevaporation of the moisture content in the pozzolana (ca. 10 Z H20).
3.51 Air Separator. As mentioned before, the mill discharge productis too coarse. This is the main reason for the high circulating load of2.3 in the mill system (see Annex 5, page 11: Separator Performance). Anormal value would be around 2. Further, the separation efficiency isvery poor, i.e. the separator operating parameters are not adjustedcorrectly. The speed control of the separator rotor, the most importantcontrol parameter, is out of order.
3.52 Mill Control. The instrumentation and control equipment ispartly out of order. For instance, the acoustic sensor is not adjustedcorrectly and the mill feed control is not in operation (danger ofrunning the mill empty).
Auxiliaries
3.53 Water. Water is available from 5 wells belonging to the plantwith a capacity of 105-110 m3/h. In 1986 the factory commissioned a newwater treatment plant (Na Cl-Ion exchanger). A number of pumps (powerdemand 7.5 - 45 kW) are installed for the various systems. The coolingwater for the raw mill system is not recovered but discharged to thenearby wet process plant (Al Chahbah).
3.54 All boiler water has to be constantly prepared and replacedsince the condensate return has been interrupted for quite some time.This procedure is fuel- and electricity-consuming.
3.55 Steam. The boilerhouse is equ pped with four units of 4 t/hsteam at a nominal pressure of 15 kg/cm . An evaluation of the boilerplant is impossible since there are no fuel meters installed, and neitherof the two steam counters was working during the Consultants' visit.According to the specifications, the nominal efficiency should be 87 x

- 63 -
but based on information received (fuel 300 kg/h, 9,200 Kcal/kg) anefficiency of 82 % was calculated. There are various reasons for thereduced performance:
feed water temperature 60 - 70 °C onlyexhaust gas temperature 210 °C 2steam pressure 11.75 kg/cm
The low feed water temperature, due to the discharge of all condensate,is the most important factor. The reason for the condensate discharge iscontamination by fuel. The source was found in the kiln's tank heatingsystem; however, so far no attempt has been made to repair it. Theequivalent of fuel per ton of condensate (95 °C) has been calculated to8.3 kg (see paragraph 2.66) The kiln tank heating system is not includedin this figure. Large leaks have been observed for days in the raw milldepartment.
3.56 Compressed Air. The compressor house is equipped with at leasta dozen compressors with a capacity of 160 or 200 kW each. Some of thepressure gauges are still working; however, there is no volume counterinstalled and compressor characteristics were not available. Theperformance of the machines and their total corsumption can therefore notbe evaluated. The plant is heavily affected by dust emissions from theclinker production stack and the nearby raw mill department. The mainconsumers are:
kiln feedraw meat transport to siloshomogenizing silosraw meal and filter dust transports.
There is no doubt that this plant consumes more compressed air thannecessary. There are too many pneumatic material transports and thesystems are not airtight. This plant should make every effort to reducethe consumption of compres.-ad air since it is the most expensive form ofenergy.
Electrical Equipment
3.57 General. Evaluation of the questionnaire used in Phase I ofthe energy efficiency study showedt
(a) a rather high energy consumption (kWh/t);
(b) operating problems with drives and instrumentation; and
(c) a too-low power factor
The Consultants' investigation during Phase II of the energy efficiencystudy confirmed the above observations and revealed the details given inthe following paragraphs.

- 64 -
Power Distribution System
3.58 Power Measurement. Due to defective meters only partialmeasurements could be carried out. The power demand (kW) and energyconsumption (kWh) of the individual main consumers such as the 6 kVmotors and distribution transformers were estimated from the A-meterreadings. The cost for electrical energy is based on the followingtariffs:
night from 11 p.m. to 6 a.m. ( 7 h) 29 ps/kWhday from 6 a.m. to 6 p.m. (12 h) 33 ps/kWhevening from 6.p.m. to 11 p.m. ( 5 h) 54 ps/kWh
Total energy consumption from January to July 1986 was as follows:
night (7h) day (12 h) evening (5 h)
13,432t000 kWh 27,968,000 kWh 8,552,000 kWh
The specific energy consumption during the three tariff periods revealsthe following distribution: (100 % - daily average.)
92 % 112 % 82%
3.59 These figures show that energy cost could still be reduced byincreased production during night time. The following readings could betaken:
(a) Raw Meal Preparation. Comprising the material flow from theraw material dosing feeders to the mixing silos includingaeration of silos and electrostatic precipitator. Metering(kWh and kVarh) on 6 kV-panel No. 1, feeding the busbars ofSTD1. Calculation of the specific energy consumption (kWhtt)is carried out and commented in paragraph 3.17.
(b) Clinker Burning. Comprising the material flow from the mixingsilos outlet to the clinker silos. Metering (kWh) on 6KV-panel No. 1, feeding the busbars of STD-2. The kVarh- meterwas defective. Calculation of the specific energy consumption(kWh/t) is carried out and commented in paragraph 3.40.
(c) Cement Grinding. Comprising the material flow from the clinkerand gypsum dosing feeders to the cement silos. Metering on 6kV-panel No. 1, feeding the busbars of STD-3. The kWh-andkVarh-meters were defective. The specific energy consumption(kWh/t) is calculated from the A-meter readings and commentedin paragraph 3.47.
Voltage Fluctuations3.60 According to the information received on site, the voltagefluctuations are within acceptable tolerances. The three main 16 MVA,

- 65 -
66/6 kV transformers are equipped with on-load tap changers, but thevoltage regulation is manually operated only from the 66 kV control room.As long as the network conditions remain satisfactory, the installationof an automatic voltage regulator is not called for. However, new paperrolls should be installed in the 66/6 kV voltage recorder to obtainbetter information on the actual voltage fluctuations.
Power Factor Compensation
3.61 The contract covering the supply of electrical energy specifiesa minimum monthly average power factor of 0.85. The figures reached fromJanuary to July 1986 are between 0.78 and 0.82. Therefore, penalties hadto be paid for excessive consumption of reactive energy. A low powerfactor also increases heat losses and voltage drops in the power cablesand transformers. According to the information received on site, some ofthe 6 kV capacitors that are switched manually to the 6 kV busbars arenot functioning. Furthermore, the automatically controlled capacitorbanks for the compensation of the 380 V motors are defective. Allequipment should be checked to verify that it is of the correct size andin good condition and new capacitors should be installed whererequired. The defective askarel-filled (PCB) capacitors should bedisposed of with utmost care by specialists.
Drives
3.62 Constant speed motors up to 150 kW are 380 V squirrel cage orslipring motors depending on the starting torque requirements. Constantspeed motors above 150 kW are 6 kV slipring motors. The kiln drive wasinitially equipped with two 315 kW subsynchronous static convertercascades which never worked. During the commissioning period it wasfound that the installed power was too great. Since then only one motor,running as a constant speed slipring motor, has been in operation. Foroperational and energy saving reasons a DC- drive should be installed.The 315 kW cooler exhaust fan and the 1,000 kW kiln fan are equipped withconstant speed cotors and damper control. These drives should bereplaced with DC-motors.
3.63 DC-motors are installed for the air classifiers of the rawmills and the cement mills. They are all defective except for those onraw mill line 1 and were replaced with constant speed motors as ashort-term measure. For operational and energy saving reasons, newDC-drives should be installed. Special technical problems were noticedwith the starters for the 6 kV slipring motors. They were repaired onsite without sufficient spare parts, The starters for the two raw millsare in particularly bad shape and have to be replaced. The 6 kV- and 380V-motors also have technical problems due to unreliable protectionrelays. The setting should be checked and the defective relays replaced.

- 66 -
Motor Control
3.64 The control system is of a conventional design in 220 V, 50 Hzrelay technique. The raw mills and kilns for lines 1 and 2 arecontrolled from one central control room located near the burnerplatform. The control room for the cement mills is situated in the millbuilding. Technical problems in the control system mainly consist ofdefective components such as relays and field control devices.Maintenance of the control system must include a check of all transportand safety interlocks. Idle running of machines, as explained inparagraph 1.77, should be avoided.
Instrumentation
3.65 The instrumentation is of a conventional design withstandardised analog signals of 4-20 m A. As described in paragraph 1.83the main problem is the lack of maintenance and possibly also the lack ofspare parts. The number and range of equipment initially installed inthe control room, such as indicators, recorders and regulators, issufficient. Most of the recorders have no paper rolls, so the controlroom operator is not informed of the tendencies of the different processvalues over time.
3.66 The following control circuits in the raw mill and kiln sectionare manually controlled instead of being automatic:
raw mill total feedraw mill outlet temperaturedryer crusher outlet temperaturecooling tower inlet pressuresecondary air pressurefuel oil flowkiln hood pressure
3.67 The following control loops were on automatic control:
raw mill feederskiln feedclinker cooler control (new equipment CPAG)
3.68 The swivel-type kiln shell temperature scanner and thepyrometer for indicating the temperature of the burning zone were notfunctioning. Several instruments and recorders, e.g., the gas analyzer,gave wrong readings. All process measurements must be thoroughly andregularly checked and calibrated.
Proposal for Operational Improvements
3.69 The proposals for operational improvements are for thedepartments investigated (the raw mill, kiln and cement mill systems),which are the main consumers of energy in a cement plant. The

- 67 -
requirements for operational improvements for the Arabian Cement SheikhSaid plant are listed in Tables 3.2 and 3.3. The tables show thepotential savings in energy consumption viz. fuel oil (kcal/kg clinker)and power (kWh/t) as well as capital cost and operating cost (if any)related to these operational improvements. Normal maintenance executedby the plant's personnel as well as normal consumption of wear and spareparts are not considered as extra costs.
3.70 The potential savings are calculated on the following bases:
Annual raw meal production 722,700 tAnnual clinker production 438,000 tAnnual cement production 459,900 tFuel oil price 840 SE/tPower price 0.36 SE/tExchange rate Syrian pound to US Dollars 11.25
The total calculated savings from operational improvements amount to:
Fuel oil on clinker basis 15 kcal/kg or 1.6kg/tPower on cement basis 13.6 kWh/t
3.71 Further reductions in energy consumption are possible in otherproduction and auxiliary departments as mentioned in the precedingparagraphs and by avoiding equipment running idle. Energy costs can bereduced by improved production and energy management, taking the tariffstructure into account (running of equipment at low tariff periods).

- 68 -
Table 3.2: StiMARY OF PROJECT PROPOSALS AND RECOKEDAT OiSPLANT: ARABIAN CO. FOR CEIENT AND SUILDINS MATERIALS (SHE IKH SAID PLANT)
RAN MILL NO. 1
Capitol Cost Operating Cost Potential Savingis EffectiveProject Proposal Foreign Local Foreign Local Per Annum Lifetime
USs000 LS'OOO USS LS USS Years
OPERATIONAL IWhROVE,ENTSExpected production:Clinker 438,000 tpaRaw meal 722,700 tpaCement 459,900 tpe
All Itms mentioned hereinaftershould be Included In the normalmaintenance program
Reconditioning of raw mill system- Eliminato all folse air leakages- Eliminate all material leakages- Balance the crusher rotor, re-
place the worn hamers a/- Install a separator screen In 7 kWh/t 161,880
raw mill No. 1 (as for rawmill N1o. 2 a/ (approx. USS 162,000 FOB)
- Adapt tho ball charge a/- Check and repair all meoasurlng
equipment and recorders b/- Improve the operation of ti-
mill control system bl- Put the auxiliary furnace into
operation when the moisturecontent exceeds 8 S(Capacity Increase achievabledue to the above measures isdetermined by the raw materialgrindability. Nominal capacitymay be achievable).
Reconditioning of Kiln System- Clean the whole kiln firing plant- Check and reploc (where neces- 0.1 kwh/t 1,400
sary) the installed measuringInstruments of the firingsystem b/
- Adjust the firing parameters- Eliminate false air
leakages at:.Kiln hood (burner pipe, casing) 7 kcal/kg 23,840
0.3 klih/t 4,200. kiln inlet seal and housing 5 kel/kg 17,030
0.2 kUh/t 2.30
15 kcal/kg 51,090Total clinker
0.6 kWh/t 8,400cilnker
REMARKS: a. Nor al weer parts.b, Possibly some new Instruments and contro! components required (compre: small Investment
modficatlons (electrical).

- 69 -
Table 3.3: SUMMARY OF PROJECT PROPOSALS AND RECOMMENDATIONSPLANT: ARABIAN CO. FOR CEMENT AND BUILDING MATERIALS (SHEIKHi SAID PLANT)
CEMENT MILL 1
Capital Cost Operating Cost Potential Savings Effective
Project Proposal Foreign Local Foreign Local Per Annum Lifetime
USS'000 LS'000 USS LS USS Years
Reconditioning of Cement MillSystem
- Replace lining in Ist com-partment a/
-Install classifying lining in2nd compartment a/ (approx. USS 104,000 FOB)
-Possibly shorten 1st compartment
-Clean/replace the diaphragmplates (intermedlate + dis-charge) a/ 2 kWh/t 29,430
-Adapt the ball charge composition
-Check and repair all measuringequipment and recorders b/
-Put the mill control system Intooperation to avoid running themill while empty b/
Total 2 kWh/tcement 29,430
REMARKS: a. Normal wear partsb. Possibly some new Instruments and control components required (compare: small investment
modifications (electrical)

- 70 -
Proposed Modifications Requiring Small Investments
3.72 Modifications requiring small investments are proposed for thedepartments investigated (the raw mill, kiln and cement mill systems) andthe electrical equipment. Modifications for the Sheikh Said cement plant(Arabian) are listed in Table 3.4. The table shows the potential savingsin energy consumption (fuel and power) as well as the required capitaland operating costs (if any) related to these modifications. The tableindicates that modifications are foreseen only for the raw mill, the kilnsystem and the electrical equipment.
3.73 The following comments refer to the modifications for theelectrical equipment:
(a) In order to obtain reliable information on energy consumption,all installed kWh- and kVarhmeters should be checked andrepaired.
(b) To improve the power factor, the condition and appropriatesizing of all compensation equipment should be checked and newcapacitors for 6 kV and 380 V installed where required.
(c) The worn-out rotor starter for the raw mill motor should bereplaced.
(d) To improve protection of the motors, all relay settings shoulbe checked and defective equipment replaced.
(e) To save energy, the kiln and the kiln fan should be equippedwith DC-drives.
(f) New DC-drives should be installed for the air classifiers ofthe raw mills and cement mills.
(g) To improve the control system, all transport and safetyinterlocks should be checked and defectivt components such asrelays and field control devices, e.g. motion detectors, limitswitches, should be repaired or replaced.
(h) For new equipment, the main emphasis should be on a good,industrial type design, e.g. electronic proximity switches.
(i) To improve the cement manufacturing process all measurementcircuits should be checked and defective components such assensors, transmitters, regulators, etc., should be repaired orreplaced.
(j) A new and reliable type of recorder (less sensitive toenvironmental conditions) with sufficient consumables (paperrolls, etc.) should be installed.

- 71 -
3.74 The expected life of the newly installed and/or modifiedequipment and installations is estimated. The capital costs aredetermined on the basis of prices received from reputable equipmentmanufacturers (price basis September 1987). They include the cost fortransport to the site, civil and structural steel works, erection andcommissioning of the equipment but not customs and taxes, etc., forequipment and personnel imposed by the Syrian authorities.
3.75 Potential savings were calculated on the basis described inparagraph 3.70. However, the expected annual production is considered asfollows:
Raw meal 767,250 tpaClinker 465,000 tpaCement 488,250 tpa
These savings amount to 25 kcal/kg clinker (2.6 kg fuel oil/t clinker)and 8.5 kWh/t cement.

- 72 -
Table 3.4: SUiHARY OF PROJECT P20POSALS AND RECOHMENDATIOSPLANT: ARABIAN 00. FOR CEMENT AND BUILDING MATERIALS (SHEIKH SAID PLANT) - KILN 1
Capital Cost Operating Cost Potential Savings EffectiveProject Proposal Foreign Local Foreign Local Per Annum Lifetime
USS'Ooo LS'OOO USS LS USS Years
SMALL INVESTKENT MODIFICATIONSExpected productlon:Clinker 465,000 tpeRaw Meal 767,250 tpaCemnot 486,250 tpa
Replace Separator Drive/Raw Hill 33 a/ IS
Modification of Grate Cooler- Adapt cooler grate area and
design to actual kiln capacity 1,000 320 25 kcal/kg 90,410 1S(operation with thick clinker bed 0.9 kWh/t 13,390
- Put all control loops Intoroation
Replacement of Cooler Exhaust AirFan Drive- Install a DC-otor (300 kW) 132 b/ 2.0 kWh/t 29,760
Replacement of KIln Fan Drive- Install a OC-motor (1,000 kW) 302 6/ 6.0 kWh/t 89,280 15
RepIacement of KIln Drive 155 b/- Instail a new DC-motor (400 kV)
Replace variable speed driveof the soparator motor (cementmill) 35 15
Electrical Equlpment- Replace defectivo capacitors
for 6 kV and 360 V(stimated 1, C kVar). 46.5 20
- Install new rotor starterfor the raw mill motors(2 x 1,600 kV). 27.1 20
- Replace defective motorprotection relays (estimated100 relays). 3110 20
- Replace defective control relaysand field control devices. 77.4 10
- Replace defective cmponentsfor Instrumentation andInstall a now, reliable typeof recorder. 124.0 10
25 kcalAkg 90,410clinker
Total 1,963.0 320 8.9 kWh.t 132,430cilnker
IEMARKS: a. To be Installed by the plent's maintenance personrel.
b. Condition for savings as per summary list.

- 73 -
Proposal for Long-Term Investments
3.76 The proposals for long term investments shown in Table 3.5would result in further savings in energy consumption. Consequently, thehigher utilization of crushers, raw mills, cement mills, packing plantand auxiliary equipment would contribute to the reduction of specificpower consumption. The increase in the capacity of the kiln system ofthe Sheikh Said (Arabian) cement plant by approximately 133,000 tpaclinker per production line, with a capital investment of approximatelyUS$ 5.13 million, would result in an investment cost of only US$ 33.1 perannual ton of clinker additionally produced. The investment costs shownin Table 3.5 include the cost for mechanical and electrical equipmentc.i.f. plant site, civil and structural steel works, erection andcommissioning of the equipment but not customs and taxes for equipmentand personnel imposed by the Syrian authorities. Further fuel oilconsumption savings of 20 kcal/ kg cli (2.1 kg fuel oil/t clinker) andcement consumption savings of 12.3 kWh/t would be achieved.
3.77 The following production figures were used to calculate thesavings:
Raw meal 1,023,000 tpaClinker 620,000 tpaCement 651,000 tpa
3.78 Considering its size, the rotary kiln of the Sheikh Said(Arabian) cement plant could produce approximately 4,000 tpd whenequipped with a modified kiln drive and a properly dimensioned suspensionpreheater and precalciner system. However, additional equipment on theraw material side (new raw mills and crushers) and on the cement side(new cement mills) is required and the clinker coolers requireconsiderable modifications, but these modifications are not recommendeddue to the high investment cost involved. Moreover, such modificationsrequire a long plant downtime.
3.79 The modifications proposed to increase the kiln capacity toapproximately 2,000 tpd are such that they would keep plant downtimewithin an acceptable range.
3.80 Additional grinding capacity will be achieved by replacing thehammer crusher in front of the raw mill with a roller press and by in-stalling a roller press in front of the cement mill.
3.81 The additional capacity of the crushed limestone and basalt canbe achieved by extending the operating hours for the respective crushingplants. The installation of prehomogenizing storage for limestone andbasalt is not foreseen. However, the mode of operation of the existingstorage should be molified so that limestone and basalt can be premixedin the existing limestone storage. The pure limestone component would bestored in the existing basalt storage in order to improve materialhandling (reduced moisture content of the limestone/ basalt mixture).

- 74 -
Table 3.5: SUMMARY OF PROJECT PROPOSALS AND RECOMMENDATIONSPLANT: ARABIAN CO. FOR CEMENT AND BUILDING MATERIALS (SHEIK SAID PLANT)
Capital Cost Operating Cost Potential Savings EffectiveProject Proposal Foreign Local Foreign Local Per Annum Lifetime
USSOOO LS'OOO USS LS USS Years
LONG TERiM INVESTMENTS
Expected operation:Clinker 620,000 tpaRaw Meal 1,023,000 tpaCement 651.000 tpa
- Replacement of hammer crusher 1,100 800 4 kWh/t 130,940 20of raw ml 11 by a roller press(170 tph) to Increase the ca-pacity by approx. 30 %
- Replacement of preheater system 2,400 6,000 20 kcalAkg 96,440 20by a bigger modern 4 stage pre-heater system Including kilnexhaust gas fan to increase thecapacity to 2,000 tpd. clinker
- Installation of a roller press 950 800 6 kWh/t 125,000 20In front of the cement mill(100 tph) to increase the capa-city by approx. 25 %
20 kealkg 96,400clinker4 kWh/t RM 130,940
Total 4,450 7,600 6 kWh/t 125,000cement
REMARK The main purpose of these modifications is to increase the capacity of the cement plant.Further minor energy savings will more than compensate the required Investment cost. Theoperation costs remain in the range achieved by the modifications as per paras 3.69 and 3.70.
3.82 The proposed modifications for the electrical equipment are asfollows:
(a) the control and instrumentation system should be modernized toraise the productivity of the plant and reduce energy cost; and
(b) an improved system should automatically start and stop motorsaccording to the process requirements. Process failures andwarnings should be displayed in detail in the central controlroom, enabling the operator to take appropriate measures andthus reduce equipment downtime.

- 75 -
IV. ADRA CEKENT COMPANY
General
4.1 Investigations at this plant revealed that it has the highestenergy saving potential of the three plants visited. Lack of maintenance,resulting in inefficient plant operation and low productivity, wasobserved in most of the plant's departments. The Consultants' findingsand comments on the production process and the plant operations are givenin the following paragraphs.
4.2 The documentation (system layouts, flow charts, motor lists,operation manuals etc.) is poorly filed, making it hard to find therequired documents within a reasonable time. We strongly recommend thatthis situation be improved. The plant staff should be provided withwell-organized and updated documentation as a too! for maintaining theplant's equipment.
4.3 In the meeting held with plant staff at the conclusion of theinvestigations, recommendations were made on the mechanical andelectrical measures that should be implemented immediately in order toimprove plant operation and maintenance.
Production Figures
4.4 In 1986 the plant was running at 70 X of it, rated capacity.The reasons for this low efficiency are indicated in the followingsections. The tests carried out during this mission were of shortduration, only 4 hours for the raw material grinding plant, 6 hours forthe kiln system and 5.7 hours for the cement mill. It is obvious thatrepresentative results could not be obtained within such a short timeframe. Therefore, the savings are calculated on the basis of the yearlyaverage stated by the plant management. It was calculated that fuelconsumption can be reduced by at least 14.6 kg fuel oil/t cli and thevery high power consumption will be reduced by approximately 45 kWh/tcement by implementing the measures described in paragraphs 4.65, 4.66and 4.69.
4.5 Further energy savings can be achieved in the other productionand auxiliary departments (fuel oil preparation, compressed air) byintroducing similar measures. Specific consumption figures for gasoline,paper bags, refractories, etc. are not available. However, figuressimilar to those used in assessing the consumption figures for theTartous cement plant could be applied to the Adra cement plant as a roughindication.
Raw Material and Raw Material Preparation
4.6 The raw material properties and preparation were looked at withregard to energy consumption only. The quarries for limestone, marl and
- 76 -
basalt are located in the neighbourhood of the plant. Dry and brittlelimestone is fed by dumpers to the stationary double shaft hammer crusher(motor capacity 2 x 350 kW, power consumption 18-20 A) and reduced to 50mm grain size. The drives are designed for 23 V-belts. Four and 13 ofthem respectively were missing. A pile of rocks lying next to thecrushing plant indicates that the larger rocks cannot be crushed with thereduced number of V-belts installed. These big rocks require additionalefforts by second blasting.
4.7 The limestone is transported on two belt conveyors (total 1.5km) to a longitudinal storage hall. A bottom wheel reclaimer extracts thelimestone and various belt conveyors distribute the raw material to thesilos of Adra I and II, respectively. Marl is exploited in a quarry with6 benches. The material is soft, fine and humid. Its chemicalcomposition varies considerably and it is therefore quarried selectively.The various fractions are piled up layer by layer in the open andafterwards reclaimed in vertical manner by loaders. A certainhomogenizing effect is expected from this procedure. The marl crushingplant is fed by dumpers. It has two identical single-shaft hammercrushers (motor capacity 280 kW). The crushers are not fully utilized,and consequently both crushers and transports are run idleunnecessarily. The operation should be reorganized to save energy andoperating costs.
4.8 After crushing, the material is fed to the dryer or directly tothe longitudinal storage hall (same design as for limestone). Beltconveyors distribute the material to the marl silos. Coarse, hard anddry basalt is fed by dumpers to a two-stage crushing arrangement. A jawcrusher (motor capacity 108 kW) reduces the material in a first stage to60-120 mm, depending on its adjustment. Afterwards, it is transported tothe second stage or an intermediate storage hall, which is rarely used.
4.9 The second stage, a gyratory crusher (motor capacity 150 kW)reduces the coarse fraction to 50 mm grain size (range 15-65 mm). Avibrating screen diverts the fine material directly to the dischargetransport. From the second stage the material is transported to astorage hall and from there to the various plants by belt conveyors. Itis not clear why two stages including transports and intermediate storageare needed for an operation that could be done in one step with lessequipment, and lower energy and operating costs.
4.10 For operational reasons, the basalt crushing and transportequipment is also not fully utilized. To reduce power consumption theequipment has to be operated at nominal capacity. In summary, rawmaterial handling and preparation is based on an expensive, complicateddesign and installation that automatically entail high energy consumptionand operating costs. Yet this installation is not able to handle humidmaterial (marl) properly and does not preblend the material. Simplifica-tion of material handling and operation is desirable, but should belinked with the respective investment.

- 77 -
4.11 Raw Material Drying (Marl). Remarks made for the Tartous plantin paragraph 2.14 apply here also, as the installation is of the samedesign. Particular items to be mentioned are:
(a) there is no fuel meter installed;
(b) the conveyor scale behind the dryer is not functioning;
(c) because of clogging, the material inlet flaps were removed.The material now falls about 5 meters down onto the bricklining of the dryer inlet;
(d) the fresh air intake flap at the dryer inlet was dismantled andthe opening closed permanently; and
(e) none of the dryers was functioning during the visit(maintenance).
Without data and measurement it is not possible to evaluate this plant.From the technical specifications an energy consumption of 1,169 kcal/kgH20 can be calculated, which is normal. Regarding dryer operation andsupervision, remarks made in paragraph 2.14 apply here also. Thematerial moisture levels for 1986 were given as follows:
Table 4.1. RAW MATERIAL MOISTURE LEVELS AT THE ADRA PLANT, 1986.
Limestone Basalt Sand Mix
Average compisitlonof raw mix (%) ca. 2/3 ca. 1/3 1
Humidity H120January 2.50 4.00 12.50 5.86February 3.30 5.00 13.00 6.96March 2.50 4.25 10.90 5.92April 2.70 4.00 10.70 5.58May 2.00 3.50 9.80 4.97June 2.00 6.00 8.70 5.05July 2.25 4.00 9.00 4.57August 2.50 6.00 8.20 5.07September 3.00 5.70 8.00 5.07October 2.00 6.00 8.50 5.01November 2.80 5.00 11.00 6.10December 2.50 5.50 10.50 5.46
Remark: The final column was calculated from the quantitiesand moilsture levels of the three components.

- 78 -
It can be seen from the table that the raw mix does not need separatedrying. The raw mill and exhaust gases are sufficient for thispurpose. The whole dryer operation is a waste of energy. It compensatesfor the design insufficiencies of the raw material (marl) handlinginstallation. To save energy, this operation should be stoppedimmediately.
Raw Meal Preparation
4.12 3ummary of Test Results. On June 23, 1987, a test was carriedout on the raw material grinding system to assess the items related toenergy consumption. The main test results are summarized below.
Test duration 4 h
Raw mix feed
- limestone 63.5 t/h- marl 34.8 t/h- basalt 12.2 t/h- total 110.5 t/h, 6.0 X H20Raw meal production 104.4 t/h, 0.5 % H20
at 1.0 % R 0.20 mm10.0 o R 0.09 mm
Mill speed 15.7 rpm
Filling degree (measured) comp. I 19.5 %comp. II 21.5 %
Temperature / O-Contetit
- gas mill inlet 340 °C I 7.5 % 02- gas mill outlet 62 °C I 11.5 Z 02
Pressure
- mill inlet - 50 mm H20- mill outlet - 380 mm H20
Particle Size Distribution
The results of the sieve analysis done by the plant laboratory areshown in Annex 6, page 2: Grain Size Distribution. A correct sieveanalysis for the separator coarse return could not be obtained.
Power Consumption
The following figures were calculated from the amperage meterreadings or, when necessary, estimated.
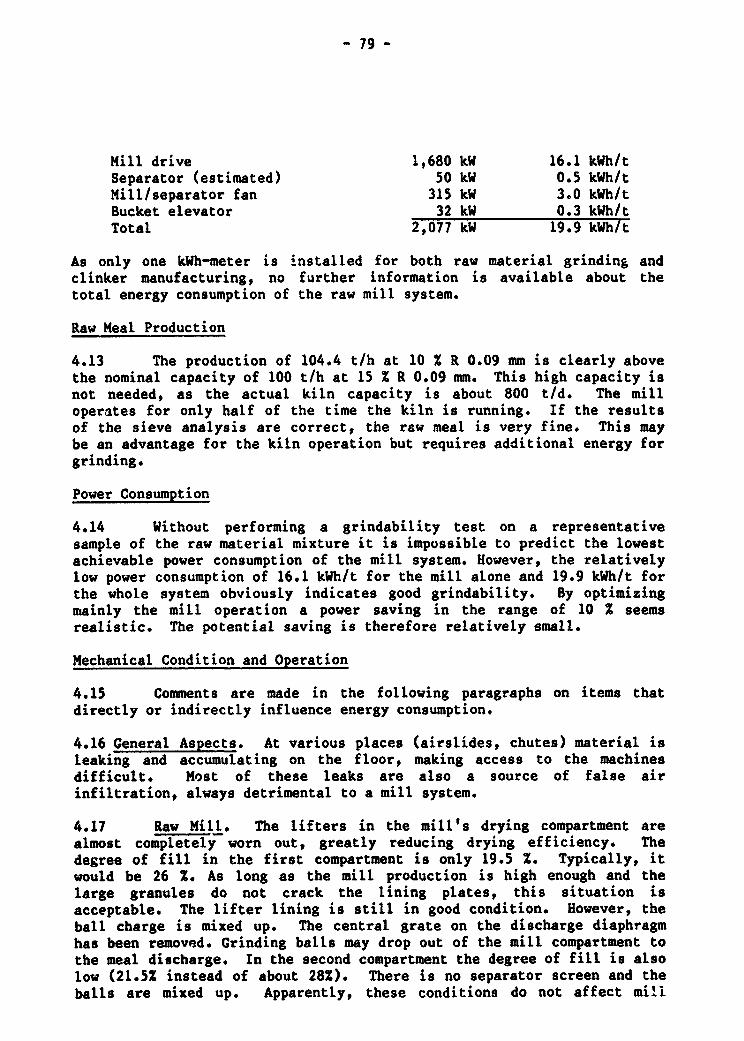
- 79 -
Mill drive 1,680 kW 16.1 kWh/tSeparator (estimated) 50 kW 0.5 kWh/tMill/separator fan 315 kW 3.0 kWh/tBucket elevator 32 kW 0.3 kWh/tTotal 2,077 kW 19.9 kWh/t
As only one kWh-meter is installed for both raw material grinding andclinker manufacturing, no further information is available about thetotal energy consumption of the raw mill system.
Raw Meal Production
4.13 The production of 104.4 t/h at 10 X R 0.09 mm is clearly abovethe nominal capacity of 100 t/h at 15 % R 0.09 mm. This high capacity isnot needed, as the actual kiln capacity is about 800 t/d. The milloperates for only half of the time the kiln is running. If the resultsof the sieve analysis are correct, the raw meal is very fine. This maybe an advantage for the kiln operation but requires additional energy forgrinding.
Power Consumption
4.14 Without performing a grindability test on a representativesample of the raw material mixture it is impossible to predict the lowestachievable power consumption of the mill system. However, the relativelylow power consumption of 16.1 kWh/t for the mill alone and 19.9 kWh/t forthe whole system obviously indicates good grindability. By optimizingmainly the mill operation a power saving in the range of 10 % seemsrealistic. The potential saving is therefore relatively small.
Mechanical Condition and Operation
4.15 Comments are made in the following paragraphs on items thatdirectly or indirectly influence energy consumption.
4.16 General Aspects. At various places (airslides, chutes) material isleaking and accumulating on the floor, making access to the machinesdifficult. Most of these leaks are also a source of false airinfiltration, always detrimental to a mill system.
4.17 Raw Mill. The lifters in the mill's drying compartment arealmost completely worn out, greatly reducing drying efficiency. Thedegree of fill in the first compartment is only 19.5 Z. Typically, itwould be 26 Z. As long as the mill production is high enough and thelarge granules do not crack the lining plates, this situation isacceptable. The lifter lining is still in good condition. However, theball charge is mixed up. The central grate on the discharge diaphragmhas been removed. Grinding balls may drop out of the mill compartment tothe meal discharge. In the second compartment the degree of fill is alsolow (21.52 instead of about 28X). There is no separator screen and theballs are mixed up. Apparently, these conditions do not affect mi'l

- 80 -
capacity and meal fineness much. False air is entering the mill mainlyat the material feed point, where the double flap gate is blocked in anopen position. The pressure difference of 330 mm H20 over the mill isslightly high and indicates that a largQt amount of gas is drawn throughthe mill, a consequence of false air infiltration at the mill inlet. Themill outlet temperature of 62 aC is too low (danger of clogging).
4.18 Air Separator. A detailed assessment of the separator is notpossible since the sieve analysis of the coarse return was not correct.However, direct comparison of the particle size distribution of separatorfeed and final product seems to indicate a reasonable operation.
4.19 Mill Control. Only one common fan for mill and separatorcontrols the gas flow through the whole mill system, i.e. a smalldisturbance somewhere in the system will affect th.e entire gas flowbalance if no counter measure is taken. The mill operation is thereforesomewhat critical. Furthermore, many instruments and recorders are outof order. The acoustic sensor and the mill feed control are both notfunctioning. This increases the danger of running the mill empty.Quality control information from the laboratory arrives too late at thecontrol to allow for proper adjustments.
Raw Material Drying
4.20 The only really humid raw material component is the marl, whichcan contain up to 13 % moisture during winter. As the marl can bepredried separately, raw material drying is not a problem in the millsystem. Part of the advantage of having hot preheater exhaust gases at420 °C is spoiled by false air infiltration between the preheater exitand the mill inlet, so that the available temperature for drying drops to340 'C at the mill inlet.
4.21 Consequently, a larger quantity of kiln gases have to be drawnthrough the mill system, thus increasing the drop in pressure andeventually increasing power consumption. The same harmful effect iscaused by false air infiltration at the mill inlet. Basically, from apure drying point of view, the marl predrying operation is not necessary.Assuming that the dimensioning of the gas path in the mill system isadequate (which should be investigated in detail), the kiln exhaust gasescould dry the resulting raw material at a maximum moisture level of 8 Xin the mill system. A prerequisite condition would be to keep false airinfiltration preceding the mill system and inside it within a reasonablelimit. The above statement remains valid even if the diln heatconsumption decreases as a result of a kiln optimization program.
Clinker Burning Process
4.22 Summary of Test Results. On June 23, 1987, a short test wascarried out on the kiln system to assess the items related to energyconsumption. The main test results are summarized below:

- 81 -
Test duration 6 h (08.30 h - 14.30 h)
Kiln feed quantity 404 t
Clinker produced a) 191.2 t (weighing of 190.1 t in 5 h 58'b) 232.2 t (kiln feed/cli-ratio - 1.74)
Fuel consumed 22.30 m3 at 125 °C = 19.96 t (0.895 t/m3)
Preheater exhaust gases 420 °C / - 380 mm H204.5 % 02 / 0.5 X CO
Transition chamber 1,000 °C I 1 % 02
Cooling air 112,00. Nm3/h
Primary air 5,000 Nm3/h (estimated)
Cooler exhaust air 81,000 Nm3/ht 205 °C
Clinker temperature 80 °C
Kiln radiation losses 2.32 Gcal/h (2,700 kW)
Power Consumption
Kiln exhaust gas fan 445 kWCooler fans 270 kW in totalCooler exhaust air fan 175 kW
As no separate kWh-meter has been installed for the clinker burningprocess (only one for clinker burning and raw meal preparation combined)no figure is available for the kiln system.
Clinker Production
4.23 A big discrepancy exists between the weighed (191.2 t) and thecalculated (232.2 t) clinker production. Assuming that the weighbridgewas correctly calibrated, the production figure obtained by truckweighing is the most accurate. The resulting kiln feed/clinker factoramounts to 2.11, which is hardly believable and shows that the kilnfeeder is wrongly calibrated. All further comments will be related tothe weighed production of 191.2 t, i.e. 31.9 t/h or 765 t/d.
Heat Consumption
4.24 From the above results and on the basis of a lower calorificvalue of 9600 kcal/kg fuel, the specific heat consumption amounts to
1,002 kcal/kg clinker (4,195 kJ/kg clinker)

- 82 -
Considering the general kiln operation during the test this resultappears to be realistic. However, this high heat consumption figurecontradicts the yearly average value of 930 kcal/kg clinker (3,894 kJ/kgclinkf!r) stated during phase I of this study.
4.25 The shortness of the test Aight partly explain the high heatconsumption as rotary kilns can accumulate some material over a few hoursand release it afterwards (the material input and output flows are nolonger in balance), particularly under the reducing burning conditionswhich prevailed during the first half of the test. Nevertheless, thespecific heat consumption is too high for this type of kiln system. Itshould not exceed 800-820 kcal/kg clinker (3,350 - 3,430 kJ/kg clinker)under stable operating conditions. The reasons for the excessive heatconsumption are discussed below.
4.26 Operation below Nominal Capacity. The nominal kiln capacity is1,000 t/d, but the present production is around 800 t/d. The equipment istherefore not running at maximum efficiency and the specific heat lossesare higher. The grate area for the grate cooler is unreasonably large,as it could handle 2,000 t/d. The consequences of this oversizing will bediscussed below.
4.27 Grate Cooler. The cooler is of an old fashioned design, with alarge grate area and the drag chain located inside the casing. Withspecific loads of 14.1 t/m' d (total grate area) and 333 t/m d (gratewidth at inlet), at 800 t/d the cooler is badly underloaded. It isoperated with a thin clinker bed, at a very low undergrate pressure inChamber 1 of 120-180 -m H 0. Heat recovery is therefore far fromoptimum, e.g., the cooler efficiency was around 55 Z during the test.With a secondary air quantity of approximately 1 Nm3/kg cli the heatrecovery efficieucy of a grate cooler should be over 70 X. The kiln hoodpressure and the cooling air quantity are controlled automatically, whilethe grate speed is adjusted manually. A fully automatic cooler controlwould allow a more efficient operation.
4.28 Kiln Firing S7stem. The kiln firing system is not verysophisticated and the flame shape not optimum. A black plume about onemeter long is always visible at the burner tip. This is not normal forfuel firing. The primary air is approximately 15 X of the stoechiometriccombustion air, compared with less than 10 Z for an efficient oil firingsystem. Furthermore 3 S of the combustion air is sucked into the kilnhood at the gap around the burner pipe in the form of false air.
4.29 lgt&!Z Kiln. At 800 t/d the specific kiln loads are 79 t/m2 dand 1.3k t' t,d i.e., far below normal figures for suspension preheaterkilns. This kiln oversizing results in increased specific rediation andconvection losses. During the test they amounted to 73 kcal/kg cli (305kJ/kg cli). Neither the inlet nor the outlet seals are workingproperly. A gap of 30 mm at the kiln inlet seal is an important sourceof false air infiltration. This affects the heat consumption. On somerollers, the contact surface is already curving inwards. Correctivemeasures should be taken as soon as possible to avoid serious damage.The total refractory lining consumption of 1,000 g/t cli is on the high

- 83 -
side for a suspension preheater kiln of this size and also contributes tothe high radiation losses.
4.30 Excess Air and False Air Infiltration. No gas analyzer isinstalled at the kiln inlet. The operators run the kiln according to thereadings on the analyzer located below the top cyclone stage, when it isworking. At the Consultants' request, the analyzer was put intooperation and calibrated, but the signal from the CO analyzer was stillnot transmitted correctly to the control room. At the beginning of thetest the kiln was operated with only 1.5 X 02 according to the plantanalyzer. This result was confirmed by measurements taken with aportable analyzer, but simultaneously, a CO content of about 1 X wasmeasured (indication in control room: 0 X). The kiln was thereforeoperating under very strong reducing burning conditions, detrimental toboth heat consumption and clinker quality.
4.31 Over the whole test an average of 3.3 % 02 was measured belowthe top stage (with 0.8 X and 7 X as extreme values). Measurements takenwith the portable analyzer showed that this average value corresponds to1 X 02 in the transition chamber and 4.5 X 02 at preheater top. Theincrease from 1 2 to 4.5 X 02 over the preheater is excessive, even if itincludes the kiln feed transport air. For this type of preheater theincrease should not exceed 2 X 02.
4.32 Preheater. From a heat consumption point of view, a shaftpreheater is basically less efficient than a conventional 4-stage cyclonepreheater. But the main reason for the very high exhaust gas temperatureis the excessive kiln heat consumption. False air is enetering atvarious places, mainly at the cyclone stages, affecting the kiln heatconsumption. The kiln feed/clinker factor of 2.11 measured during thetest is certainly too high. But recently, dust losses from Ehe kiln havebeen measured by weighing the dust, and were found to be in the range of17-19 2 of the kiln feed. This means that the true kiln feed/clinkerfactor is around 1.9, which is extremely high and indicates a poor dustcollection efficiency in the top cyclone stage. Dust circulation outsidethe kiln also contributes to the increased heat consumption.
4.33 Kiln Feed QualiLty. Since the XRF equipment is out of orderquality control is based on an hourly determination of the kiln feedtitration. During the day of the test the average titration of 24 hourlysamples was 75.4 X with a standard deviation of 0.41 Z. The variationsare therefore at the upper limit of the tolerable range for a smooth kilnoperation.
4.34 Kiln Control. Many of the important instruments are out oforder or give wrong readings. There is no ink in the recorders so thatit is impossible to follow the trend of the kiln operating conditions.The grate cooler speed control loop is not in operation. The operators'process knowledge is very poor. For instance, drastic adjustments to thefuel rate (up to -20 Z in one step) are made without furtherconsideration.

- 84 -
Power Consumption
4.35 The power consumption of the whole kiln system cannot bemeasured directly. The power absorbed by the main fans was calculatedfrom the amperage meter readings and is commented below:
4.36 Kiln Exhaust Gas Pan. The kiln exhaust gas fan is equippedwith a variable speed hydrodynamic drive, which has a poor efficiencyparticularly in the lower speed range. However, as this drive isapparently undersized and tends to overheat, the fan is now operated atmaximum speed and the gas flow is controlled by damper. This is theworst method of control from the point of view of power consumption andis one of the reasons (another being the high heat consumption) for theextremely high figure of 13.9 kWh/t cli. Under the same kiln operatingconditions a well designed fan/drive system would consume 8-9 kWh/tcli. Further power savings could of course be realized by taking allnecessary steps to reduce the quantity of kiln exhaust gases, directly orindirectly.
4.37 Cooler Fans. The power absorbed by the four cooler fanstogether amounts to 8.5 kWh/t cli, which is an extremely high valueconsidlering the low undergrate pressure. The main cause of the high powerconsu"ption is the type of flow control used, by a damper located afterthe fan. For the same cooling air quantity and pressure a powerconsumption of less than 3 kWh/t cli could be achieved with an efficientfan/flow control system.
4.38 Cooler Exhaust Air Fan. The cooler exhaust air fan is equippedwith a flow control by damper instead of a variable speed drive. The poorefficiency of this system, and the high quantity of exhaust air, areresponsible for the very high power consumption of 5.5 kWh/t cli. As acomparison the exhaust air fan of a well designed cooler system consumesless than 2 kWh/t cli under normal operating conditions.
Cement Grinding
4.39 Summary of Test Results. On June 24, 1987, a short test wascarried out on the cement grinding system to assess the items related toenergy consumption. The main test results are summarized below:
Test duration 5 h 40 min.
Mill feed
- clinker 41.5 t/h- gypsum and pozzolana 4.0 t!hCement production 45.0 t/h at 2,740 Blaine
Mill speed 16 rpm

- 85 -
Filling degree (measured) comp. I 37.5 Zcomp. II 27.0 X
Air flow through the mill 20,500 Nm /h
Water injection no
Temperature
- cement ca. 80 eC
- air mill outlet 100 eC
Pressure
- mill outlet - 90 mm H20- dynamic separator outlet - 250 mm H20- filter inlet - 180 to - 240 mm H20
Particle Size Distribution
The results of the sieve analysis done by the plant laboratory aregiven in Annex 6, page 6: Grain Size Distribution. The separatorfines could not be sampled and for the separator coarse return onlythe last two samples could be taken into consideration.
Power Consumption
The figures below were either calculated from the amperage meterreadings or estimated when necessary.
Mill drive 2,075 kV 46.1 kWh/tMill fan 135 kW 3.0 kWh/tSeparator (estimated) 40 kV 0.9 kWh/tSeparator fan 175 kW 3.9 kWh/tBucket elevator 13 kW 0.3 kWh/tTotal 2,438 1kV 54.2 kWh/t
One of the two kWh-counters for the cement grinding plant was notoperating. The power metering in the control room indicated a totalpower consumption of approximately 2,700 kW, or 60 kWh/t, for allthe equipment from mill feed to cement silos.
Cement Production
4.40 The indicated production of 45 t/h is 35 X below the nominalcapacity of 70 t/h at 2,800 Blaine. The main reason for this poorperformance is the frequent under-feeding of the mill, due toinsufficient control of the mill operation.

- 86 -
Power Consumption
4.41 The specific power consumption of 46.1 kWh/t for the mill aloneand 54.2 kWh/t for the complete system is extremely high for the type ofcement produced. At a fineness of 2,800 Blaine figures of 30 to 35 kWh/tshould be achievable with this system. Therefore, a considerable savingpotential of nearly 20 kWh/t exists. However, the test conditions mightnot have been representative when compared with the yearly averageproduction records. According to the 1986 records only 25 X of the totalpower consumption is consumed by the cement mills. Calculated on thisbasis a specific power consumption of 46 kWh/t cement results. If thisis the true power consumption, then the saving potential is reduced to8-10 kWh/t cement.
Mechanical Condition and Operation
4.42 Comments are made in the following paragraphs on items thatdirectly or indirectly influer:ce energy consumption.
4.43 General Aspects. At various places (chutes, airslides)material is leaking out and accumulating on the floor. Some dustcollection pipes have holes and false air is leaking into the pipes. Itis obvious that the mill is bent, as the distance to the acoustic sensorvaries by a few centimeters during one mill revolution.
4.44 Cement Mill. The mill feed chute is cracked and is notcorrectly centered. Many of the anchor bolts that secure the chute aremissing. The first compartment is too short with only 27 Z of the totalinternal length compared to a normal length of 30-35 %. Despite the veryhigh degree of fill of 37.5 Z (typically 28 Z) the grinding efficiency ispoor. At the end of the compartment the material is too coarse (seeAnnex 6, page 10: Mill Performance Test). The residue on the 1 mm sieveis 42X, instead of 2-3 X, as it would be normally. The lifter liningshows considerable wear. In the second compartment the clinker is groundto 2,600 Blaine, which is too fine for an efficient operation in a closedcircuit mill (normally about 2,000 Blaine). There is obviously notenough material in this compartment (or the compartment is too long).The separator screen is worn out and the balls are mixed up. The 27 Xdegree of fill is acceptable.
4.45 The mill ventilation of 20,500 Nm/h corresponds to an airvelocity of 1.3 m/s in the second compartment. This is in the lower rangefor this type of mill system. More air is not needed to evacuate thegrinding heat as the moisture content of the pozzolana is evaporated inthe mill. As already mentioned the mill is bent, and an incorrectalignment and levelling can be suspected. This point should be examinedas soon as possible to avoid a major breakdown.
4.46 Static Air Separator. The comparison of the sieve curves ofthe mill discharge and of the dynamic separator feed (see Annex 6, page6: Grain Size Distribution) show that not much coarse material is

- 87 -
separated out in the static separator. This is probably the result ofpoor mill ventilation. The adjustment of the separator blades should bechecked.
4.47 Dynamic Air Separator. As no sieve curve is available for theseparator fines, a detailed assessment of the separator performance isnot possible. As long as the mill is grinding so fine the separatorcannot operate efficiently. The rotor speed control seems to bedefective. The specific power consumption of the separator fan is high,mainly due to the mill's low production. The temperature of the fanbearings is too high.
4.48 Mill Control. Some of the instrumentation and a number ofcontrol systems are out of order. For instance, the acoustic sensors arenot adjusted correctly and the mill feed control does not work properly.Often the mill feed is too low or even interrupted. Consequently thepower consumption increases drastically. The dosing of the gypsum/pozzolana mixture is very irregular: it can happen that for half an houronly gypsum or only pozzolana is fed to the mill, without any countermeasure being taken. The feedback from quality control is generally toolate.
Auxiliaries
4.49 Water. The plant has two water pumping stations for Adra I andII; the boiler house is fed from Adra I only. The pumps g nerally have55 kW-motors and operate at a pressure of 4.4 6.6 kg/cm . Since nometers are installed water consumption could not be evaluated.
4.50 Steam. 2The boiler house is equipped with four units, capacity4 t/h at 8-kgcm , operated at 6.4 bar. Since the steam flow meter wasnot working, boiler performance and steam consumption could not beevaluated. Condensate is collected only from the fuel heating stations,not from the filter cleaning air dryers. Adequate instrumentation andcollection of all condensate are a prerequisite for the checking andoptimization of the boiler operation (energy saving). There is certainlyroom for improvement.
4.51 Compressed Air. The compressor ho.:se for Adra II is equippedwith:
(a) 3 Centrifugal compressors, 7,000 m3/h, 4 kg/cm2 (3 atue), 465kW, operated at 2.45 - 2.70 kg/cm2 for material transport; and
(b) 2 Piston compress2ors, 11 kg/cm2 (10 atue), 55 kW, operated at5.90 - 8.55 kg/cm for general purposes.
Both systems nave buffer tanks. Reading of consumption figures is onlypossible for the low pressure system. During the visit the averageconsumption, over 22.3 hours, was 21,600 ms/h. That means allcompressors had to run at their full capacity. It was observed that the

- 88 -
2system pressure increased in cycles of 2-3 minutes to 3.2 kg/cm * Atthis pressure the safety valve opened. The pressure collapse" and thefeed to the plant (buffer tank) was reduced. This mode of ope Aion iscertainly not normal. The control circuits need to be chf .ed andadjusted. The plant should have some spare capacity, which m- Is thatall consumers have to be checked for losses and for effective consumptionto calculate the actual demand of the plant. As mentioned before,compressed air is the most inefficient and expensive form of energy.Consumption of compressed air should be minimized.
Electrical Equipment
4.52 General. Evaluation of the questionnaire used in Phase 1 ofthe energy efficiency study showed:
(a) a rather high energy consumption (kWhlt); and
(b) operating problems with drives and instrumentation.
The Consultants confirmed the above observations during their plantvisits in Phase 2 of the energy efficiency study and found additionalitems that need to be investigated.
Power Distribution System
4.53 Power Measurement. The power distribution system does notpermit ideal metering of energy consumption per department. Furthermore,the outgoing 6 kV-feeders of busbars UTS 1.2 and UTS 2.2, BL.1 and BL.2are only equipped with A-meters. The power demand (kW) and energyconsumption (kWh) of the individual main consumers such as 6 kV motorsand 6 kV/380 V distribution transformers had to be estimated from theA-meter readings.
4.54 The costs for electrical energy are based on the followingtariffs:
night from 11 p.m. to 6 a.m ( 7 h) 21 ps/kWhday from 6 a.m. to 5 p.m. (11 h) 33 ps/kWhevening from 5 p.m. to 11 p.m. ( 6 h) 54 ps/kWh
The total energy consumption from January to May 1986 was as follows:
night (7 h) day (11 h) evening (6 h)
18,453,600 kWh 24,552,000 kWh 9,768,000 kWh
The specific energy consumption during the three tariff periods revealsthe following distribution: (100 Z d daily average)
120 1 101 X 74 Z

- 89 -
These figures show that the production managers consider the tariffstructure. The following readings could be taken:
4.55 Raw meal Preparation and Clinker Burning. Comprising thematerial flow from the raw material dosing feeders to the clinkersilos. Metering on 6 kV-panels No. 1.10 and 2.3 feeding the busbars ofUTS 1.2 BL.1 and BL.2. The kWh- and kVarh-meters of BL.1 weredefective. The specific energy consumption (kWh/t) is calculated fromthe A-meter readings and commented in paragraphs 4.14 and 4.35.
4.56 Cement Grinding. Comprising the material flow from the clinkerand gypsum dosing feeders to the cement silos. Metering on 6 kV-panelsNo. 1.4 and 2.1 feeding the busbars of UTS 2.2 BL.1 and BL.2. ThekWh-and kVarh-meters of BL.2 were defective. The specific energyconsumption (kWh/t) is calculated from the A-meter readings and commentedin paragraph 4.41.
Voltage Fluctuations
4.57 According to the information received on site, the voltagefluctuations are within acceptable tolerances. The three main 20 MVA,66/6 kV transformers are equipped with on-load tap changers, controlledby an automatic voltage regulator. The 66 kV supply voltage is recordedby a temporarily installed recorder. To obtain better information on theactual voltage fluctuations, a permanent 66/6 kV voltage recorder shouldbe installed.
Power Factor Compensation
4.58 The contract covering the supply of electrical energystipulates a minimum monthly average power factor of 0.85. Apparently,the figures reached are above 0.85 and no penalties have had to be paidup to now. The 6 kV-motors are directly compensated by capacitorsconnected in parallel at the motor terminals and the 380 V-motors arecompensated by automatically controlled capacitor banks connected at thelow voltage distribution points. Some of the 6 kV capacitors aredefective. The 6 kV capacitors should be checked to verify that they areof the right size and in good condition, and defective units replaced.
Layout of Power Distribution System
4.59 As a long term measure and in order to facilitate maintenanceand power measurement per department, all electrical interconnectionsbetween different departments that lead to a stoppage of more than theaffected department should be eliminated.
Drives
4.60 Constant speed motors up to 150 kW are 380 V squirrel cage orslipring motors depending on the starting torque requirements. Constantspeed motors above 150 kW are 6 kV slipring motors. Variable speed

- 9( -
drives such as the kiln drive, air classifier for raw mills and cementmills, and clinker grate cooler are equipped with thyristor controlledDC-motors. The 225 kW cooler exhaust fan and the 710 kW kiln fan areequipped with constant speed motors and damper control. As recommendedin paragraph 3.63, these drives should be replaced with DC-motors. The 6kV- and 380 V-motors have technical problems due to unreliable protectionrelays. The setting should be checked and defective relays replaced.
Motor Control
4.61 The control system is of a conventional design in 220 V, 50 Hzrelay technique. The raw mill and the kiln for line 3 are controlledfrom one central control room located near the burner platform. Thecontrol room for the cement mill is situated in the mill building.Technical problems in the control system mainly comprise defective com-ponents like relays and field control devices. Maintenance of thecontrol system must include a check of all transport and safetyinterlocks. Idle running of machines, as explained in paragraph 1.77,should be avoided.
Instrumentation
4.62 The instrumentation is of a conventional design with a standardanalog signal of 0-5 m A for measuring circuits with several instruments,e.g., regulators, recorders; and with direct indicating instruments; e.g.for temperature measurement (PT 100). As described in paragraph 1.82,the main problem is in the lack of maintenance. Several recorders areout of operation due to defects or lack of paper or ink. The controlroom operator, therefore, is not informed of the tendencies of thedifferent process values.
4.63 The following control loops in the raw mill and kiln sectionwere set on manual instead of automatic control:
raw mill total feedpressure below hot chamber grate
The following control loops were on automatic control:
raw mill feederskiln feedkiln hood pressurecooling air for clinker coolertemperature cooling tower
4.64 The kiln shell temperature measuring device consists of severalthermocouples which indicate the tendencies of the kiln shell temperaturein the burning zone at fixed spots only. Several instruments andrecorders, e.g., gas analyzers, gave wrong readings. All processmeasurements must be thoroughly and regularly checked and calibrated.

- 91 -
Proposal for Operational Improvements
4.65 The proposals for operational improvements are for thedepartments investigated (the raw mill, kiln and cement mill systems),the main consumers of energy in a cement plant. The requirements foroperational improvements for the Adra cement plant are listed in Table4.2. The table shows the potential savings in energy consumption viz.fuel oil (kcal/kg clinker) and power (kWh/t) as well as capital cost andoperating cost (if any) related to these operational improvements.Normal maintenance executed by the plant's personnel as well as normalconsumption of wear and spare parts are not considered as extra costs.The potential savings are calculated on the following bases:
Annual raw meal production 508,000 tAnnual clinker production 292,000 tAnnual cement production 320,000 tFuel oil price 840 SE/tPower price 0.36 SP/tExchange rate Syrian pound to US Dollars 11.25
The total calculated savings from operational improvements amount to:
Fuel oil on clinker basis 45 kcal/kg or 4.7 kg/tPower on cement basis 34.2 kWh/t
Further reductions in energy consumption are possible in other productionand auxiliary departments as mentioned in the foregoing paragraphs and byavoiding equipment running idle.

- 92 -
Table 4.2: SUiMARY OF PRDJECT PRPOSALS AND RECOENDATIONSPLANT: ACRA CEiENT WUILDING MATERIALS CO. - RAW MILL AND KILN 3
Capitol Cost Oporating Cost Potential Savings EffectiveProject Proposol Foreign Local Foreign Local Per Annum Llfetlim
USS'OGO LSOC0O US$ LS USS Years
RAW MILL 3
OPERATIONAL IWROVEiENTSExpected productlonClinker 292,000 tpaRaw Meal 500,000 tpaCoemnt 320,000 tpa
All Items mentloned hereinaftershould be Included In the normalmaIntenance program
Optimization of Raw Mill System- Sort and adopt the bail charge
In both compartments a/- Replace the central grate on
the discharge diaphrap I/- Eliminate all false air lea-
kages mainly at the mill Inlet 2 kWh/t 32,510
- Eliminate all leakages of aterial
KILN 3
- Check and repair all measurIngequipment and recorders b/
- Put the mill control systeminto operation b/
Reconditioning of Kiln System- Eliminate false air leakags
at:3 kiln hood (burner, pipe, S kcal/kg 360
klln outlet seal) 0.2 kWh/t 1,870. kiln Inlet seal 15 kcal/kg 34,070
0.5 kWh/t 4,670. preheater - upper part S kcal/kg 11,360
0.6 KWH/T 5,600
- Control excess air(possibly Installation of agas analyzer at kiln Inlet:
. target value 1.5 S 0 at up tokiln Inlet and 3.5 S-02 at 20 kcal/kg 45,420preheoter top 2 kWh/t 18,690
avoid C0 for"ation
Total 45 kcal/kg 102,210clinker
3.3 kWh/t 30,830clinker
Remarks a/ Normal wear parts.b/ Possibly new Instruments and control components required. Compare small Investment,
modification (electrical).

- 93 -
Table 4.3: SUIMMARY OF PROJECT PROPOSALS AND RECOMMENDATIONS
PLANT: ADRA CEMENT AND BUILDING MATERIALS CO. - CEMENT MILL 3
Capital Cost Operating Cost Potential Savings EffectiveProject Proposal Foreign Local Foreign Local Per Annum Lifetime
USS'OOO LS'OOO USS LS USS Years
Reconditioning of Cement MillSystem
All Items mentioned hereinaftershould be Included In the normalmalntenance program
- Lengthen the 1st compartment- Replace the lining in both
compartments a/- Adapt the ball charge in both
compartments- Clean/replace the worn dia- 20 kWh/t 3) 204,800
phragm plates (intermediateand discharge) a/
- Check the adjustment of thestatic separator blades 8 kWh/t 3) 81,920
- Check the adjustment of thedynamic separator rotor speed
- Check and repair all measuringequipment and recorders b/
- Improve the mill feed controlto avoid feed fluctuations Inquantity and quality b/
- Eliminate all material leakages- Check/correct the alignment and
levelling of the mill (possiblynew bearings) URGENT
- Repair the mill feed chuteURGENT
- Check the bearings of the sepa-rator fanURGENT
28 kWh/tTotal cement 286,720
REMARKS: a. Normal wear parts.b. Possibly new Instruments and control components required. Compare small Investment,
modification (electrical).

- 94 -
Proposal for Modifications Requiring Small Investments
4.66 Modifications requiring small investments are proposed for thedepartments investigated (the raw mill, kiln and cement mill systems) andthe electrical equipment. Modifications for the Adra cement plant arelisted in Table 4.4. The table shows the potential savings in energyconsumption (fuel and power) as well as the required capital andoperating costs (if any) related to these modifications. The tableindicates that modifications are foreseen only for the kiln system andthe electrical equipment. The following commer.ts refer to themodifications for the electrical equipment.
(a) To obtain more detailed information on energy consumption all 6kV outgoing feeders for raw meal preparation, clinker burningand cement grinding should be equipped with kWh- meters. Also,all installed kWh-and kVarh-meters should be checked andrepaired..
(b) To obtain the information needed for making furtherimprovements to control the effects of voltage fluctuations, apermanent 66/6 kV voltage recorder should be installed.
(c) To improve protection of the motors, all relay settings shouldbe checked and defective equipment replaced.
(d) To save energy, the kiln fan should be equipped with a DC-drive(see paragraph 4.60).
(e) To improve the control system all transport and safetyinterlocks should be checked and defective components such asrelays and field control devices, e.g. motion detectors, limitswitches, etc., repaired or replaced. For new equipment themain emphasis should be on a good, industrial type design, e.g.electronic proximity switches.
(f) To improve the cement manufacturing process all measurementcircuits should be checked and defective components such assensors, transmitcers, regulators, etc., repaired orreplaced. For new equipment, the signal flow of processmeasurements should be standardized, e.g. each analog processvariable should be transformed by a transmitter into a standardsignal of 0-20 or preferably 420 m A.
The expected life of the newly installed and/or modified equipment andinstallations is estimated.
4.67 The capital costs are determined on the basis of pricesreceived from reputable equipment manufacturers (price basis September1987). They include the cost for transport to the site, civil andstructural steel works, erection and commissioning of the equipment butnot customs and taxes, etc. for equipment and personnel imposed by theSyrian authorities.

- 95 -
4.68 Potential savings were calculated on the basis described inparagraph 4.65. However, the expected annual production is considered asfollows:
raw meal 527,000 tpaclinker 310,000 tpacement 340,000 tpa
These savings amount to 55 kcal/kg clinker (5.7 kg fuel oil/t clinker)and 11.0 kWh/t cement.

- 96 -
Table 4 4 Si4MARY OF PROJECT PROPOSALS AND RECOWEINAT IONSPLANT: ACRA CEMENT AND BUILDING MATERIALS CO. - KILN 3
Capital Cost Operating Cost °otentlal Savings EffoctiveProject Proposal Foreign Local Foreign Local Por Annum Lifetime
USS000 LS'OOO USS LS USS Years
SMALL INVESTMENT, MODIFICATIONSExpected production:Clinker 310,000 tpaRaw meal 527,000 tpaCoeent 340,000 tpoModification of Grate Cooler 1,136 480 15- Adapt cooler grat, area and design
to actual kiln capacity (opera- 40 kcal/kg 96,440;ion with thick clinker bed) 1.4 kWh/t 13,890
- Put the grate speed controlloop Into operation
- Replace the outlet dampers withInlet-radial vanes for the 2.0 kWh/t 19,840cooling air flow control
Replacement of Cooler Exhaust Airfan Drive- Install a DC-otor (225 kV) 116 b/ 2.0 kWh/t 19,840 15
Replacement of Kiln Firing System 58 55 15- Replace the burner with an ad-
justable one 10 kcal hg 24,100- Replace the primary air fan 0.4 kWh/t 3,970Modification of Top Stage Cyclones 380 270 a/ 15- Improve efficiency by modifica- 5 kcalAkg 12,060 a/
tion of gas Inlet/thimble design 0.2 kWh/t 1,980Replacement of Kiln Fan Drive 216 bl 6.0 kWh/t 59,520 15
a/- Replace the hydrodynamic drive
(out of order) with a DC-motor(710 kW)
Electrical Equipment a/ b/- All 6 kV outgoing feeders for 16.3 20
raw meal preparation, clinkerburning and cement grinding tobe equipped with kWh-meters(total 21 panels)
- Install one voltage recorder 3.1 20(66 kV and 6 kV) In themain station
- Replace defoctive motor 31.0 20protection relays (estimated100 relays)
- Reploce defective control 77.4 10relays and field control devicos
- Replace defective componentsfor Instrumentation 93.0 a/ b/ 10
55 kcal/kg 132,600clinker
Total 2,126.8 80512 kWh/t 119,040clinker
REARKS: a. To be Installed by the plant's maintenance personnel.b. Condition for'savings as per sumary list.

- 97 -
Proposal for Long Term Investments
4.69 The proposals for long term investment shown in Table 4.5 wouldresult in further savings in energy consumption. Consequently, higherutilization of crushers, raw mills, cement mills, packing plant andauxiliary equipment would contribute to reducing specific powerconsumption. The increase in the capacity of the kiln system of the Adracement plant by approximately 173,000 tpa clinker per production line,with a capital investment of approximately US$ 6.9 million results in aninvestment cost of only US$ 44.6 per annual ton of clinker additionallyproduced. The investment costs shown in Table 4.5 include the cost formechanical and electrical equipment c.i.f. plant site, civil andstructural steel works, erection and commissioning of the equipment, butnot customs and taxes for equipment and personnel imposed by the Syrianauthorities. Further fuel oil consumption savings of 40 kcal/ kg cli(4.2 kg fuel oil/t clinker) and cement savings of 12 kWh/t cement will beachieved.
4.70 The following production figures were considered in calculatingthe savings:
raw meal 767,250 tpaclinker 465,000 tpa andcement 509,600 tpa
Considering its size, the rotary kiln of the Adra cement plant couldproduce approximately 2,500 tpd when equipped with a modified kiln driveand a well dimensioned suspension preheater and precalciner system.However, additional equipment on the raw material side (new raw mills andcrushers) and on the cement side (new cement mills) are required and theclinker coolers require considerable modifications, but thesemodifications are not recommended due to the high investment costinvolved. Moreover, such modifications require a long plant downtime.The proposed modifications for the increase of the kiln capacity toapproximately 1,500 tpd requires only modifications which keep thedowntime of the plant within an acceptable range. Additional grindingcapacity will be achieved by the installation of a roller press in frontof the raw mill and one in front of the cement mill.
4.71 The additional capacity of the crushed limestone, basalt andmarl can be achieved by extending the operating hours for the respectivecrushing plants. The installation of prehomogenizing storage for marl isconsidered essential to improving the operation of the kiln system andthe quality of the product. One storage for marl is foreseen to serveall three production lines.
4.72 The following comments are made regarding the proposedmodifications to the electrical equipment:

- 9p -
(a) the power distribution system should be modified to eliminateinterconnections between different departments which lead to anunwanted stoppage of more than the affected department;
(b) the control and instrumentation system should be modernized toraise the productivity of the plant and reduce energy cost;
(c) an improved system should automatically start and stop motorsaccording to process requirements. Process failures andwarnings should be displayed in detail in the central controlroom, enabling the operator to take appropriate measures andthus reduce equipment downtime; and
(d) the capacitors should be checked to verify that they are ingood condition and large enough to compensate for thevariations in power supply, and faulty equipment should bereplaced.

- 99 -
Table 4.5: SUMMARY OF PROJECT PROPOSALS AND RECOMMENDATIONSPLANT: ADRA CEMENT AND BUILDING MATERIALS CO.
Capital Cost Operating Cost Potential Savings EffectiveProject Proposal Foreign Local Foreign Local Per Annum Lifetime
USS$OOO LS'OOO USS LS USS Years
LONG TERM INVESTMENTSExpected production:Clinker 465,000 tpaRaw meal 767,250 tpaCement 509,600 tpa
- Installation of a prehomoge- 1,203 1,167 a/ 20nizing storage for marl (1/3 x 3610) (1/3 x 3500)2 x 15,000 t (1 storage for3 production lines)
- Installation of a roller press 1,250 1,070 4 kWh/t 98,200 20in front of the raw mill(130 tph) to increase the ca-pacity by npprox. 30 %
- Replacement of preheater system 2,730 6,320 40 kcal/kg 144,670 20by a modern 4-stage preheatersystem and modification of thekiln drive
Installation of additionalcooling fans at clinker coolerto increase the capacity to1,500 tpd clinker
- Installation of a roller press 900 790 6 kWh/t 97,800 20In front of the cement mill(90 tph) to Increase the capa-city by approx. 25 %
40 kcalAhg 144,670clinker
Total 6,083 9,347 4 kWh/t RM 98,2006 kWh/tcement 97,800
REMARKS: The main purpose of these modifications is to Increase the capacity of the cement plant.Further minor energy savings should more than compensate the required investment cost. Thecosts of operation remain In the range achieved by the modifications as per paras 4.65 and4.66.
a. Condition for savings as per Item on replacement of preheater system.

ANNEX 1. AIDE-NOIRE

ANNEX 2. QUESTIONS RAISED BY GOC
I

- 100 -
Annex 1AIDE MEMOIRE Page 1 of 1
SYRIA
Energy Efficiency Improvement in the Cement IndustrY
A mission consisting of Messrs Abderrahmane Megateli, Hany Assaad(World Bank) and Christian J. Pfister (Holderbank Management andConsulting Ltd. "HMC") visited the General Organization of Cement(GOC) of the Ministry of Industry from December 4 to December 10,1987 , to discuss their draft report (Phase II) for the EnergyEfficiency Improvement Project in the Cement Industry. The missionwas received by the General Director of GOC Mr. Charif Aroudaki andthe Technical Director, Mr. Tayssir Basbous The draft report wasexamined and discussed by eng. Basbous the Financial Diredtor,Mr. Fayez Suddi, the Production Director, Mr. Hani Nabulsi andother GOC officials, and representatives of Arabian, Tartous andAdra cement plants.
The mission had an exchange of views on the implementation programof HMC's recommendations, elaborated in the draft report, after athorough analysis and discussion of these recommendations. To thiseffect, the mission submitted, for discussion, a preliminary 5 pagedocument which outlines a multi-phased implementation plan, withresulting production capacity rationalization and a technicalassistance and training program to support such a plan.
A revised Phase II report will be submitted in its final formformally in February 1988 incorporating all comments and suggestionsmade on the draft report.
7r G 0 C For The World Bank For Holderbank
Damascus December 10, 1987

- 101 -Annex 2Page 1 of 4
9,i404a hmc chvi * gocbM 411369ty
4 damascus117.1.988, tlx.r.mno.S3/400
r a tt.mr.eh p4tster
: zsub : holderbank's project no. syr/a6/003/(-a/0/42 for reduction------ of energy consumption in the cemomt Imdustry im %*&are-
* ref our last meeting in damascus in the period from 4.12.987, to* 10.12.98?, for a.m. project _
we handed your report to our adra cement co.larabian cement co. -Iand tartous cement co. for their study and comments .
* you find below these comment for the individual cement companies r4 i- tartous cement co.
4X 1. the saving in power mentioned in table rmoae would be 3.2*3 X instead of 4.6 kwh/ton x* 2. the saving in power of 14 kwh/ton mentioned in table 4.9-5* wougd, In our opinion,be pmbbible if we add around 5-6 0/0
of po::olana .G * 3. in item 4.10 page iv-3t of your report it is statod that the
* cost of one burner is u.s.dlrs 66000, while it is f.f 1374000vi * which is around u.s. dlrs 243000
* it- arabian cement co.
+ 1. ref Item S-li. in priciple, we agree on the idea of Increasing* the papacity of each kiln upto 2000 pd-accordingly,we preferF * that you lnclude the following information in your a.m.
paepboat consumption kcal/kgmcilnker4 b- power consumption kwlh/ton cement_ * c- max moisture content in raw materials in caib the kiln4I *^gases are used only for drying purioaes.accordingly,* brzwlmill dabau6t .e4 d- max moisture content allowed in raw materials in case th llt|la * kiln gases and auxiliary furnace will be used simultaneous-§ * usly for drying purposes accordimgly,determine raw mill r* { capacity .|l * e* in nase the kiln capacity will be increased to 2000 tpd, II4 la detailed study for crushers,conveyors,electrical motors,* fans, electral precipitators and bag filters,comprestors, * boilers,coolers ,stgages,etc is required* f-in this connectiontwe see that a proposal fbr raw material
trAnsport from quarry to the plant should be made underconsideration of improvement and economical point of view
* 9- concerning incroasing of kiln capacity upto 4000 tpd.w*II * *and could bgree-that this modification is very costly
| * economical .
* 2. in table 5-10/1-2-3-4 you proposed to replace several acI *zmotors by de motors we dO not completely agree to replace
all of them unless a technical/economical feasibility study4 r each *esdeosdfvidually
* ili- 4ra cement co._ _---
* 1. in item 6.3 page ci-4 of your report it is stated that the* wra mix does cot need any drypng at all -we would like tolI * point out the dryer operation is only followed during winter Ni
when humidity is very high and causes the clogging ofclay in the silos and otora3 .
X * ~~pls corroect the samo in your reportm

- 101
Annex 2Page 2 of 4
* * . in the proposal for lon9 term inveutment,item 6.ll,yourreport *oes.'not consider the capacity of the existing m
* mixing and storage silos for adra i p!ant whore there are* only two mixing swlos for both the kilns ,_^ * your proposal could not be adopted,in futures unless
these mixing and storage silos are modified to batchingsystem onablinglfeeding of both kilns with adquate quantityof raw meal
C regards* general director
dr.eng.ghiath zin alabdin* g.o.c.b.m.dt981404a hoe chgoebm 4l1369sy...
17.01.88/13M58 -
m

- 103 -
Annex 2
Page 3 of 4 0
981404a hmc ch m* damascus:l.t.9&8$ trx .sr.vo.ET70T
x * att.mr. pfister* umun
III X further to our telex no. 53/400 dt. i7.1.88.* adra co. studied your report in more details and found out very* important remarks concerning phase i, phase ii and phase iii
Iii * which belong to achieving the annual capacity statod in your report* for the thres phases. these remarks are as followsa
1. remarks to be adopted in phase i (item 6-9)
i-*- ---------------- _______________| * a- the annual capacity /292000/ ton clinker can not be achieved||l * at all, in our opinion,it should be 272000 tong of clinker Mi|l* b- to achieve 272000 tons of clinker annually, it is required i||l * to adopt the following modification in three phases -5||l * - replacoemnt of klin weigh-feeder|l * - replacement of kiln burner|31 * - replacement of hot gas fanw * - replacement of bag dust-filter,mainly in mixing and storage EN|nX * Silos .O * - proper functioning of electro-static precipitators,
X 9 remarks to be adopted in phase ii (item 6.101
* a- the capacity of 310C00 tons clinker per year could doubtfullyWe * be achieved. in our opinion 292000 tons can be achieved in
*l * case mixing and storage silos are modified in such a way tos * increase the mixing capacity for feeding both kilns .~ * additionally,the screw pumps(fuller-pumps) for kiln feedingw * should be modified or replaced to increase its capacity* for 75 tons upto /10O/ tons per hour. also,th. drier capacity
* * for marl should be increased to be 150-200 tons per hour,* instead of 100 tons existing now .
* 3. remarks to be adopted in phase iii (6.11)* _________________________________________-
|l* your suggestion and proposal for this phase need a detailedgls* technical and economical study before its execution which willm * lead to increase capacity to /465000/ tons
* we hope that you incorporate above remarks to your final report . m* regards* general director* dr.eng.ghiath zein el-abdeen* 9 o.c.b.m.4
981404a hmc ch
X i goebm 41136 9sy...
WJ 21.0.aa/14*15 I|

- 104 -
Annex 2ta 981404a hmch Page 4 of4h
w * goebm 4113 69sy PI'- * damascust24/1/988, tlx.sr .no.69/44
24.01.88/13I46
~~~~~~~~m981404a hmc ch
* gocbm 4 1 1369 sy m
* damascusi24/l/988, tlz.sr.no.69/400 x* att.t mr.ch.pfister* +.+,,,+
* furtherito oltlx no.400/53 dtd 17.1.988 we wid like to infm'u newX * remarks concerining arabian cement colas followss
W * 1). in 1.1.13 of table 5.9-1 you stated t''balance the crusher: rates replac. the worm hammers''EJ * this is impossible because we tried the same with romanians but: - the result was negative and we were always obliged to remove
the crusher rotorin order to remove the crusher rotor in order: to make the crusher as a by-pass only for mechanical reasonsin the design
* accordingly the mill capacity is max.1105/tons per hr,i.e.by* 20 working hrs per day n 320 working days per yr the qnty of- clinker produceable by each kiln daily is 1155 tons which means% * 369600 tons per per yr n nt 438000 tons as u stated for phase E-* I pls correct accordingly m nominate thip crusher a hammer^ * crusher - drier to avoid misunder-standing ' m* 3). in item 3.1 of table 5.11-1 u mentioned.|| * ''replacement of hammer crusher of raw mill by a roller press-* l(7Otph) to increase the capacity by apptoc 30 0/0''p * pie take note that there is no crusher existing now before* + the raw mill directly and modify this item by installing new x* ttlley przs''
x 3). the operation of auxilliary furnace at the same time with kilnX : gases is not possible because the dust coming with kiln gases
* enters into the casing of the burnerand accumulate in hugeIII * quantities within shortest time which causes the stoppage of* auxilliary furnace.unless several gas connections are modifiedJ * the auxilliary furnace cannot be operated simultaneously with
n kiln gasos.also, we wld like to point out that in case the: n kiln is stopped and the auxilliary furnace is operated only: the qnty produced in ths mill is determined by 85 tons
only, therefore , we believe that in case the capacity* shld be increased to 170 tons per hri this furnace wid nt be* sufficient
* 4). several items mentioned in phase ii n iii need detailed techn..* /*economical study before their execution m
r* igds*general director* dr.Qng.giath zin abdin
981404a hmc ch* gocbm 411369sy...
24.01.88/13053
X '

ANNEX 3. CONSULTANTS' ANSWERS

- 105 -
Annex 3Page 1 of 3
u d 0492411369+* 2ocb- 411369SyW 81404: hnc ch
4. 02. 8e/'5X:8
t{x 9059
W ;a/lh/ct to I g.o.c.b.m damascus, syriaattn: dr. eng. ghiath zin alabadin, general directorrS : Smnrgy efficiency study syria y/tix no. 53/400, 63/400 and
69/400
thank you very much for you: above three telexes. we appreciate gyour tho:ough study of our draft report presented from december m4, to 10, 1987 in damascus. please, be assured that your com@ietsare c_rofully studied'and will be considered in our report asfar as possible.
yltlx 53/400 dd. 17.01.88----________------------ X
1. tartous cement co._____________________
item i
cur findings revealed that 4.6 kwh/tcli is correct. plse givereasons why it should be 3.2 kwh/tcli.
W item 2
the reconditioning of the entire the cement mill cystem accordingto table 4.9 - 5 will lead to the saving of 14 kwh/t cement. pIsecompare statements as per para 4.6.
item 3 mthe cost estimate of us dIrs 669000 covers the upgrading of theexisting kiln burner, it is based on a cost estimats of a well lknown supplier.the cost you mentioned &ncludes probably completely new equip- XMont.according to the information we received from the supplier anupgrading without complete replacement is possible. detailedinvestigations may have to prove this.
U it. arabian cement co.
item I
we appreciate your principal agreement to the proposed capacityincrease to 2,000 t/d. the expected anergy consumption in kcal/kgclinker and kwh/t of cement will be indicated in our finalreport.the maximum drying capacity with kiln gates only is about 8 per-cent raw material moisture.e,f) we fully agree. the hme report on eorrgy efficiency indica- mtes the basic concept for energy savings and shows the ma,orsavings possibilities, a detailed engineering concept isnecessary to implement the more complex measures in particular aand f above.

- 106 -
| item 2 Annex 3------ Page 2 of 3
we would be pleased to investigate the individu&l feasibilityonce it is decided to implement the energy measures tz optimizaethe investment and elaborate the necessary data for a data' ad
W Priority plan.
OJ .ii adra cement co.
item 1 -
Inthe respective sentence should be:'from the above it can be seen that such a raw mix does not needany separate drying at all ..... we will correct this mistake.however, we concluded from the data regarding the moisture con-tent received by you (see table on page vi-4) that the raw mixcan be easily dryad in the raw mill by using the kiln exit gasesof a well performing raw mill / kiln system even during thewinter time.
item 2 gxas indicated above the implementation of the long term measuresrequire a detailed engineering and design considering all the
X existing facilities and auxiliaries.
energy efficiency study syriay/tlx no. 63/400 dd. 21.tC.88
adra cement cc.---------- _--___
item 1.
a. please explain the reasons for your opinion to allow for areconsideration of our estimate. it is just nominal capacity Iat a utilization factor of 80 percent.
b. to achieve the phase I target, normal operation and main- mtenance including the required wear and spare parts are a rprecondition (as it is stated in our report). in how farethe items you indicate can tie reconditioned by proper main- -tenance and spare parts or whether equipment needs to bereplaced 4eserves the implementation of phase i.
item 2
X small investment modifications lead to small improvements of kilnDI utilization from 80 percent to 85 percent at nominal capacity.therefore there is no need to Increase capacity of the transportand blending silo system. this capacity increase should bepossible otherwise the investment would be useless, please com-DI pare as well the comments in para. 6.4 (raw materialpreparation).
item 3
we agree. an investment of this magnitude requires the detailedengineering of a qualified engineer, this engineering will revealthe detailed scope of work necessary to implement phase iii. a ecost estimate on this bases or better tenders will indicate the mfirm cost. a recalculation of the feasibility will then quickly rshow the attractivity of the project and form the bases for thefInal decision of an implementation. m

- 107 -Annex 3
Page 3 of 3energy etficiency study syria, by/tIx mo. &0400 dd. 24.04.88
arabian cement to.
'U *tem i
pla give reasons why it is not possible to balance the crusherrotor. such crushers perfr,rm well in numerous Cement plantr. webelieve that extensive study of the problem would lead to aproper solution. the mill system should, whon operating with aproperly zperating hammer crusher-dryer, reach its nominal capa-city.
item 2
- ~~~~~~~~~~~~~~~nthe hammer crusher-dryer in front of the now mill, does notnecessarily need to be replaced. the rollar press could be aswell installed before this hammer crusher-dryer. however, adetailed study of the situation is necessary to find out the mostsuitable solution. O
item 3
39 we agree that the modifications of gas ducts may be necessary.our recalculation of the required heat for drying revealed thatthe auxiliary firing is sufficiently dimensioned if the system(crusher and mill) is properly performing. the proposed modifica-tions have to be executed, to. tchieve this aim.
'U item 4
we fully agree, however, this is necessary as well for all theother modifications proposed.
we appreciate your great interest in our draft report on enargy efficiency which led to operating strategy and capacity increaseproposals, all proposals have the aim to reduce energy and pro- *duction cost and ensure the required production. rplease be assured that your above three telexes will be con-sidered as far as possible in our final report. mwith best regards, Xm. lohr, ch. pfistertechstelle holderbank
US * gocbm 411369ty98l404z huc ch
S 04.02.88/45:44 -
01 3
ANNEX 4. TARTOUS CEMENT PLANT - FLOW CHARTS AND TEST RESULTS

to EP I z1
limestone'' .+ basalt .l.l l.
_ (4 | ~~~~~~~~~~~tosi lo \c..o
I .4
auxiliary mJ .x 7.lfurnir- _|--#]|1l
(not in {t. operation)mesto_e
from kiln
TARTOUS CEMENT - Raw Mill No. 4 _
Slmplifled now-sheet * _ o
. No _
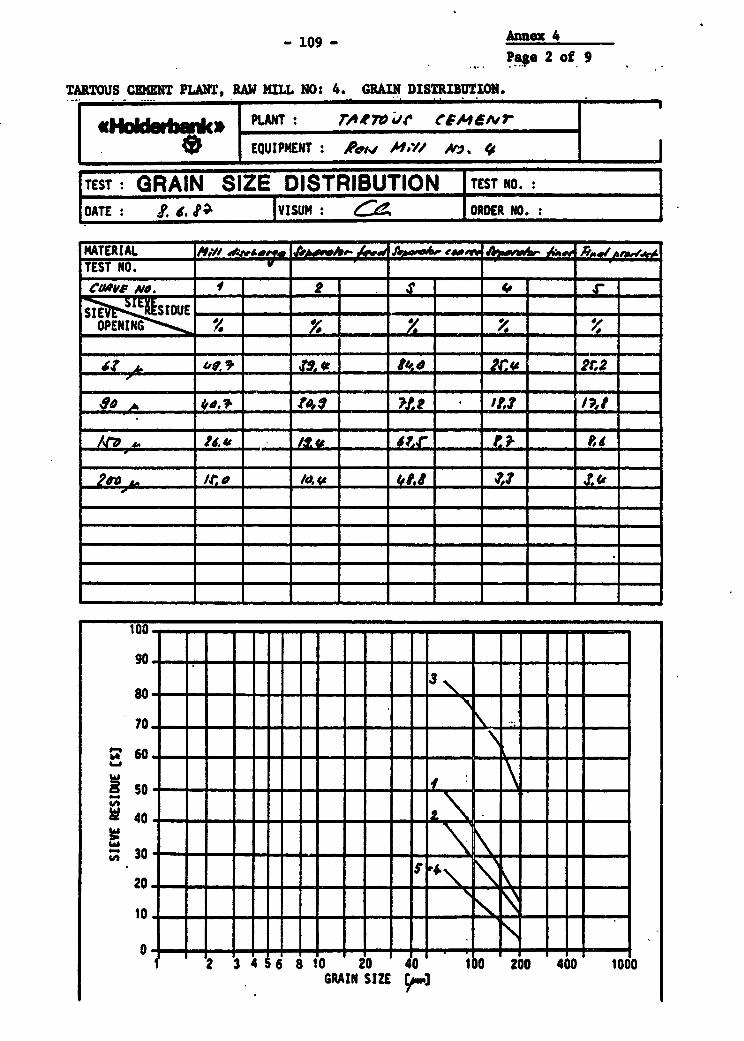
-109- ~~~~Annex 4-109 -
Page 2 of 9
TARTOUS CEMENT PLANT, RAW MILL NO: 4. GRAM DISTRIBUTION.
. H Iu~ ...... A .. M .. .. .. I
TEST :GRAIN SIZE DISTRIBUTION TEST NO.
DATE :. ISUIM :s ORDER NO. : j
MATERIAL RAW .A"&ii. AD~~
TEST NO.TEST NO v .4_. . 4.-caft 'Vo._
SIE SIDIJ - - - -_
OPENING %
3D A 0 'd.? = 4 ____ 14,0.t42,4', A, 'r__ -- , P.. -
*I7- - -- - - - --
…- - -=
'- 0--- -X - 1-- - =--
10- X =- - 1 =. L: I = _
80- - X- - - - v- -- X - == ---
70 ,a a .. .
40 a - a - - - a - - -
.t 30z -_ _ _ _ -1 a 1 11 1
20. a a _ _ - 5 -
1 3 6810 20 40 100 200 400 1000GRAIN SIZE $w3

-110 ex4Page 3 of 9
TARTOUS CEMENT PLANT, RAN HILL NO: 4. SEPARATOR P,.RMAMCE:
_|J- | ~~~~PLANTr: O4nr^* >r ,,&j ceF, V7H ' EQUIPMENT: /- A..%' _
'MST : SEPAATOR PEFRMNE 'ST NO
DATE 'P.__ ._ :_ -iu 4,ODERNO
_____ ,_ _.
. S~~~~~~~ ~ PASSING CIRC. SEP.
FEED COAIRSE FlINES LOAD EFf. SELECT
PARTICLE SIZE a r o r f dS f u _
Mgo, -_- P-- = $-/
I 00. 1001. _ _
90- 9,01 , % $t
801~~~~~~~~~~~ 0
~~~~~~~~~~~~6 ~ ~ ~ ~ ~ ~ ~ ~ ~ 6-'7- - -- 2 0 - - - - - - 7
0-
6O--- ---- - --r -r- -1- -. O_ I 1 _
a
40 - ff- - -- - - - - - -. 0
_~~~ -
205. tt/ ? a - -A -- ' -o /- - *.2O
810 1 --- -- a 1 0"
"40 I ~____ __ I_ I I I 1 40g
0- L _-I- ' I ;L. I . I a9 o-0 20 40 60 80 100 120 140
PARTICLE SIZE (um)

.~~~~~~~~~~~~~~~~~~~~~~~~~~~~~~~~~~~~~~~~~~~
4.6 m .x 690 o ~on \ ~~~~~~1'280 tpd _ lll23 Lv
TARTOUS CEMENT - Kiln No. 4 *6
-Simpli fied flow-sheet O"GWEE10 | _
.* s~~~~~~~~~~~~~~~~a
MGND~~

-112- Anex 4Page 5 of 9
TARTOUS CE1MET PLANT, COOLER NO: 4, *EASUT OF EAUST GAS FLOW
Gas flow measurement
Plant TbRt0c'P e4X,A.#
0 IRecord Nr Date: 4 1 7; viS..OMoasuring location f 0i,- p A& wA Time /I2o _-c,.,
Size of channel A&on (mm) Gas flowArea A &.fZ Cm)Barometer ') b v .7m1 (mbar) V (Actual condition) -Statlc pressure2) Pst IL (mbar) A. 27,24 ' 'F.T'c (m 3/s)
Absol. pressure* Po 140 (mbar) V P P0
Gestemperature tG /9 (C) VN (Normal conditlon)-
Gastemperature TO khL (K) 273 PDensity (wet) P,, .4.(kg/Nm2) V2.-, - . (Nm3/s)
To 1013
Va .OX2 27 .24V 4' * _ __6 (m'Is)
273 ___
VN '. vG 36000 .3 -(Nm*/h).44± 1013
Measurements AP1Nr * * d Poe. AP , P2 AP1- AP2 Api V'-'I
AP2 ~23 ) ^ "O (^d t YF4 (mbar)
- - -
A _
-ZXJ: - rr kJrX. I ~ L -r oQ 0 Y *.r t ~~~~~A.0 g.r
- s .- - -- - -
- -e* - - -W -r - -.*
- - - - a
_~~~~~~~~ p- - - - - --
_ _ _ = ~~~n !I VA PlVw
1) Conversion factor mmHg . 1,333 mbar e°bI\ __ _
2)Convorsion factor mml0 * 9,807*10ambar /48 A' J/t
3) 8e Table overhsaf - e- * fdr'C
32106e

-113- Annex 4
Page 6 of 9
TARTOUS CEMEN PLANT KILN NO: 4. RAIATION WS$ MESR NS..
Radiation losses measurement Jut TAeyvvI
_ >X: ~~~~~~~~~~~~~1te.J .$ s°s Shoat Sr:Keasrwent location: *kt A l /E0w .i IASkeh of nwltg . .; . 7.;. ,,,_ ._I . ... -- *
r. ; . .. _
.r /_.7 * -7T- ;, -'
. _ .. *- I- *-- ,.2 . .
. . b;nt.t.m,:J C~ loc±tY: 0_/ i1Y1t74acadz. . ;;h*T.r*--- -- -_____
wpoint q. ._-3- ° .Y-in- w- a. -,c V/ 2| - V-
. ..jErs ~ ~j.Ar6>.i~7 - 22 . -6. .
~-7I
( ( () ;, . V Z/ . ... ... _..
TOW radiati loa0 -9.2 2d ..__ . ._ .i. ;_
.- .. .;__* _.,.-.... .... '_ ./0*.... / ...*- - r
.- '~ .. . ._. . ' .t- j .. 'th Wi XOO _ ~.-- ~* 1~_i--' _
~~~~~~~~~~zi..... M... -t -..... _.__ * 4_. ._ i -w - - -_, -1 ;.... -. _ ... . -- # _ _AR _ . _ . J4.r. ___1jI. .'
. ._. .... __.. ._.. _._.. _._.... ___._ , _ ______ *_*
. ., . _. ._. _ . *__~~~~~~~~~~~~~- . I
,~~~~~~~~~~~~~~~~~~~~~~~~~~~~~~~~~~~ . To5a^o oez6 +illk l
OGYiBUS: ~~...- . _-4 -.. - -- ¢ _ _. ...
.- . - ,-, ,-- - - ..-- * ....... -..
.~~~~~~~~~~~~~~~~~~~~~~ * . j *
~~~~~~~~~~~~~~~~~~~~~~~~~~~~~~~~~~~~~~* _ - I

_ _ I .
t tZ2S w wvws ,2 N , tPh£
3'050 all 19 Blai-,eo
TA;ZTOUS CEMENT - Cement Mill No. 4
*1~~_
-Simplified flow-sheet a {E .{s... .-rDC

Amnex 4- 115 -
Page a of 9
TARTOUS CENENT PLAT, CEMENT KMI NO: 4. GRAIN SIZE DISTRIBUTION.
PLANT: 7-T7V areANr
EQUIPMENT :e Co A MMA,. V/ N (AITEST: GRAIN SIZE DISTRIBUTION ITEST NO.:DATE : / i. *?, VISUiM m ORDER NO.
W.TERIAL _ _ _ _ _ _ A",/__TEST NO.
ce- - ->0 - - - - T- :_-
evelf,. AC L -=
. i- _ - - -. ~~ I$, -2 - -O - ___________ .
SE. .__ - - -. - - - - -
/t-- -- -o- - -7 -
-... -
2I2. _ a _ = _- - - - -- - -=
2- 80 m ---- H
100 W b - * U k3iEo
90 - - - -GRAIN SIZE-

- 116- Annex 4Page 9 of 9
TARTOUS CIEENT PLANT, CEMENT MILL NO: 4. MEASURESM OF MXHAUST GAS FLOW
Gas flow measurement
rwide- Plant 7."v, elfrl /A/ 7
Record Nr Date: /,a. 6.jI4 Via. GMeasuring location e- '-e. A 4 e .04 Time // -
Size of channel ?Sei2La (mm) Gas flowArea A *ZI (mW)Barometer 1) b /dry (mbar) VG (Actual condition)Static pressure2 ) Pst - .L (mbar) A. 27.24 \ (m3 /s)Absol. pressure P0I 9..±t (mbar) VP P0
Gastemperature to /tr (OC) VN (Normal condition)-Gastemperature T(I IO (K)Density (wet) Pnw °,1 (kg/Nm3) VGa- 2 - (Nm3Is)
To 1013
VG - 27, 24.24\ * /6 ,f tm3/8)
VN IlL.~ 3600 e it? (Nm3Ih)VG~~~L 1013.
Measurements AP1Nr e d Pos. - -i P2 2P, 9;;
;- 3 - -(mbar)ol~~~~ IJ4 - _r ,- _ or o- -Ar o. -or 0
__ 7 4 4 __
- - pf -+ O.C -__
_~~~~~~ .
- -- - -r - -
@~~~~~~~~~~~ o,r I o.?:r
- - ~ ~ ~ ~ ~ -~~~- --
-L - - *4 - _ _ 0. r -AA2r
~~~~~~~~~_ _ _ _ __o.r_________ 0
>J __ o ~~r het o- -I- - .&r .&r pi
1)Conversion factor mmHg * 1,333 . mbar2)Conversion factor mmH20 9,802 10d mbar3) Se Table overleaf
32605e
4, ,.'*

ANNEX 5. ARABIAN CEMENT COMPANY (SHEIKH SAID PLANT) -FLOW CHARTS AND TEST RESULTS

to EP
1lu-estone V V'+ basalt I
+ sand l
.. > _t | r l to silo |I |in|r~~~~~~~~~~~~~~~~~
auxiliaryfurnace 4I'm x9,
(not in 13 poperation) I
fromn kiln_
ARABIAM CEMENT - Raw Hill to. 1 I
- Simpified flow-sheet . O|E
.-wN .'

*Annex S- ii, - nxPage 2 of 12
ARABIM CEHNT (SHEIKI SAID PLANT) RAW MIL NO: . GRAIN SIZE DISTRIBUTION:
EQUIPMENT: 04,71ZF ITEST :GRAIN SIZE DISTRIBUTION ITET NO.:DATE * /4, d.J°' VISUM: ORDER NO.
MATERIAL ̂i,d4w4. 7e Af, _ g f!_k AarTEST NO. - -
(VRFA0 9 24''
SIE 5L~ SIDUE--OPENING - 7 =
Al A-. a
_ ~ ~ -_Z L.r - . - 2r.o -
- - -_
so- - - a a 60 .7==
30~~~~~~~~~~~~~~~~~~'
5oo, 4 -. - 6.> a . -S _ _
20 .. _ a _ =a
50 n -- -
4t0 -7 -, -
5 -20. - - . -l - - I .1 _______ - - a
0 I I 11 1 1 1 1 11 a ; -- I a . ' '2 3 4 6 8 10 20 40 10 200 400 1000
GRAIN SIZE

-119 Annex5Page 3 of 12
ARABIMN CMENT (SHEIK SAID PLANT), RAW MILL NO: 1. SEPARATOR PERFORMANCE.
4f ]t ~~~~PLANT : ,4flo8J/tote--A^81
Sg7 ~EQUIPMENT : a AtYl A.v ,.
TEST : SEPARATOR PERFORMANCE TEST NO. :
DATE : /. .4 tSUM: ORDER NO.
.____________ X PASSING CIRt S_ ~ ~ ~ ~ ~ ~~~~CR. SEP.FEED COARSE FINES LOAD EFF. SELECT
PARTICLE SIZE a &a r 'a f 4 f u tp
_ _ _ _ _ _ _ _ _ O X _ _ _ Ž[f j _ _O h . _
_ _ _ _ _ _ - - 41 2 , - 2 J , _ _
_ _ _ - -~~~~~~~~~~~~~~~~~~_
w ~ __ -. -2 -. ___ -9. __ -, - =
19 EA bt -. -, -o 11/0 .9o -
AtZV 4Zt 14: V. v 1,o9 Vll .
omo E t. 4S_p. ,8 42=
. _______ -z. L tt - IL. /0 ,l _ __
__T__ _7___ ,,s =i
90. =9=-
__so - -l o- -
O0- - -0 - _-
so~ ~ ~~~~~PRIL SOE um
30- 30 -- a
0 Li ~ i -/U
2b 40' 60 80 '100 120I 140 00
90. -- goARICE IZ (m

1
. j < ~~~~~~4,0 m p x 60 m rT- -- ^ s / ~~~~800 tpd . -1r 2 |3 |4 | 5 IO
\( ) l 7V4- ~~~~~~~~i 'a
ARABIAN CEMENT - Kiln No. 1
- Simplifled flow-sheet RN I rE I iUiE_____________ ____________ _____________ ___________ A Omwo .

- 121 - Annex 5
Gas flow measurement's of 12
Plant fAoJAA .4eT, VC7-/Iv ?,'A
Record Nr Date: /6. 6 Via. eMeasuring locatlon k, 4, .do w,A Time /1hr- 14,^0
Size of channel + .i.o7 (mm) Gas flowArea A f... (m2)Barometer 1) b U.b (mbar) VG (Actual condition)Static pressure2) PS .. L (mbar) A * 27,2 4 \ . G *(-'Absol. pressure PG .3. (mbar) V P0 V
Gastemperature t0 .J3L.. (OC) VN (Normal condition)-Gastemperature To M-L. (K)Density (wet) Pnw 41 (kg/Nm3) vG. 273 Po (Nm3/s)
1,1t ("4 QT ~10 13
V .G LL.. 27,24 , 6/t (M3/')
VN - Vo * tO1 3600 (Nmr/h).4 ~ ~ zL- 1013
Measurements |ip 1
Nr e d Pos. AP, LP2 LPIp.+ P2 ap^ ~~3) (^ga) (&, *,2) (t. }2?) (mbar)
z - . -, - - -
- - -~~rl -p, - d--
I Cne -sion af m r -
-~ ~ ~ -s- tw/ 9r v
2) Cersion ftr -a . m
*~~~3 Se Taleo__ t

122 Annex 5Pae. 6 of 12
ARABIAN CEMlVT (SEIKEU SAID PLANT),* KILN NO. 1. RADIATION LOSS MEAUREMENTS(Shoot No. 1)
sketch of fmItam .-
section length 0, C3 - am tamp opoint U s2 -0c.- WM? k ___
P?1 ZJA. /At -
1?2 /21 .
Z4 4. 14t0
Mp-~~~~~~~~~~~ -
I - j~~g -2G- /a0v --.. &0 -,Po~~~~~~~~~~~~---
I..~~~~~~~.2
22? 8*; ~~2I/0 ~:~:.
CC*M%T."§f.. $
I)~~~~--

-123- An5Pane 7 of 12
ARABIMN CEET DMEI SAID PLANT), KILN NO: 1 * RADIATEION LOSS NESIMNS.(Sheet No. 2)_____________
Radiation losses measurement Pimt: AL4IA~4,v4A a#.,1.'rn
- -.. : ... : - - - *>60) sbetrr:
ambient tnp. s- W 0-C Velocity: I aImiasiitv factorj..-L -- t7~
.omtion lenqb %D iwne temp ocpoint a a 2 C- V/u2- kV -
- -0 - r*
.Ar /7 .
?tax M.iation loes.. J'ti 26 A C.

I PAJ = d ____ 4 I
I ' . ut ==ll' (lO r 1---
clinker ..l
+ gypsum to silo
+ pozzolana
80 tph 2 t _ iH > 0
2'800 cm /g Blaine
ARABIAN CEMENT - Cement Mill No. I 0- Simplified flow-sheet WE
, _ - o|io-~~~~~~~~~~~~~~~~~~~~~~~~~~~~~~~~~~~~~~~~~~~~~~~~~~~~~~~~~~~~~~~~~~~~~~~~

Annex 5-125 - . Page 9 of 12
ARIABN ClEENT (SHEIKX SAID PLANT), CEIEN?T J 0 NO: 1. GRAIN SIZE DISTRIBUTION.
PLANT: ,4t/AA eEmEmr - A ASFP1 0 1@ EQUIPMNT : ~_ o AI./S @ ITEST : GRAIN SIZE DISTRIBUTION TIEST NO.:
DAtE:; /71. d. II ivis: ORDER NO.:
MATERIAL 4- d'w',4* * 4WWa9s eapA -, 'd4 |qlAa dgeo TEST NO. A - - -
t2K1E Tff| IrI - r - - - -_ r§
OPENIN I, 4 f I - , -
S-- - --- -
- - -I- -- I -- - - -
Of .? F it.t .ar I I
_ _ _ _ _ __ P9. l I 'J 1
A, 4 _ 4./A. -- -- =
.. ___ =~ =I_ __ =-_rfl A -v2 -. .o' - .f o.t
-- X ---- -= -
, . a
10uY - -1 S__ 1 - - a -' -1a
w0r IITT '1*1 U T
sSr 50 - - - - - - - a' - a1! 111 1
4 0L-_______ I :1YT1T
20 - .______-- a a i- 11
2 O~ _a _ a a _ a _ _ _ a *a-*||.
12 346810 20 40 10 200 400 1000GRAIN SI2E

Arnex 5- 126 -. Page 10 of 12
ABi N CEMNT (SHEIH SAID PLANT), CMmNT MiMJ NO..1 MILL PEREORMANCE.
(HOLDBANK PLANT : 4,4>AAIM C&fWA0e7r - 4,fAAV
PROCESS TECHNOLOGY EQUIPNENT : i // A.
TEST :MILL PERFORMANCE TEST I TEST NO:.
DATE At VISUM : '_*OROER NO:
SIEVE SIZE _
SAMPLE NO - 6? 90, |/tJ 2/e_ - - - _
a'.,. r 10,E 6f.o tV ?As - - -z -
- k -i.
4, 0.r SC 7./ ' l.AS Io
o 4 _
4 - &L4 4.1± .. V .L IL . = *z. z VZt _ = = = =~~P. -900 3.402 U.2 -I~~~~~ -x t t w/.e - --
- - 30 - - - f-.
70a 3600
60 - - -I a I280080 [ | | < § | | 1 1 | | | * l 3
so a - - -_ -_600
| 40 -- - _T 1]00
3 0} a a a i a a .22 - 11100 ' .,
40 2020 a a- a --- .2000 '
la-- - a - - 10
1A ' ~ * /

-127- Auex5
Page 11 of 12
ARABIAN CEMENT (SEIDKH SAID PLANT), CEENT MILL NO: 1. SEPARATOR PEEORIMANCE.
4f }t ~~~~PLANT , h X>e^o.awo7 t,p,*
EQUIPMENT * ,rl - 1.TEST : SEPARATOR PERFORMANCE TEST NO.:DATE : /;k e. P; 1- VSSUM : OROER NO.:.
________-__- t PASSING CSRC._5E?.
fEED COARSE FINES LOAD EFF. SELECT
PARTICLE SIZE a 4a r -r f d f t
___ __ __ J4 4. _ $.*E .
6t ,^ 0. 0 tz > X,9 ,A00 ai2_
_________ __2Jr t .t G ___
_~~ - -t . /.L "X _ ^
_ ~ ~ ~ ~ ___ __4?2r . .iJ9
GDp Rtt 62.w 9f.o __ fr.v~~~~~~~~~~~~ _ {7f
_______ $. tA9., 2,*2 724': _
____ 6/. __ _
. _-
.4 w 2,$2 A
lo _~~~~~~~~~~~~'290. Av - - - o
I I I !
70 2 - -6 8 1 70 1
60.TICLE SI2£-~~ -----u - -60 UI. ~~~~~~~U.so. - i. ...
40 . _- 40~
30. 30I
20. I~~~~~~~~~~~~~~~~~~210 - .........- - - -
0 20 40 rp 60 so 100 120 140
PARTICLE SIZE (um')

-128- Anne 5Page 12 of 12
ARABiAN CEMENT (SUMIS SAID PLANT), EASUR T 0 ow BoND Cn MILL
Gas flow measurementPlant AXA4A CFA4 EN r
0 Record Nr Oate: /; d. / VI$. 2Measuring location 4 Pe- Tlfn,- j: 1 9 Time 0tjo -Oro
Size of channel 1IhL (mm) Gas flow
Area A . 4l ((ms)
Baraometer 1) b 92J0 (mbar) Va (Actual condition) .
Static pressure2 ) P, - /° (mbar) A 27,2 \ 0
Absol. pressure Po ?.°g (mbar) V P, %Gastemperature t0 ..J°L.. (0C) VN (Normal conditlon)-Gastemperature Ta JtU (K) 273 PeDensity (wet) PnvL- (kg/Nms) V. - . - (Nm3/s)
T(I 1013
vG -72 °OI 2, 4ar 7, f (M3/8
VN ' Va 2*3 -A&- 3*600 ( IA' .(Nm'/h)___ 1013
Measurements AP,A P2 2 V-pP
3) (It AJ (&.S ly, 4--mi 4.o (mbar)L- a
- - - -r r -E2 /t I = - J X r ?Pr- -_ - -___
sv ___ - - ^ Do'r A
ZZ e X r X sr o. )r
a) Se Tal over ea
_ _ - _ _
a = - =
1) Conversion factor mmHg *1,333 -mbau
.2) ConversIon factor mmH2O B,80?*1d- mbar3)See Table overleaf

ANNEX 6. ADRA CEMENT PLANT - FLOW CHARTS AND TEST RESULTS

To kiln EP
.~~~~~ I I 1>W
limestone 1*' + Marl | 1to silo+ basalt ( 1''E
from kiln
ADRA CEMENT - Raw Mill No. 3 *
- Sipliffed flow-sheet

- 130- AAnnex 6Page 2 of a
ADRA CEMENT PLANT, RAN MILL NO: 3. GRAIN SIZE DISTRIBUTION.
PLANT: AjA IeJAtExr
j6H@mbm~ EQUIPMENT O 4, MY ke 4' I |ETEST:GRAIN ISIZE DISTRIBUTION TEST NO.DATE : 7. .6. ' |VISUM ORDER NO.
MATERItAL 1.W d w A. "", w- cow4'4 v* 1* Asw ./ tEST NO.______ =_CUeVF ms. f - 2 S - -
E0SIWUE
2Z ".- - -so 4 -=j
7* -= vJ:mt _ {2.Z=
70.~~~~~~~~~~~~~~~~~~~~~~~~~~~~~~~~~~~~~~~~~~~~~~~
_______ ._ = -__ _ _ _._
~?. = ==
so -- -- - - -
$"o. to./ - 7 .0 .- 20J-.r .- o
2(0.-----
L _&. e.Z -=.AC..# _ -
,zo---~~�-- -- -1' -111
1004. _ _ _ _ _ _ _ _ _ - t - -
930. __ _ _ _ _ _ _- _
70 - - - - -1 1 1 - -s!l s T 1
' 60.. -
. _ 2 _ i-02
GRAINI S

2Pd 2 I 3X 4 1 S
ADRA CEMENT- Kiln No. 3 0
- Slillfled flowsheet it E I NWE

-132- Annex 6
Page 4 of 8
ADRA CEMEN PLANT, KILN NO: 3. RADIATION LOSS MEAUREMENT.-
:.Rardiationio,ts,es-measurement4-.ut 73A7JA
_________ m ato ofva ter
a 22~~~~~~~~~~
_____ p.litt- a~~~~ .Ar juaA -,w t- - - - - - I~~~~~~~Iy
I * I~~~~2LC 2~_LZ
____ - ___ ~~~~2ii A 49 J*- cry ~ i
I ~~ I.. *~~ .~~-I ~* I. I? .Iji
7- ~ W 4
I ___ _____~~~~~_

ADRA CEMENT PLANT, CEMENT MILL NO: 3. SINPLIFIED FLOW CHART.
cl inker CT'{ t sl
+ gypstu to silo
+ ozona
*1~~~~~~, m." 0 x 14I70 tph.
it
2'800 cm /g Bla6e
ADRA CEMENT -Cement Mi No.3
- Slifl1i1ed flow-sheet E_NEhI M's n
IN raE

-134- Annex 6Page 6 of 8
ADRA CEMENT PLANT, CEMENT MILL NO: 3. GRAIN SIZE DISTRIBUTION.
A EQUIPMENT: A.6R4C6 O,vF
I TEST : GRAIN SIZE DISTRIBUTION TEST NO.:
DATE : r 9^. VP L TYISUM 4:I ORDER NO.
MATERIAL __V _ ____ *, * * 1
tEST NO. I 2
SIEVa - -- I a a -OPENING-- X n _ __90: l 0. ? t2. _ ,
=~~~~~~.L -
oZ __ / _~~~~~___ a -.
'l.r _ _
.AL - AL 0 .2 O o
________ =___ =
/a - a az# a a_ a
100.
90~I G-
60. __ ___
8 40. _ _ a - _ _ a
30 - [t
20. _ Irm
I" _ Xrk li I I'_aT 1 1 1 T. 2 6810 20 40 ibO ' 200 ' 400 100'0
MRAIN SIZE
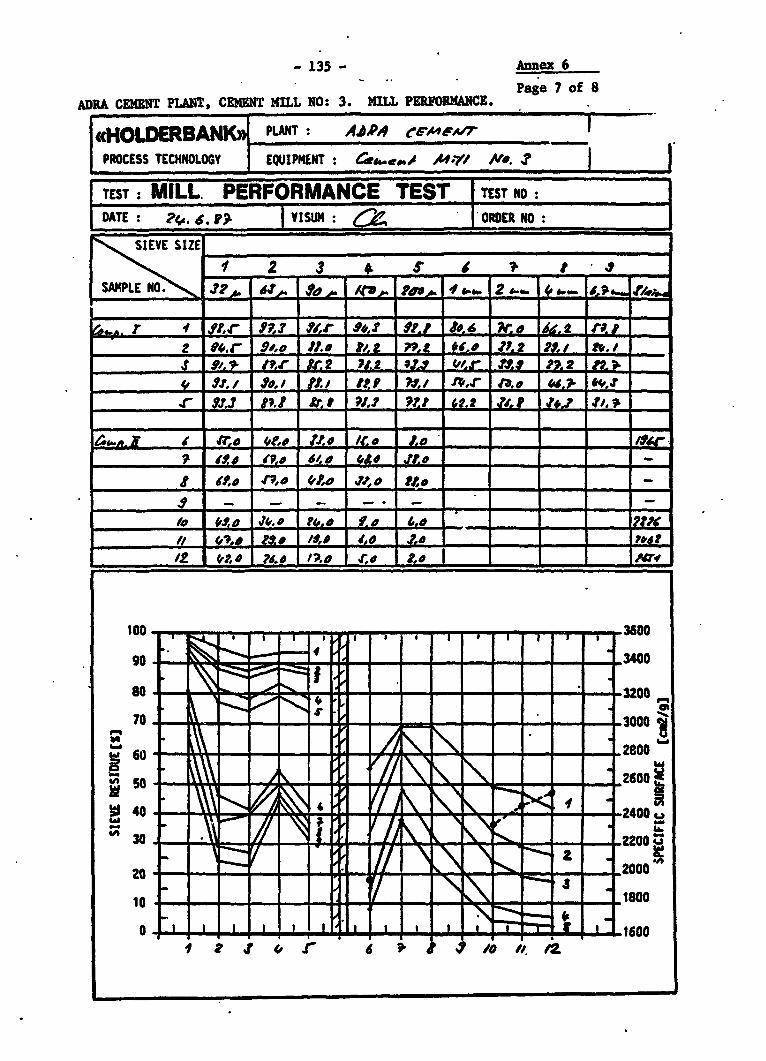
-135 - Annex 6
Page 7 of 8ADRA CEM1T PLANT, CEMENT MILL NO: 3. MILL PEEpORMCE.
(tHOLDERBANK))PAT { F __PROCESS TECHNOLOGY EQUIPM4EN .V of ,.g
TEST: MILL. PERFORMANCE TEST -TEST NO:DATE: 7e. 6. . fVISUN: ' ORDER NO:
IEV SIZE _
I N 1 2 3 5 S 1 . S SAMPLE NO O S | 2_ tw
- --r - -I-- -I-C . r I 47, 274 $x So,t $Z. k0.6 Ar. o n at. .
2 #4 Si,o Jt.u Stz ?P *° 7*'D - - -s 3' '. 2 g i IL .fl. 2 .0±.I.I/ Lo,/ £ p P .L, &,t. P. v. .=
~&L....... #,3 t..t AL. 't t2±$W,;.. - z. - - -o
= 4r 0 m. I. ==;~~~ a m -. -0 +w 20 t0 20
t d. 4P,o 4',o __, tJ.o _
. ~~. _'~ Lt± _ k± _ .L. _±. - - -
~~ ~'%Di .LL4.0 ~* - - - - 74/2 #'ZE 74$. /.,o 4o 2,o - - -
sot - - l . - -- - . l l -3
wot tit H T 1 I T I 1 1 I f~~~~~340000so - - - - - -- - - .3200
70 3 - - - . - - - - - .3000
60 - - .2e800
SO - -0
40 -
20 - -~~~~~~~~~~~ 2000~
10 _1800

136 - nxex 6ADRA CEMENT PLANT, MEASUREMNT 0 GAS FOW BEYOND CEMENT MILLPage 8 of 8
Gas flow measurement
uldrbanld Plant AJPA c ew T0 Record Nr Date: 26 . t Vl. C4Z
Measuring location .4,- /,4s, a/- Y.. .. i Time ,//n - 1r
Size of channel I. (mm) Gas flowArea A ,j tm2)
Barometer') b -9.. . (mbar) vG (Actual condition).
Static pressure2) it Z tmbar) A. 27,24. \ ( m/s)Absol. pressure P .IL.(brGastemperature ta /. tC) VN (Normal condition).
Gastemperature To (K)23 P (K)
Density (wet) Vo.- W- (Nm3/s)To 1013
va .0,1 27 .24 \/ ?go t (M3/s)
VN VG - .?1 , 3600 , 20' odO (Nm3Ih)
Measurements AP,
Nr e d Poe. AP, 'aP2 AP'P2 PI Pi3) _ Af h ( to ) ("i #o tmbar)
- - - - -fr S^r sr- Jo9Sr v rz
_r _ 1 ___
- _ .... . .....-
_ _( - _ _ _ _ _ _
H ~ S aa ______
- -- n -r H- 1-3 -
- -r - ar -r - -
_________ *,V5 _ ya;
')Conversion factor m mHg .1,333 * mbsr2) Conversion factor mmHO * 9,80T?11. mbara) See Table overleaf