world pistachio trade 2017 - apg power...3 introduction the 2017 world pistachio trade report...
TRANSCRIPT

WORLD PISTACHIO TRADE
2017
Schramm, Williams & Associates, Inc.
October 2017, First Edition

Copyright © 2008 through 2017 Schramm, Williams & Associates, Inc. Printed in the United States of America. All rights reserved


Table of Contents
INTRODUCTION.................................................................................................................3
MAJOR PRODUCING COUNTRIES
U.S. - Trade........................................................................................................9
Iran - Trade.......................................................................................................16
Turkey - Trade..................................................................................................21
Syria - Exports..................................................................................................27
MAJOR NON-PRODUCING IMPORTING AND EXPORTING COUNTRIES
China - Trade....................................................................................................31
Hong Kong - Trade...........................................................................................35
Germany - Trade...............................................................................................40
The Netherlands - Trade...................................................................................45
United Arab Emirates - Trade...........................................................................49
Vietnam - Trade................................................................................................51
Other Pistachio Trading Countries
ASIAN COUNTRIES
India - Imports...................................................................................................55
Japan - Imports..................................................................................................56
South Korea - Imports.......................................................................................57
Russia - Imports................................................................................................58
Thailand - Imports.............................................................................................61
Singapore - Trade..............................................................................................62
EUROPEAN COUNTRIES
Belgium - Trade................................................................................................69
Cyprus - Imports...............................................................................................73

2
France - Trade..................................................................................................74 Italy - Trade......................................................................................................80 Luxembourg - Trade.........................................................................................86 Spain - Trade....................................................................................................88 Switzerland - Imports.......................................................................................92 Ukraine - Imports.............................................................................................94 United Kingdom - Trade..................................................................................95
MIDDLE EAST COUNTRIES Israel - Imports.................................................................................................101
NORTH AFRICAN COUNTRIES Morocco - Imports............................................................................................105 NORTH AMERICAN COUNTRIES Canada - Imports..............................................................................................109 Mexico - Imports..............................................................................................111 SOUTH AMERICAN COUNTRIES Brazil - Imports.................................................................................................115 Chile - Imports..................................................................................................117 Venezuela - Imports..........................................................................................118 SOUTH PACIFIC COUNTRIES Australia - Imports............................................................................................121 New Zealand - Imports.....................................................................................122 CURRENTLY APPLIED TARIFFS
Table 1..............................................................................................................125 TERMS AND ABBREVIATIONS.........................................................................................129
APPENDICES FAS GAIN Report - European Union-28 Tree Nuts Report 2017.........Appendix - A FAS GAIN Report - Turkey Tree Nuts Report 2017.............................Appendix - B FAS GAIN Report - China Tree Nuts Report 2017...............................Appendix - C

3
Introduction The 2017 World Pistachio Trade Report identifies major producing, importing, and exporting trading countries in order to clarify movement of pistachios traded internationally. The report’s statistics, for most countries, include calendar years 2008 to 2016. The United States export trade data is reported quarterly in the American Pistachio Growers (APG) newsletter, which can be found by accessing their website at: http://www.americanpistachios.org/apg-members/member-login. The Administrative Committee for Pistachios1 (ACP) provides data for U.S. exports and imports monthly for shipments from the states of California, Arizona, and New Mexico, but does not have the authority to obtain export data. In calendar year 2016 the U.S. pistachio industry exported approximately 320 million pounds (145,000 MT) and imported 2.4 million pounds (1,080 MT). Pistachio Producing Countries The United States and the Islamic Republic of Iran (Iran) are the global leaders in the production and cultivation pistachios. The Republic of Turkey2 (Turkey), and the Syrian Arab Republic (Syria) follow the United States and Iran in pistachio production. While Afghanistan, Argentina, Australia, Egypt, Greece, Lebanon, Israel, Italy, Morocco, Spain, Tunisia and the Mediterranean Islands also produce pistachios, most are locally consumed, with minor exports to countries within their respective regions. Pistachio producing nations are not typically thought to be importers, yet statistics show that the United States and Iran both import. Reverse trade for the United States is typically a result of re-imported domestic product that was exported for the purpose of separating the pistachio nut from its shell. This process allows producers to take advantage of lower labor rates in other nations, such as China. Other instances for re-imported product can be attributed to rejected shipments based on quality standards. Major Pistachio Importing Countries The largest pistachio import markets are Hong Kong/Peoples Republic of China, Vietnam, and Germany. Not all countries import directly from pistachio producing countries. Transshipments may occur for the following reasons: strategic trading purposes, quality issues, or evasion of domestic and foreign laws and regulations.
1ACP is a Federal Marketing Order for pistachios grown in California, Arizona, and New Mexico. 2 Most of Turkey’s pistachios are sold for ingredient purposes.

4
Major Non-Producing Pistachio Importing/Exporting Countries Hong Kong3 occupies a key position in the world trade of pistachios as the largest transshipper of pistachios, with most of its imports being re-exported into Vietnam. Germany, the United Arab Emirates and the Netherlands and most recently Vietnam also import and re-export a significant percentage of the world trade of pistachios. Pistachio Trade Reporting Sources Several government sources were researched for this report: The United States International Trade Commission (USITC); Eurostat, the European Union’s government database; Economia, a Mexican government trade database; the United Nations (UN) Comtrade database; the Islamic Republic of Iran Customs Administration (as reported by the Iran Pistachio Association); and the United Arab Emirates’ Federal Competitiveness and Statistics Authority. The UN database is the source for the vast majority of the import and export data detailed in this report. The United Nations obtains statistical trade data by requesting individual countries to report what they have imported and exported. Due to this methodology, discrepancies sometimes occur when comparing what one country reports as imported product with what a partner country has reported as exports. These discrepancies can occur due to the exporting country reporting the destination, but the importing country not reporting the shipment as imported due to transshipments to a third country. The discrepancies can also occur if data is improperly reported to the UN by a reporting government or if transshipments of products are misreported. Statistical Observations Throughout this report there are instances of large trade volumes that occur between non-traditional or non-historical trading partners. Where possible we have attempted to note these occurrences or provide explanation for trade exports that do not match trade volume imports and vice versa. Additionally, with each update of this report we revisit and sometimes revise previous years’ data to correct errors that occur from incomplete or partial data reporting by countries to the reporting sources listed above. For the last several years of this report we noted discrepancies with U.S. exports to Europe; exports that do not match their country to country corresponding import volumes. Generally, in 2016, the 28 members of the European Union reported importing a combined 82 million pounds of raw pistachios from the United States, while the United States reports exports of nearly 13 million pounds more, 95 million pounds. Circumstantial evidence indicates that these discrepancies are the result of transshipments between European and non-European countries, and delayed reporting by EU member states. 2016, however, is the second consecutive year where we are unable rectify the inconsistencies between the two reporting agencies. Additionally, according to Eurostat, European imports of U.S. pistachios are significantly down,
3 While Hong Kong is recognized as a territory of China, statistically it is regarded as a separate entity due to its
historic position as a transshipment point for large volumes of trade.

5
from 120 million pounds in 2015 to 82 million in 2016. U.S. data reports a more moderate decline from 102 million pounds to 95 million pounds. Trade reports from China continue to produce differences in export volumes to the United States. In 2016, China exported 701,000 pounds of pistachios to the United States (318 MT), while the United States reports zero imports from China. It is a common practice for U.S. producers of pistachios to ship in-shell closed pistachios that have not naturally opened to China to be artificially opened by local workers. A percentage of the opened nuts are then exported back to the United States. According to U.S. Customs and Border Protection, this product should be classified under HTS number 0802.51 or 0802.52, as the act of cracking, shelling, and sorting does not change the condition and/or value of the pistachios; U.S. statistical services do not report imports of the product when it is returned to the United States. Iranian data is sourced from the Islamic Republic of Iran Customs Administration. The trade is reported on the Islamic calendar year that runs from September 23 to September 22 of the following year. The most recent report covers 11 months for 2016, from September 23, 2016 to August 22, 2017. Nearly 256 million pounds were exported during these months and this number is expected to slightly increase with one additional month of export data yet to be reported. Iranian data also indicates that some 21.3 million pounds was exported to the United Arab Emirates (U.A.E.) (9,700 MT) and 10.5 million pounds to Turkey (4,790 MT). In recent years, Turkey has never reported imports from Iran. Iranian data, however, notes that both the U.A.E. and Turkey are re-export points. The U.A.E. is not a producer of pistachios, but is traditionally a re-distributor of pistachios. Since the establishment of the U.S. 2010 sanctions against Iran, the U.A.E. has only provided non-country specific total import and export data. Significant Changes in World Trade Informed industry members have stated that product enters from Hong Kong to Vietnam, as a transshipping point between Hong Kong and China, in order to avoid the Chinese tariff on pistachios. While China’s tariff on pistachios is only 5 percent, Vietnam enjoys duty-free access to China under the Association of Southeast Asian Nations tariff agreement. Total Vietnamese imports of pistachios for 2016 were approximately 166 million pounds, some 75 percent higher than trade in 2015 and the largest volume on record. This is predominately due to increased exports from Hong Kong to Vietnam. Additional product to Vietnam is being reported by Madagascar. Madagascar has reported sizable exports of pistachios to several countries in this report from 2012 to 2016, mostly notable exports to Vietnam. This trade activity suggests that Vietnam be re-categorized as a major re-distributor of pistachios. After two years of significantly lower exports, U.S. exports to China were more than double the volume from 2015 to 2016, moving from 13.7 million pounds to 32 million pounds according to Chinese import reports. While this does not match U.S. export data, when China and Hong Kong export data is combined, the United States exported 163 million pounds verses imports from the two countries of 169 million pounds. Regardless of the differing sources, the China/Hong Kong was without question the top market for U.S. pistachios in 2016. While the reasons for this are varied, some return of export volumes in the 100 million pound range can be attributed to exports in 2016 that were not inhibited by the port delays of late 2014 and early 2015.
6
Tariff Nomenclature Prior to January 2012, the U.S. Customs and Border Protection (formerly known as U.S. Customs) reported pistachio trade for three Harmonized Tariff Schedule (HTS) numbers: HTS# 0802.50.20.00 (raw in-shell), HTS# 0802.50.40.00 (raw shelled), and HTS# 2008.19.30.20 (roasted in-shell and kernels). In January 2012, the United States incorporated tariff schedule changes recommended by the World Customs Organization for several commodities including those for raw pistachios. As such, raw in-shell pistachios have moved from 0802.50.20.00 to 0802.51. Likewise, raw shelled pistachios have been moved from 0802.50.40.00 to 0802.52. The HTS number for roasted pistachios (2008.19), included with several other roasted tree nuts, remained unchanged. Three years of data are now available and this report provides, where possible, raw in-shell and raw shelled imports and exports as well as combined raw pistachio trade. Tariff Levels Under the 1994 Uruguay Round Agreement, each country committed to limit tariff rates for commodities to a specific level. These tariffs are also specific to each country and are known as bound tariff rates. Since that time, individual countries have unilaterally adjusted their tariff levels on commodities in order to spur trade or discourage imports. Tariff rates that are lower than a country’s bound rate are known as currently applied tariffs. A number of countries have been selected that represent key and potential export markets for pistachios and are organized in a table that includes details on their tariff, tax, and other duty information. The tariff data is the most up-to-date applied tariffs data available. Possible and Future Tariff Rate Adjustments As the World Trade Organization multilateral negotiations continue, as well as free trade agreement negotiations with and Europe (Transatlantic Trade Investment Partnership), the tariff table on page 124 of this report will be updated to reflect the currently applied tariffs as agreements are finalized and implemented. Aflatoxin Levels According to Codex’s report on the Fourth Session of the Committee on Contaminates in Food, April 2010, the maximum aflatoxin level for “read-to-eat” tree nuts is 10 µg/kg, whereas maximum level for tree nuts for further processing is 15 µg/kg. While some countries follow aflatoxin levels as established by Codex, others have set their own maximum aflatoxin limit at levels either higher or lower than Codex’s standard.

7
Major Pistachio Producing Countries

8

9
U.S. - Exports (all raw and roasted)
(in metric tons)
Country 2008 2009 2010 2011 2012 2013 2014 2015 2016
Hong Kong 14,371 25,898 26,960 31,902 57,052 55,983 33,992 15,484 70,320
Belgium 17,566 19,103 15,088 10,223 13,261 11,693 16,761 17,704 17,100
Canada 7,589 4,984 8,626 13,502 14,825 17,205 16,850 14,413 12,213
The Netherlands 11,753 12,515 11,850 8,933 10,580 7,607 11,048 8,473 7,715
Germany 7,897 7,073 6,446 5,833 5,610 9,163 8,615 6,942 6,222
Vietnam 127 202 47 68 34 459 1,195 902 3,945
France 5,394 5,082 5,064 4,205 3,929 3,205 4,342 4,185 3,816
China 12,968 11,244 8,113 10,607 16,199 11,100 4,294 3,511 3,792
Israel 195 2,420 4,572 4,208 3,348 3,199 4,401 2,238 2,716
Mexico 2,943 3,635 3,069 3,675 4,092 4,146 3,966 3,041 2,712
Spain 3,690 4,191 2,697 1,931 2,804 3,686 3,415 1,817 2,278
Italy 3,532 3,664 2,373 3,789 2,415 2,282 2,525 2,267 1,886
Japan 2,621 2,593 3,202 3,167 2,722 2,907 3,572 2,479 1,665
U.K. 2,681 2,654 2,682 2,058 1,704 2,288 2,352 1,733 1,632
Australia 1,927 1,974 3,000 4,414 4,265 5,257 5,528 3,470 1,629
Luxembourg 4,732 4,736 4,950 1,999 3,917 6,176 1,554 2,317 1,486
Saudi Arabia 43 138 127 401 576 1,068 1,196 848 1,211
Turkey 0 278 547 2,729 1,812 1,527 2,189 878 1,116
South Korea 370 709 681 1,377 1,130 1,394 1,249 926 669
U.A.E. 561 2,123 1,104 1,649 2,706 2,628 1,568 1,156 582
Russia 2,534 1,695 654 1,603 2,276 3,682 1,528 0 0
Other 17,840 12,670 11,061 10,843 10,724 12,739 12,658 7,838 6,918
Total 121,334 129,581 122,913 129,116 165,981 169,394 144,798 102,622 144,705 Source: United States International Trade Commission.

10
U.S. - Exports (roasted - 2008.19.30.20)
(in metric tons)
Country 2008 2009 2010 2011 2012 2013 2014 2015 2016
Canada 5,700 3,665 6,764 10,703 12,867 14,498 14,336 12,661 11,256
Mexico 1,611 1,596 1,759 2,663 3,138 3,442 2,640 1,836 1,666
Australia 118 57 143 305 887 2,119 2,229 1,573 722
Japan 140 215 178 415 453 561 467 385 367
Hong Kong 2,543 1,488 3,075 3,339 3,097 5,084 3,290 881 360
Taiwan 0 0 52 21 27 281 590 328 301
Philippines 117 20 20 55 27 13 30 203 254
China 334 316 741 825 151 295 439 561 251
Norway 348 363 293 251 0 0 0 0 244
New Zealand 73 23 73 69 0 208 337 235 127
Colombia 41 3 51 24 160 526 322 22 108
Korea 20 19 23 211 141 171 185 150 92
Guatemala 24 14 34 14 29 77 63 76 79
Panama 21 10 31 6 14 43 37 77 76
Costa Rica 26 9 48 11 22 72 21 88 73
Chile 66 83 113 15 184 144 129 1 64
South Africa 26 11 26 114 98 227 33 93 41
El Salvador 10 7 6 2 12 27 32 31 27
Honduras 18 12 17 7 6 39 42 22 24
Vietnam 5 124 26 28 0 32 43 69 23
Dominican Rep 26 19 88 7 23 16 33 23 21
Brazil 82 44 28 43 232 253 171 109 17
Venezuela 43 65 46 0 88 5 71 10 9
Spain 65 42 64 0 39 160 474 10 4
U.A.E 0 127 21 14 191 566 99 2 3
Turkey 0 0 160 346 480 420 1,149 349 0
United Kingdom 630 413 434 326 319 1,079 529 298 0
Belgium 1,413 509 79 709 1,964 873 37 212 0

11
Israel 13 92 141 471 187 200 120 194 0
India 197 110 0 7 129 14 27 59 0
Qatar 0 0 0 0 0 149 69 3 0
France 1,355 1,594 346 20 64 440 465 0 0
Saudi Arabia 0 22 27 0 32 179 215 0 0
Iraq 0 41 0 34 0 0 193 0 0
Netherlands 896 1,211 248 259 43 150 190 0 0
Switzerland 53 97 327 319 56 184 86 0 0
Oman 0 0 17 68 51 148 15 0 0
Libya 0 0 0 94 83 202 0 0 0
Italy 412 644 119 58 42 54 0 0 0
Luxembourg 0 0 0 0 116 0 0 0 0
Russia 387 0 0 0 80 0 0 0 0
Germany 2,312 2,971 3,487 1,531 12 0 0 0 0
Jordan 0 0 200 137 0 0 0 0 0
Ukraine 100 70 39 31 0 0 0 0 0
Greece 494 19 20 0 0 0 0 0 0
Romania 80 80 0 0 0 0 0 0 0
Other 668 307 204 168 202 452 270 193 161
Total 20,467 16,512 19,568 23,720 25,746 33,403 29,478 20,754 16,370 Source: United States International Trade Commission.

12
U.S. - Imports (in metric tons)
Country Description 2008 2009 2010 2011 2012 2013 2014 2015 2016
Turkey
Raw In-shell
Pistachios
101 84 52 48 84 62 113 169 201
Italy 0 0 0 0 0 0 0 0 0
Canada 0 8 0 0 0 0 0 0 39
Thailand 0 0 0 0 0 0 0 0
Greece 18 0 0 0 12 18 0 55 24
Other 8 0 0 0 447 19 0 3 15
Subtotal 127 92 52 48 543 99 113 227 279
Turkey
Raw Shelled
Pistachios
53 7 28 73 86 98 39 110 118
Italy 9 9 16 0 0 1 1 1 12
Canada 0 0 0 0 0 0 2 0 0
Thailand 0 0 0 0 0 0 0 0 0
Greece 0 0 0 0 0 0 0 1 1
Other 273 162 415 1 86 3 0 26 34
Subtotal 335 178 459 74 172 102 42 138 165
Turkey
Roasted Pistachios
92 94 124 192 192 275 170 172 208
Italy 89 51 109 136 161 153 208 182 155
Canada 46 30 54 31 106 39 16 240 116
Thailand 11 37 12 68 29 29 24 22 106
Greece 2 1 1 1 1 2 2 18 7
Other 22 5 10 17 22 23 62 77 42
Subtotal 262 218 310 445 511 521 482 711 634
Turkey
Total Pistachios
246 185 204 313 362 435 322 451 528
Italy 98 60 125 136 161 154 209 183 167
Canada 46 38 54 31 106 39 18 240 155
Thailand 11 37 12 68 29 29 24 22 106
Greece 21 1 1 1 14 20 2 74 32
Other 302 167 425 18 554 45 62 97 91
Total 724 488 821 567 1,226 722 637 1,067 1,079 Source: United States International Trade Commission.

13
European Union 28 - Imports from U.S. (in-shell and shelled)
(in metric tons)
Country 2008 2009 2010 2011 2012 2013 2014 2015 2016
Belgium 12,922 9,562 5,619 6,131 6,708 6,128 4,783 6,347 8,124
Luxembourg 6,501 9,672 19,092 11,264 7,984 9,149 14,825 20,987 8,123
The Netherlands 12,660 11,951 9,683 7,381 8,880 7,879 7,646 8,522 6,786
Germany 7,637 4,171 3,831 4,142 5,681 8,989 12,239 9,187 5,140
France 4,514 3,827 4,408 3,219 4,591 3,660 3,869 3,135 2,999
Spain 2,895 3,342 2,456 1,766 2,548 2,853 1,890 2,082 1,819
Italy 2,336 2,796 1,898 2,701 2,650 2,558 2,706 1,962 1,393
U.K. 1,805 1,684 1,482 1,328 1,155 1,226 1,541 1,266 1,258
Croatia 25 1 n/a 59 92 55 75 22 443
Cyprus 438 191 274 186 156 61 98 34 271
Lithuania 214 59 80 20 20 100 298 320 260
Portugal 369 206 113 186 154 64 79 71 188
Poland 174 77 59 217 77 52 263 131 133
Bulgaria 268 172 173 150 116 107 118 87 64
Greece 1,385 1,872 1,912 517 232 96 165 35 39
Sweden 146 152 152 472 654 251 112 177 25
Slovakia 0 0 0 0 344 340 729 0 0
Latvia 325 20 0 0 19 0 0 0 0
Other 230 61 4 20 5 10 0 0 208
Total 54,844 49,816 51,236 39,759 42,066 43,578 51,437 54,635 37,293 Source: Eurostat.

14
European Union 28 - Imports from U.S. (in-shell - 0802.51)
(in metric tons) Country 2012 2013 2014 2015 2016
Luxembourg 7,984 9,149 14,825 20,987 8,123
Belgium 6,614 5,960 4,687 6,242 7,653
The Netherlands 8,541 7,847 7,629 8,470 6,786
Germany 4,518 8,545 11,746 8,914 5,101
France 3,968 3,261 3,221 2,543 2,860
Spain 2,428 2,791 1,789 1,747 1,819
Italy 2,060 2,173 2,127 1,599 1,392
U.K. 1,034 1,194 1,332 1,037 1,258
Lithuania 20 100 298 320 260
Portugal 154 65 79 71 188
Poland 77 53 263 131 133
Bulgaria 116 107 118 87 64
Greece 188 57 134 19 35
Cyprus 88 57 80 34 30
Sweden 585 238 100 162 25
Croatia 89 55 75 21 13
Slovakia 344 340 729 0 0
Latvia 19 0 0 0 0
Other 0 0 0 0 20
Total 38,827 41,992 49,231 52,384 35,760 Source: Eurostat.

15
European Union 28 - Imports from U.S. (shelled - 0802.52)
(in metric tons) Country 2012 2013 2014 2015 2016
Luxembourg 0 0 0 0 0
Belgium 89 174 95 105 471
The Netherlands 338 32 17 52 0
Germany 1,162 444 494 273 39
France 623 399 648 592 139
Spain 120 62 101 335 0
Italy 590 385 580 363 1
U.K. 121 32 209 229 0
Lithuania 0 0 0 0 0
Portugal 0 0 0 0 0
Poland 0 0 0 0 0
Bulgaria 3 0 0 0 0
Greece 44 39 31 16 4
Cyprus 68 4 19 0 241
Sweden 69 13 12 15 0
Croatia 4 0 1 1 430
Slovakia 0 0 0 0 0
Latvia 0 0 0 0 0
Other 5 0 0 0 208
Total 3,236 1,584 2,206 1,981 1,533 Source: Eurostat.

16
Iran - Exports (in-shell and shelled)
(in metric tons)
Country 2008 2009 2010 2011 2012 2013 2014 2015 2016*
Hong Kong 17,928 37,742 60,952 28,732 53,731 32,887 58,332 41,170 24,147
Vietnam 1,935 5,026 6,274 5,358 6,391 9,465 19,493 18,317 19,084
U.A.E.** 10,989 20,361 16,364 15,540 16,314 15,518 17,887 14,395 9,705
Germany 9,530 13,877 10,897 9,948 6,464 7,745 9,938 11,083 9,684
India 933 3,392 5,171 2,483 4,270 4,872 4,666 6,116 6,549
Kazakhstan 1,011 988 816 1,457 5,221 11,233 6,907 5,549 6,509
Iraq 5,579 5,705 6,768 6,915 5,078 6,271 7,341 6,166 5,734
Turkey** 1,399 1,597 4,801 2,202 2,377 10,665 10,917 5,306 4,787
Pakistan 2,313 2,757 4,348 3,050 2,474 2,209 3,471 3,986 4,619
Lebanon 1,972 2,656 2,573 2,187 2,357 2,063 2,866 2,728 3,100
Spain 48 2,450 3,170 420 96 126 1,368 2,323 2,571
Italy 44 183 118 99 37 392 551 864 1,779
Russia 6,357 8,149 14,549 14,691 7,306 1,885 1,980 1,403 1,745
Kuwait 744 948 995 448 626 632 869 1,500 1,703
Jordan 94 194 94 94 378 628 1,489 1,498 1,632
Afghanistan 821 850 1,285 924 1,535 2,121 1,959 2,073 1,591
Taiwan 661 2,203 3,090 1,194 962 971 1,474 1,404 1,231
Greece 75 173 0 0 229 273 431 1,632 995
Uzbekistan 472 488 141 635 704 802 1,045 615 758
Canada 307 908 693 733 336 295 480 753 702
Slovakia 365 501 681 184 403 382 391 932 656
Kyrgyzstan 440 684 381 624 839 706 571 377 649
Qatar 98 95 155 141 363 340 317 607 602
China 140 341 1,334 1,083 197 277 92 392 466
Poland 242 352 88 11 62 43 338 433 454
The Netherlands 149 522 1,382 1,028 477 468 1,133 1,036 451
Lithuania 506 234 420 419 449 317 344 341 451
Syria 3,038 6,273 4,122 2,680 79 313 289 168 373

17
Singapore 22 101 173 181 239 203 307 436 363
Belgium 3,160 1,757 1,978 1,597 1,267 72 120 358 352
Tunisia 145 505 338 220 171 25 166 165 326
Japan 171 206 290 310 177 100 229 231 278
Australia 220 480 460 230 250 127 156 375 231
Ukraine 1,466 1,213 1,609 1,046 1,075 864 209 137 196
France 349 212 355 751 888 286 37 171 185
Turkmenistan 151 310 266 293 275 426 435 207 179
Malaysia 92 59 92 82 128 192 145 375 162
Egypt 879 2,193 1,052 1,042 617 299 541 470 115
Tajikistan 1,086 1,078 1,300 1,184 807 968 626 263 107
Azerbaijan 67 250 236 286 240 408 375 218 92
Romania 271 376 347 283 43 109 105 38 63
Mexico 0 174 310 73 72 121 216 267 50
Saudi Arabia 282 112 869 746 598 1,245 2,063 571 0
Croatia 75 113 50 0 0 0 0 20 0
Other 1,245 1,264 1,274 600 586 717 1,029 1,586 772
Total 77,871 130,052 162,661 112,204 127,188 120,061 163,698 139,055 116,198 Source: Islamic Republic of Iran Customs Administration. NOTE: Data reported above is from September 23 to September 22 of the following year as reported by the Iran Pistachio Association. *NOTE: 2016 data only covers 11 months - September 23 to August 22 which is inclusive of all data available during the publishing of this report. ** NOTE: Report as a re-export market.

18
European Union 28 - Imports from Iran
(in-shell and shelled)
(in metric tons)
Country 2008 2009 2010 2011 2012 2013 2014 2015 2016
Germany 17,677 12,227 13,428 12,692 10,506 11,871 12,559 13,168 12,685
Spain 587 481 2,607 1,755 1,307 1,416 1,514 2,330 2,854
Greece 246 98 123 0 0 237 321 696 1,801
Italy 1,095 56 291 216 286 169 1,036 1,030 1,844
The Netherlands 25 199 669 1,827 1,155 436 713 1,105 972
Slovakia 663 438 547 352 247 446 358 626 917
Belgium 3,747 3,142 1,734 1,833 1,496 1,358 1,343 958 872
Lithuania 1,252 437 363 417 392 402 356 337 438
Poland 110 352 308 22 10 62 87 316 471
France 209 314 188 314 896 676 236 62 131
Romania 542 331 354 317 204 33 153 156 49
Czech Republic 0 0 0 0 0 13 0 0 33
Sweden 10 0 0 0 1 23 0 1 1
Luxembourg 506 322 173 0 0 0 0 0 0
Other 30 60 50 14 6 0 0 0 142
Total 26,699 18,457 20,835 19,759 16,505 17,141 18,676 20,785 23,210 Source: Eurostat. NOTE: Eurostat reported no data for Portugal.

19
Europe - Imports from Iran (in-shell - 0802.51)
(in metric tons) Country 2012 2013 2014 2015 2016
Germany 8,305 10,182 9,784 10,324 9,813
Spain 1,248 1,391 1,472 2,284 2,840
The Netherlands 1,155 436 713 1,105 972
Italy 178 10 366 355 1,111
Belgium 1,496 1,109 1,166 839 731
Greece 0 237 304 601 1,718
Slovakia 243 438 323 547 783
Lithuania 392 402 356 337 438
Poland 9 62 87 316 471
Romania 204 32 153 121 48
France 441 434 32 0 1
Sweden 1 9 0 1 1
Czech Republic 0 0 0 0 33
Luxembourg 0 0 0 0 0
Other 6 0 0 0 141
Total 13,677 14,742 14,756 16,830 19,101 Source: Eurostat.
20
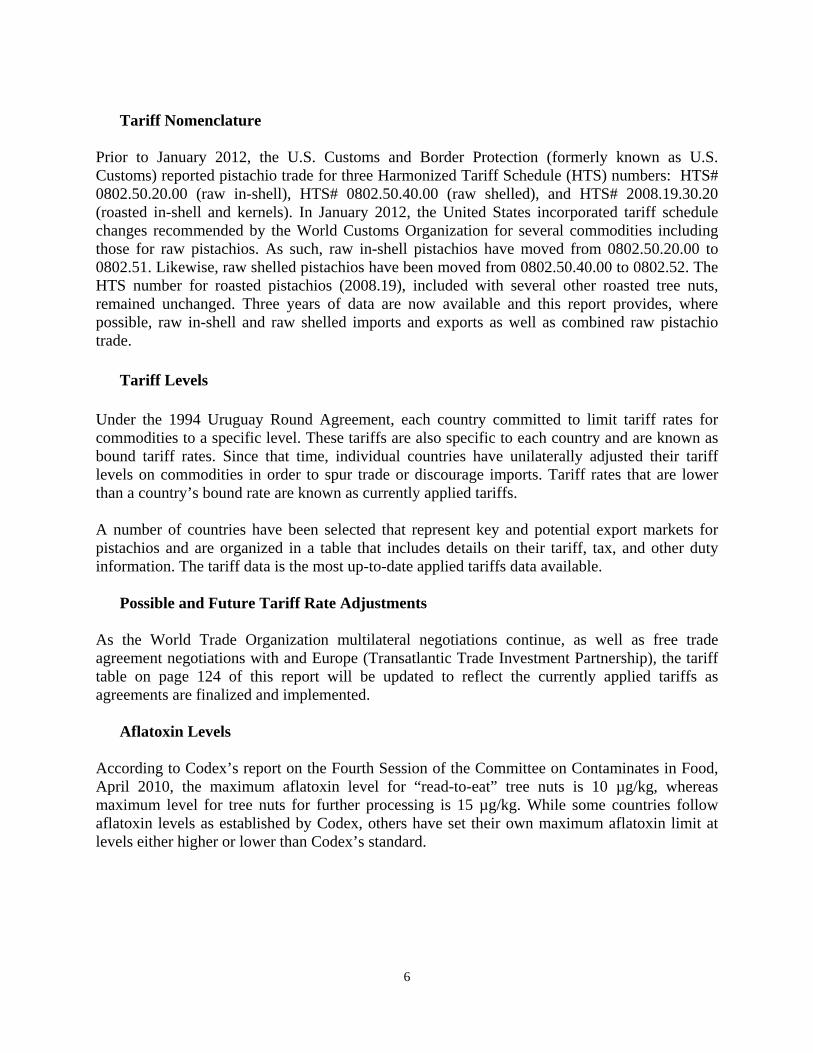
Europe - Imports from Iran (shelled - 0802.52)
(in metric tons) Country 2012 2013 2014 2015 2016
Germany 2,201 1,689 2,775 2,844 2,872
Spain 59 25 42 46 14
The Netherlands 0 0 0 0 0
Italy 108 159 670 675 733
Belgium 0 249 177 119 141
Greece 0 0 17 95 83
Slovakia 4 8 35 79 134
Lithuania 0 0 0 0 0
Poland 1 0 0 0 0
Romania 0 1 0 35 1
France 455 242 204 62 130
Sweden 0 14 0 0 0
Czech Republic 0 13 0 0 0
Luxembourg 0 0 0 0 0
Other 0 0 0 0 1
Total 2,828 2,399 3,920 3,955 4,109 Source: Eurostat.

21
Turkey - Exports
(in-shell and shelled)
(in metric tons)
Country 2008 2009 2010 2011 2012 2013 2014 2015 2016
Italy 510 342 252 549 638 1163 429 1,180 1,787
Saudi Arabia 46 212 3 69 42 151 28 243 861
Germany 157 126 91 96 154 279 188 404 418
Israel 194 105 104 107 468 86 29 349 324
U.S.A. 36 26 19 57 160 74 3 93 117
Greece 88 183 n/a n/a n/a 122 n/a 47 100
U.A.E. 5 11 5 4 27 26 0 51 85
Egypt 91 212 53 7 147 155 4 94 76
Jordan 40 66 14 1 12 103 27 182 63
Turkmenistan 7 8 0 23 13 7 10 2 55
Iraq 13 2 2 0 95 157 0 8 1
Libya 0 0 0 0 5 318 0 25 0
Other 1,574 1,331 179 275 388 707 110 532 713
Total 2,621 2,376 717 1,160 2,328 3,879 818 3,155 4,690 Source: United Nations Comtrade Database.

22
Turkey - Exports (in-shell - 0802.51)
(in metric tons) Country 2012 2013 2014 2015 2016
Italy 10 176 0 16 20
Saudi Arabia 15 59 n/a 50 587
Germany 0 29 0 2 4
Israel 282 48 20 267 116
U.S.A. 45 9 11 5 6
Greece 0 15 0 0 0
U.A.E. 3 0 0 0 4
Egypt 2 59 0 32 0
Jordan 9 49 4 10 0
Turkmenistan 12 0 24 0 52
Iraq 36 5 0 0 0
Libya 1 132 0 24 0
Other 248 966 12 135 107
Total 663 1,547 51 541 896
Source: United Nations Comtrade Database.

23
Turkey - Exports (in-shell - 0802.51)
(in metric tons) Country 2012 2013 2014 2015 2016
Italy 628 987 429 1,164 1,767
Saudi Arabia 27 259 n/a 193 273
Germany 154 250 188 402 414
Israel 185 103 8 82 208
U.S.A. 115 77 17 88 111
Greece n/a n/a n/a 47 100
U.A.E. 24 25 0 51 81
Egypt 144 44 27 62 76
Jordan 3 106 0 172 63
Turkmenistan 17 11 6 2 3
Iraq 59 69 3 8 1
Libya 4 11 6 1 0
Other 304 458 85 341 607
Total 1,664 2,400 769 2,613 3,794 Source: United Nations Comtrade Database.

24
European Union 28 - Imports from Turkey
(in-shell and shelled)
(in metric tons)
Country 2008 2009 2010 2011 2012 2013 2014 2015 2016
Italy 462 396 220 615 709 1,327 425 1,088 1,973
Germany 67 123 102 87 114 252 160 392 420
Greece 38 126 0 0 10 15 0 32 89
Belgium 175 484 104 151 50 59 17 111 49
Bulgaria 0 0 0 0 0 15 3 0 47
Spain 0 1 0 4 0 73 144 13 13
France 2 2 1 26 3 47 2 33 12
Romania 0 0 0 0 0 178 0 0 9
U.K. 9 14 7 15 23 11 1 5 8
Other 73 51 4 16 34 12 6 11 37
Total 826 1,197 438 914 938 1,989 758 1,685 2,657 Source: Eurostat.

25
Europe - Imports from Turkey (in-shell - 0802.51)
(in metric tons) Country 2012 2013 2014 2015 2016
Italy 17 177 0 16 38
Germany 13 30 1 21 26
Greece 10 15 0 0 4
Belgium 19 6 2 10 10
Bulgaria 0 15 3 0 0
Spain 0 60 144 12 2
France 0 0 2 0 2
Romania 0 167 0 0 9
U.K. 7 5 1 3 1
Other 0 0 2 8 24
Total 61 473 155 70 116 Source: Eurostat.

26
Europe - Imports from Turkey (shelled - 0802.52)
(in metric tons) Country 2012 2013 2014 2015 2016
Italy 692 1,150 425 1,072 1,935
Germany 101 223 159 371 394
Greece 0 0 0 32 85
Belgium 31 53 15 101 39
Bulgaria 0 0 0 0 47
Spain 0 13 0 1 11
France 3 47 0 33 10
Romania 0 11 0 0 0
U.K. 16 6 0 2 7
Other 34 13 4 3 13
Total 877 1,516 603 1,615 2,541 Source: Eurostat.

27
Syria - Exports (in-shell and shelled)
(in metric tons)
Country 2008 2009 2010 2011 2012 2013 2014 2015 2016
Jordan 1,037 2,998 2,324 1,308 1,279 1,749 437 894 1,110
Algeria 25 n/a n/a 0 0 25 0 0 378
Egypt 367 418 149 84 0 0 5 100 129
U.A.E 19 0 0 0 129 759 16 73 111
Sweden 16 10 34 2 6 15 22 21 42
Italy 119 312 20 253 315 317 69 24 10
Greece n/a 14 n/a 0 20 174 35 0 8
Canada 1 2 9 0 1 37 0 0 5
Saudi Arabia 76 204 128 133 724 1,419 363 503 n/a
Tunisia 61 148 26 40 56 64 27 17 n/a
Lebanon 0 2 410 413 748 940 121 0 n/a
Belgium 0 12 280 128 13 28 12 0 n/a
Spain n/a n/a n/a 0 0 160 0 0 n/a
Kazakhstan n/a n/a n/a 0 0 33 0 0 n/a
India n/a 14 5 7 14 29 0 0 n/a
Other 128 1,430 1,662 79 294 72 18 1 37
Total 1,849 5,564 5,047 2,447 3,599 5,821 1,125 1,633 1,830 Source: United Nations Comtrade Database. NOTE: Data for years 2011 to 2016 was reported by the importing country.

28

29
Major Non-producing Pistachio Exporting and Importing Countries

30

31
China - Imports (in-shell and shelled)
(in metric tons)
Country 2008 2009 2010 2011 2012 2013 2014 2015 2016
U.S.A. 18,011 15,922 17,203 18,992 21,781 11,658 7,281 6,233 14,541
Iran 11,364 5,102 35,366 5,362 5,158 1,265 2,523 4,387 2,880
Australia 211 518 210 541 399 224 241 216 252
Other 19 3 2 57 26 24 6 60 6
Total 29,605 21,545 52,781 24,952 27,364 13,171 10,051 10,896 17,679
China - Imports (in-shell - 0802.51)
(in metric tons)
Country 2012 2013 2014 2015 2016
U.S.A. 21,139 11,194 6,570 5,790 13,917
Iran 5,146 1,249 2,507 4,373 2,858
Australia 377 224 241 216 250
Other 27 24 6 56 6
Total 26, 689 12,691 9,324 10,435 17,025
China - Imports (shelled - 0802.52)
(in metric tons)
Country 2012 2013 2014 2015 2016
U.S.A. 642 464 711 443 627
Iran 12 16 16 14 22
Australia 21 0 0 0 2
Other 0 0 0 4 0
Total 675 480 727 461 651 NOTE: According to Foreign Agriculture Service, USDA Hong Kong post officials, China’s market on average is estimated at 50,000 MT of pistachios annually. The majority enters through Hong Kong and is moved to China through official and grey channels. Approximately 5-10% percent goes to other Asian markets for above-board sales and consumption. See Hong Kong imports on page 35. Source: United Nations Comtrade Database.

32
China - Exports (in-shell and shelled)
(in metric tons)
Country 2008 2009 2010 2011 2012 2013 2014 2015 2016
U.S.A. 6,260 1,744 1,045 2,653 6,664 1,112 903 694 318
Hong Kong 108 67 244 1,260 1,055 2,900 633 452 288
Australia 252 362 56 160 188 145 250 129 184
Germany 100 0 0 119 277 91 n/a n/a 176
Malaysia n/a 21 n/a 105 59 14 52 65 124
Italy n/a n/a n/a 34 140 n/a 40 n/a 121
Singapore 42 8 72 86 34 7 62 72 98
Russian Federation 142 84 29 66 489 88 51 9 54
United Kingdom n/a 19 19 60 100 n/a n/a n/a 20
Indonesia n/a n/a n/a 121 92 n/a 47 55 0
France 0 0 0 63 389 n/a n/a 19 0
Spain 76 n/a n/a 40 120 n/a 21 45 0
Belgium 31 0 1,258 271 138 n/a n/a n/a 0
Other 112 164 459 140 32 5 9 45 24
Total 7,691 2,469 3,382 5,178 9,937 4,362 2,068 1,585 1,405 Source: United Nations Comtrade Database.

33
China - Exports (in-shell - 0802.51)
(in metric tons)
Country 2012 2013 2014 2015 2016
U.S.A. 5,967 567 28 n/a n/a
Hong Kong 944 2,771 546 381 210
Australia 14 7 n/a n/a n/a
Germany 277 91 n/a n/a 730
Malaysia 59 8 46 56 110
Italy 140 n/a n/a n/a 80
Singapore 34 n/a 58 72 98
Russian Federation 489 88 51 9 54
U.K. 100 n/a n/a n/a n/a
Indonesia 92 n/a 477 55 n/a
France 332 n/a n/a n/a n/a
Spain 120 n/a n/a n/a n/a
Belgium 138 n/a n/a n/a n/a
Other 252 0 47 56 n/a
Total 8,866 3,532 776 574 730 Source: United Nations Comtrade Database

34
China - Exports (shelled - 0802.52)
(in metric tons)
Country 2012 2013 2014 2015 2016
U.S.A. 697 545 875 694 318
Hong Kong 111 129 87 71 78
Australia 174 138 250 129 184
Germany n/a n/a n/a n/a n/a
Malaysia 0 n/a n/a n/a 14
Italy 0 n/a 40 n/a 41
Singapore n/a 7 4 n/a n/a
Russian Federation n/a n/a n/a n/a n/a
U.K. n/a 6 6 10 20
Indonesia n/a n/a n/a n/a n/a
France 56 n/a n/a 19 n/a
Spain 0 n/a 21 45 n/a
Belgium 0 n/a n/a n/a n/a
Other 33 5 14 44 22
Total 1,071 830 1,292 1,012 676 Source: United Nations Comtrade Database
35
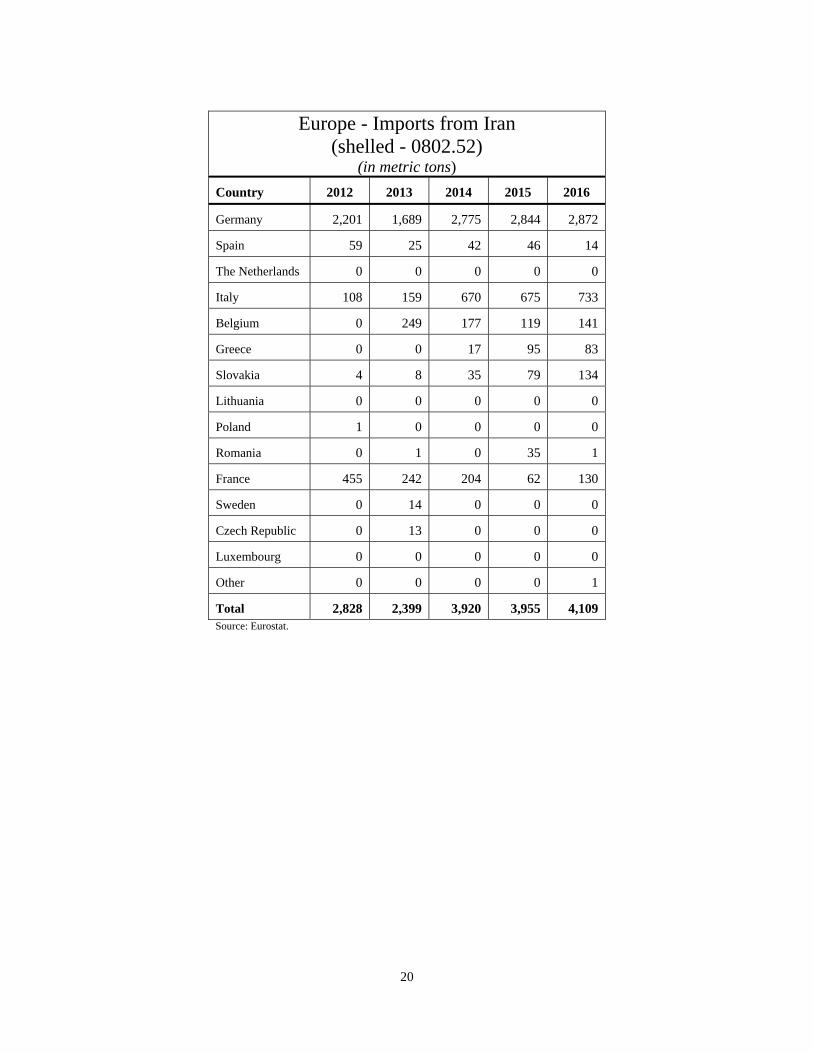
Hong Kong - Imports
(in-shell and shelled)
(in metric tons)
Country 2008 2009 2010 2011 2012 2013 2014 2015 2016
U.S.A. 14,639 23,732 29,334 35,620 53,381 64,361 29,674 21,914 68,295
Iran 33,230 25,639 61,594 34,219 43,595 30,488 58,800 46,202 35,743
China 521 227 549 1,414 1,118 2,906 582 558 94
U.A.E. 74 n/a 174 506 161 1,703 1,442 185 0
Turkey 0 0 0 0 120 636 30 45 12
Vietnam 890 25 23 n/a 933 174 0 50 n/a
Other 1,536 636 966 186 726 460 214 225 255
Total 50,890 50,259 92,640 71,945 100,034 100,728 90,742 69,179 104,399 Source: United Nations Comtrade Database.

36
Hong Kong - Imports (in-shell - 0802.51)
(in metric tons)
Country 2012 2013 2014 2015 2016
U.S.A. 53,362 64,361 29,674 21,894 68,289
Iran 43,457 30,472 58,787 46,173 35,684
China 1,103 2,769 579 524 53
U.A.E 161 1,703 1,442 185 0
Turkey 120 636 30 45 12
Vietnam 933 174 0 50 n/a
Other 703 458 185 171 251
Total 99,839 100,573 90,697 69,042 104,289
Hong Kong - Imports (shelled - 0802.52)
(in metric tons)
Country 2012 2013 2014 2015 2016
U.S.A. 19 0 0 20 1
Iran 138 16 13 29 58
China 15 137 3 34 41
U.A.E. 0 0 0 0 0
Turkey 0 0 0 0 0
Vietnam 0 0 0 0 0
Other 23 2 29 54 11
Total 195 155 45 137 111 Source: United Nations Comtrade Database.

37
Hong Kong - Exports (in-shell and shelled)
(in metric tons)
Country 2008 2009 2010 2011 2012 2013 2014 2015 2016
Vietnam 6,274 10,727 4,618 22,106 42,157 26,381 51,789 40,793 66,145
China 16,945 13,585 40,021 18,725 13,181 7,541 5,867 6,373 13,056
U.S.A. 15 31 295 156 376 0 1,066 371 743
U.A.E. 0 45 0 299 1,002 709 226 94 364
Germany 117 0 0 0 49 407 628 0 253
Russian Federation 1,507 134 153 0 1,089 2,135 1,836 468 103
India 19 364 370 961 1,763 1,603 332 458 76
Australia 1 0 13 84 62 386 130 90 39
Thailand 8 200 10 0 70 36 102 19 23
Turkey 0 0 0 0 0 272 0 24 25
France 0 0 299 0 470 257 332 0 0
Ukraine 72 0 0 50 403 87 25 0 0
Other 182 229 204 1,473 293 646 494 436 496
Total 25,140 25,499 50,019 58,686 63,145 40,651 63,760 49,126 81,282 Source: United Nations Comtrade Database.

38
Hong Kong - Exports (in-shell - 0802.51)
(in metric tons) Country 2012 2013 2014 2015 2016
Vietnam 41,473 26,261 51,789 40,785 66,140
China 13,181 7,451 5,867 6,332 13,052
U.S.A. 376 0 1,066 371 743
U.A.E. 1,002 709 226 94 364
Germany 49 407 628 0 254
Russian Federation 1,089 2,135 1,836 468 103
India 1,751 1,603 332 458 57
Australia 62 368 130 78 30
Thailand 70 36 102 12 6
Turkey 0 272 0 24 25
France 470 257 332 0 0
Ukraine 403 87 25 0 0
Other 2,508 921 1,407 434 456
Total 62,434 40,507 63,740 49,056 81,230 Source: United Nations Comtrade Database.

39
Hong Kong - Exports (shelled - 0802.52)
(in metric tons) Country 2012 2013 2014 2015 2016
Vietnam 684 120 0 9 5
China 0 0 0 40 4
U.S.A. 0 0 0 0 0
U.A.E. 0 0 0 0 0
Germany 0 0 0 0 0
Russian Federation 0 0 0 0 0
India 11 0 0 0 0
Australia 0 18 0 12 10
Thailand 0 0 0 7 17
Turkey 0 0 0 0 0
France 0 0 0 0 0
Ukraine 0 0 0 0 0
Other 16 6 0 2 16
Total 711 144 20 70 52 Source: United Nations Comtrade Database.

40
Germany - Imports (in-shell and shelled)
(in metric tons)
Country 2008 2009 2010 2011 2012 2013 2014 2015 2016
U.S.A. 24,698 20,544 17,246 14,763 16,775 18,166 19,216 15,699 16,216
Iran 18,137 12,691 13,738 24,998 18,903 13,735 11,628 5,284 5,039
Italy 360 319 115 538 1,346 1,289 974 699 810
Luxembourg 57 0 0 0 0 0 98 892 474
Turkey 215 172 140 85 95 260 156 349 424
France 6 9 3 14 7 2 13 9 24
Other 281 770 2,431 1,152 189 5 112 1,080 182
Total 43,702 34,507 33,675 41,552 37,315 33,460 32,099 23,120 23,160 Source: United Nations Comtrade Database.

41
Germany - Imports (in-shell - 0802.51)
(in metric tons) Country 2012 2013 2014 2015 2016
U.S.A. 7,388 12,234 13,868 10,860 10,092
Iran 15,363 11,757 8,819 3,951 3,123
Italy 311 404 324 425 537
Luxembourg 0 0 24 0 0
Turkey 5 30 2 26 38
France 2 0 0 0 24
Other 90 4 34 145 179
Total 23,159 24,432 23,047 15,407 13,973
Germany - Imports (shelled - 0802.52)
(in metric tons) Country 2012 2013 2014 2015 2016
U.S.A. 9,387 5,931 5,348 4,839 6,124
Iran 3,540 1,977 2,809 1,333 1,916
Italy 1,035 885 650 274 273
Luxembourg 0 0 892 474 474
Turkey 90 231 154 323 376
France 5 2 13 8 0
Other 99 1 78 935 24
Total 14,156 9,027 9,052 7,712 9,187 Source: United Nations Comtrade Database.

42
Germany - Exports (in-shell and shelled)
(in metric tons)
Country 2008 2009 2010 2011 2012 2013 2014 2015 2016
Spain 4,484 2,145 2,738 3,342 1,960 1,953 2,554 2,910 4,302
Italy 1,735 1,804 3,051 3,293 1,635 2,172 2,793 3,585 3,846
U.K. 679 427 600 621 653 540 1,055 966 2,284
France 920 1,086 1,236 1,002 864 1,304 1,511 1,501 1,731
The Netherlands 1,595 939 1,470 626 1,287 1,720 1,379 1,794 1,404
Poland 349 137 214 254 354 212 560 229 934
Hungary 506 303 484 546 446 384 305 624 487
Lithuania 191 137 71 254 277 156 279 297 333
UAE 0 0 0 17 0 0 269 20 251
Sweden 68 56 34 56 47 0 140 132 231
Switzerland 113 100 160 124 104 158 148 158 155
Russian Federation 22 19 28 97 20 267 128 275 1
Other 6,715 6,108 8,542 5,150 2,989 763 1,595 1,272 933
Total 17,309 13,205 18,594 15,309 10,589 9,629 12,307 13,314 16,891 Source: United Nations Comtrade Database.

43
Germany - Exports (in-shell - 0802.51)
(in metric tons)
Country 2012 2013 2014 2015 2016
Spain 1,960 1,953 2,554 2,910 3,944
Italy 1,635 2,172 2,793 3,585 3,321
U.K. 653 540 1,055 966 1,588
France 864 1,304 1,511 1,501 1,219
The Netherlands 1,287 1,720 1,379 1,794 1,058
Poland 354 212 560 229 836
Hungary 446 384 305 624 475
Lithuania 277 156 279 297 310
UAE 0 n/a 269 20 213
Sweden 47 n/a 140 132 162
Switzerland 104 158 148 158 139
Russian Federation 20 267 128 275 1
Other 2,989 763 1,186 823 593
Total 10,589 9,629 12,307 13,314 13,857 Source: United Nations Comtrade Database.

44
Germany - Exports (shelled - 0802.52)
(in metric tons)
Country 2012 2013 2014 2015 2016
Spain 251 137 245 485 357
Italy 424 315 697 605 525
U.K. 250 208 426 548 696
France 333 297 545 426 512
The Netherlands 262 121 212 323 346
Poland 95 100 83 128 98
Hungary 25 26 3 6 11
Lithuania 1 2 60 27 23
UAE 0 0 13 38 38
Sweden 31 61 65 70 70
Switzerland 91 116 127 122 131
Russian Federation 0 11 33 n/a 0
Other 901 239 258 129 227
Total 2,664 1,633 2,767 2,907 3,034 Source: United Nations Comtrade Database.

45
The Netherlands - Imports
(in-shell and shelled)
(in metric tons)
Country 2008 2009 2010 2011 2012 2013 2014 2015 2016
U.S.A. 12,660 11,951 9,683 7,194 8,838 7,879 7,646 8,453 6,822
Iran 25 199 669 1,722 1,155 436 713 1,102 972
Germany 904 1,663 1,910 534 1,280 1,249 2,244 586 394
Greece 15 0 10 0 n/a 36 13 4 120
France 869 2,129 2,298 913 1,424 343 44 27 36
U.K. 0 104 0 2 n/a 57 0 10 0
Other 101 379 214 112 74 25 69 200 227
Total 14,574 16,425 14,784 10,477 12,771 10,025 10,729 10,380 8,571 Source: Eurostat.

46
The Netherlands - Imports (in-shell - 0802.51)
(in metric tons) Country 2012 2013 2014 2015 2016
U.S.A. 8,499 7,847 7,629 8,401 6,822
Iran 1,155 436 713 1,102 972
Germany 901 1,101 950 412 227
Greece n/a 0 13 4 120
France 1,327 340 28 4 1
U.K. n/a 0 0 7 0
Other 44 9 61 152 149
Total 11,926 9,733 9,394 10,082 8,291
The Netherlands - Imports (shelled - 0802.52)
(in metric tons) Country 2012 2013 2014 2015 2016
U.S.A. 338 32 17 52 0
Iran 0 0 0 0 0
Germany 378 148 1,294 174 167
Greece n/a 36 0 0 0
France 96 3 16 23 35
U.K. n/a 57 0 3 0
Other 34 15 8 48 78
Total 846 291 1,335 300 280 Source: Eurostat.

47
The Netherlands - Exports
(in-shell and shelled)
(in metric tons)
Country 2008 2009 2010 2011 2012 2013 2014 2015 2016
Germany 12,595 9,089 7,398 5,353 7,088 5,613 4,676 4,941 6,832
France 3,264 2,535 3,279 3,363 2,283 1,939 1,867 2,199 1,976
Poland 606 623 2,391 778 747 908 668 535 609
U.K. 90 570 3,849 1,027 1,140 1,079 751 1,124 383
Belgium 98 59 652 139 26 13 38 38 13
Romania 60 62 78 93 130 20 114 6 9
Denmark 82 17 88 128 18 11 4 6 6
Switzerland 2 1 5 6 4 15 12 4 3
Serbia 33 0 0 0 0 20 0 0 0
Other 291 295 589 322 96 35 512 162 187
Total 17,121 13,251 18,329 11,209 11,532 9,653 8,642 9,015 10,028 Source: Eurostat

48
The Netherlands - Exports (in-shell - 0802.51)
(in metric tons) Country 2012 2013 2014 2015 2016
Germany 7,048 5,609 4,676 4,934 6,832
France 2,226 1,926 1,867 2,199 1,974
Poland 625 710 628 535 525
U.K. 1,133 1,046 697 1,074 351
Belgium 10 3 5 23 5
Romania 130 20 0 1 5
Denmark 1 1 1 5 3
Switzerland 2 4 0 0 1
Serbia n/a 20 0 0 0
Other 66 9 56 45 133
Total 11,241 9,348 7,930 8,816 9,829
The Netherlands - Exports (shelled - 0802.52)
(in metric tons) Country 2012 2013 2014 2015 2016
Germany 39 3 0 2 10
France 57 12 0 7 2
Poland 122 198 40 0 84
U.K. 6 34 54 47 32
Belgium 16 11 33 10 8
Romania 0 1 114 4 4
Denmark 17 10 3 1 3
Switzerland 2 10 12 4 2
Serbia n/a n/a 0 0 0
Other 32 26 456 64 54
Total 291 305 712 139 199 Source: Eurostat.

49
United Arab Emirates - Imports (in-shell and shelled)
(in metric tons)
Country 2008* 2009* 2010* 2011* 2012 2013 2014 2015 2016
Iran 16,771 12,124 13,998 12,741 12,623 7,361 14,417 16,379 12,665
U.S.A. 67 1,004 283 387 2,515 2,076 1,469 1,212 831
Turkey 1 5 17 2 27 26 0 56 115
Syria 19 14 18 25 0 0 0 73 111
Kuwait 0 0 0 0 0 0 5 178 105
Lebanon 0 0 1 10 34 8 0 7 19
Saudi Arabia 0 0 0 0 0 0 356 22 11
Germany 48 0 0 0 0 82 270 0 0
Hong Kong 0 0 0 0 1,002 709 226 0 0
Madagascar 0 0 0 0 0 4,000 0 0 0
Other 127 0 10 2 5 24 0 145 814**
Total 17,059 13,170 14,343 13,179 16,206 14,337 16,743 18,072 14,671 Source: United Nations Comtrade Database. *NOTE: Data was sourced from the Federal Competitiveness and Statistics Authority, United Arab Emirates. **NOTE: Data listed as other for 2016 include 505MT from Yemen and 261MT from Afghanistan.

50
United Arab Emirates - Exports (in-shell and shelled)
(in metric tons)
Country 2008* 2009* 2010* 2011* 2012 2013 2014 2015 2016
Iraq n/a n/a n/a n/a n/a 23 328 882 2,337
Saudi Arabia 4,012 4,311 5,415 4,492 1,039 3,276 6,154 6,418 2,266
India 2,135 729 654 758 654 920 712 958 943
Jordan 682 85 250 235 0 211 913 764 304
Egypt 1,810 754 1,095 526 204 1,000 663 491 24
Algeria 494 174 277 537 220 214 303 344 103
Oman n/a n/a n/a n/a 114 291 260 327 399
Kuwait 239 189 99 350 121 187 321 307 181
Yemen 377 52 61 91 37 198 552 235 0
Germany 872 464 518 376 25 997 326 146 130
Tunisia 477 529 606 594 196 304 304 132 89
Iran 788 362 319 397 n/a 378 153 125 124
Bangladesh 138 39 72 107 12 25 10 27 40
Libya 174 78 37 90 30 458 309 22 104
Qatar 36 47 177 91 6 9 698 21 17
Russian Federation 436 62 208 117 n/a 311 264 0 0
Hong Kong 77 50 49 n/a 101 1,703 1,667 0 0
Other 1,407 1,027 637 255 n/a 1,508 1,495 898 1,746
Total 14,154 8,952 10,474 9,016 8,292* 12,013 15,432 12,097 8,807 Source: United Nations Comtrade Database. *NOTE: Data was sourced from the Federal Competitiveness and Statistics Authority, United Arab Emirates.

51
Vietnam - Imports (in-shell and shelled)
(in metric tons)
Country 2008 2009 2010 2011 2012* 2013* 2014* 2015* 2016*
Hong Kong 0 0 0 0 42,157 26,261 51,389 40,793 66,145
U.S.A. 4 0 24 22 34 427 1,152 833 3,922
Madagascar 0 0 0 0 1,509 9,660 0 0 3,007
China 12 24 23 3 0 0 0 0 0
Other 3 1 2 3 24 36 12 1 4
Total 19 25 49 28 43,724 36,384 52,553 41,627 73,078 Source: United Nations Comtrade Database. *NOTE: Data from 2012 to 2016 was reported by the exporting country. Vietnam reports small quantities of pistachio imports as seen in years 2008 to 2011. Hong Kong, however, reports exports in very high quantities (see page 37). It can be assumed that some of Hong Kong’s reported exports are being transshipped through Vietnam. Despite this, on the ground reports of pistachios in quantities larger than those reported by Vietnam provide strong evidence that imports for consumption are much larger than what is being reported. Additionally, Madagascar has reported sizable exports of pistachios to Vietnam. Initially, this appeared to be a data error, however, more investigation is needed to definitively determine the source of the product. Industry source believed it to be Iranian product.

52

53
Asian Pistachio Trading Countries

54

55
India - Imports (in-shell and shelled)
(in metric tons)
Country 2008 2009 2010 2011 2012 2013 2014 2015 2016
Iran 3,134 2,499 4,042 4,674 4,003 3,487 7,297 7,514 7,195
Afghanistan 2,596 2,500 1,306 1,293 436 775 1,467 2,383 1,789
U.S.A. 1,203 2,434 2,030 1,955 3,160 2,399 1,478 831 401
UAE 37 35 40 33 28 4 0 45 263
Turkey 0 10 n/a n/a 16 143 24 28 10
Other 201 334 64 863 614 33 31 40 52
Total 7,171 7,812 7,482 8,818 8,257 6,841 10,297 10,841 9,710 Source: United Nations Comtrade Database.

56
Japan - Imports (in-shell and shelled)
(in metric tons)
Country 2008 2009 2010 2011 2012 2013 2014 2015 2016
U.S.A. 2,061 1,674 1,946 1,889 2,020 2,080 1,895 1,524 1,077
Iran 323 138 238 237 161 226 191 333 208
Italy 33 25 20 18 20 26 24 20 21
Other 1 1 14 7 1 1 7 20 25
Total 2,418 1,838 2,218 2,151 2,202 2,333 2,117 1,897 1,331
Japan - Imports (in-shell - 0802.51)
(in metric tons) Country 2012 2013 2014 2015 2016
U.S.A. 1,924 1,965 1,750 1,403 953
Iran 59 88 38 101 61
Italy 0 n/a n/a 0 0
Other 0 0 7 17 22
Total 1,983 2,053 1,795 1,521 1,035
Japan - Imports (shelled - 0802.52)
(in metric tons) Country 2012 2013 2014 2015 2016
U.S.A. 96 115 145 145 124
Iran 102 139 153 153 148
Italy 20 26 24 24 21
Other 1 0 0 0 3
Total 219 280 322 376 296 Source: United Nations Comtrade Database

57
South Korea - Imports (in-shell and shelled)
(in metric tons)
Country 2008 2009 2010 2011 2012 2013 2014 2015 2016
U.S.A. 375 231 327 251 787 1,019 845 570 482
Iran 8 11 20 26 10 13 18 13 26
Other 122 49 1 0 0 0 9 5 0
Total 505 291 348 277 797 1,032 872 588 508
South Korea - Imports (in-shell - 0802.51)
(in metric tons) Country 2012 2013 2014 2015 2016
U.S.A. 646 958 761 495 408
Iran 0 0 0 0 4
Other 0 0 7 0 0
Total 646 958 768 495 412
South Korea - Imports (shelled - 0802.52)
(in metric tons) Country 2012 2013 2014 2015 2016
U.S.A. 141 61 84 75 74
Iran 10 13 18 13 22
Other 0 0 2 5 0
Total 151 74 104 93 96 Source: United Nations Comtrade Database.

58
Russian Federation - Imports (in-shell and shelled)
(in metric tons)
Country 2008 2009 2010 2011 2012 2013 2014 2015 2016
Iran 18,830 7,836 11,570 15,690 13,774 6,857 416 2,096 1,589
Kazakhstan 0 0 0 0 0 100 3,973 0 643
China 20 107 53 67 499 88 332 104 14
Belarus 0 0 0 0 79 258 0 10 0
U.A.E 0 0 0 0 0 0 1,588 0 0
Czech Republic 0 0 0 0 0 0 1,487 0 0
U.S.A. 7,079 3,763 1,660 2,373 3,909 5,528 1,454 0 0
The Netherlands 0 0 0 0 0 0 436 0 0
Hong Kong 0 0 0 0 0 0 314 0 0
Germany 3 0 0 1 0 0 180 0 0
U.K. 0 0 0 0 0 0 160 0 0
Turkey 1 0 2 0 22 32 140 0 0
Argentina 0 0 0 0 20 60 0 0 0
Other 1,099 70 69 16 8 31 207 60 10
Total 27,032 11,776 13,354 18,147 18,311 12,954 10,687 2,270 2,256 Source: United Nations Comtrade Database.

59
Russian Federation - Imports (in-shell - 0802.51)
(in metric tons) Country 2012 2013 2014 2015 2016
Iran 13,719 6,800 384 2,049 1,561
Kazakhstan 0 100 3,973 0 628
China 499 88 332 104 14
U.A.E 0 0 1,574 0 0
Czech Republic 0 0 1,487 0 0
U.S.A. 3,812 5,452 1,417 0 0
The Netherlands 0 0 436 0 0
Hong Kong 0 0 314 0 0
Germany 0 0 172 0 0
U.K. 0 0 160 0 0
Turkey 22 32 140 0 0
Argentina 20 60 0 0 0
Other 79 284 200 41 10
Total 18,151 12,816 10,589 2,194 2,213

60
Russian Federation - Imports (shelled - 0802.52)
(in metric tons) Country 2012 2013 2014 2015 2016
Iran 54 56 32 47 28
Kazakhstan 0 0 0 0 15
China 0 0 0 0 0
U.A.E 0 0 14 0 0
Czech Republic 0 0 0 0 0
U.S.A. 97 76 37 0 0
The Netherlands 0 0 0 0 0
Hong Kong 0 0 0 0 0
Germany 0 0 8 0 0
U.K. 0 0 0 0 0
Turkey 0 0 0 0 0
Argentina 0 0 0 0 0
Other 9 6 7 29 0
Total 160 138 98 76 43 Source: United Nations Comtrade Database.

61
Thailand - Imports (in-shell and shelled)
(in metric tons) Country 2008 2009 2010 2011 2012 2013 2014 2015 2016*
U.S.A. 345 268 403 503 557 677 462 577 428
Iran 7 77 43 75 48 14 131 73 0
China 33 16 16 16 48 16 65 33 0
Other 66 0 9 11 0 2 0 1 215
Total 451 361 471 605 653 709 658 684 643
Thailand - Imports (in-shell - 0802.51)
(in metric tons) Country 2012 2013 2014 2015 2016*
U.S.A. 536 677 462 577 419
China 42 16 53 15 0
Iran 34 8 131 73 0
Other 0 2 0 0 197
Total 612 703 646 665 616
Thailand - Imports (shelled - 0802.52)
(in metric tons) Country 2012 2013 2014 2015 2016*
U.S.A. 21 n/a n/a n/a 9
China 6 n/a 12 18 0
Iran 14 6 0 0 0
Other 0 0 0 1 18
Total 41 6 12 19 27 Source: United Nations Comtrade Database. *NOTE: Data reported by the exporting country.

62
Singapore - Imports (in-shell and shelled)
(in metric tons)
Country 2008 2009 2010 2011 2012 2013 2014 2015 2016
Iran 106 111 159 n/a 219 223 280 382 491
U.S.A. 131 71 22 93 96 274 286 177 225
Netherlands 0 0 0 0 0 0 0 0 23
China 158 121 172 87 85 119 49 25 8
Indonesia n/a n/a n/a 3 n/a 10 6 5 0
Thailand 17 n/a n/a n/a 9 6 6 n/a n/a
Other 23 18 12 224 7 5 3 66 30
Total 435 321 365 407 416 637 630 655 777 Source: United Nations Comtrade Database.

63
Singapore - Imports (in-shell - 0802.51)
(in metric tons) Country 2012 2013 2014 2015 2016
Iran 203 205 248 312 402
U.S.A. 30 197 271 162 210
The Netherlands 0 0 0 0 0
China 85 73 47 25 0
Indonesia 9 10 6 5 0
Thailand 2 6 6 0 0
Other 3 2 1 57 23
Total 332 493 579 561 635
Singapore - Imports (in-shell - 0802.52)
(in metric tons) Country 2012 2013 2014 2015 2016
Iran 16 18 32 70 89
U.S.A. 66 77 15 16 16
The Netherlands 0 46 2 0 23
China 0 0 0 0 8
Indonesia n/a n/a n/a n/a 0
Thailand 0 n/a n/a n/a 0
Other 2 3 2 9 7
Total 84 144 51 95 143 Source: United Nations Comtrade Database.
64
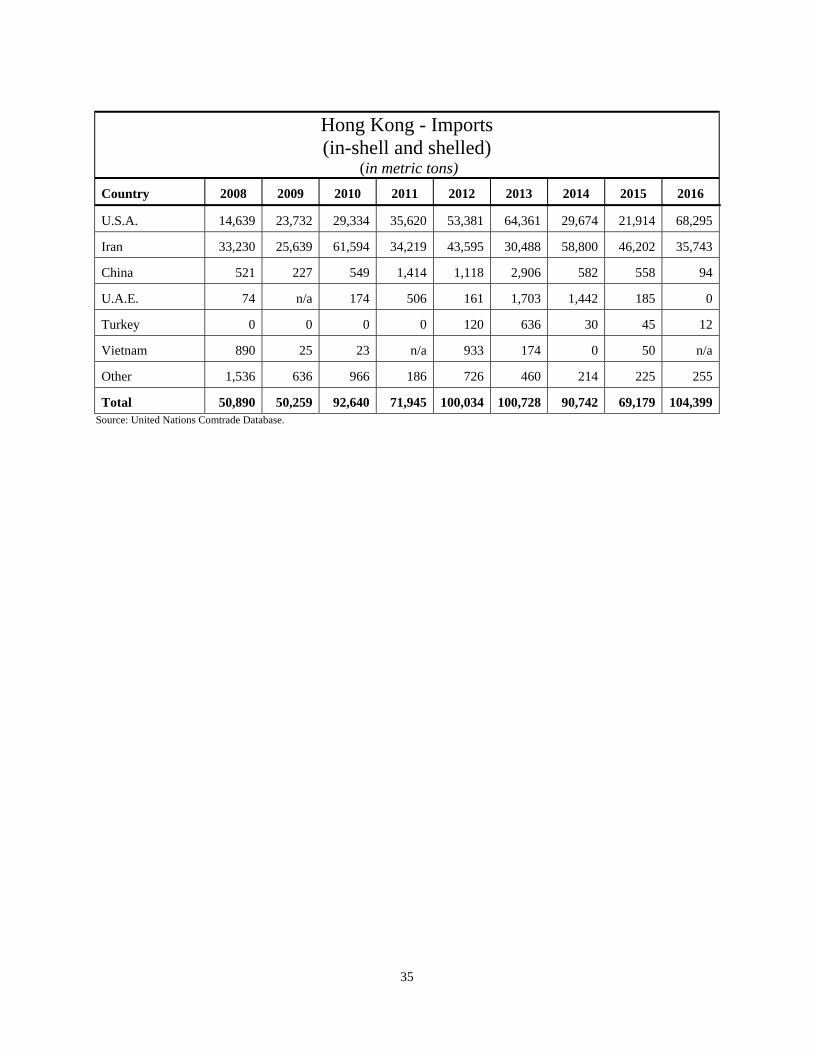
Singapore - Exports (in-shell and shelled)
(in metric tons)
Country 2008 2009 2010 2011 2012 2013 2014 2015 2016
Malaysia 221 128 217 105 100 163 75 70 86
India 33 33 29 26 26 40 56 31 61
Brunei 12 1 8 29 0 0 12 13 42
Indonesia 88 29 8 27 20 12 4 12 32
Ecuador 13 12 13 12 9 12 11 11 1
Hong Kong 19 7 0 6 27 14 n/a 2 1
Other 37 9 13 32 17 3 27 24 6
Total 411 218 280 208 199 247 173 150 229 Source: United Nations Comtrade Database.

65
Singapore - Exports (in-shell - 0802.51)
(in metric tons)
Country 2012 2013 2014 2015 2016
Malaysia 92 101 56 34 68
India 10 40 44 26 61
Brunei 0 0 12 13 42
Indonesia 9 12 4 12 1
Ecuador 3 10 11 11 1
Hong Kong 3 7 n/a n/a 0
Other 15 2 14 20 1
Total 132 175 129 103 174
Singapore - Exports (shelled - 0802.52)
(in metric tons)
Country 2012 2013 2014 2015 2016
Malaysia 9 62 19 36 18
India 16 0 12 5 0
Brunei 0 0 0 0 0
Indonesia 11 0 0 0 31
Ecuador 6 2 n/a n/a 0
Hong Kong 23 7 n/a 2 0
Other 2 1 13 4 6
Total 67 72 44 47 56 Source: United Nations Comtrade Database.

66

67
European Pistachio Trading Countries

68

69
Belgium - Imports (in-shell and shelled)
(in metric tons)
Country 2008 2009 2010 2011 2012 2013 2014 2015 2016
U.S.A. 12,921 9,560 5,619 6,158 6,708 6,999 4,783 6,347 7,790
Iran 3,747 3,142 1,734 1,960 1,496 1,572 1,343 958 871
Luxembourg 52 210 371 504 628 554 387 380 302
Italy 65 56 54 64 232 64 67 294 101
Germany 181 185 365 275 40 105 69 209 85
France 277 178 413 550 50 59 33 110 53
Turkey 175 492 104 151 40 95 17 759 49
Spain 51 76 29 39 3 40 14 0 25
China n/a n/a n/a n/a 208 35 3 57 n/a
Syria 0 12 280 128 13 28 12 0 0
Other 290 116 47 33 79 43 151 193 59
Total 17,759 14,027 9,016 9,862 9,497 9,594 6,879 9,307 9,335 Source: United Nations Comtrade Database.

70
Belgium - Imports (in-shell - 0802.51)
(in metric tons)
Belgium - Imports (shelled - 0802.52)
(in metric tons)
Country 2012 2013 2014 2015 2016 Country 2012 2013 2014 2015 2016
U.S.A. 6,614 6,832 4,687 6,242 7,652 U.S.A. 94 167 95 105 140
Iran 1,496 1,321 1,166 839 731 Iran 0 251 176 119 137
Luxembourg 347 350 362 371 302 Luxembourg 281 204 25 9 0
Germany 192 57 41 256 26 Germany 40 7 28 38 59
Spain 40 105 14 207 21 Spain 0 n/a 0 2 4
Turkey 19 6 2 10 10 Turkey 31 53 15 100 39
France 205 7 10 5 7 France 3 28 24 52 46
Italy 13 59 12 n/a 1 Italy 27 36 55 759 100
Syria 2 n/a n/a n/a n/a Syria 11 28 12 n/a n/a
China n/a 40 n/a n/a n/a China 3 n/a 3 n/a n/a
Other 71 28 32 28 26 Other 8 15 120 165 33
Total 8,999 8,805 6,326 7,958 8,776 Total 498 789 553 1,349 558 Source: United Nations Comtrade Database.

71
Belgium - Exports (in-shell and shelled)
(in metric tons)
Country 2008 2009 2010 2011 2012* 2013 2014 2015 2016
Germany 4,366 5,501 4,079 4,256 3,613 5,116 3,032 5,640 4,882
Italy 3,365 2,827 2,251 1,689 1,561 1,443 856 943 895
Luxembourg 107 24 29 19 2 3 59 17 744
France 990 425 248 729 168 255 281 222 284
U.K. 495 89 64 167 124 30 6 27 253
The Netherlands 4,954 1,795 524 352 1,137 247 154 21 239
Spain 839 1,476 757 1,877 1,910 980 509 468 228
Portugal 0 0 0 0 0 0 0 57 208
Slovakia n/a n/a 0 n/a n/a 383 n/a 167 70
Other 737 572 109 241 190 58 120 87 390
Total 16,193 12,874 8,048 9,432 8,778 8,592 4,994 7,618 8,193 Source: United Nations Comtrade Database. *NOTE: Data sourced for 2012 was obtained from Eurostat

72
Belgium - Exports (in-shell - 0802.51)
(in metric tons)
Country 2012* 2013 2014 2015 2016
Germany 3,578 5,060 3,009 5,630 4,880
Italy 1,558 1,275 809 898 846
Luxembourg 1 1 56 12 739
U.K. 123 11 n/a 43 249
Spain 1,904 881 486 457 216
France 106 129 249 118 188
The Netherlands 1,080 198 37 74 185
Portugal 0 0 0 0 172
Slovakia n/a 383 n/a 21 70
Other 181 35 94 75 550
Total 8,605 8,052 4,720 7,343 7,907
Belgium - Exports (shelled - 0802.52)
(in metric tons)
Country 2012* 2013 2014 2015 2016
Germany 35 56 24 10 1
Italy 3 167 47 45 49
Luxembourg 1 1 4 4 5
U.K. 1 20 6 n/a 4
Spain 5 98 23 11 12
France 62 126 32 49 97
The Netherlands 57 49 117 148 54
Portugal 0 0 0 0 36
Slovakia n/a n/a n/a n/a 0
Other 10 24 25 12 28
Total 173 540 274 275 286 Source: United Nations Comtrade Database. *NOTE: Data sourced for 2012 was obtained from Eurostat
73
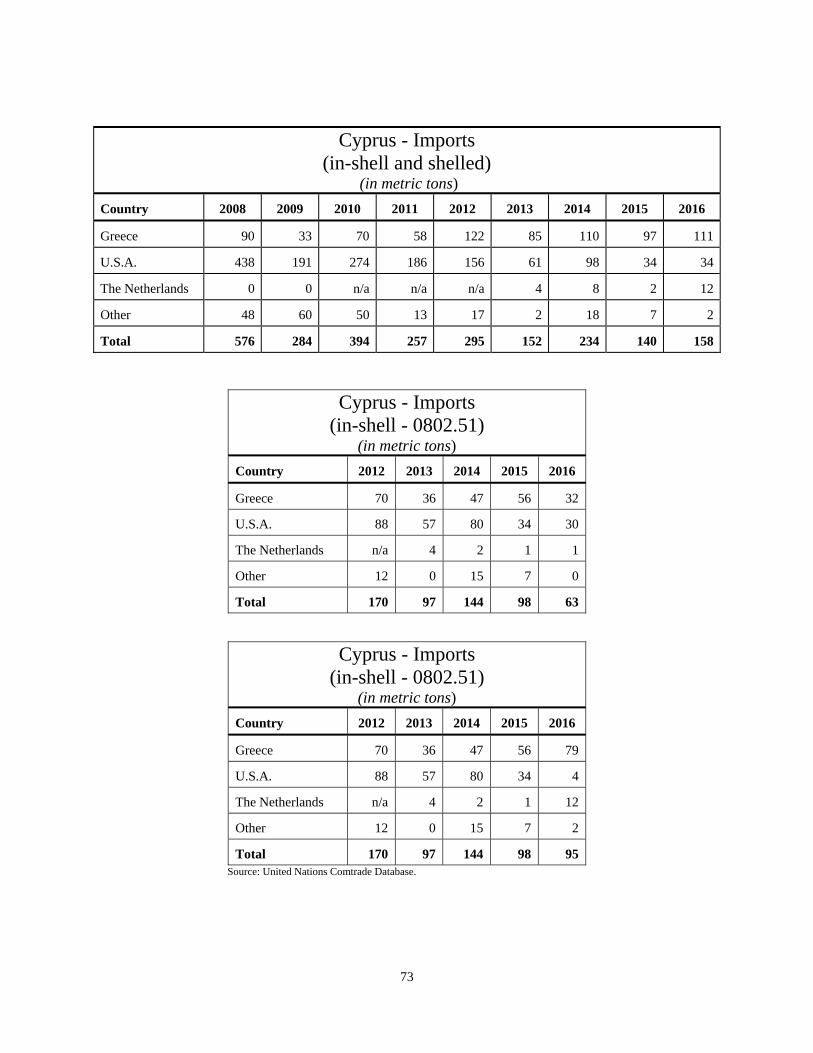
Cyprus - Imports (in-shell and shelled)
(in metric tons)
Country 2008 2009 2010 2011 2012 2013 2014 2015 2016
Greece 90 33 70 58 122 85 110 97 111
U.S.A. 438 191 274 186 156 61 98 34 34
The Netherlands 0 0 n/a n/a n/a 4 8 2 12
Other 48 60 50 13 17 2 18 7 2
Total 576 284 394 257 295 152 234 140 158
Cyprus - Imports (in-shell - 0802.51)
(in metric tons) Country 2012 2013 2014 2015 2016
Greece 70 36 47 56 32
U.S.A. 88 57 80 34 30
The Netherlands n/a 4 2 1 1
Other 12 0 15 7 0
Total 170 97 144 98 63
Cyprus - Imports (in-shell - 0802.51)
(in metric tons) Country 2012 2013 2014 2015 2016
Greece 70 36 47 56 79
U.S.A. 88 57 80 34 4
The Netherlands n/a 4 2 1 12
Other 12 0 15 7 2
Total 170 97 144 98 95 Source: United Nations Comtrade Database.

74
France - Imports (in-shell and shelled)
(in metric tons)
Country 2008 2009 2010 2011 2012 2013 2014 2015 2016
U.S.A. 8,511 7,377 6,883 6,522 7,242 5,527 5,792 5,288 5,210
Iran 1,159 1,450 1,436 1,170 2,087 2,510 2,201 1,488 1,936
Germany 198 180 221 163 198 289 309 240 223
Spain 136 263 395 615 85 95 72 2 192
Turkey 10 3 9 51 32 82 11 42 69
United Kingdom 26 6 5 0 0 1 1 2 60
Italy 44 31 59 85 44 33 29 116 56
The Netherlands 150 63 390 113 45 147 2 28 52
Greece 4 9 12 159 30 43 14 28 47
Belgium 64 68 67 35 14 48 8 4 17
Madagascar 0 11 7 11 26 19 62 2 12
India 2 13 2 3 0 8 4 44 3
Luxembourg 355 236 222 187 121 95 78 56 0
Other 61 11 100 17 23 79 61 11 68
Total 10,669 9,815 9,769 9,125 10,024 8,914 8,606 7,419 7,945 Source: United Nations Comtrade Database.

75
France - Imports (in-shell - 0802.51)
(in metric tons) Country 2012 2013 2014 2015 2016
U.S.A. 5,170 4,961 4,955 4,678 4,664
Iran 1,110 2,030 1,666 1,034 1,442
Germany 131 178 156 117 84
Spain 50 45 35 50 90
Turkey 2 1 2 0 30
United Kingdom 0 1 0 0 60
Italy 7 2 7 4 22
The Netherlands 45 145 1 2 26
Greece 7 24 3 4 22
Belgium 13 7 7 1 16
Madagascar 1 17 22 10 3
India 0 7 2 4 2
Luxembourg 87 95 78 51 15
Other 4 14 22 60 44
Total 6,627 7,526 6,956 6,015 6,520 Source: United Nations Comtrade Database.

76
France - Imports (shelled - 0802.52)
(in metric tons) Country 2012 2013 2014 2015 2016
U.S.A. 2,071 566 837 610 546
Iran 976 480 535 454 494
Germany 67 111 153 123 140
Spain 34 50 37 66 102
Turkey 29 81 9 42 39
United Kingdom 0 1 0 2 0
Italy 37 31 22 40 34
The Netherlands 0 2 1 n/a 26
Greece 23 19 11 24 24
Belgium 1 41 1 1 1
Madagascar 25 1 40 18 9
India 0 0 2 0 1
Luxembourg 34 n/a n/a 5 0
Other 100 5 2 19 9
Total 3,397 1,387 1,650 1,404 1,425 Source: United Nations Comtrade Database.

77
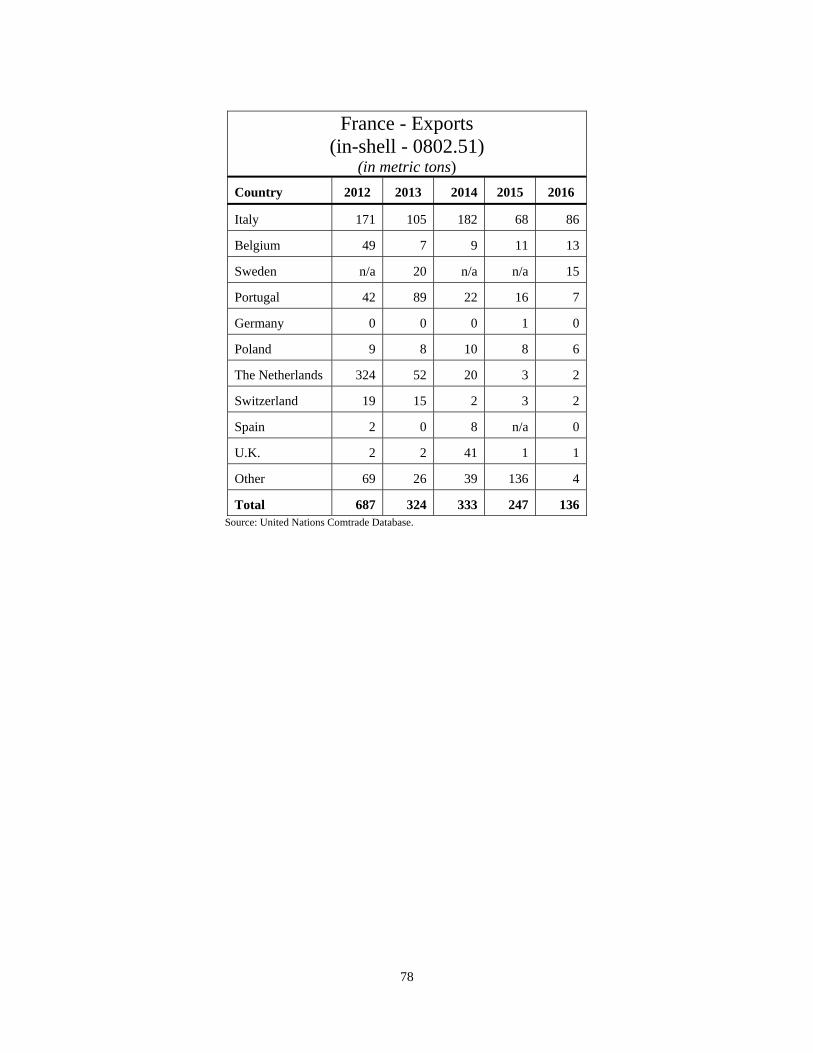
France - Exports (in-shell and shelled)
(in metric tons)
Country 2008 2009 2010 2011 2012 2013 2014 2015 2016
Italy 157 167 227 130 220 156 225 75 94
Belgium 107 87 114 77 66 23 n/a 48 48
Sweden 1 1 6 20 0 20 10 5 15
Portugal 56 38 78 37 45 98 23 18 15
Germany 45 32 15 47 16 17 12 28 9
Poland 0 0 17 18 10 11 12 9 8
The Netherlands 31 69 117 79 366 57 41 4 6
Switzerland 4 35 1 56 36 51 9 8 6
Spain 10 68 100 69 6 7 12 5 5
U.K. 7 6 5 31 22 47 67 5 4
Other 31 148 26 75 88 70 92 181 18
Total 449 651 706 639 875 557 503 386 228 Source: United Nations Comtrade Database.
78
France - Exports (in-shell - 0802.51)
(in metric tons) Country 2012 2013 2014 2015 2016
Italy 171 105 182 68 86
Belgium 49 7 9 11 13
Sweden n/a 20 n/a n/a 15
Portugal 42 89 22 16 7
Germany 0 0 0 1 0
Poland 9 8 10 8 6
The Netherlands 324 52 20 3 2
Switzerland 19 15 2 3 2
Spain 2 0 8 n/a 0
U.K. 2 2 41 1 1
Other 69 26 39 136 4
Total 687 324 333 247 136 Source: United Nations Comtrade Database.

79
France - Exports (shelled - 0802.52)
(in metric tons) Country 2012 2013 2014 2015 2016
Italy 48 51 43 7 8
Belgium 17 16 26 37 35
Sweden 0 0 10 5 0
Portugal 0 10 1 2 7
Germany 16 17 12 27 2
Poland 1 4 2 1 2
The Netherlands 42 5 21 1 3
Switzerland 17 35 7 5 4
Spain 4 7 4 5 5
U.K. 20 45 26 4 4
Other 23 44 18 45 22
Total 188 234 170 139 92 Source: United Nations Comtrade Database.

80
Italy - Imports (in-shell and shelled)
(in metric tons)
Country 2008 2009 2010 2011 2012* 2013* 2014* 2015* 2016
Germany 2,608 2,877 5,047 4,884 3,000 3,870 3,256 3,564 3,131
Turkey 462 396 219 615 709 1,327 424 1,085 1,937
U.S.A. 2,336 2,795 1,898 2,701 2,650 2,557 2,747 1,962 1,863
Iran 1,095 56 291 216 286 169 1,036 1,030 1,845
Greece 11 65 276 381 944 293 823 1,075 1,108
Belgium 2,380 2,308 1,369 1,229 1,234 1,025 926 681 705
U.K. 831 745 666 236 339 249 205 328 296
Spain 8 29 50 137 63 101 189 218 230
France 99 120 245 95 379 442 364 103 153
The Netherlands 208 421 258 45 54 43 197 60 78
Argentina 5 30 28 44 67 37 82 100 29
Syria 130 338 212 253 315 317 69 24 11
Other 146 292 130 229 124 111 117 440** 184
Total 10,319 10,472 10,689 11,065 10,164 10,541 10,435 10,670 11,570 Source: United Nations Comtrade Database. *NOTE: Data obtained from Eurostat. **NOTE: In 2015, Italy reported imports of both in-shell and shelled pistachios from Ireland totaling 388MT. No other occurring of this trade has been observed in the last five most recent years.

81
Italy - Imports (in-shell - 0802.51)
(in metric tons)
Country 2012 2013 2014 2015 2016
Germany 2,416 3,317 2,495 3,068 2,673
Turkey 17 177 0 16 38
U.S.A. 2,060 2,172 2,167 1,599 1,392
Iran 178 10 366 355 1,111
Greece 835 152 687 909 996
Belgium 1,165 949 846 656 685
U.K. 324 214 138 260 256
Spain 43 41 108 127 169
France 334 376 320 42 27
The Netherlands 54 33 197 37 47
Argentina 23 9 72 100 15
Syria 0 41 0 0 0
Other 86 165 38 106 89
Total 7,535 7,656 7,434 7,275 7,498 Source: United Nations Comtrade Database.

82
Italy - Imports (shelled - 0802.52)
(in metric tons) Country 2012 2013 2014 2015 2016
Germany 584 553 761 496 458
U.S.A. 590 385 580 363 472
Turkey 692 1,150 424 1,069 1,935
Iran 108 159 670 675 734
Greece 109 41 136 166 112
Belgium 69 76 80 25 21
U.K. 15 35 67 68 40
Spain 20 60 81 91 61
France 45 66 44 61 126
The Netherlands 0 10 0 23 30
Argentina 44 28 10 0 14
Syria 315 276 69 24 11
Other 38 46 79 334 57
Total 2,629 2,885 3,001 3,395 4,071 Source: United Nations Comtrade Database.

83
Italy - Exports (in-shell and shelled)
(in metric tons)
Country 2008 2009 2010 2011 2012* 2013* 2014* 2015* 2016
France 44 31 98 123 60 88 84 112 304
Germany 23 14 49 57 18 42 154 26 112
U.K. 484 354 279 240 68 68 64 57 56
Belgium 48 52 69 63 46 31 42 47 45
Japan 37 24 20 18 18 24 23 20 20
USA 1 2 10 0 0 0 20 2 13
Slovenia 98 119 99 47 38 25 13 6 3
Luxembourg 30 25 n/a 0 0 10 0 51 0
Other 70 54 77 28 21 10 44 41 50
Total 937 760 738 624 286 339 449 378 612 Source: United Nations Comtrade Database. *NOTE: Data obtained from Eurostat.

84
Italy - Exports (in-shell - 0802.51)
(in metric tons)
Country 2012 2013 2014 2015 2016
France 2 0 11 15 3
Germany 0 0 24 1 40
U.K. 14 3 4 1 0
Belgium 0 0 0 0 0
Japan 1 4 3 3 1
USA 0 0 0 2 1
Slovenia 37 24 11 0 1
Croatia n/a 6 8 3 0
Switzerland 1 1 0 0 0
Luxembourg n/a 10 0 51 0
Other 10 27 18 14 9
Total 65 75 79 90 55 Source: United Nations Comtrade Database.

85
Italy - Exports (shelled - 0802.55)
(in metric tons) Country 2012 2013 2014 2015 2016
France 58 88 73 97 302
Germany 0 42 130 25 71
U.K. 54 66 60 56 55
Belgium 46 31 42 47 45
Japan 18 20 20 17 19
USA 0 0 20 0 12
Slovenia 1 1 2 6 1
Croatia 0 0 0 0 4
Switzerland 1 2 1 3 4
Luxembourg n/a 0 0 0 0
Other 43 14 22 37 45
Total 221 264 370 288 558 Source: United Nations Comtrade Database.

86
Luxembourg - Imports (in-shell and shelled)
(in metric tons)
Country 2008 2009 2010 2011 2012* 2013* 2014* 2015* 2016
U.S.A. 7,211 10,971 20,970 12,352 10,479 9,149 14,825 12,340 8,251
Germany 100 2 62 11 7 18 18 23 56
Belgium 22 20 24 8 0 1 1 1 4
Iran 701 365 198 61 1 1 1 1 2
Morocco n/a n/a n/a 1 1 1 1 1 0
Hong Kong n/a n/a n/a n/a 10 0 n/a n/a n/a
Other 4,138 3,757 3,985 2,028 2,020 30 1 2 2
Total 12,177 15,115 25,239 14,461 10,528 9,172 14,847 12,368 8,315 Source: United Nations Comtrade Database. *NOTE: Data for 2012 through 2015 represents in-shell pistachios. Imports of shelled pistachios represented less than one metric ton from all countries.

87
Luxembourg - Exports
(in-shell - 0802.51)
(in metric tons)
Country 2008 2009 2010 2011 2012* 2013* 2014* 2015* 2016*
Germany 2,389 3,535 6,068 2,685 2,511 599 1,018 2,428 1,297
Italy 113 560 540 399 571 10 0 0 30
France 2,939 2,433 2,789 2,571 1,629 60 21 0 0
Belgium 107 271 605 541 769 n/a 0 0 0
The Netherlands 80 303 820 423 581 10 12 0 0
Spain 192 493 837 639 382 20 20 0 0
U.K. 80 111 384 261 285 0 0 0 0
Greece 0 279 413 183 230 0 0 0 0
Ireland 16 14 190 118 140 0 0 0 0
Poland 68 90 129 134 108 0 0 0 0
Denmark 2 4 33 62 105 0 0 0 0
Austria 244 113 58 74 96 0 0 0 0
Czech Republic 24 84 153 108 90 0 0 0 0
Other 113 209 692 581 428 0 0 8 2
Total 6,367 8,499 13,711 8,779 7,925 699 1,071 2,436 1,329 Source: United Nations Comtrade Database. *NOTE: Data for 2012 through 2015 represents in-shell pistachios. Exports of shelled pistachios represented less than one metric ton to all countries.

88
Spain - Imports (in-shell and shelled)
(in metric tons)
Country 2008 2009 2010* 2011* 2012* 2013 2014 2015 2016*
Iran 4,736 4,137 2,607 1,755 1,307 2,332 1,514 2,330 2,854
Germany 4,440 1,844 3,604 2,677 2,367 2,038 2,689 2,513 2,937
U.S.A. 3,076 3,707 2,456 1,766 2,548 3,132 1,890 2,082 1,865
Portugal 0 0 0 0 22 0 20 111 368
U.K. 394 776 366 582 335 286 61 246 356
Greece 0 19 0 0 222 78 49 123 190
Belgium 213 369 279 616 944 56 67 169 96
Turkey n/a 2 n/a 5 n/a 83 144 13 13
Luxembourg 95 216 326 256 11 229 330 236 0
Other 229 102 202 157 228 218 161 122 256
Total 13,183 11,172 9,840 7,814 7,984 8,452 6,925 7,945 8,935 Source: United Nations Comtrade Database. *NOTE: Data obtained from Eurostat.

89
Spain - Imports (in-shell - 0802.51)
(in metric tons) Country 2012 2013 2014 2015 2016
Iran 1,248 2,279 1,472 2,284 2,840
U.S.A. 2,428 3,070 1,789 1,747 1,827
Germany 2,248 1,826 2,319 2,293 2,722
Portugal 0 0 0 361 362
U.K. 329 286 60 216 327
Greece 222 78 49 123 190
Belgium 916 56 66 169 95
Turkey n/a 70 144 12 2
Luxembourg 11 229 330 236 0
Other 202 24 87 172 204
Total 7,623 8,092 6,316 7,252 8,569
Spain - Imports (shelled - 0802.52)
(in metric tons) Country 2012 2013 2014 2015 2016
Iran 59 53 42 46 14
U.S.A. 120 62 101 335 38
Germany 119 212 370 220 215
Portugal 22 0 20 6 6
U.K. 6 0 1 30 29
Greece 0 0 0 0 0
Belgium 28 0 1 0 1
Turkey n/a 13 0 1 11
Luxembourg 0 0 0 0 0
Other 29 9 94 61 52
Total 361 359 609 693 366 Source: Eurostat.

90
Spain - Exports (in-shell and shelled)
(in metric tons)
Country 2008* 2009* 2010 2011 2012 2013 2014 2015 2016
France 34 15 49 586 120 65 150 314 239
Italy 0 19 23 75 59 124 135 290 184
Germany 48 31 10 n/a 11 94 245 141 182
Portugal 108 78 89 65 74 73 126 132 111
Poland 545 199 11 53 296 138 77 24 8
U.S.A. n/a n/a n/a n/a n/a 36 0 17 3
Morocco 11 18 5 9 n/a 34 0 0 0
Other 24 27 20 50 56 43 205 242 492**
Total 770 387 207 838 617 607 938 1,160 1,219 Source: Eurostat. *NOTE: Data obtained from United Nations Comtrade Database. **NOTE: Melilla exported 350MT of pistachios to Spain in 2016.

91
Spain - Exports (in-shell - 0802.51)
(in metric tons) Country 2012 2013 2014 2015 2016
France 66 51 83 104 122
Italy 60 96 77 175 73
Germany 10 87 236 132 169
Portugal 74 73 105 119 103
Poland 275 138 76 23 8
U.S.A. n/a 36 0 0 3
Morocco n/a 34 0 0 0
Other 48 17 173 195 445
Total 533 532 750 748 923
Spain - Exports (shelled - 0802.52)
(in metric tons) Country 2012 2013 2014 2015 2016
France 54 14 67 210 117
Italy 0 28 58 115 111
Germany 1 7 9 9 13
Portugal 0 0 21 13 8
Poland 21 1 1 1 0
U.S.A. n/a 0 0 17 0
Morocco n/a 0 0 0 0
Other 7 24 32 47 47
Total 83 74 188 412 296 Source: Eurostat.
92
Source: United Nations Comtrade Database.
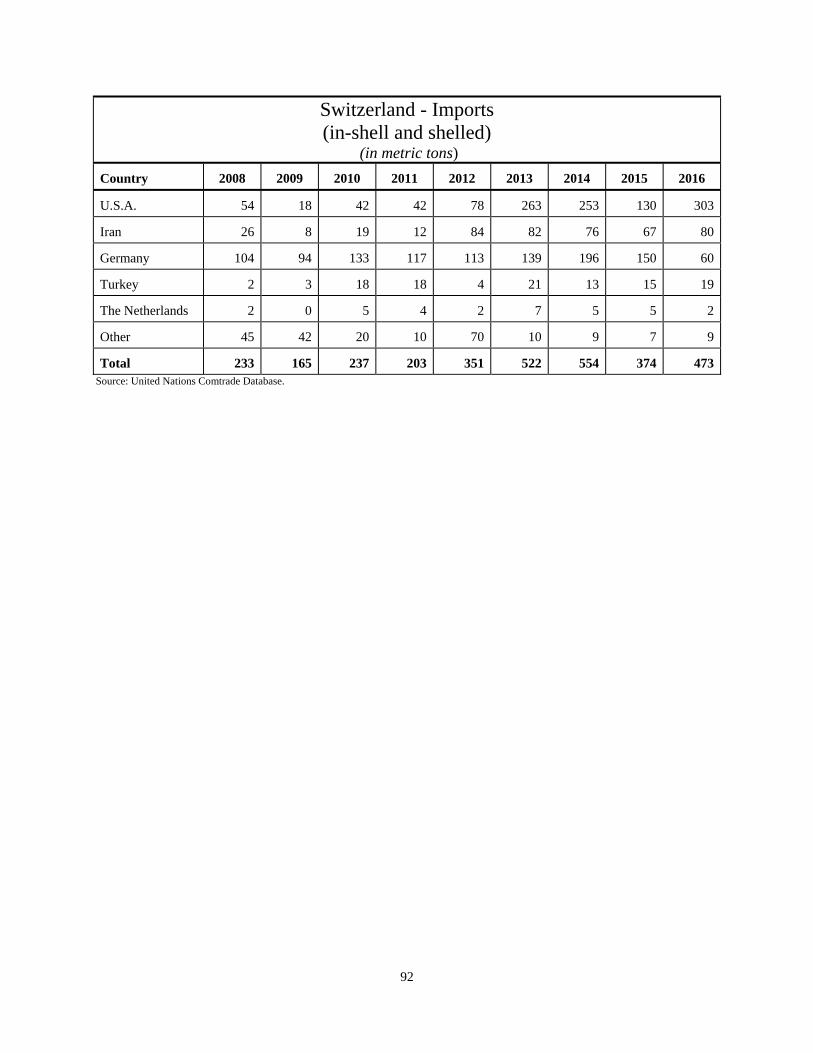
Switzerland - Imports (in-shell and shelled)
(in metric tons)
Country 2008 2009 2010 2011 2012 2013 2014 2015 2016
U.S.A. 54 18 42 42 78 263 253 130 303
Iran 26 8 19 12 84 82 76 67 80
Germany 104 94 133 117 113 139 196 150 60
Turkey 2 3 18 18 4 21 13 15 19
The Netherlands 2 0 5 4 2 7 5 5 2
Other 45 42 20 10 70 10 9 7 9
Total 233 165 237 203 351 522 554 374 473

93
Switzerland - Imports (in-shell - 0802.51)
(in metric tons) Country 2012 2013 2014 2015 2016
U.S.A. 78 255 196 128 302
Iran 21 3 2 4 4
Germany 65 81 190 97 0
Turkey 4 4 0 0 3
The Netherlands 0 0 1 0 0
Other 38 1 4 1 1
Total 206 344 393 230 311
Switzerland - Imports (shelled - 0802.52)
(in metric tons) Country 2012 2013 2014 2015 2016
U.S.A. 0 8 0 2 0
Iran 63 80 74 63 76
Germany 48 58 63 53 60
Turkey n/a 18 13 15 16
The Netherlands 2 7 4 5 2
Other 32 8 5 6 8
Total 145 179 161 144 161 Source: United Nations Comtrade Database.
94
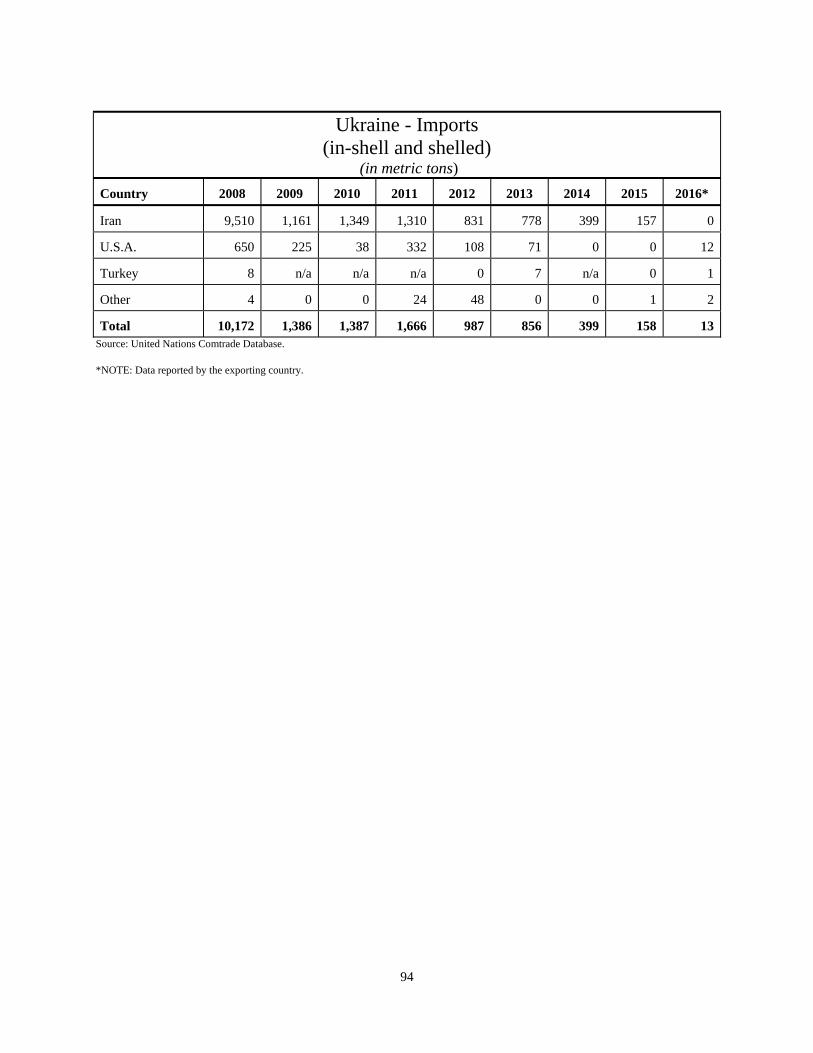
Ukraine - Imports (in-shell and shelled)
(in metric tons)
Country 2008 2009 2010 2011 2012 2013 2014 2015 2016*
Iran 9,510 1,161 1,349 1,310 831 778 399 157 0
U.S.A. 650 225 38 332 108 71 0 0 12
Turkey 8 n/a n/a n/a 0 7 n/a 0 1
Other 4 0 0 24 48 0 0 1 2
Total 10,172 1,386 1,387 1,666 987 856 399 158 13 Source: United Nations Comtrade Database. *NOTE: Data reported by the exporting country.

95
United Kingdom - Imports (in-shell and shelled)
(in metric tons)
Country 2008 2009 2010 2011 2012 2013 2014 2015 2016
Germany 1,835 971 1,168 897 1,190 1,099 1,334 1,293 1,519
U.S.A. 1,804 1,684 1,462 1,328 1,179 1,212 1,541 1,266 1,497
The Netherlands 7,179 518 431 84 744 1,245 1,111 3,224 1,047
France 4 2 20 95 316 450 435 145 271
Italy 376 263 373 512 84 88 66 66 65
Belgium 0 0 23 479 160 94 77 92 16
Greece 70 141 0 0 1 34 9 8 12
Turkey 9 14 7 15 23 11 0 5 8
Other 123 98 69 55 62 27 11 6 14
Total 11,400 3,691 3,553 3,465 3,759 4,260 4,584 6,105 4,449 Source: United Nations Comtrade Database.

96
United Kingdom - Imports (in-shell - 0802.51)
(in metric tons) Country 2012 2013 2014 2015 2016
Germany 1,029 848 957 949 1,064
U.S.A. 1,058 1,181 1,332 1,037 1,256
The Netherlands 722 1,202 1,056 3,170 966
France 309 331 184 36 51
Italy 26 10 3 1 0
Belgium 26 0 0 44 5
Greece 0 30 0 0 10
Turkey 7 5 0 3 1
Other 21 0 3 4 12
Total 3,205 3,607 3,535 5,244 3,366
United Kingdom - Imports (shelled - 0802.52)
(in metric tons) Country 2012 2013 2014 2015 2016
Germany 160 251 377 344 455
U.S.A. 121 32 209 229 241
The Netherlands 22 43 55 54 81
France 7 119 251 109 220
Italy 58 78 63 65 65
Belgium 134 94 77 48 11
Greece 1 4 9 8 2
Turkey 16 6 n/a 2 7
Other 35 25 8 2 1
Total 554 652 1,049 861 1,083 Source: United Nations Comtrade Database.

97
Source: United Nations Comtrade Database.
United Kingdom - Exports (in-shell and shelled)
(in metric tons)
Country 2008 2009 2010 2011 2012 2013 2014 2015 2016
Norway n/a 15 n/a 4 n/a 13 46 68 78
Ireland 108 86 84 42 33 42 54 72 50
UAE 0 6 14 8 2 0 0 0 15
Czech Republic 2 4 4 2 4 5 4 7 7
Italy 7 27 151 18 18 16 19 28 3
Germany 6 9 1 1 14 1 20 39 2
Other 83 74 243 172 6 8 30 11 19
Total 206 221 497 247 77 85 173 225 174

98
United Kingdom - Exports (in-shell - 0802.51)
(in metric tons) Country 2012 2013 2014 2015 2016
Norway n/a 12 6 n/a 0
Ireland 28 36 36 59 25
UAE 0 0 0 0 15
Czech Republic 4 5 4 7 7
Italy 14 10 6 1 2
Germany 3 1 19 15 0
Other 5 7 26 5 17
Total 54 71 97 87 66
United Kingdom - Exports (shelled - 0802.52)
(in metric tons) Country 2012 2013 2014 2015 2016
Norway n/a 1 40 68 77
Ireland 4 5 18 13 25
UAE 2 0 0 0 0
Czech Republic 0 n/a n/a n/a n/a
Italy 4 6 13 27 1
Germany 11 1 1 24 2
Other 2 1 4 6 3
Total 23 14 76 138 108 Source: United Nations Comtrade Database.

99
Middle Eastern
Pistachio Trading Countries

100

101
Israel - Imports (in-shell and shelled)
(in metric tons)
Country 2008 2009 2010 2011 2012 2013 2014 2015 2016
U.S.A. 42 1,423 3,571 2,466 2,493 2,773 3,106 2,643 2,118
Turkey 3,055 906 175 117 333 316 486 701 953
Greece 0 0 0 10 72 13 19 125 114
Other 273 97 108 53 0 67 143 144 18
Total 3,370 2,426 3,854 2,646 2,898 3,169 3,754 3,613 3,203
Israel - Imports (in-shell - 0802.51)
(in metric tons) Country 2012 2013 2014 2015 2016
U.S.A. 1,937 2,529 2,990 2,507 2,002
Turkey 234 103 274 365 520
Greece 62 13 18 125 108
Other 62 33 149 245 20
Total 2,233 2,665 3,413 3,117 2,649
Israel - Imports (shelled - 0802.52)
(in metric tons) Country 2012 2013 2014 2015 2016
U.S.A. 556 243 116 136 116
Turkey 99 214 212 336 432
Greece 10 0 0 0 6
Other 10 0 1 4 0
Total 665 504 341 496 555 Source: United Nations Comtrade Database.
NOTE: While Turkey reports pistachios exported to Israel, the tonnage Israel imports exceeds that which Turkey reports for all years except 2012 (see page 21). The origin of the product that Israel is reporting from Turkey for years 2008 to 2013 is actually Iranian in origin.

102

103
North African Pistachio Trading Countries

104

105
Morocco - Imports (in-shell and shelled)
(in metric tons)
Country 2008 2009 2010 2011 2012 2013 2014* 2015* 2016
U.S.A. 106 238 191 362 272 146 241 59 91
Iran 199 141 98 0 4 n/a 0 0 6
Germany 0 0 0 0 0 0 0 4 5
U.A.E. 0 22 22 0 0 n/a 0 0 0
Other 0 67 1 2 0 25 1 0 0
Total 318 481 314 372 281 171 242 61 103 Source: United Nations Comtrade Database. *NOTE: Data reported by the exporting country.

106

107
North American Pistachio Trading Countries

108

109
Canada - Imports (in-shell and shelled)
(in metric tons)
Country 2008 2009 2010 2011 2012 2013 2014 2015 2016
U.S.A. 1,381 886 1,107 1,449 1,442 1,412 1,050 968 898
Iran 898 374 968 778 882 486 744 697 889
Germany n/a n/a n/a n/a 0 0 0 0 35
U.A.E. 0 0 0 40 98 26 26 15 7
Turkey 32 24 8 11 14 27 14 5 6
Syria 1 2 9 0 1 37 n/a 0 5
Other 8 2 5 9 6 16 22 12 20
Total 2,320 1,288 2,097 2,287 2,443 2,004 1,856 1,697 1,854 Source: United Nations Comtrade Database.

110
Canada - Imports (in-shell - 0802.51)
(in metric tons) Country 2012 2013 2014 2015 2016
U.S.A. 1,231 1,205 791 675 532
Iran 685 403 602 492 596
Germany 0 0 0 0 35
U.A.E. 95 16 26 0 0
Turkey 5 26 2 4 3
Syria n/a n/a 0 0 0
Other 2 4 16 8 10
Total 2,018 1,654 1,437 1,179 1,175
Canada - Imports (shelled - 0802.52)
(in metric tons) Country 2012 2013 2014 2015 2016
U.S.A. 211 207 259 293 366
Iran 197 83 142 205 294
Germany 0 0 0 0 0
U.A.E. 3 10 0 15 7
Turkey 10 2 12 1 4
Syria 1 37 0 0 5
Other 3 12 6 4 3
Total 425 351 419 518 679 Source: United Nations Comtrade Database.

111
Mexico - Imports (in-shell and shelled)
(in metric tons)
Country 2008 2009 2010 2011 2012 2013 2014 2015 2016
U.S.A. 1,854 2,135 1,513 1,013 1,225 971 1,274 1,120 1,095
Iran 2,998 26 174 382 73 96 121 216 167
Other 0 0 0 0 0 0 0 0 0
Total 4,852 2,161 1,687 1,395 1,298 1,067 1,375 1,336 1,261
Mexico - Imports (in-shell - 0802.51)
(in metric tons)
Mexico - Imports (shelled - 0802.52)
(in metric tons) Country 2012* 2013 2014 2015 2016 Country 2012* 2013 2014 2015 2016
U.S.A. 619 896 1,222 1,110 979 U.S.A. 7 75 52 10 116
Iran 0 96 121 216 167 Iran 0 0 0 0 0
Other 0 0 0 0 0 Other 0 0 0 0 0
Total 619 915 1,343 1,326 1,145 Total 7 75 52 10 116 Source: ECONOMIA. *NOTE: For 2012, ECONOMIA only provided statistics for the last six months under the separate HTS codes (shelled and in-shell pistachio) established in 2012 by the World Customs Organization. See page four for additional information.

112

113
South American Pistachio Trading Countries

114

115
Brazil - Imports
(in-shell and shelled)
(in metric tons)
Country 2008 2009 2010 2011 2012 2013 2014 2015 2016
U.S.A. 69 88 40 118 53 157 130 65 152
China 126 137 228 196 261 398 260 182 124
Iran 63 43 86 25 14 52 50 61 22
Argentina 0 0 0 3 1 22 13 68 21
Germany 0 0 0 0 0 0 0 0 2
Other 11 11 3 15 0 1 19 0 0
Total 270 284 364 360 333 631 473 376 320 Source: United Nations Comtrade Database.

116
Brazil - Imports (in-shell - 0802.51)
(in metric tons) Country 2012 2013 2014 2015 2016
U.S.A. 34 102 115 57 125
China 251 392 248 176 120
Iran 0 35 37 18 11
Argentina 0 n/a 3 13 0
Germany 0 0 0 0 0
Other 0 1 19 0 0
Total 289 531 423 264 255
Brazil - Imports (shelled - 0802.52)
(in metric tons) Country 2012 2013 2014 2015 2016
U.S.A. 19 55 15 4 27
China 10 6 12 6 4
Iran 14 17 13 50 12
Argentina 1 22 10 52 21
Germany 0 0 0 0 2
Other 0 1 0 0 0
Total 44 101 50 112 65 Source: United Nations Comtrade Database.

117
Chile - Imports
(in-shell and shelled)
(in metric tons)
Country 2008 2009 2010 2011 2012 2013 2014 2015 2016
U.S.A. 288 266 217 201 142 126 94 30 53
Iran 59 12 37 25 0 n/a n/a 10 50
Other 0 0 0 27 0 0 0 0 0
Total 347 278 254 253 144 126 94 40 103
Chile - Imports (in-shell - 0802.51)
(in metric tons) Country 2012 2013 2014 2015 2016
U.S.A. 111 93 72 30 51
Iran 0 n/a n/a 10 50
Other 0 0 0 0 0
Total 111 93 72 40 101
Chile - Imports (shelled - 0802.52)
(in metric tons) Country 2012 2013 2014 2015 2016
U.S.A. 32 33 22 n/a 3
Italy 0 n/a n/a 0 0
Other 0 0 0 0 0
Total 34 33 22 0 3 Source: United Nations Comtrade Database.

118
Venezuela - Imports
(in-shell and shelled)
(in metric tons)
Country 2008 2009 2010 2011 2012* 2013* 2014* 2015* 2016
U.S.A. 167 204 186 88 326 171 158 n/a 7
Argentina n/a n/a n/a n/a 13 9 0 n/a n/a
China 82 93 18 77 n/a n/a 0 n/a n/a
Lebanon 0 5 23 7 n/a n/a 0 n/a n/a
Other 1,811 358 15 0 6 0 83 n/a n/a
Total 2,060 660 242 172 345 180 241 n/a 7 Source: United Nations Comtrade Database. *NOTE: Data reported by the exporting country.

119
South Pacific Pistachio Trading Countries

120

121
Australia - Imports
(in-shell and shelled)
(in metric tons)
Country 2008 2009 2010 2011 2012 2013 2014 2015 2016
USA n/a n/a n/a n/a n/a 721 n/a 1,036 607
Iran n/a n/a n/a n/a n/a 0 0 247 456
China n/a n/a n/a n/a n/a 34 178 101 155
Hong Kong n/a n/a n/a n/a n/a 12 12 12 24
Other 1,446 1,138 1,480 1,714 1,244 12 2 301 141
Total 1,446 1,138 1,480 1,714 1,244 1,279 1,609 1,697 1,383
Australia - Imports (in-shell - 0802.51)
(in metric tons) Country 2012 2013 2014 2015 2016
USA n/a n/a n/a 574 305
Iran n/a n/a n/a 161 298
China n/a n/a n/a n/a n/a
Hong Kong n/a n/a n/a n/a 12
Other 593 558 958 776 30
Total 593 558 958 962 645
Australia - Imports (shelled - 0802.52)
(in metric tons) Country 2012 2013 2014 2015 2016
USA 18 7 0 463 302
Iran n/a n/a n/a 87 158
China n/a 34 178 101 155
Hong Kong n/a 12 12 12 12
Other 0 11 2 593 111
Total 651 721 652 735 738 Source: United Nations Comtrade Database.

122
New Zealand - Imports
(in-shell and shelled)
(in metric tons)
Country 2008 2009 2010 2011 2012 2013 2014 2015 2016
U.S.A. 114 121 127 94 191 204 180 133 182
Australia 19 4 12 2 3 1 1 18 24
Other 5 2 1 15 1 0 0 0 0
Total 137 127 140 113 195 206 181 151 206
New Zealand - Imports (in-shell - 0802.51)
(in metric tons) Country 2012 2013 2014 2015 2016
U.S.A. 67 101 86 88 158
Australia 0 0 n/a 2 0
Other 0 0 n/a n/a 0
Total 67 102 86 90 158
New Zealand - Imports (shelled - 0802.52)
(in metric tons) Country 2012 2013 2014 2015 2016
U.S.A. 124 103 94 45 23
Australia 3 0 1 16 24
Other 1 1 0 0 0
Total 128 104 95 61 47 Source: United Nations Comtrade Database.

123
Currently Applied Tariffs Raw and Roasted Pistachio Tariffs

124

125
Table 1
Country
Applied† Tariff Rate for 2017
VAT Additional Taxes and Note Descriptions RAW (HTS 0802.5_)
Roasted (HTS 2008.19._ _._ _)
Argentina 10.0% 14.0% Raw 10.5% on CIF + duty + any tax or charge on import
Roasted 21.0% on CIF + duty + any tax or charge on import
Statistical Tax - 0.5%
Australia 0.0% 0.0% GST Standard - 10.0% on CIF + duty + Wine Equalization Tax (if applicable)
Brazil 10.0% 14.0% Banking Charges Tax - 3.0% on the CIF value
Automated system clearance fee (SISCOMEX) Minimum charge is 40 BRL for a first entry. The automated system clearance fees change depending on the number of entries
Sea freight additional charge - 25% on the international sea freight value
Roasted Other Taxes - COFINS 7.6%
PASEP 1.65%
Canada 0.0% 0.0% 7.0% on FOB + duty (if any) + excise (if any) + any tax or charge on import; some products are exempted
Chile 0.0% 0.0% 19.0% on CIF + duty
China 5.0% 13% if in air tight container (canned) 10.0% all other
Raw 11.0% on CIF + duty + consumption tax Roasted 17.0% on CIF + duty + consumption tax
Colombia 0.0% 0.0% Raw - 1.6% Roasted - 16%
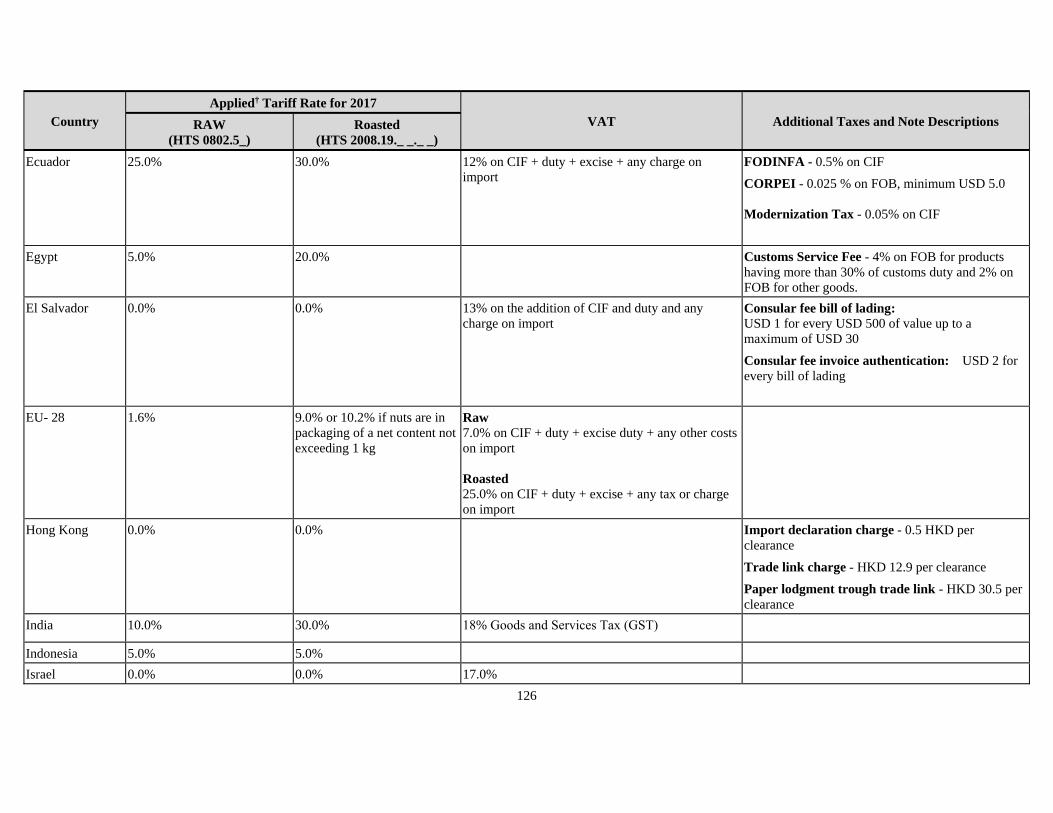
126
Country
Applied† Tariff Rate for 2017
VAT Additional Taxes and Note Descriptions RAW (HTS 0802.5_)
Roasted (HTS 2008.19._ _._ _)
Ecuador 25.0% 30.0% 12% on CIF + duty + excise + any charge on import
FODINFA - 0.5% on CIF
CORPEI - 0.025 % on FOB, minimum USD 5.0
Modernization Tax - 0.05% on CIF
Egypt 5.0% 20.0% Customs Service Fee - 4% on FOB for products having more than 30% of customs duty and 2% on FOB for other goods.
El Salvador 0.0% 0.0% 13% on the addition of CIF and duty and any charge on import
Consular fee bill of lading: USD 1 for every USD 500 of value up to a maximum of USD 30
Consular fee invoice authentication: USD 2 for every bill of lading
EU- 28 1.6% 9.0% or 10.2% if nuts are in packaging of a net content not exceeding 1 kg
Raw 7.0% on CIF + duty + excise duty + any other costs on import
Roasted 25.0% on CIF + duty + excise + any tax or charge on import
Hong Kong 0.0% 0.0% Import declaration charge - 0.5 HKD per clearance
Trade link charge - HKD 12.9 per clearance
Paper lodgment trough trade link - HKD 30.5 per clearance
India 10.0% 30.0% 18% Goods and Services Tax (GST)
Indonesia 5.0% 5.0%
Israel 0.0% 0.0% 17.0%

127
Country
Applied† Tariff Rate for 2017
VAT Additional Taxes and Note Descriptions RAW (HTS 0802.5_)
Roasted (HTS 2008.19._ _._ _)
Japan 0.0% 5.0% Consumption Tax - 5.0%
South Korea4 0.0% 18.0% Will be reduced to 13.5% March 2018
10.0% on CIF + duty + special excise tax + liquor tax + education tax + transportation tax
Lebanon 5.0% 30.0% Roasted
10.0% on CIF + duty
Malaysia 0.0% 0.0% 5.0% on CIF + duty
Mexico 0.0% 0.0%
New Zealand 0.0% 0.0% 12.5% on CIF + duty + any tax on import Import entry transaction fee - NZD 22 per clearance
Norway 0.0% 0.5 NOK/KILOGRAMS (0.0824 USD/Kilogram)
A VAT reduction of 12% (on CIF+ duty + any other taxes or charges on imports) could be applicable for product in the HS Code, otherwise a tax rate of 24% applies on CIF+ duty + any other taxes or charges on imports.
Excise on importation of nutrient and for research - 1.72% on CIF
Panama5 0.0% 6.0% as of October 31, 2017
4 On October 13, 2011, Congress passed and sent to the President the South Korean Free Trade Agreement. Roasted pistachios are subject to a ten-year phase-out with a 4.5% reduction occurring each year on the anniversary date of the agreement’s implementation. Immediately preceding the implementation of the agreement the roasted tariff was 45%. 5 On October 13, 2011, Congress passed and sent to the President the Panamanian Free Trade Agreement. The agreement entered into force on October 31, 2012. Roasted pistachios are subject to a ten-year phase-out with a 1.5% reduction occurring each year on the anniversary date of the agreement’s implementation. Immediately preceding the implementation of the agreement the roasted tariff was 15%.

128
Country
Applied† Tariff Rate for 2017
VAT Additional Taxes and Note Descriptions RAW (HTS 0802.5_)
Roasted (HTS 2008.19._ _._ _)
Philippines 3.0% 10.0% 10.0% on CIF + duty + any tax or charge on Import Import processing fee - PHP 250 per Shipment Documentary Stamp - PHP 265 per shipment
Wharf-age fee - 2% on CIF + duty when (CIF + duty) not exceeding PHP 0.6M. PHP 12000 + 20% of the value exceeding PHP 0.6M when (CIF + duty) exceeding 0.6M but not exceeding PHP 1.1M. PHP 112000 + 40% of the value exceeding PHP 1.1M when (CIF + duty) exceeding 1.1M but not exceeding PHP 2.1M. PHP 512000 + 60% of the value exceeding PHP 2.1M when (CIF + duty) exceeding 2.1M
Peru 0.0% 0.0% 17% on CIF + duty + any tax or charge on import MUNICIPAL TAX - 2% on CIF + duty + other taxes
Insurance tax - 2.25% on CIF
Customs clearance tax - PEN 75.2 when FOB exceeding PEN 9600.
Romania 0.0% n/a 9% on CIF + duty + Customs Commission + Asycuda6 fee
Russia7 5.0% 15.0% 18.0% on CIF + duty + any other taxes or import charges
Customs Clearance Fee - 0.15% on CIF + duty when CIF + duty is less than Euros 500
Singapore 0.0% 0.0% 5.0% on CIF + duty + any other taxes or import charges
South Africa 0.0% 0.0% 14% on 1.1 x (FOB + duty + any charge on import)
6 United Nations Conference on Trade and Development Automated System for Customs Data. 7 Under Russia’s accession commitments agreed too as a part of it becoming a member of the World Trade Organization, the tariff on roasted pistachios will be reduced to 10% by 2015. The 5% tariff on raw pistachios will remain unchanged (WTO document number WT/ACC/RUS/70 and WT/MIN(11)/2). It should be noted, however, that as of August 5, 2014, Russia placed a one-year ban on all raw nut products from the U.S. (HS 0802) in response to U.S. sanctions against Russia as it relates to the ongoing conflict in Ukraine. This ban has been extended into the foreseeable future due to the situation between Russia and Ukraine.

129
Country
Applied† Tariff Rate for 2017
VAT Additional Taxes and Note Descriptions RAW (HTS 0802.5_)
Roasted (HTS 2008.19._ _._ _)
Switzerland 0.0% 11Fr per 100kg gross weight
2.4% on CIF + duty + any tax or charge on import
Taiwan 3.0% 7.5% 5.0% on CIF + duty + commodity tax Trade promotion fee - 0.0415% on CIF
Thailand Min (10% or 8.50 THB per KG whichever is the higher; 33.50 bath per KG but not more than 40%)
30.0%
U.A.E. 5.0% 5.0%
Venezuela 15.0% 20.0% Roasted 15.0% on CIF + duty + any other charge on import
Pre-shipment inspection fee - 1.0% on FOB with a minimum of 250 USD for shipments over USD 5000 only
Vietnam 15.0% 18.0% Raw Roasted 7.0% 14.0%
†NOTE: An Applied Trade Rate refers to actual duties imposed by the importing country which may differ from the Bound Tariff Rate. The Bound Tariff Rate is the maximum rate a duty can be applied on a commodity as a result of the full implementation of the 1994 Uruguay Round Agreement or subsequent WTO membership accessions that are incorporated as a part of a country's tariff schedule of concessions.
Prepared by Schramm, Williams & Associates, Inc. using data from the U.S. Department of Commerce. Terms and Abbreviations BRL - Brazilian Reais CEDEAO - Economic Community of West African States CIF - Cost, Insurance and Freight COFINS - a value-added tax collected by the federal government EDI - Electronic Data Interchange FOB - Free on Board HKD - Hong Kong Dollars NES - NES- Not Elsewhere Specified (shipping) NOK Norwegian Kroner NZD - New Zealand Dollars PASEP - a tax for sectoral adjustment program for State-owned enterprises PEN - Peruvian Nuevo Soles PHP - Philippine Pesos SISCOMEX - Integrated system of Foreign commerce (Sistema Integrado de Comércio Exterior) THB - Thailand Baht USD - United States Dollars

130

131
Appendices
Appendix A – European Union-28 Tree Nut Report Appendix B – Turkey Tree Nut Report Appendix C – China Tree Nut Report


THIS REPORT CONTAINS ASSESSMENTS OF COMMODITY AND TRADE ISSUES MADE BY USDA STAFF AND NOT NECESSARILY STATEMENTS OF OFFICIAL U.S. GOVERNMENT POLICY
Date:
GAIN Report Number:
Approved By:
Prepared By:
Report Highlights:
The European Union-28 is the largest export market for U.S. tree nuts. In 2016, tree nut shipments from the United States to the EU-28 reached $2.95 billion. Almonds totaled $1.6 billion in sales (both in-shell and shelled), followed by walnuts with almost $420 million and pistachios with $380 million. The growing popularity of healthier snacking and eating habits amongst European consumers is expected to continue the positive trend in nuts consumption.
Arantxa Medina, Marketing and Management Assistant
Rachel Bickford, Agricultural Attaché
2017
Tree Nuts Annual
EU-28
SP1729 9/15/2017
Required Report - public distribution
Appendix - A1
EU-28 Tree Nuts Annual 2017 2
Executive Summary:
Disclaimer: This report presents the situation and outlook for tree nuts (almonds, walnuts and pistachios) in the EU-28. This report presents the views of the authors and does not reflect the official views of the U.S. Department of Agriculture (USDA). The data are not official USDA data. This report would not have been possible without the valuable expert contributions from the following Foreign Agricultural Service analysts: Xavier Audran, FAS/Paris covering France Mila Boshnakova, FAS/Sofia covering Bulgaria Ornella Bettini, FAS/Rome covering Italy Monica Dobrescu, FAS/Bucharest covering Romania Marcel Pinckaers, FAS/The Hague covering the Benelux Abbreviations and definitions used in this report Conversion factors: conversion factor is used to convert shelled to in-shell tree nuts. Almonds: 0.6 Walnuts: 2.34 Pistachios: 2.0 GTA Global Trade Atlas Ha hectare; 1 ha = 2.471 acres HS Codes: Harmonized System codes for commodity classification used to calculate trade data. Almonds: Shelled 080212; In-shell 080211 Walnuts: Shelled 080232; In-shell 080231 Pistachios: In-shell 080251, Shelled 080252 (since January 2012) MT Metric ton = 1,000 kg EU MS European Union Member State(s) USD U.S. Dollar (Exchange rate at time of publishing €1=US$ 1.19)
Appendix - A2

EU-28 Tree Nuts Annual 2017 3
Executive Summary:
US and EU: important trading partners The European Union-28 (EU-28) is the largest export market for U.S. tree nuts. In 2016, tree nut shipments from the United States to the EU-28 reached $2.95 billion. Almonds totaled $1.6 billion in sales (both in-shell and shelled), followed by walnuts with almost $420 million and pistachios with $380 million. In 2016, the EU-28 was the primary export destination for U.S. tree nuts, followed by East Asia and the Middle East. The EU-28 accounted for 33 percent of total tree nut exports, East Asia imported 26 percent of the total and the Middle East 12 percent. Within the EU, the most important trade partners for U.S. tree nuts are in order of importance Spain, Germany and the Netherlands, accounting for 60 percent of total EU-28 imports. The United States continues to be the largest supplier of nuts for Europe, with 55 percent of the market share (in value) in 2016. Turkey ranks second with a market share of 19 percent, followed by Iran, Chile and Australia. Almond continues to be the main tree nut with almost 40 percent of EU tree nuts total imports. These numbers prove the importance of the U.S. as a trade partner to the EU. Food processing and snack industry are key buyers of tree nuts
The growing popularity of healthier snacking and eating habits amongst European consumers is expected to continue the positive trend in nuts consumption. The fight against cardiovascular diseases and the promotion of general health and wellbeing, along with the publication of scientific studies stating the benefits of eating nuts, are likely to increase the demand for these products. The European food processing and snack industry are the large users of tree nuts both as an ingredient for traditional sweets and pastries and to re-process and re-export to third countries. Almonds are mainly used as an ingredient for producing marzipan, nougat, turron (Spanish typical Christmas confection) and many other pastries and sweets. Walnuts and pistachio nuts are used as an ingredient for manufacturing ice cream and confectionary products. The snacking industry is making efforts to offer consumers new products and new ways to consume nuts. Innovation is not easy though, especially in traditional markets such as Spain and Italy, where consumers have shown that in most occasions they still prefer the time-honored options. Thus, due to the mature nature of the European market, manufacturers are focusing their strategies on launching new value-added, innovative products rather than volume sales and making emphasis in the health benefits of nuts, both through advertising campaigns and including this information in the packaging.
Appendix - A3

EU-28 Tree Nuts Annual 2017 4
Expanding business in EU market
Since the EU remains a key export market for U.S. tree nuts, exporters continue to explore ways to expand their overseas business. Trade shows are an excellent opportunity both to know the market and to meet potential importers. Some of Europe’s leading trade shows for tree nuts are: Fruit Logistica in Berlin, Germany Alimentaria, in Barcelona, Spain SIAL in Paris, France Anuga in Cologne, Germany Snackex, changing location (next edition in Barcelona in June 2019) Other relevant shows include Food Ingredients, Health Ingredients, Vitafoods, PLMA Amsterdam, for private label, and Biofach, for organic nuts. Finally, it would be advisable for new-to-the-market exporters to have a look at the EU-28 Food and Agricultural Import Regulations and Standards report and Exporter Guides produced at the various EU FAS Offices. US cooperators active in the EU
Trade associations like the Almond Board of California, American Pistachio Growers and California Walnut Commission continue to develop strategies and host activities for the EU market. These trade associations, or so- called cooperators, in cooperation with FAS offices all over Europe, continuously work to further develop the market for U.S. tree nuts.
Appendix - A4

EU-28 Tree Nuts Annual 2017 5
Commodities: Almonds, Shelled Basis Production: The European Union is one of the world’s leading producers and consumers of almonds. Furthermore, the EU is the single largest export market for California almonds, with Spain being the leading single-country market. Annually, California production is exported to more than 100 countries worldwide, and the EU-28 represents approximately one third of California’s almond exports. Spanish production has historically fluctuated greatly. Currently, the high prices paid for almonds are increasing the number of hectares of almonds planted annually as an alternative to the low prices in field crops. New varieties, modernization of the irrigation techniques, and the good prices reached in recent seasons are making Almonds more profitable for investors and improving the expectations of the industry. For MY 2017, the latest official forecast published by the Ministry of Agriculture and Fisheries, Food and Environment (MAPAMA) estimates a production of 71,622 MT (shelled basis), a 20 percent increase compared to previous year’s crop. This is a preliminary figure. According to the MAPAMA initial estimates, most of the main producing regions will increase their production compared to previous marketing year. Only Castilla-La Mancha, affected by severe drought, will see a 25 percent decrease in production. On the phytosanitary side, Xylella fastidiosa represents a growing threat for tree nuts production in Spain, which is putting in place contingency plans to limit the expansion of the outbreaks of this bacterium. Xylella fastidiosa can devastate fruit trees plantations, including tree nut groves. So far, available phytosanitary solutions include destroying affected plant material, increased border control and the ban on the movement of plant material from the affected regions, in order to prevent the bacterium from spreading following the requirement established in Article 6 of EU Commission Implementing Decision 2015/879 as amended. Please see link (Spanish language only) for Spain’s containment plan. Outbreaks in the EU so far have been declared in olive plantations in the Italian province of Lecce, the Balearic Islands (Spain) and in tree nuts plantations in continental Spain (Alicante). Italy is the second largest EU-28 almond producer after Spain. Sicily and Puglia are the main almond-producing areas, accounting together for approximately 88 percent of total supply. Tuono, Pizzuta d'Avola, Fascionello, Filippo Ceo, Fragiulio Grande, Genco, Falsa Barese, Ferragnés are the leading varieties grown in the country. Italy’s MY (marketing year) 2017/18 almond production is forecast to drop by approximately 40 percent compared to the previous year due to the summer draught that affected the Italian peninsula. Quality is expected to be good. Table 1. Major EU Almond Producers by Volume in MT (Shelled Basis)
Appendix - A5

EU-28 Tree Nuts Annual 2017 6
COUNTRY MY 2015/16 MY 2016/17 MY 2017/18 Spain 63,964 59,661 71,622 Italy 20,000 20,000 12,000
Source: FAS Europe Offices Consumption: Almonds represent an important component of the Mediterranean diet. In-shell almonds are mainly sold for fresh consumption. Shelled almonds are milled and generally used as a raw material for confectionary and bakery food companies. Tree nuts imports are indispensable for EU consumers. Traditionally, consumers prefer locally grown products mainly for loyalty and habits, but since local production is not enough to satisfy the enormous demand, the industry depends on imports. Also, pricing plays a key role as domestic production leads to higher prices, pushing consumers to look for lower prices and therefore to imported varieties. Trade:
Imports In MY 2015, the United States was once more the main source of almonds for European importers. U.S. almonds face competition from locally grown almonds, particularly from Spain. The EU is consistently increasing their imports from Australia as production increases, but their export numbers to Europe are still very far from being a real competition. U.S. almonds will likely continue to enter the EU market with highly competitive prices. The major EU-28 importers of U.S. almonds by volume were Spain, Germany and Italy in this order. Many countries import large quantities of almonds destined both for domestic consumption and re-export markets, as well as for the food and snack industry. Table 2. EU-28 Imports of Almonds by Origin in MT (Shelled Basis)
Country of origin MY 2013/14 MY 2014/15 MY 2015/16 United States 221,177 206,844 213,872 Australia 19,951 19,107 20,794 Morocco 1,544 2,009 1,511 Chile 465 449 1,154 Argentina 33 - 675 Syria 83 159 648 Others 2,804 1,706 1,178 TOTAL IMPORTS 246,057 230,274 239,832
Source: GTA Exports The top destinations for EU-28 almonds in MY 2015 were the United States, Switzerland and Melilla.
Appendix - A6

EU-28 Tree Nuts Annual 2017 7
The largest almond exporter is Spain and Spanish exports are destined mainly for other EU MS. Table 3. EU-28 Exports of Almonds by Destination in MT (Shelled Basis)
Country of origin MY 2013/14 MY 2014/15 MY 2015/16 United States 3,476 6,178 5,342 Switzerland 1,704 1,854 1,789 Melilla 26 161 1,481 Ceuta 408 382 1,050 Canada 336 598 690 Australia 158 156 319 Others 4,676 3,941 4,121 TOTAL EXPORTS 10,784 13,270 14,792
Source: GTA Production, Supply and Demand Data Statistics:
Area Planted 0 650,470 0 685,160 0 685,160 (HA) Area Harvested 0 570,989 0 570,609 0 570,609 (HA) Bearing Trees 0 0 0 0 0 0 (1000 TREES)Non-Bearing Trees 0 0 0 0 0 0 (1000 TREES)Total Trees 0 0 0 0 0 0 (1000 TREES)Beginning Stocks 20,000 20,000 18,000 18,000 0 18,000 (MT) Production 96,000 94,929 95,000 90,696 0 103,242 (MT) Imports 264,500 239,832 265,000 250,000 0 255,000 (MT) Total Supply 380,500 354,761 378,000 358,696 0 376,242 (MT) Exports 14,800 14,792 14,000 15,000 0 15,000 (MT) Domestic Consumption 347,700 321,969 346,000 325,696 0 343,242 (MT) Ending Stocks 18,000 18,000 18,000 18,000 0 18,000 (MT) Total Distribution 380,500 354,761 378,000 358,696 0 376,242 (MT)
Market Year Begin:
Aug 2015
Market Year Begin:
Aug 2016
Market Year Begin:
Aug 2017
Almonds,
Shelled Basis
EU-28 USDA
Official
2015 2016 2017
2015/2016 2016/2017 2017/2018
New Post New Post New PostUSDA
Official
USDA
Official
Source: FAS Europe Offices Commodities: Walnuts, Inshell Basis
Appendix - A7

EU-28 Tree Nuts Annual 2017 8
Production: A majority of walnuts (60 percent) produced in France are exported in-shell. Production and exports are increasing on the long run. Exports rose by 80 percent in ten years. However, France is a net importer of shelled walnuts. Due to high domestic processing costs, a part of the walnuts produced in France are shelled abroad, mainly in Moldova, and then imported back. Imports and consumption of shelled walnuts are increasing. Walnut orchards continue to slowly grow driven by both export demand and an increased consumption of shelled walnuts. In 2017, French walnut production is expected to remain stable. However, such figure hides a massive loss of 50 percent of the production in the South-west of France (Grande Aquitaine) because of a disastrous frost in late April 2017. On the other hand, the production in the South East of France (Rhone-Alpes region mainly) is expected to reach record level. A significant share of the walnut production in both regions (about 35 percent) is produced under a GI (Geographical Indication) scheme: the “Noix du Périgord” in the South West (since 2002) and the “Noix de Grenoble” in the South East since 1938. The “Noix de Grenoble” producers’ association regularly complains that foreign producers use the words (not protected in the U.S.) to market their own walnuts. Italy lost its walnut market leadership a few decades ago and now is a leading importer, mainly from the United States. Most walnuts are cultivated in Campania (Southern Italy), where the main varieties are Sorrento and Malizia. Farmers in Northern Italy have established efficient and profitable walnut orchards planted with Lara and Chandler cultivars. Italy’s MY 2017/18 walnut production is preliminarily forecast to increase to approximately 12,000 MT thanks to a good harvest in the South (9,500 MT compared to 6,000 MT in MY 2016/17) despite a slight production reduction in the Nord (2,500 MT compared to 3,000 MT in MY 2016/17) due to the frost in April. Quality is expected to be good. In Spain, there main growing regions are Extremadura, Galicia, Valencia, Castilla-La Mancha, Andalucia, Aragon and Murcia. The MAPAMA has not yet published the official walnut production data for MY 2017. Therefore, if weather conditions are favorable, we can expect an average production of 15,000 MT for current MY. Table 4. Major EU Walnut Producers in MT (In-shell Basis)
COUNTRY MY 2015/16 MY 2016/17 MY 2017/18 France 42,281 40,471 40,000 Romania 33,400 34,100 33,000 Spain 15,300 13,700 15,000
Source: FAS Europe Offices Consumption: Walnuts are mainly purchased in winter time both in-shell and shelled for fresh consumption,
Appendix - A8

EU-28 Tree Nuts Annual 2017 9
particularly during Christmas time. More consumers are increasingly purchasing walnuts all year round due to their perceived nutritional benefits and healthy snacking trends are expected to drive consumption in the forecast period. The continued release of studies and research showing the cardiovascular benefits have made walnuts very popular among health-conscious consumers In this sense, California Walnuts continues to conduct very appropriate consumer advertising campaigns focusing on the health benefits of walnuts as well as the key messages of origin, quality and/or versatility. These actions have a very positive impact in the image of California Walnuts and increased the education on the health benefits of the product. Trade:
Imports The wide gap between EU walnut production and imports provides excellent opportunities for walnut exporters. The United States continues to be the number one supplier of walnuts, both in-shell and shelled. The EU imports various types of nuts for direct consumption as well as for further processing and re-export within the region in different forms, such as salted, baked, fried and mixed nuts. Table 5. EU-28 Imports of Walnuts by Origin in MT (Inshell Basis)
Country of origin MY 2013/14 MY 2014/15 MY 2015/16 United States 84,839 97,586 123,794 Chile 21,710 24,059 30,965 Moldova 23,280 24,476 23,396 Ukraine 19,855 22,172 14,064 India 5,822 2,256 4,566 China 5,014 3,402 1,691 Others 5,304 8,055 5,162 TOTAL IMPORTS 165,824 182,006 203,638
Source: GTA Exports EU-28 exports of walnuts are very limited. The top destinations for EU-28 walnuts in MY 2015/16 were Turkey, Moldova and Switzerland.
Appendix - A9

EU-28 Tree Nuts Annual 2017 10
Table 6. EU-28 Exports of Walnuts by Destination in MT (Inshell Basis)
Country of origin MY 2013/14 MY 2014/15 MY 2015/16 Turkey 7,818 4,215 5,521 Moldova 3,026 2,574 3,351 Switzerland 2,600 2,651 2,989 United States 1,745 708 674 Iraq 978 282 600 Jordan 727 598 594 Others 7,752 5,481 4,527 TOTAL EXPORTS 24,646 16,509 18,256
Source: GTA Production, Supply and Demand Data Statistics:
Area Planted 0 54,924 0 58,083 0 58,763 (HA) Area Harvested 0 46,857 0 46,290 0 46,970 (HA) Bearing Trees 0 0 0 0 0 0 (1000 TREES) Non-Bearing Trees 0 0 0 0 0 0 (1000 TREES) Total Trees 0 0 0 0 0 0 (1000 TREES) Beginning Stocks 35,000 40,000 40,000 40,000 0 40,000 (MT) Production 116,000 117,928 113,000 116,670 0 116,140 (MT) Imports 214,000 182,006 220,000 203,638 0 210,000 (MT) Total Supply 365,000 339,934 373,000 360,308 0 366,140 (MT) Exports 18,300 16,509 12,000 18,256 0 17,000 (MT) Domestic Consumption 306,700 283,425 321,000 302,052 0 309,140 (MT) Ending Stocks 40,000 40,000 40,000 40,000 0 40,000 (MT) Total Distribution 365,000 339,934 373,000 360,308 0 366,140 (MT)
Walnuts,
Inshell Basis
EU-28
2015 2016 2017
2015/2016 2016/2017 2017/2018
USDA
OfficialNew Post
Market Year Begin:
Aug 2015
Market Year Begin:
Aug 2016
Market Year Begin:
Aug 2017
USDA
OfficialNew Post
USDA
OfficialNew Post
Source: FAS Europe Offices Commodities: Pistachios, Inshell Basis Production:
Appendix - A10

EU-28 Tree Nuts Annual 2017 11
Pistachio is a traditional crop in Italy, especially in the Sicily region (Bronte area) which accounts for approximately 90 percent of total supply. In recent years, pistachio production has slightly expanded to other areas in Sicily and Basilicata, where newer and input intensive orchards have been planted. Bianca (also called Napoletana) is the main pistachio variety grown in the country and is normally harvested in September. Since 2004, pistachios from Bronte have been designated by the European Commission as a PDO (Protected Designation of Origin), distinguishing it from all other pistachio varieties worldwide. Pistachio trees production is cyclical, bearing heavily in alternate years. Therefore, after the poor MY 2016/17 campaign, MY 2017/18 will be a ‘higher’ bearing year, but below the 4,000 metric tons of MY 2015/16 due to the frost in April and the hail in May that affected fruit set. Quality is expected to be good. Table 7. Italy Pistachio Production by Volume in MT (In-Shell Basis)
COUNTRY MY 2015/16 MY 2016/17 MY 2017/18 Italy 4,000 200 2,000
Source: FAS Europe Offices It is worth noting the trend of pistachio production in Spain. Pistachio is not a traditional crop in Spain but in the last decade, the number of trees planted has increased significantly. Local pistachio production is still relatively small in Spain, but it is growing dynamically. Table 8. Spain Pistachio Production
2011 2012 2013 2014 2015 2016 Area Planted (ha) 4,279 5,274 5,754 7,334 10,529 14,974 Area Harvested (ha) 3,073 3,632 3,729 4,617 5,362 6,467 Production (MT) 2,708 2,681 2,489 4,052 4,764 5,618
Source: MAPAMA By region, Castilla-La Mancha has seen the greatest increase in the number of trees and, thus, in production. In 2011, there were 3,409 trees in total in this region; 2,454 in production. In 2016, the total number was 10,916 trees, of which 4,898 were producing in the region. Consumption: Domestic EU pistachio production is not sufficient to cover domestic demand, resulting in significant imports from Iran and the United States. The overall pistachios use can be split among many different ones starting from the in-shell basically traded as a snack food or as an ingredient employed by restaurant, shelled pistachios are used by bakeries and food companies (bakeries, cosmetic companies, sweet food companies and so on), while ice-cream makers mainly employ milled pistachios. Trade:
Imports The EU pistachio trade balance remained strongly negative, due to very limited local production. The
Appendix - A11
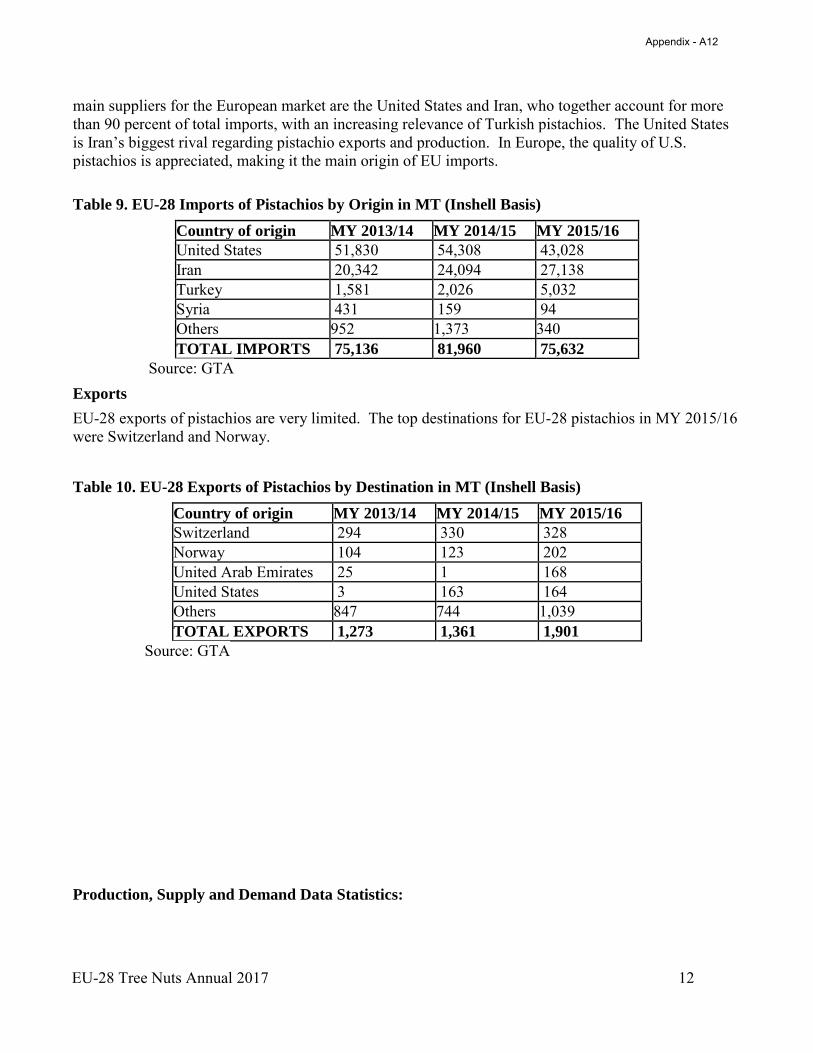
EU-28 Tree Nuts Annual 2017 12
main suppliers for the European market are the United States and Iran, who together account for more than 90 percent of total imports, with an increasing relevance of Turkish pistachios. The United States is Iran’s biggest rival regarding pistachio exports and production. In Europe, the quality of U.S. pistachios is appreciated, making it the main origin of EU imports. Table 9. EU-28 Imports of Pistachios by Origin in MT (Inshell Basis)
Country of origin MY 2013/14 MY 2014/15 MY 2015/16 United States 51,830 54,308 43,028 Iran 20,342 24,094 27,138 Turkey 1,581 2,026 5,032 Syria 431 159 94 Others 952 1,373 340 TOTAL IMPORTS 75,136 81,960 75,632
Source: GTA Exports EU-28 exports of pistachios are very limited. The top destinations for EU-28 pistachios in MY 2015/16 were Switzerland and Norway.
Table 10. EU-28 Exports of Pistachios by Destination in MT (Inshell Basis)
Country of origin MY 2013/14 MY 2014/15 MY 2015/16 Switzerland 294 330 328 Norway 104 123 202 United Arab Emirates 25 1 168 United States 3 163 164 Others 847 744 1,039 TOTAL EXPORTS 1,273 1,361 1,901
Source: GTA
Production, Supply and Demand Data Statistics:
Appendix - A12
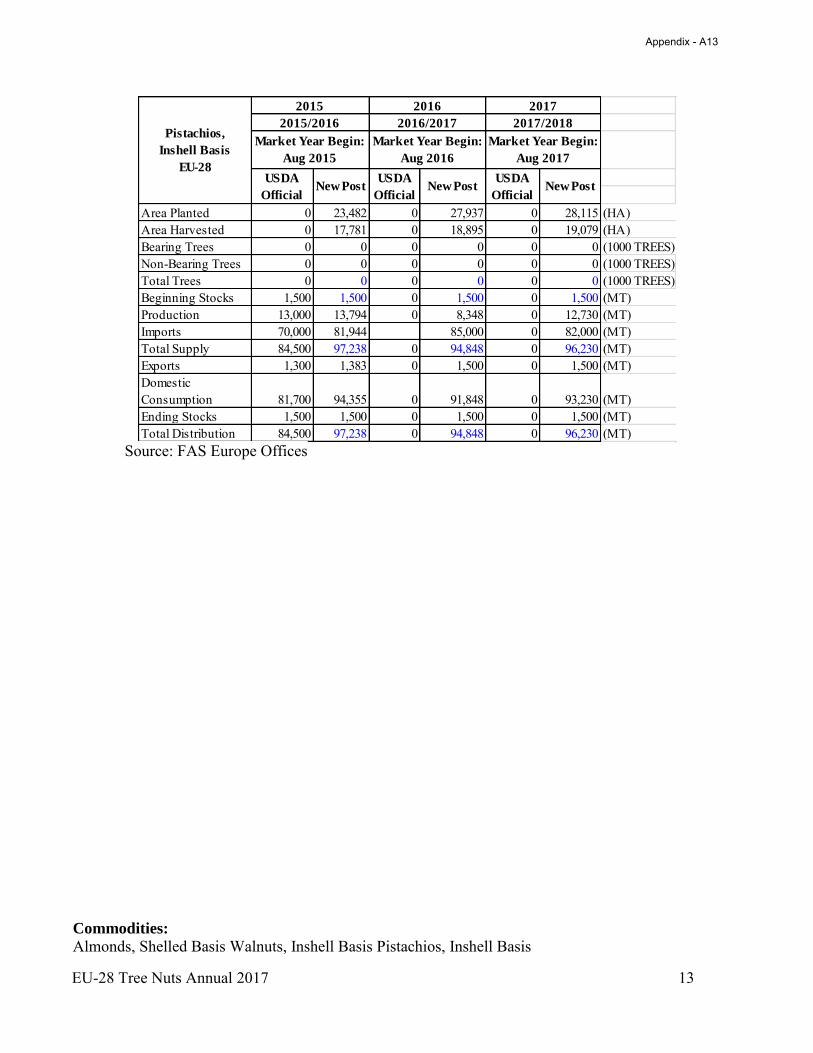
EU-28 Tree Nuts Annual 2017 13
Area Planted 0 23,482 0 27,937 0 28,115 (HA) Area Harvested 0 17,781 0 18,895 0 19,079 (HA) Bearing Trees 0 0 0 0 0 0 (1000 TREES) Non-Bearing Trees 0 0 0 0 0 0 (1000 TREES)Total Trees 0 0 0 0 0 0 (1000 TREES)Beginning Stocks 1,500 1,500 0 1,500 0 1,500 (MT) Production 13,000 13,794 0 8,348 0 12,730 (MT) Imports 70,000 81,944 85,000 0 82,000 (MT) Total Supply 84,500 97,238 0 94,848 0 96,230 (MT) Exports 1,300 1,383 0 1,500 0 1,500 (MT) Domestic Consumption 81,700 94,355 0 91,848 0 93,230 (MT) Ending Stocks 1,500 1,500 0 1,500 0 1,500 (MT) Total Distribution 84,500 97,238 0 94,848 0 96,230 (MT)
USDA
OfficialNew Post
USDA
OfficialNew Post
Pistachios,
Inshell Basis
EU-28 USDA
OfficialNew Post
2015 2016 2017
2015/2016 2016/2017 2017/2018
Market Year Begin:
Aug 2015
Market Year Begin:
Aug 2016
Market Year Begin:
Aug 2017
Source: FAS Europe Offices Commodities:
Almonds, Shelled Basis Walnuts, Inshell Basis Pistachios, Inshell Basis
Appendix - A13

EU-28 Tree Nuts Annual 2017 14
Aflatoxin Certification for Tree Nuts Aflatoxin certification is an import instrument for U.S. exports to the EU of almonds and pistachios. Information on the product specific programs is available from the respective commodity groups as well as from the USDA Agricultural Marketing Service (AMS). Pre-Export Controls on Aflatoxins in U.S. Almonds Article 23 of the EU regulation on official food and feed controls (Regulation (EC) No 882/2004) allows the EU to officially recognize a third country’s system of pre-export checks (PEC) on feed and food prior to export as long as it meets the EU requirements. EU approval of a third country’s system of pre-export checks may only be granted on the condition that the controls carried out in the third country are considered to be sufficient so that the import controls upon arrival to the EU can be significantly reduced. The EU’s Food and Veterinary Office (FVO) assessed the U.S. aflatoxin control system on almonds leading to the EU approval of the pre-export checks program for U.S. almonds in April 2015 in Commission Implementing Regulation (EU) 2015/949. Under this regulation, import authorities are directed to subject consignments of U.S. almonds with a PEC certificate to a less than 1 percent control level at the border. The PEC program is voluntary; a PEC certificate is not a requirement for import into the EU. Shipments without a PEC certificate do not benefit from the reduced inspection levels upon import in the EU. For additional information on PEC aflatoxin certificates, please go to:
Almond Board of California (ABC) USDA-AMS Laboratory Approval Service – Aflatoxin Program
Pistachios For information on aflatoxin certification on pistachios, please visit:
Administrative Committee for Pistachios (ACP) USDA-AMS Laboratory Approval Service – Aflatoxin Program
Extension of the Temporary MRL for Fosetyl The 75 mg/kg temporary MRL for almonds, pistachios, walnuts, cashew nuts, hazelnuts, and macadamias was extended until March 1, 2019 by Commission Regulation (EU) 2016/75. The extension was granted on basis of an anticipated timeline for the submission for an import tolerance, initiated by the U.S. tree nut industry. U.S. residue trials and data analysis have been completed. The subsequent submission of the application for an import tolerance is on track with the original timeline. Maximum Levels for Contaminants in Food
Appendix - A14

EU-28 Tree Nuts Annual 2017 15
Maximum levels of aflatoxins (aflatoxins B1, B2, G1, G2 and M1) are laid down in Commission Regulation (EC) No 1881/2006. If you would like to read more on the subject, the European Commission’s web page on contaminants provides further specific information on contaminants in general, and Plant toxins and mycotoxins and aflatoxins in particular. Author Defined:
Related Reports Report Number Title Date Released E17007 USEU – Phytosanitary Requirements for EU Import of Nuts 01/25/2017 IT1646 Italy Tree Nuts Annual 2016 12/16/2016 PO16 Poland – Dried Fruit and Nut Sector 11/23/2016 BU1634 Bulgaria Tree Nuts Annual 2016 10/19/2016 RO1612 Romania Tree Nuts Annual 2016 10/10/2016 SP1619 EU-28 Tree Nuts Annual 2016 09/22/2016 These reports can be accessed through the FAS GAIN Reports website
Appendix - A15

Appendix - A16

THIS REPORT CONTAINS ASSESSMENTS OF COMMODITY AND TRADE ISSUES MADE BY USDA STAFF AND NOT NECESSARILY STATEMENTS OF OFFICIAL U.S. GOVERNMENT POLICY
Date:
GAIN Report Number:
Approved By:
Prepared By:
Report Highlights:
Depending on the location of orchards and regions, tree nut production was affected by bad weather conditions such as less rainfall in autumn 2016 and winter 2017 which led to drought in certain regions in which tree nut orchards are located. The cumulative rainfall between October 2016 and June 2017 was less than the normal and previous-year values. The rain fall during the spring increased in all regions, except Marmara region compared to normal values. However such an increase has not led to an increase in the production of tree nuts except hazelnut. Also, the frost in late March and April and unexpected May and June hail storms in certain regions, created production losses of tree nuts in MY 2017. Pistachio is the most negatively affected commodity with around 50 percent loss of production compared to the previous year due to weather conditions and being off-year.Post forecasts pistachio production at 80,000 metric ton (MT), walnut production 58,000 MT and almond production at 14,100 MT in MY 2017.Hazelnut is the least affected commodity by weather conditions and there is a considerable increase in hazelnut production in MY 2017 compared to the previous year. Post forecasts hazelnut production at 700,000 MT in MY 2017, up from 460,000 MT last year.
Nergiz Ozbag, Sr. Agricultural Specialist
Christine Strossman, Agricultural Counselor
Turkey Tree Nuts Annual Report 2017
Tree Nuts Annual
Turkey
TR7038 9/29/2017
Required Report - public distribution
Appendix - B1

Commodities:
Report Highlights:
Depending on the location of orchards and regions, tree nut production was affected by bad weather conditions such as less rainfall in autumn 2016 and winter 2017 which led to drought in certain regions in which tree nut orchards are located. The cumulative rainfall between October 2016 and June 2017 was less than the normal and previous-year values. The rain fall during the spring increased in all regions, except Marmara region compared to normal values. However such an increase has not led to an increase in the production of tree nuts except hazelnut. Also, the frost in late March and April and unexpected May and June hail storms in certain regions, created production losses of tree nuts in MY 2017. Pistachio is the most negatively affected commodity with around 50 percent loss of production compared to the previous year due to weather conditions and being off-year.
Post forecasts pistachio production at 80,000 metric ton (MT), walnut production 58,000 MT and almond production at 14,100 MT in MY 2017. Hazelnut is the least affected commodity by weather conditions and there is a considerable increase in hazelnut production in MY 2017 compared to the previous year. Post forecasts hazelnut production at 700,000 MT in MY 2017, up from 460,000 MT last year. Executive Summary:
Depending on the location of orchards and regions, tree nut production except hazelnut was affected negatively by bad weather conditions such as less rainfall in autumn 2016 and winter 2017 which led partial drought in certain regions in which tree nut orchards are located. The cumulative rainfall between the October 2016 - June 2017 was less than the normal and previous-year values. The rainfall during the spring increased in all regions, except Marmara region compared to normal values. However, such an increase has not led to an increase in the production except hazelnut. Also, frost occurred in late March and April and unexpected May and June hail storms in certain regions created production losses of tree nuts in MY 2017. Following the past two year’s “on-year” productions numbers which were the records of recent years, pistachio is the most negatively affected commodity with around 50 percent decline in production. Post forecasts pistachio production at 80,000 metric tons (MT) in MY 2017, down from 155,000 MT last year. Due to bad weather conditions, depending on the regions and orchards, walnut and almond production were partly affected negatively which resulted in a minor amount of losses in the production of each commodity compared to last year. Walnuts are grown throughout almost all parts of the country. Due to a hotter summer season than normal, quality of walnuts also has been partly affected in the orchards
Pistachios, Inshell Basis Almonds, Shelled Basis Walnuts, Inshell Basis
Appendix - B2

located especially in central Anatolia and some part of South East Anatolia. Post forecasts an 8 percent decline in walnut production at 58,000 MT in MY 2017, down from 63,000 MT last year. This amount is far below the amount needed to meet walnut consumption needs of Turkey. Post forecasts that walnut imports will continue due to the insufficient production and high quality walnut demand in the Turkish market. Almond is also grown in most parts of the country. Almonds, similar to walnut, were partly affected from the late spring frosts which occurred in March and April and hail storms in April and May depending on the location of orchards and region in MY 2017. Post forecasts a slight decline of 6 percent to 14,100 MT in almond production in MY 2017, down from 15,100 MT last year. Post forecasts that almond imports will also continue due to demand for high quantity and quality almonds in the Turkish market. Hazelnut is the least affected commodity due to weather conditions in MY 2017. There is a considerable increase in hazelnut production in MY 2017. Post forecasts hazelnut production as 700,000 MT in MY 2017, up from 460,000 MT of last year.
PISTACHIO
Production
Pistachio production is highly cyclical and yields vary dramatically from year to year and between regions and orchards in Turkey. Although MY 2016 had been expected to be “off-year” in the pistachio production normal cycle, it became “on-year” and reached the record of recent years in the production at 155,000 MT, up from 130,000 MT of previous year which was another record of the recent years. South East Anatolia has been suffering from a drought which was caused by less rainfall in autumn 2016 and winter 2017. Since 95 percent of pistachio is grown in this region, production has been negatively affected by the weather conditions. Additionally, since the consecutive past two years were “on-year” in pistachio production and bearing trees used all nutrition reserves to increase the yields and become less productive, MY 2017 became “off-year” which results in a dramatic production decline. Although there was a rainfall increase in spring, this was not effective on pistachio production. Gaziantep and Sanliurfa provinces which represent more than half of the production were the most negatively affected area from unfavorable weather conditions in MY 2017. Therefore, pistachio is the most negatively affected commodity in MY 2017 with around 50 percent decline in the production compared to the previous year. Post forecasts pistachio production at 80,000 MT, down from 155,000 MT last year. Recently, producers and traders have been spending lots of efforts to break the natural production cycle “off year/on year” rule. For this reason, producers have been implementing more good agricultural practices than ever, especially in some part of South East Anatolia in the past few years. Pistachio is mostly grown in dry conditions as irrigation is not common in Turkey. However, more orchards are being irrigated against abnormal drought recent years. In November 2015, a special fertilizer which is named as “green gold” was produced specific to pistachio tree needs by the joint efforts of the
Appendix - B3
government and private sector and it was used first time in the production period of MY 2016. The fertilizer has been distributed by the municipalities to pistachio producers. Also, research activities have been widely conducted by the universities located in Southeast and East Anatolia for better production methods and measures for plant protection for pistachio orchards. Producers and researchers predict that better variety selection and good agricultural practices will solve the problem of “cycling” and it will not be seen in the future. However, current production has still been affected negatively by weather/climate conditions and insufficient irrigation. Pistachio production areas increased by about 25 percent and reached to 3.134.316 decar (da) (1 da = 1000 meter square (m2)). Bearing trees increased by about 30 percent and total tree number increased by about 25 percent in the last five years in Turkey. In previous years, harvest could be done ten years after planting. Due to recent practices and measures, harvest can now be done in five years after planting. Currently, the average pistachio yield is around 4 kilograms (kg)/tree. Although pistachios are grown in more than 50 provinces in Turkey, it is a traditional product of the Southeastern Anatolia Region. The cities Gaziantep, Sanliurfa, Adiyaman, Siirt, Kilis, Kahramanmaras, Mardin and Diyarbakir are the most significant locations for commercial pistachio production and 95 percent of the total production comes from these provinces. 5 percent of pistachio production comes from Aegean, Mediterranean and Marmara regions. Gaziantep and Sanliurfa pistachio varieties are similar, but Siirt has a distinct pistachio variety. Most Turkish pistachios are the Gaziantep (Antep) variety - thinner and smaller than the Iranian variety. Siirt pistachios, which account for about 15 percent of the total production, are somewhere between Gaziantep and Iranian pistachios. The Siirt type yields are not only higher, but fluctuate less than the Gaziantep type. In Turkey, quality is directly related to size: 90 nuts or fewer per 100 grams is considered first quality, 90-100 nuts are second quality, 100-120 nuts are third quality, and more than 120 nuts are fourth quality.
With the increasing number of new saplings planted in the Sanliurfa and Siirt regions, the production of high quality pistachios is predicted to increase in the future since pistachios are replacing olive trees especially in the rain-fed and irrigated areas. Currently, Gaziantep province has more trees than its neighboring province Sanliurfa and around 40 percent of total production comes from Gaziantep. Yields were 4kg/tree in Gaziantep, 2kg/tree in Siirt, 4kg/tree in Adıyaman, 9 kg/tree in Mardin, 8kg/tree in Kahramanmaras and 14 kg/tree in Diyarbakir in MY 2016.
In recent years Aegean Region (in provinces such as Manisa, Izmir, Aydin, Denizli) and West Marmara Region (in provinces such as Canakkale, Tekirdag) have also become popular for pistachio production. Consumption
Most of the Turkey's crop is consumed domestically and consumption varies from year to year according to availability of pistachio on the market. Traditionally, the Turkish people consume 35 percent of total production as a snack food and the rest are used in the production of confectionery, chocolate products, ice cream, especially in desserts and bakery products. Tree nuts are consumed and used as bulk in food industry especially in the producing region (South East) and neighboring regions. Packaging of tree nuts, including pistachios, has doubled over the last few years throughout the country, especially in the coastal regions (Aegean, Mediterranean and Marmara). Packaging mitigates food
Appendix - B4

safety and quality concerns related to high humidity in these regions. Currently, 35 percent of total tree nuts are being packaged, while it was 15 percent few years ago. Post forecasts that the packaging of tree nuts, including pistachios, will increase consumption over time. Current per capita consumption is around 1.6 kg/year in Turkey. Pistachio stocks vary considerably from year to year in line with cyclical production. Moreover, pistachio production, trade and stock amounts have not been registered neither by the Government of Turkey (GOT) nor related unions in the sector. According to tree nut producers, if GOT supported products via incentives, then producers would register their products to get incentives. This would leads to products being registered so that reliable stocks and trade numbers could be achieved, which would partly prevents artificial price fluctuations especially in low production years. These fluctuations have a negative impact on consumption and food industry usages. Due to low production and high prices, Post forecast that pistachio consumption will decrease about ten percent in MY 2017. Because of the low production of pistachio in MY 2017, pistachio prices are very high at the beginning of the harvest. Currently retail prices of Antep pistachio is about 75 TL/kg or US$21,18 /kg and Siirt pistachio is around 70 TL/kg or US$ 19,77 /kg since there is less amount of pistachio in the market (3,5408 TL equal to $1 USD on September 26th , 2017). Traders think that there might be a minor decrease in pistachio prices after harvest is completed. Trade
Turkey is self-sufficient in pistachios. Usually a minor amount of total production is exported. Since the consecutive past two years were “on-year,” pistachio exports increased and imports decreased in MY 2016 compared to the previous year. Export destinations were Saudi Arabia, Israel, Jordan and European Countries such as Italy and Germany. In MY 2017, pistachio production will decrease about fifty percent compared to the past two record year. Post forecasts that exports will considerably decrease compared to the previous year to 5,000 MT since there is low production and usual domestic consumption needs.
Although there is no legal barrier to pistachio imports, there are always fewer imports than the market requires. Since production in the past two years was considerably high, imports tended to decrease. However, Post forecasts that this tendency will not continue in MY 2017 due to low production. Post forecasts pistachio imports at 10,000 MT in MY 2017. According to the “Border Trade Legislation,” pistachio had been allowed to be imported under special trade conditions through border provinces (Artvin, Ardahan, Iğdır, Ağrı, Van, Hakkâri, Şırnak, Mardin, Şanlıurfa, Gaziantep, Kilis , Hatay and Kars) located in the East and South East Anatolia. GOT excluded pistachio from the scope of this legislation in January 2017 so that pistachio is not allowed to be imported through border provinces in the scope of this legislation anymore. However, according to contacts, still considerable amount of Iranian pistachios enter Turkey illegally from especially South Eastern border provinces and are consumed domestically and some are exported as a Turkish product.
Appendix - B5

Gaziantep Commodity Exchange (GCE) will conduct a project which establishes the “Pistachio Perfection Center” in Gaziantep with the support of GOT soon. Scientific studies related to product quality and safety will be carried out in the center aiming to increase the trade and the image of Turkish pistachio.
Stocks
Pistachio stocks vary considerably from year to year in line with cyclical production. Moreover, pistachio production, trade and stock amounts have not been registered neither by the GOT nor related unions in the sector. The “Gaziantep Pistachio Industry Association” was established in 2014. The principle objective of this association is to establish a system for the registration of pistachio production and stocks. However, there is no active registration system in place yet. According to ree nut producers, if GOT support products via incentives, then producers would register their products to get incentives. This will lead to products being registered so that reliable stocks and trade numbers could be achieved which partly prevents price fluctuations. For these purposes GCE has taken some steps to increase the trade and storage of the commodity under safe (food safety) conditions after harvest. GCE got a grant from the Government of Turkey to establish a Licensed Warehouse (LW) in Gaziantep with a capacity of 10,000 MT for long term storage of pistachio under good conditions to eliminate food safety concerns such as aflatoxin. Moreover GCE thinks that the LW will also prevent price fluctuations, so, producers and traders will benefit from the LW system.
The past consecutive two years were “on -year” in the production and record production was achieved for pistachios. Due to low production and high price expectation in MY 2017, traders are forecasted to keep higher stocks of pistachio in MY 2017 compared to previous years. Post forecasts the stocks at 29,500 MT at the beginning of MY 2017. Policy
The GOT stopped providing direct supports to pistachio farmers several years ago but supports the pistachio farmers who are registered in the “Farmers Registration System”. Supports are announced by GOT in the middle of each calendar year. GOT offered farmers the following supports for the year 2017: (Note: 1 US$ =3,5408 TL, on September 26th , 2017) 100TL/ da (US$ 28,24/da) and 400 TL/da (US$112,97 /da) respectively for the establishment of orchards that are planted with standard seedlings and certified seedlings 30TL to 100 TL /da (US$ 8,47 /da to US$ 28,24/da) for organic agriculture; 50 TL/da (US$ 14,12/da) for Good Agricultural Practices; 350TL/da (US$98,85/da) for biological control; 110 TL/da (US$ 31,07/da) biotechnical control; 13 TL/da (US$ 3.67/da) for fuel and fertilizer;
Appendix - B6

Marketing
The Antep Pistachio Promotion Group was established in January 2006 to organize and manage research and marketing activities to increase the consumption and exportation of Antep (which means from the region of Gaziantep) pistachios. However, GOT has abolished all sector promotion groups including the Antep Pistachio Promotion Group in August 2017. Instead, GOT established “Turkey Promotion Group” under Ministry of Economy which aims to increase export and strengthen the image of Turkish commodities, including tree nuts in international markets. Since it is a recently established Group, it is not active yet. TUKSIAD (Turkey Dried Fruits and Nuts Traders and Businessman Association) also plays an active role to promote the consumption of tree nuts including pistachio in Turkey. GUNEYDOGUBIRLIK, which is located in Gaziantep Province, is the only sales cooperative union for pistachios. This sales cooperative follows domestic and foreign trade issues, provides information, conducts market research, and sponsors promotional events. ALMOND Production
Depending on the location of orchards and regions, almond production was also affected negatively by the bad weather conditions in MY 2017. There was less rainfall in autumn 2016 and winter 2017 which led to partial drought in certain regions in which almond orchards are located. The cumulative rainfall between October 2016 - June 2017 was less than the normal and previous-year values. The rainfall during the spring increased in all regions, except Marmara region compared to normal values. However such an increase has not led to an increase in the almond production. Frost occurred in late March and April and also unexpected May and June hail storms in certain regions, created about six percent losses of almond production to 14,100 MT in MY 2017, compared to previous year. Although almond is grown in most parts of the country, it has been accepted as marginal tree, considered a minor crop and not cultivated commercially in Turkey for many years. Ministry of Forestry and Water Affairs (MINFWA) has been conducting “Private Afforestation Projects” for almost 30 years with the target of afforestation and improving of non-arable lands and also improving of rural economy by leasing the forest and government-owned lands to the population living in the villages nearby those areas and private sector as well. Almond has been one of the most planted trees with around 45 percent of total trees in the scope of these projects. In regions such as Central and Eastern Anatolia, lands which are mostly not suitable for almond production due to shallow, low quality soil, eroded , hilly, stony and rocky with high pH or lime have been planted by almond trees. It has been thought that almond is a wild species and does not require special care while growing. That is why it has been planted in those non-arable lands which have been marginal lands in terms of climate and soil. For example, Ankara Province which is located in Central Anatolia is among the leading provinces in which almond is planted despite severe winter conditions and late spring frost. Insufficient care of trees is another reason why most of these projects were unsuccessful.
Appendix - B7
Despite the increase of areas in almond production due to above mentioned afforestation projects, almond production has not increased for many years. Turkey is currently a net importer of almonds. Since imports and prices rise continuously in recent years, the GOT has taken another action to decrease imports and increase domestic production. As a result, the “Almond Action Plan” was prepared by the MINFWA for the period 2013-2017. In the scope of this Plan, 8 million almond seedlings were planned to be planted within 5 years. MINFWA’s implementation of the Plan again focuses on increasing forest area rather than agricultural production. Therefore, Post forecasts that the increased number of trees will not contribute significantly to almond production. The Plan itself has not been implemented successfully because of mainly bad weather conditions in the past three years. 5,8 million almond trees has been planted up to now in the scope of the Plan. The GOT also encourages producers to establish new orchards by allocating free land for 49 years and some interest-free financial support and supports farmers registered in the “Farmers Registration System” for using certified seedlings in these orchards. As a result of these incentives and government support, the establishment of almond orchards has become popular in Turkey and the private sector has concentrated on commercial production in the Aegean, West Marmara, Southeastern Anatolia and Mediterranean Regions. This has resulted in establishing new almond orchards, especially in Izmir, Manisa, Mugla, Denizli, Urfa, Canakkale and Adiyaman Provinces. It is believed that these incentives will increase the production of almonds in the future. Most of the current almond production has been from unstandardized seed which results in inconsistent yields and qualities. The current the average yield for almonds is 13 kg/tree. Consumption Almonds are mainly consumed as snack food and limited amounts are used in the confectionary and cosmetics industries in Turkey. Per capita almond consumption was 0.66 kg/year in the recent past. The packaging of tree nuts, including almonds, has doubled over the last few years throughout the country especially in the coastal regions (Aegean, Mediterranean and Marmara). Packaging mitigates food safety and quality concerns related to high humidity in these regions. Currently, 35 percent of total tree nuts are being packaged, while it was 15 percent years ago. Post forecasts that the packaging and growing understanding of the health benefits of tree nuts, including almonds, will affect consumption positively. Currently, per capita consumption is around 1.1 kg/year. Consumption of almonds, especially as a snack, increased by around twenty percent in MY 2016 due especially to perceived health benefits and packaging of tree nuts including almond. Despite high almond prices, Post forecasts that there will be still a slight increase in almond consumption and forecasts the consumption at 34,800 MT in MY 2017. Almond retail prices are high in Ankara at the beginning of the harvest due to low production and high exchange rate of the US$ against the TL, (for shelled roasted almond; 60-65 TL/kg or US$16,95-18,36 /kg (3,5408 TL to $1US, on September 26th , 2017). Traders predict that almond prices will slightly decrease after harvest is completed. Trade
Appendix - B8

Turkey is a net importer of almonds and the United States continued to be the major almond supplier due to high quality in MY 2016. Chile, Uzbekistan, Ukraine and Iran are the other suppliers of almonds. There is a demand for high quality almonds in the Turkish market. Insufficient domestic production was not able to meet this demand in MY 2016. Therefore, almond import increased by almost 30 percent, at 25,000 MT. According to traders, domestic production is still far below the needs of Turkish market so import will tend to increase in MY 2017. Post forecasts a slight increase around 7 percent in almond import at 25,800 MT in MY 2017. Importers pay 43.2 percent tax per ton on the cost, insurance and freight (CIF) value of the shipment. If the per ton CIF invoice value for in shell almond is at or below US$4,400 the tariff will be applied at US$4,400 per ton. If the per ton CIF invoice value is greater than US$4,400 the tariff will applied at the actual CIF invoice value. The tariff for shelled almonds is based on a minimum CIF per ton value of US$ 6,900, or greater. Traders prefer to import in-shell almonds as the oversight value is significantly less than shelled almonds. HS CODE COMMODITY OVERSIGHT VALUE ON CIF (US$/TON*) 0802.11 In shell Almond 4,400 0802.12 Shelled Almond 6,900 *Ton: Gross Weight Traders import in-shell and shelled almonds mainly from the United States. If almond is imported in the scope of the Inward Processing Regime, importers do not pay tax, because they commit that the imported almond will be exported after it is processed such shelled, packaged, covered by sauce etc. Main almond export destinations are Middle East and North African countries (as Iraq, Saudi Arabia, Libya, Tunisia and Algeria). It is claimed that there is illegal almond trade over Turkey’s eastern border due to mainly high custom taxes. According to contacts, Iranian almonds enter Turkey illegally and are registered in the country as produced domestically and then exported with labels indicating Turkish origin. It is very difficult to estimate the amount of illegal almonds entering Turkey. Policy
Turkey is currently a net importer of almonds. The GOT supports almond farmers who are registered in the “Farmers Registration System”. Supports are announced by GOT in the middle of each calendar year. GOT offered farmers the following supports for the year 2017: (Note: 1 US$ =3,5408 TL, on September 26th , 2017) 100TL/ da (US$ 28,24/da) and 400 TL/da (US$112,97 /da) respectively for the establishment of orchards that are planted with standard seedlings and certified seedlings 30TL to 100 TL /da (US$ 8,47 /da to US$ 28,24/da) for organic agriculture;
Appendix - B9

50 TL/da (US$ 14,12/da) for Good Agricultural Practices; 350TL/da (US$98,85/da) for biological control; 110 TL/da (US$ 31,07/da) biotechnical control; 13 TL/da (US$ 3.67/da) for fuel and fertilizer; There are no subsidies, taxes or other restrictions on almond exports. There is no legal barrier to almond imports, but high tariffs are the key issue. Marketing
There is no specific organization to promote Turkish almonds. TUKSIAD (Turkey Dried Fruits and Nuts Traders and Businessman Association) actively promotes the establishment of almond orchards and the consumption of almonds in Turkey, as well as represents importers and sellers of almonds in Turkey. A recently established “Turkey Promotion Group” under Ministry of Economy aims to increase exports and strengthen the image of Turkish commodities including tree nuts in international markets. However it is not active yet.
WALNUT Production Although walnuts are grown throughout the country, most of the walnut production is from domestic and unstandardized seed which results in inconsistent yields and qualities. Depending on the location of orchards and regions, walnut production was affected negatively by the bad weather conditions in MY 2017. Less rainfall in autumn 2016 and winter 2017 led to partial drought in certain regions in which walnut orchards are located. The cumulative rainfall between October 2016 - June 2017 was less than the normal and previous-year values. The rainfall during the spring increased in all regions, except Marmara region compared to normal values. However such an increase has not led an increase in the walnut production in MY 2017. In addition, frost occurred in late March and April and also unexpected May and June hail storms in certain regions, created about 8 percent losses of walnut production to 58,000 MT in MY 2017, compared to the previous year. This amount is still far below Turkey’s demand for walnuts, especially for high quality walnuts. Despite the fact that walnuts are grown throughout the country, Turkey is currently a net importer of walnuts. Depending on the year, around 55 percent of total consumption is supplied through imports. MINFWA has been conducting “Private Afforestation Projects” for almost 30 years with the target of afforestation and improving of non-arable lands and also improving of rural economy by leasing the forest and treasure lands to the population living in the villages nearby those areas and private sector as well. After almond, walnut has been one of the most planted trees with around 30 percent of total trees in the scope of these projects. In regions such as Central and Eastern Anatolia, the lands which are
Appendix - B10

mostly not suitable for walnut production due to shallow, sloppy, eroded , stony and rocky with high pH or lime have been planted. Death of many plants has been observed due to Armillaria disease (especially in Aegean region), which is a common disease in forest lands, and Phytophthora disease (especially in South Anatolia region). Irrigation is mostly not available in these lands either and delivering the water to the plots is costly, especially on slopes. It has been thought that like almond, walnut does not require special care while growing. That is why it has been planted in those non-arable lands which have been marginal lands in terms of climate and soil. More than two hundred projects have failed due to unsuitable land preferences and/or lack of regular horticultural practices. Despite the increase of areas in walnut production due to above mentioned afforestation projects, walnut production has not been increased for many years. Turkey is still net importer of walnuts. Since imports and prices rise continuously in recent years, the GOT has taken another action to decrease imports and increase domestic production of walnut. As a result, the “Walnut Action Plan” was prepared by the MINFWA for the period 2012-2016. In the scope of this Plan, 5 million walnut seedlings were planned to be planted during this 5 year period. As with the Almond Plan, MINFWA’s implementation of the Walnut Plan focused again on increasing forest area rather than agricultural production. The areas selected for these seedlings have the same deficiencies as the lands dedicated to almonds, such as high soil PH, shallow soil depth, and increased risk of root disease. Post forecasts that the increased number of trees in the forest area will not significantly contribute to walnut production either. Moreover, the Action Plan has not been implemented successfully because of the bad weather conditions in the past years. Around 3 million walnut trees were planted within this Plan. Until 1970, walnuts had been propagated only by seeds and therefore, until the last decade, it was very difficult to find established orchards of standard cultivars. However, the importance of propagation by grafting and budding is now understood and as a result, orchards established of standard cultivars are becoming increasingly widespread. Currently, the major problem for walnut producers in Turkey is low yields. The average yield is around 30 kg/tree. There is great need for improved varieties. Yalova Horticulture Research Institute, which is located in Marmara Region, is Turkey’s leading walnut research facility and the developer of new varieties. Commercial production of the improved varieties developed by this institute has begun in Balikesir, Denizli, Bursa and Kahramanmaras provinces. GOT encourages producers to establish new walnut orchards by allocating free land for 49 years and some interest-free financial support and supports farmers who are registered in the “Farmers Registration System” for using certified seedling in these orchards. These incentives, supports, increased demand and high domestic market prices have encouraged walnut cultivation in recent years and establishment of walnut orchards has become very popular in Turkey. Private sector has concentrated on commercial walnut production in especially Aegean, Marmara, Southeastern Anatolia and Mediterranean regions. New walnut orchards for commercial purposes have been established in Izmir, Manisa, Mugla, Denizli, Kutahya, Balikesir,Bursa, Canakkale, Tekirdag, Aydin, Sakarya, Bitlis, Bingol, Urfa and Adiyaman Provinces in recent years. Chandler is becoming the most popular variety. But it is recently seen that some of orchards established by using the Chandler variety are not operating well, due to unsuitable soil characteristics and climate conditions for Chandler trees. Also, some farmers say that there are problems, especially in the process of certified seedlings, which is a government support program to increase the high quality varieties of walnut orchards in Turkey. After the walnut seedlings have been planted and start maturing, some farmers are noticing that the variety is different than the type which it had been “certified” to be. This situation leads to considerably high
Appendix - B11

losses of investments and as a result, recently some farmers/business operators are starting to leave the walnut orchard business. Consumption In Turkey, walnuts are commonly used in desserts. Turkish desserts such as pestil and köme are made by combining walnuts with mulberries and grapes. Walnuts are also used in baklava, ice cream, halva production, cookies/cakes, breads/bakery, and pastries and in the dried fruit industry as well. The leaves and green shells are used as a pigment in Turkey. Walnut tree has been used for the furniture industry for many years. Walnut consumption has increased significantly in recent years due to perceived health benefits and the packaging of tree nuts, including walnuts. The predominance of walnuts in the market is sold in bulk. Turkish consumers are already purchasing walnuts regularly. Most of consumers agree that walnuts are a good ingredient to use with everyday foods. Additionally, walnuts are the second most purchased nut after hazelnuts. Per capita consumption, which was estimated in the past as 2 kg/year, is now estimated to be almost 3 kg/year. Post forecasts a minor decrease in walnut consumption due to decrease in the production compared to the previous year and a price increase in MY 2017. Post forecasts walnut consumption at 154,300 MT in MY 2017. Currently walnut retail prices are still high and similar to last year’s prices in Ankara at the beginning of the harvest due to high exchange rate of the US$ against the TL, for shelled walnut 60-70 TL/kg or US$16,95-19,77 /kg and for in shell walnut (3,5408 TL to $1 USD on September 26th , 2016). Traders predicts that walnut prices will slightly decrease after the harvest is completed. Trade
Turkey is a net importer for walnuts. There was around a 17 percent increase in walnut imports due to insufficient production and increasing demand of consumers because of positive perception of walnuts in MY 2016. The United States continued to be the major in-shell walnut supplier to the Turkish market. After the United States, walnut suppliers were Chile, Uzbekistan, Iran, Moldova, Ukraine, China, Bulgaria and Romania largely due to price considerations. There is strong demand for high quality walnut imports in the Turkish market. Traders agree that Turkey will continue to be a net importer of walnuts due to high quality product demand. Post forecasts a minor decrease in the walnut import at 96,000 MT in MY 2017. Importers pay 43.2 percent tax on per ton CIF value of the shipment. If the per ton CIF invoice value for in-shell walnuts is at or below US$3,500 the tariff will be applied to US$3,500 per ton. If the per ton CIF invoice value is greater than US$3,500 the tariff will applied to the actual CIF invoice value per ton. The tariff for shelled walnuts is based on a minimum CIF per ton value of US$6,500 or greater. Traders prefer to import in-shell walnuts as the oversight value as it is significantly less than that of shelled walnuts.
Appendix - B12

Turkey’s processing industry has grown in recent years. Imports of both in-shell and shelled walnuts, and exports of shelled walnuts have increased substantially. There are many claims of illegal walnut shipments entering across Turkey’s eastern border due to mainly high custom taxes. At the moment it is very difficult to guess the amount of illegal tree nuts entering Turkey. HS CODE COMMODITY OVERSIGHT VALUE ON CIF (US$/TON*) 0802.31.00.00.00 In-shell Walnut 3,500 0802.32.00.00.00 Shelled Walnut 6,500 *Ton: Gross Weight Traders import walnut as in-shell from mainly the United States. If walnut is imported in the scope of Inward Processing Regime, importers do not pay tax, because they commit that the imported walnut will be exported after it is processed such shelled, packaged, covered by sauce etc. Main walnut export destinations are Iran, Iraq, Saudi Arabia, Tunisia and Algeria.
Policy
The GOT supports walnut farmers who are registered in the “Farmers Registration System” . Supports are announced by GOT in the middle of each calendar year. GOT offered for walnut farmers the following supports for the year 2017: (Note: 1 US$ =3,5408 TL, on September 26th , 2017) 100TL/ da (US$ 28,24/da) and 400 TL/da (US$112,97 /da) respectively for the establishment of orchards that are planted with standard seedlings and certified seedlings 30TL to 100 TL /da (US$ 8,47 /da to US$ 28,24/da) for organic agriculture; 50 TL/da (US$ 14,12/da) for Good Agricultural Practices; 350TL/da (US$98,85/da) for biological control; 110 TL/da (US$ 31,07/da) biotechnical control; 13 TL/da (US$ 3.67/da) for fuel and fertilizer;
Marketing
There is no specific organization to promote Turkish walnut. TUKSIAD (Turkey Dried Fruits and Nuts Traders and Businessman Association) actively promotes the establishment of walnut orchards and the consumption of walnut in Turkey. In August 2017, GOT established “Turkey Promotion Group” under Ministry of Economy which aims to increase exports and strengthen the image of Turkish commodities including tree nuts in international markets. Since the Group is recently established, it is not active yet. HAZELNUT
Appendix - B13

Turkey accounts for 75 percent of world production of hazelnuts and around 70 percent of world exports. In 2017, despite the spring frost which occurred in late April 2017, weather conditions were better than the previous year in the Black Sea region. Continuous rainfall during the spring and early summer throughout the region led to an increase in production of hazelnuts. Hazelnut was the least affected tree nut from the frost that occurred in late spring. Post forecasts hazelnut production as 700,000 MT in MY 2017, up from 460,000 MT of last year. Although hazelnuts are grown in more than 48 provinces around Turkey, production is primarily concentrated along Turkey’s Black Sea coast. Hazelnut orchards are typically located within 30 km of the coast, and inland. In the western Black Sea area, the growing region starts from Zonguldak (east of Istanbul) and extends east along the entire Black Sea and the mountains until close to the Georgian border. There are approximately 4,000,000 people directly or indirectly employed by hazelnut production in Turkey, on an area of 600,000-650,000 hectares. The Black Sea region is divided into three distinct growing areas: (1) The hilly region from Ordu to Trabzon, centered around Giresun, which in a normal year produces about 55 percent of the crop, (2) The flatter, mixed farming region west of Ordu to Samsun, which produces about 15 percent of the crop, and (3) The area west of Samsun, which produces the remaining 30 percent. Hazelnuts require relatively little effort to cultivate and inputs are low. Turkish hazelnuts usually ripen between early and late August depending on the altitude of the orchard and climatic conditions. Hazelnuts are hand-picked from the trees and dried in the sun. Harvesting takes place during several weeks in August and September. Turkey produces around 650,000 MT of hazelnuts under normal climate conditions.
Production, Supply and Demand Data Statistics:
Pistachios, Inshell Basis 2015/2016 2016/2017 2017/2018 Market Begin Year Sep 2015 Sep 2015 Sep 2017
Turkey USDA Official New Post USDA Official New Post USDA Official New Post
Area Planted 0 0 0 0 0 0 Area Harvested 0 0 0 0 0 0 Bearing Trees 0 40600 0 41400 0 42500 Non-Bearing Trees 0 11600 0 11900 0 17100 Total Trees 0 52200 0 53300 0 59600 Beginning Stocks 5000 5000 0 8500 0 29500 Production 130000 130000 0 155000 0 80000 Imports 10000 10000 0 8000 0 10000 Total Supply 145000 145000 0 171500 0 119500 Exports 8500 8500 0 12000 0 5000 Domestic Consumption 128000 128000 0 130000 0 114000 Ending Stocks 8500 8500 0 29500 0 500 Total Distribution 145000 145000 0 171500 0 119500 (HA) ,(1000 TREES) ,(MT)
Appendix - B14

Almonds, Shelled Basis 2015/2016 2016/2017 2017/2018 Market Begin Year Aug 2015 Aug 2016 Aug 2017
Turkey USDA Official New Post USDA Official New Post USDA Official New Post
Area Planted 0 0 0 0 0 0 Area Harvested 0 0 0 0 0 0 Bearing Trees 0 5850 0 5950 0 6660 Non-Bearing Trees 0 4300 0 4550 0 4960 Total Trees 0 10150 0 10500 0 11620 Beginning Stocks 500 500 500 500 0 500 Production 14000 14000 15000 15000 0 14100 Imports 19100 19100 25000 25000 0 25800 Total Supply 33600 33600 40500 40500 0 40400 Exports 4800 4800 5500 5500 0 5100 Domestic Consumption 28300 28300 34500 34500 0 34800 Ending Stocks 500 500 500 500 0 500 Total Distribution 33600 33600 40500 40500 0 40400 (HA) ,(1000 TREES) ,(MT)
Walnuts, Inshell Basis 2015/2016 2016/2017 2017/2018 Market Begin Year Sep 2015 Sep 2016 Sep 2017
Turkey USDA Official New Post USDA Official New Post USDA Official New Post
Area Planted 0 0 0 0 0 0 Area Harvested 0 0 0 0 0 0 Bearing Trees 0 7550 0 7600 0 8150 Non-Bearing Trees 0 5550 0 5590 0 6800 Total Trees 0 13100 0 13190 0 14950 Beginning Stocks 4000 4000 5500 5500 0 6800 Production 60000 60000 63000 63000 0 58000 Imports 89500 89500 105000 105000 0 96000 Total Supply 153500 153500 173500 173500 0 160800 Exports 6500 6500 6000 6000 0 6500 Domestic Consumption 141500 141500 160700 160700 0 154300 Ending Stocks 5500 5500 6800 6800 0 0 Total Distribution 153500 153500 173500 173500 0 160800 (HA) ,(1000 TREES) ,(MT)
Appendix - B15

Appendix - B16

THIS REPORT CONTAINS ASSESSMENTS OF COMMODITY AND TRADE ISSUES MADE BY USDA STAFF AND NOT NECESSARILY STATEMENTS OF OFFICIAL U.S. GOVERNMENT POLICY
Date:
GAIN Report Number:
Approved By:
Prepared By:
Report Highlights: Post forecasts China’s MY 2017/18 in-shell walnut production at 1 million MT, down more than 5 percent on a yearly basis, as frost and drought will reduce production in the key growing areas of Yunnan and Shanxi provinces. Almond production (shelled basis) is forecast at 43,000 MT, up nearly 8 percent from the previous year. China will likely import fewer pistachios as a result of reduced supplies in the United States. Almond and walnut imports are expected to continue rebounding given declining world prices.
Abraham Inouye
Michael Ward
Tree Nuts Annual 2017
China - Peoples Republic of
17047 9/15/2017
Required Report - public distribution
Appendix - C1

Production
Walnuts Post forecasts China’s in-shell walnut production will decrease by more than 5 percent from the previous year to 1 million metric tons (MT) in the marketing year (MY) 2017/18 (September-August). Yunnan province, the country’s largest walnut producing region, experienced a spring frost that killed many walnut plants in higher altitude orchards. As a result, walnut production in this region will fall sharply from the previous year. Walnut quality, however, is expected to improve as walnut sizes are generally big and kernels are quite full. In Shanxi, the third largest walnut producing province, a severe drought since May has led to fruit dropping on older plants. As a result, walnut production is likely to decrease by 10-20 percent from the previous year. However, in Xinjiang province, the second largest walnut producing region, producers will likely harvest more walnuts under favorable weather conditions. In other major producing provinces such as Hebei, Shaanxi, Henan and Gansu, walnut production is expected to grow, due to new bearings and better irrigation. The rapid expansion of walnut crop area has slowed down, but walnut production is expected to continue increasing in the near future as more newly planted trees start bearing. However, most walnuts are planted in hilly or mountainous areas, like the case of Yunnan, and adequate crop management and harvesting relies heavily on the available labor force. The available labor pool in many of these tree nut producing regions is shrinking due to an aging agricultural labor force (the majority of farmers in China are 50 – 60 years old) and continued urban migration. While growing conditions will always be an important factor in production variability, the shrinking agricultural labor pool is developing into a significant constraint on productivity. To illustrate, average nationwide walnut yields are quite low at 2.3 MT per hectare. Almonds China’s almond production (shelled basis) is estimated at 43,000 MT in MY 2017/18 (August-July), up nearly 8 percent from the previous year, as a result of favorable growing conditions and new bearings. Crop area is reported to have stabilized at around 76,000 hectares--95 percent of which is situated in Chache county of the Xinjiang Uygur Autonomous Region. Yields have been low (1.4-1.8 MT per hectare) due to a lack of proper crop management and occasional cold temperatures in spring remain a challenge to production in this region.
Pistachios China’s pistachio production is estimated at 200 MT in MY 2017/18 (September-August), according to industry sources. Almost all pistachios are planted in Kashi county of Xinjiang and the planting acreage is estimated at 3,000 hectares. Private companies have planted pistachios in varietal trials in hopes of establishing a commercial production industry. Other nuts China’s total hazelnut production (in-shell basis) is currently estimated at 42,000 MT in MY 2017/18 (September-August), due largely to acreage expansion. Local hazelnut varieties (small sizes but cold resistant) make up more than 80 percent of total production. The remaining production comes from hybrid varieties (similar to European varieties). Hazelnut acreage is currently estimated at 160,000 hectares, primarily in northeast Liaoning, Heilongjiang, and Jilin provinces as well as western Shanxi
Appendix - C2

and Xinjiang provinces. Hazelnut production is expected to increase quickly in the near future as many new hazelnut plants start bearing. China’s macadamia nut production (in-shell basis) is estimated at 10,000 MT in MY 2017/18 (September-August), an increase of more than 60 percent from the previous year, as a result of increased bearings. The country’s macadamia nut acreage is currently estimated 185,000 hectares and more than 70 percent is planted in Yunnan province. Other growing areas include Guangxi, Guangdong, and Guizhou provinces. It is reported that macadamia nut area will expand to 333,000 hectares by 2020. Industry sources predict that China’s macadamia nut production will start to boom in four or five years after additional new plantings start bearing. China has basically no commercial production of pecans. The 2017 pecan production is estimated at 110 MT, up 10 percent from the previous year. Pecan acreage, however, has reached 34,000 hectares and most plants have not started bearing, according to an industry source. Pecans are planted primarily in Yunnan province and its planted area accounts for nearly 70 percent of the country’s total area. Other major growing areas include Anhui and Jiangsu provinces. Prices Farm gate prices for in-shell walnuts are currently quoted at RMB 32 ($4.8) per kilo in Yunnan, up nearly 30 percent from the previous year, largely because of sharp decline of production in this province. According to industry sources, the current strong walnut market price is expected to fall after the National Day and Moon Festival, two major holidays in China. In Xinjiang, purchase prices for in-shell almonds are RMB 30 ($4.5) per kilo, similar to last year’s price.
Consumption The Chinese domestic consumption of nuts is expected to increase in tandem with income growth and increased awareness of health foods. An industry survey indicates that the proportion of China’s middle class (i.e., annual income exceeding $26,000) has increased from 7 percent of the population in 2010 to 17 percent in 2015. The survey also suggests that the salty snacks market in China is expected to continue increasing at a double-digit pace to RMB 495.2 billion ($75 billion) by 2020, of which nuts and seeds comprise more than 80 percent of the total salty snack consumption. Consumers look for diverse nut flavors and products. The consumption of shelled nuts is increasing much faster than in-shell counterparts. Younger consumers (ages 19 to 35), especially female professionals, have become the major force driving nut consumption. These young consumers prefer to shop online resulting in increasing volumes of sales generated online. The consumption of fresh walnut kernels has become popular in northern China in recent years. Industry sources indicate that walnuts consumed fresh account for nearly 10 percent of the total walnut consumption. Fresh walnut kernels are also a popular cooking ingredient in restaurants and at home. In addition, newly developed snack foods, such as Chinese dates stuffed with walnut kernels, have also effectively increased the consumption of walnuts.
Appendix - C3

Trade
Imports
Most nuts consumed in China are imported—with the exception of walnuts. Pistachios and almonds have been the leaders among nut imports, but the market share of macadamia nuts is quickly catching up. China’s in-shell pecan imports (including transshipment through Hong Kong) have declined from its peak in 2012, but shelled pecan imports are increasing quickly. With increased domestic supplies, hazelnut imports are declining. China’s walnut imports are expected to increase in MY 2017/18 (September-August) on increased worldwide supplies and lower prices. California, the world’s largest walnut exporter, is expected to harvest more walnuts this year given record rainfall and increased bearing acreage. Walnut supplies in Chile and Eastern Europe are also increasing. As a result, walnut prices have further declined from MY 2016/17 levels. The United States is the single largest supplier of walnuts to China. Chinese importers like to buy U.S. walnut varieties such as Chandler and Hartley because of their light shell and kernel color and non-bitter taste which set them apart from local varieties. China’s almond imports are expected to continue recovering in MY 2017/18 (August-July) on lower prices in anticipation of another bumper harvest in the United States. California is expecting a nearly 10 percent production increase primarily because of acreage expansion in recent years. As a result of improved production, almond prices continue to fall from the previous year’s level. The United States is China’s largest supplier of walnuts, followed by Chile. China’s pistachio imports are likely to decrease in MY 2017/18 (September-August) given that U.S. pistachios are estimated to experience a 30 percent production decline due to poor harvests, resulting in higher prices. Although Iran, the other major pistachio producer, is expecting a 75 percent production year-on-year increase, prices remain strong. Exports
China’s walnut exports are expected to continue rebounding in MY 2017/18 due to decreased walnut kernel prices. China exports mainly shelled walnuts (kernels) to Japan and EU markets. In MY 2016/17, domestic prices of walnut kernels dropped significantly in the wake of a 20-percent decrease in demand by walnut beverage companies. The walnut beverage industry is a huge consumer of kernels with daily consumption reaching 30-50 MT, according to industry sources. As a result of reduced kernel prices, China’s export volume of shelled walnuts doubled in MY 2016/17.
Policy In an effort to supplement edible oil consumption and alleviate poverty, the central government has released guidelines and plans to develop woody oil crops (including walnuts) over the past few years (refer to 2016 Tree Nut Annual for details). Consequently, the provincial or lower level governments have also published similar documents including financial support on the development of local woody oil industry. In Henan province, for example, the government has provided a land transfer subsidy of RMB 22,500 ($3,409) per hectare for farmers to consolidate land to plant walnuts. Yunnan, Jiangsu, and Anhui provincial governments have also issued similar programs on macadamia nuts and pecans.
Appendix - C4
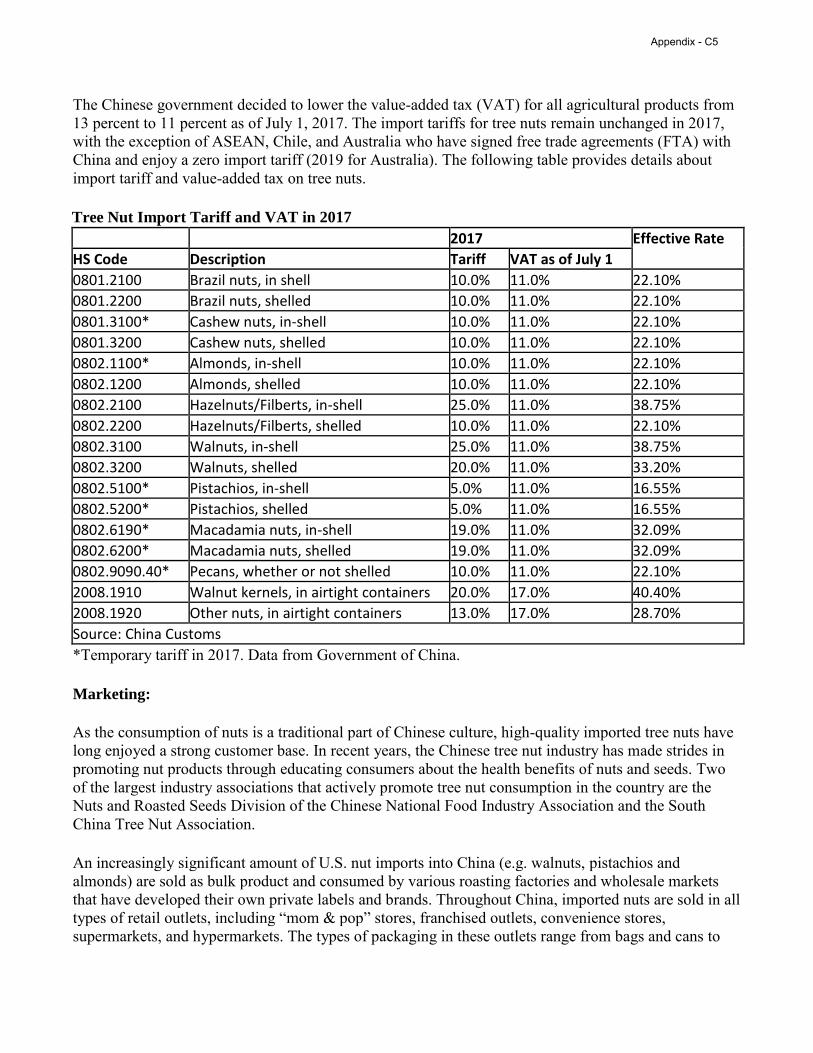
The Chinese government decided to lower the value-added tax (VAT) for all agricultural products from 13 percent to 11 percent as of July 1, 2017. The import tariffs for tree nuts remain unchanged in 2017, with the exception of ASEAN, Chile, and Australia who have signed free trade agreements (FTA) with China and enjoy a zero import tariff (2019 for Australia). The following table provides details about import tariff and value-added tax on tree nuts. Tree Nut Import Tariff and VAT in 2017 2017 Effective Rate
HS Code Description Tariff VAT as of July 1
0801.2100 Brazil nuts, in shell 10.0% 11.0% 22.10%
0801.2200 Brazil nuts, shelled 10.0% 11.0% 22.10%
0801.3100* Cashew nuts, in-shell 10.0% 11.0% 22.10%
0801.3200 Cashew nuts, shelled 10.0% 11.0% 22.10%
0802.1100* Almonds, in-shell 10.0% 11.0% 22.10%
0802.1200 Almonds, shelled 10.0% 11.0% 22.10%
0802.2100 Hazelnuts/Filberts, in-shell 25.0% 11.0% 38.75%
0802.2200 Hazelnuts/Filberts, shelled 10.0% 11.0% 22.10%
0802.3100 Walnuts, in-shell 25.0% 11.0% 38.75%
0802.3200 Walnuts, shelled 20.0% 11.0% 33.20%
0802.5100* Pistachios, in-shell 5.0% 11.0% 16.55%
0802.5200* Pistachios, shelled 5.0% 11.0% 16.55%
0802.6190* Macadamia nuts, in-shell 19.0% 11.0% 32.09%
0802.6200* Macadamia nuts, shelled 19.0% 11.0% 32.09%
0802.9090.40* Pecans, whether or not shelled 10.0% 11.0% 22.10%
2008.1910 Walnut kernels, in airtight containers 20.0% 17.0% 40.40%
2008.1920 Other nuts, in airtight containers 13.0% 17.0% 28.70%
Source: China Customs
*Temporary tariff in 2017. Data from Government of China. Marketing: As the consumption of nuts is a traditional part of Chinese culture, high-quality imported tree nuts have long enjoyed a strong customer base. In recent years, the Chinese tree nut industry has made strides in promoting nut products through educating consumers about the health benefits of nuts and seeds. Two of the largest industry associations that actively promote tree nut consumption in the country are the Nuts and Roasted Seeds Division of the Chinese National Food Industry Association and the South China Tree Nut Association. An increasingly significant amount of U.S. nut imports into China (e.g. walnuts, pistachios and almonds) are sold as bulk product and consumed by various roasting factories and wholesale markets that have developed their own private labels and brands. Throughout China, imported nuts are sold in all types of retail outlets, including “mom & pop” stores, franchised outlets, convenience stores, supermarkets, and hypermarkets. The types of packaging in these outlets range from bags and cans to
Appendix - C5

large boxes. In addition to single variety packages, mixed nuts & seeds, and mixed nuts & dried fruits are popular snack foods in retail markets. Founded in the early 1900s, Yidelu wholesale market in Guangzhou is a key imported nut marketing hub for the entire country. Retail outlets, other wholesale markets, hotel and restaurant chains, e-commerce platforms, and the food manufacturing industry all source at Yidelu market. According to contacts at Yidelu, despite a slowdown in the Chinese economy, demand for high-quality imported nuts in traditional and high-end retail outlets, as well as in e-commerce venues, continues to grow. Retail contacts report in-store promotions and food festivals in 1st and 2nd tier city retail stores highlighting U.S.-origin nuts as safe, healthy, and convenient snack foods have been extremely successful in increasing sales. Consumer promotions timed with Chinese holidays are especially effective as nuts such as pistachios are a must-have for Chinese New Year. Trade association contacts also report that public relations activities and media campaigns have also played important roles in educating consumers on the quality of U.S. tree nuts. Foreign Agricultural Service Trade Offices (ATOs) throughout China, in collaboration with the California Almond Board, the American Pistachios Growers, the U.S. Pecan Growers Council, and the California Walnut Board, have recently held multiple American food festivals and seminars showcasing the quality of U.S. tree nuts. Imported tree nuts are also used in the Chinese baking industry. U.S. almonds, walnuts, pecans and pistachios are commonly included as ingredients in bakery chain breads, cookies, cakes and pastries. In 2017, ATO Guangzhou, together with multiple U.S. trade associations and a high-profile South China bakery chain, implemented a very successful promotion highlighting U.S. tree nuts and other U.S. baking ingredients in emerging market cities. In 2018, ATOs across China plan to implement similar marketing projects. Chinese e-commerce is an increasingly important marketing venue for imported tree nuts. Tree nuts are ideal products for e-commerce sales due to their long shelf life, convenient packaging, and long-distance shipping suitability. A good example of working with e-commerce platforms comes from a major Chinese nut and seed trade association which organizes an annual online campaign called “9.17 China Healthy Nut Day” to encourage consumers to eat a handful of nuts or seeds every day. During the campaign, a series of promotional activities are staged on and around September 17 (“September 17” or “Jiu-Yao-Qi” is a Chinese homophone for “I Must Eat”).
Appendix - C6