www.cert.ucr.edu 1 influence of dilution and particle fractal dimension of diesel exhaust on...
TRANSCRIPT

www.cert.ucr.edu 1
Influence of dilution and particle fractal dimension of diesel exhaust on measured
SOA formation in a smog chamber
Shunsuke Nakao (1, 2), Manish Shrivastava (2, 3), Ahn Nguyen(2, 4), Li Qi (1, 2), Heejung Jung (2, 4), David Cocker III* (1, 2)
University of California, Riverside, Department of Chemical and Environmental EngineeringCollege of Engineering – Center for Environmental Research and Technology (CE-CERT)
Currently at Pacific Northwest National LaboratoryUniversity of California, Riverside, Department of Mechanical Engineering

SOA from POA?
Robinson et al., 2007, Science
• Significant fraction of POA volatilize at higher dilution ratio (~ambient condition)
• Traditional SOA precursors cannot explain SOA from diesel exhaust
SOA from “Intermediate/Semi”-volatility Organic Compounds (IVOCs, SVOCs)

www.cert.ucr.edu 3
Recent studies on SOA from diesel exhaust
High SOA formation
- Weitkamp et al. (2007), CMU chamber
Low/No SOA formation
*without addition of radical source or hydrocarbons
- Samy and Zielinska (2010), EUPHORE chamber- Chirico et al. (2010), PSI chamber
CMU: Carnegie Mellon UniversityEUPHORE: European photoreactorPSI: Paul Scherrer Institute
1) Weitkamp et al., Environ. Sci. Technol., 41, 6969-6975, 20102) Samy and Zielinska, Atmos. Chem. Phys., 10, 609-625, 20103) Chirico et al., Atmos. Chem. Phys. Discuss., 10, 16055-16109, 2010
www.cert.ucr.edu 4
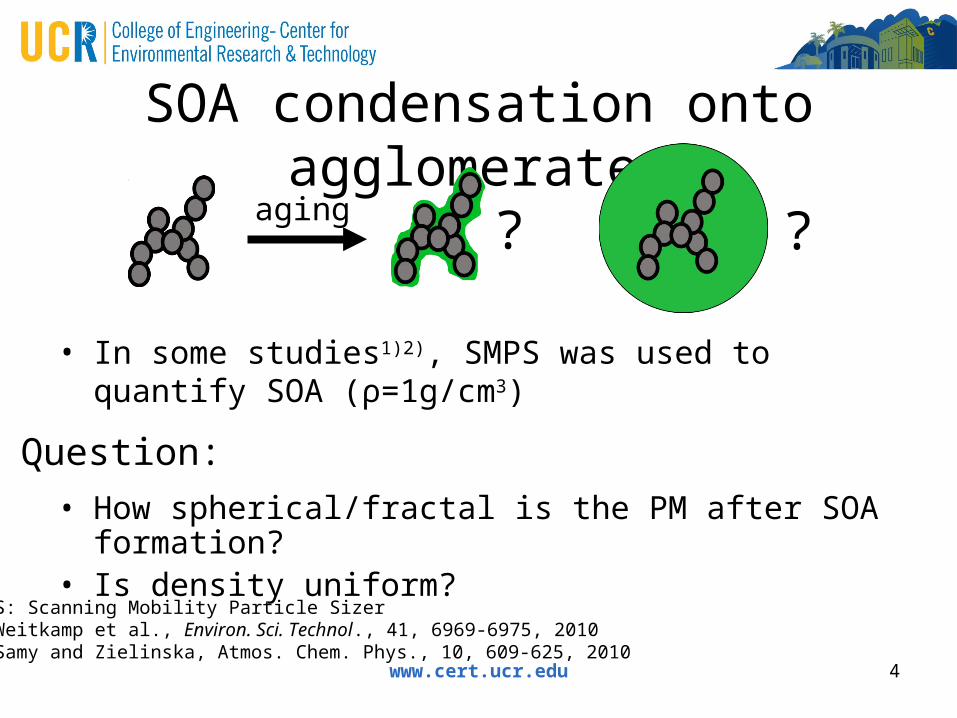
SOA condensation onto agglomerates
• In some studies1)2), SMPS was used to quantify SOA (ρ=1g/cm3)
? ?
• How spherical/fractal is the PM after SOA formation?• Is density uniform?
Question:
SMPS: Scanning Mobility Particle Sizer1) Weitkamp et al., Environ. Sci. Technol., 41, 6969-6975, 20102) Samy and Zielinska, Atmos. Chem. Phys., 10, 609-625, 2010
aging

www.cert.ucr.edu 5
Particle measurement methods
1. SMPS- volume (based on dm)
2. APM – SMPS- mp, dm ρeff
3. HR-ToF-AMS- Non refractory organics
dm: mobility diametermp: mass of particleρeff: effective density
SMPS: Scanning Mobility Particle SizerAPM: Aerosol Particle Mass AnalyzerHR-ToF-AMS: High Resolution-Time-of-Flight Aerosol Mass Spectrometer

CE-CERTmezzanine chamber
FEP, 2mil, 12m3
Dilution method: Ejector
www.cert.ucr.edu 7
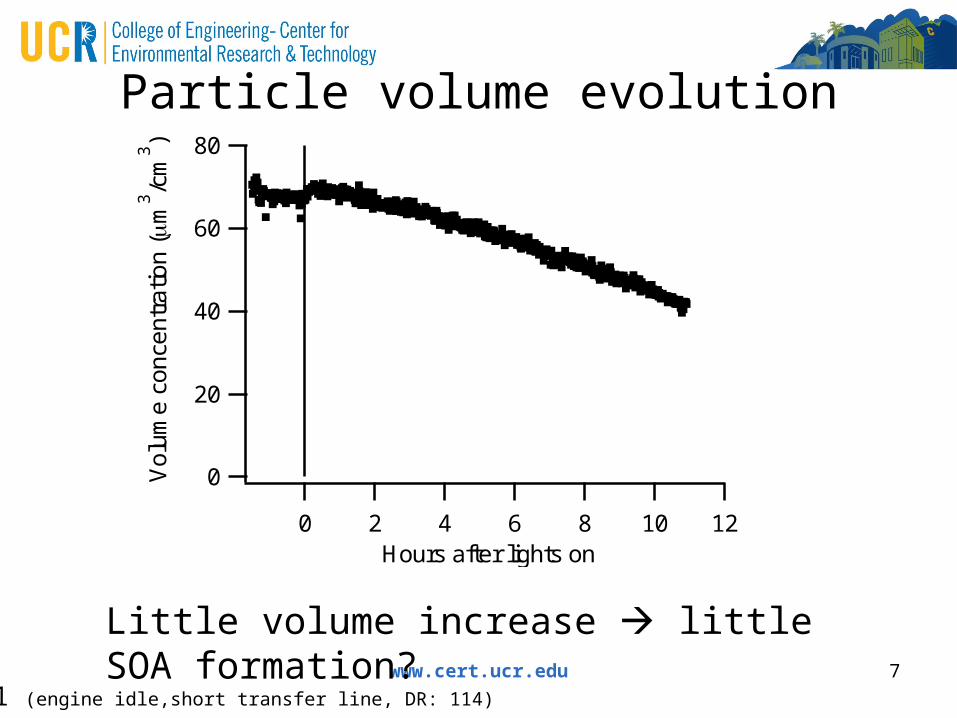
Particle volume evolution80
60
40
20
0Vo
lum
e c
on
cen
tra
tion
(m
3/c
m3)
121086420Hours after lights on
Little volume increase little SOA formation?
Run 1 (engine idle,short transfer line, DR: 114)

www.cert.ucr.edu 8
Particle effective density evolution
How significant is this density increase?
Run 1 (engine idle,short transfer line, DR: 114)
1.5
1.0
0.5
0
Eff
ect
ive
de
nsi
ties
(g/c
m3)
12840Hours after lights on
0.11 fg 0.26 fg 0.51 fg 0.88 fg 1.40 fg
(c)
Larger particles more fractal

www.cert.ucr.edu 9
Size dependent density60
50
40
30
20
10
0
dV
/dln
Dp
3 4 5 6 7 8 9100
2 3 4 5 6 7
mobility diameter (nm)
0.6
0.4
0.2
0.0
Effe
ctive d
en
sity (g/cm
3)
volume density
(b)
• V(dm)• ρ(dm)
Mass concentration
Power function fit Fractal dimension (Df)*
*Park et al., ES&T, 2003, Xue et al., ES&T 2009Run 11 (medium load, long transfer line, DR:519))

www.cert.ucr.edu10
Particle volume and mass concentration
Mobility diameter measurement was insufficient to observe SOA formation
Run 1 (engine idle,short transfer line, DR: 114)
80
60
40
20
0Vo
lum
e c
on
cen
tra
tion
(m
3/c
m3)
or
Inte
gra
ted
Ma
ss c
on
c. (g
/m3)
12840
3.0
2.8
2.6
2.4
2.2
2.0
Df
Volume Mass Df
(a)
Hours after lights on

www.cert.ucr.edu 11
Measurement of SOA by AMS4
3
2
1
0
Org
an
ics
(g
/m3)
121086420Hours after lights on
0.30
0.25
0.20
0.15
0.10
0.05
0.00
C4 H
9+ (
g/m
3) Organics
C4H9+
Run 1 (engine idle,short transfer line, DR: 114)
C4H9+: tracer of primary organic aerosol*
POA
SOA
*Chirico et al. 2010, APCD
www.cert.ucr.edu 12
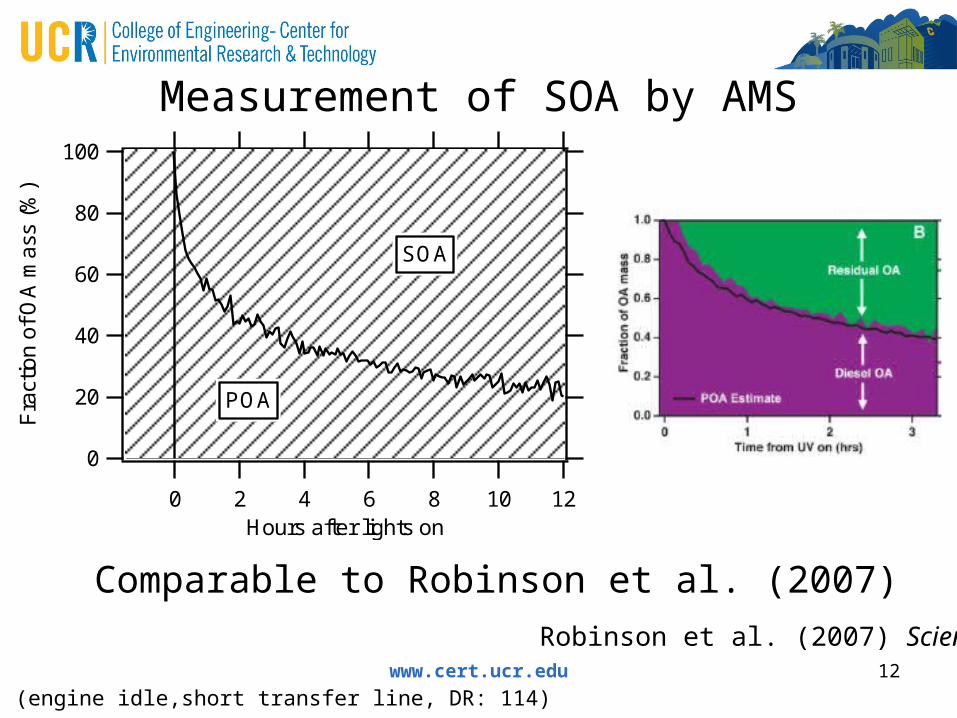
Run 1 (engine idle,short transfer line, DR: 114)
Measurement of SOA by AMS
Comparable to Robinson et al. (2007)
Robinson et al. (2007) Science
100
80
60
40
20
0
Fra
ctio
n o
f O
A m
ass
(%)
121086420Hours after lights on
POA
SOA

CE-CERTmezzanine chamber
FEP, 2mil, 12m3
www.cert.ucr.edu 14
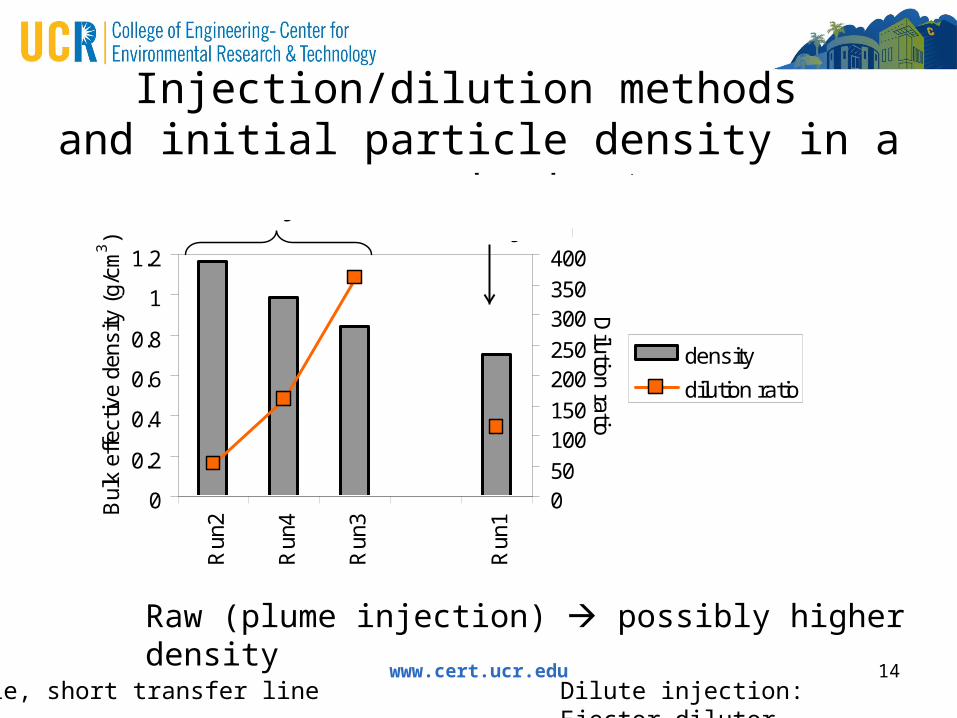
Injection/dilution methods and initial particle density in a smog chamber*
Raw (plume injection) possibly higher density
*Idle, short transfer line
0
0.2
0.4
0.6
0.8
1
1.2
Run
2
Run
4
Run
3
Run
1Bul
k ef
fect
ive
dens
ity (
g/cm
3)
050
100150
200250
300350
400
Dilution ratio
density
dilution ratio
Raw injectionDilute injection
Dilute injection: Ejector dilutor

CE-CERTmezzanine chamber
FEP, 2mil, 12m3
www.cert.ucr.edu 16
100
80
60
40
20
0
Vo
lum
e c
on
cen
tra
tion
(m
3/c
m3)
or
Ma
ss c
on
cen
tra
tion
(g
/m3)
86420Hours after injection
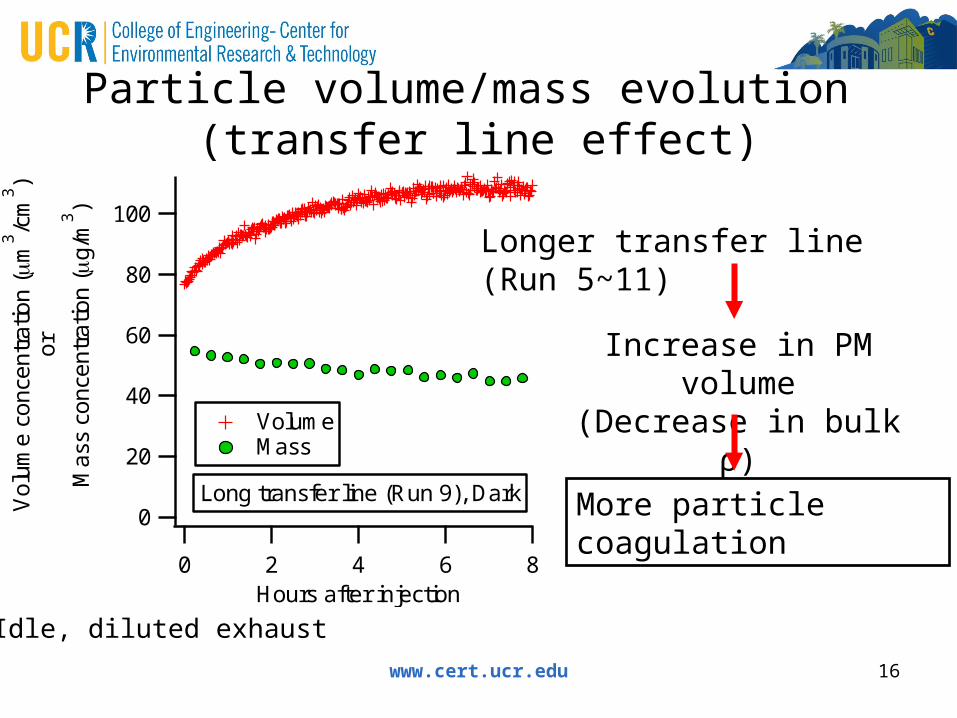
Volume Mass
Long transfer line (Run 9), Dark
Particle volume/mass evolution (transfer line effect)
Idle, diluted exhaust
Longer transfer line (Run 5~11)
Increase in PM volume(Decrease in bulk ρ)
More particle coagulation

www.cert.ucr.edu 17
Discrepancy in diesel-SOA studies
High SOA formation: CMU1)
THIS STUDY
Low/No SOA formation: EUPHORE2), PSI3)
*without addition of radical source or hydrocarbons
1) Weitkamp et al., Environ. Sci. Technol., 41, 6969-6975, 20102) Samy and Zielinska, Atmos. Chem. Phys., 10, 609-625, 20103) Chirico et al., Atmos. Chem. Phys. Discuss., 10, 16055-16109, 2010
• In addition to the difference in engine, different injection/dilution methods may in part explain the gap
• Use of SMPS2) might have lead to underestimation

www.cert.ucr.edu 18
• Mobility diameter measurement is shown to underestimate SOA formation from diesel exhaust in a smog chamber. Hence, mass based measurement is necessary for evaluating SOA from diesel exhaust (e.g., APM, AMS, TEOM)
• Experimental conditions possibly have strong impacts on particle physical evolution in a smog chamber– Raw exhaust injection enhanced particle density– Ejector dilutor speeds evaporation: lower particle density– Longer transfer line enhanced particle coagulation to such an extent that
particle volume increased in dark
• Difference in experimental methods (injection, dilution) may in part contribute to current discrepancy of diesel-chamber studies
Conclusion

www.cert.ucr.edu 19
Acknowledgements
• Graduate advisor: Dr. David Cocker• Current/former students: Christopher Clark,
Ping Tang, Xiaochen Tang, Dr. Quentin Malloy, Dr. Li Qi
• Support staff: Kurt Bumiller, Chuck Bufalino• Funding sources: NSF, W.M. Keck Foundation,
and University of California, Transportation Center
www.cert.ucr.edu 20
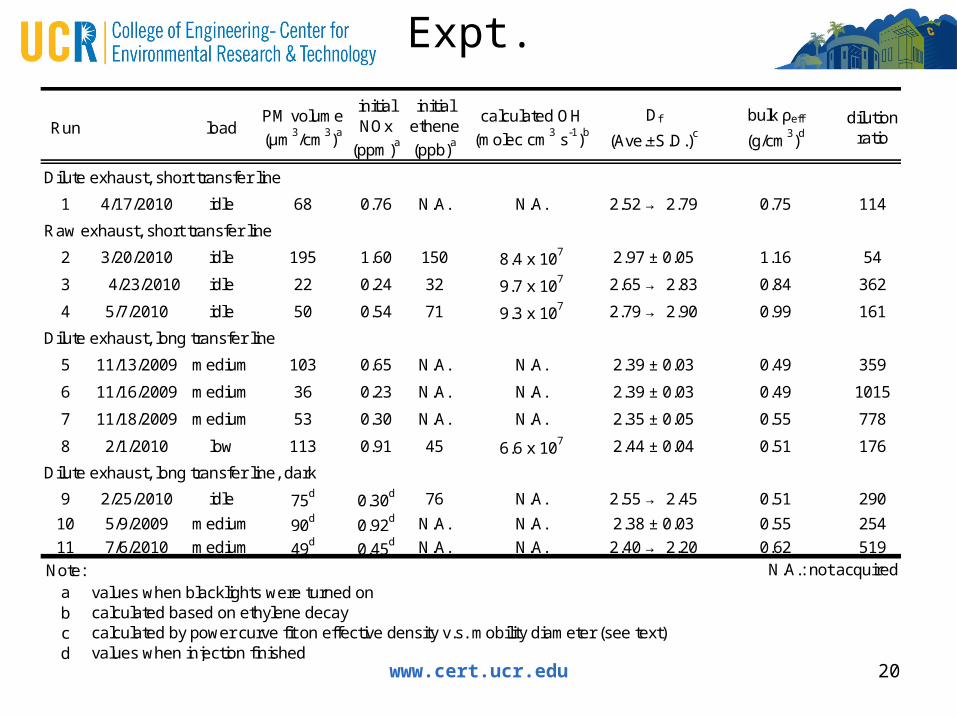
Expt.
Run loadPM volume
(μm3/cm3)a
initial NOx
(ppm)a
initial ethene
(ppb)a
calculated OH
(molec cm3 s-1)b
Df
(Ave.±S.D.)c
bulk ρeff
(g/cm3)ddilution
ratio
Dilute exhaust, short transfer line
1 4/17/2010 idle 68 0.76 N.A. N.A. 2.52 → 2.79 0.75 114
Raw exhaust, short transfer line
2 3/20/2010 idle 195 1.60 150 8.4 x 10⁷ 2.97 ± 0.05 1.16 54
3 4/23/2010 idle 22 0.24 32 9.7 x 10⁷ 2.65 → 2.83 0.84 362
4 5/7/2010 idle 50 0.54 71 9.3 x 10⁷ 2.79 → 2.90 0.99 161
Dilute exhaust, long transfer line
5 11/13/2009 medium 103 0.65 N.A. N.A. 2.39 ± 0.03 0.49 359
6 11/16/2009 medium 36 0.23 N.A. N.A. 2.39 ± 0.03 0.49 1015
7 11/18/2009 medium 53 0.30 N.A. N.A. 2.35 ± 0.05 0.55 778
8 2/1/2010 low 113 0.91 45 6.6 x 10⁷ 2.44 ± 0.04 0.51 176
Dilute exhaust, long transfer line, dark
9 2/25/2010 idle 75d 0.30d 76 N.A. 2.55 → 2.45 0.51 290
10 5/9/2009 medium 90d 0.92d N.A. N.A. 2.38 ± 0.03 0.55 254
11 7/6/2010 medium 49d 0.45d N.A. N.A. 2.40 → 2.20 0.62 519
Note: N.A.: not acquireda values when blacklights were turned onb calculated based on ethylene decayc calculated by power curve fit on effective density v.s. mobility diameter (see text)d values when injection finished

www.cert.ucr.edu 21
Particle fractal dimension (Df)
Df = 1: straight chain, 2: sheet, 3: sphere
fD
g
a
RCN
3' fDmeff dC
If a is constant, N is proportional to mass
(Park et al. 2003, Xue et al. 2009)