x-ray radiography measurements and numerical simulations
TRANSCRIPT

ILASS Americas 28th Annual Conference on Liquid Atomization and Spray Systems, Dearborn, MI, May 2016
X-ray radiography measurements and numerical simulations of cavitation in a metal nozzle
D. J. Duke*, A. B. Swantek, K. E. Matusik, C. F. Powell
Energy Systems Division Argonne National Laboratory
Lemont IL 60439 USA
A. L. Kastengren X-ray Science Division
Argonne National Laboratory Lemont IL 60439 USA
J. P. Viera, R. Payri
CMT-Motores Térmicos Universitat Politècnica de València
Camino de Vera s/n, 46022 Valencia, Spain
D. P. Schmidt Department of Mechanical & Industrial Engineering
University of Massachusetts-Amherst Amherst MA USA
Abstract
Making quantitative measurements of the vapor distribution in a cavitating nozzle is difficult, owing to the scattering of light at the phase interfaces and walls, as well as the small scales involved. In this paper, we present the results of new x-ray radiography experiments performed at the 7-BM beamline of the Advanced Photon Source at Argonne National Laboratory. X-ray radiography enables quantitative measurement of the fluid density in multi-phase flows that are optically opaque. Cavitation in a submerged beryllium nozzle 500 microns in diameter with L/D ratio of 6 was studied. Beryllium was used as it is highly transparent to x-rays. It can withstand higher pressures than plastic models and has a surface roughness similar to a metal fuel injector. We present quantitative, time-resolved measurements of cavitation vapor distribution with a spatial resolution of 5um and a temporal bandwidth of 6.5MHz. The measurements are compared to RANS and LES predictions of the flow made using a homogeneous relaxation model. The properties of the gasoline surrogate used in the experiments have been replicated in a pressure-enthalpy lookup table that avoids the need for a simplified equation of state. Comparisons are made at cavitation and Reynolds numbers typical of diesel injectors, and variations between the quantitative experimental vapor fraction data and the simulations are discussed. In addition to quantitative comparisons of the time-average vapor fraction distribution in the nozzle, the time-resolved radiography data enable quantitative comparison of the power spectrum of the vapor volume fraction between experiments and simulations. The data highlight the need for validation of both time-average and transient phenomena in cavitation simulations.
*Corresponding author: [email protected]

ILASS Americas 28th Annual Conference on Liquid Atomization and Spray Systems, Dearborn, MI, May 2016
Introduction The behavior of cavitation in small nozzles is of
importance in a range of areas, particularly in the operation of direct gasoline and diesel fuel injectors. Cavitation in fuel injectors has been known for some time to have an effect on the spray [1-4] and as a result can alter the combustion process and affect emissions [5-6]. Cavitation in small nozzles continues to be an area of active research [7-8], as the physics of cavitation in highly turbulent internal flows is not yet fully understood.
A substantial effort continues to be made in the modeling of cavitating flows [9-11]. A range of numerical approaches are being investigated, and these approaches require increasingly more computational resources due to the range of time and length scales associated with nozzle cavitation. Mixed-fluid Eulerian models are commonly employed using both simplified equations of state for closure [12] and non-equilibrium thermodynamic models with realistic fluid properties [13-14], as well as Rayleigh-Plesset models [15] and volume of fluid models which resolve gas-liquid interfaces locally [16]. More computationally intensive methods such as direct numerical simulation are also being employed [17]. In general, all these approaches require quantitative validation under conditions that match those found in practical applications. Models have been quantitatively validated using time-average data [18], time snapshot observations of vapor distribution [9], and liquid phase velocity data [19]. However, validation of the predictions of transient models has been relatively limited due to the difficulties of obtaining experimental data with sufficient time resolution. In one of the few examples of time resolved measurements, Gavaises et al. [20] measured the spectral properties of cavitation in an optically accessible axisymmetric channel by thresholding images to indicate the presence of cavitation clouds, and were able to measure Strouhal numbers ~0.2 in radial oscillations of the cavitation location at a sample rate of 77 kHz [20]. Schmidt et al [21] have also simulated the bubble lifetime frequency in a cavitating valve-covered orifice nozzle and obtained frequencies in the range 25-35 kHz.
The prevailing method of experimentally studying cavitation inside a nozzle is to use an optically transparent geometry. Realistic models are typically made from plastic [22], and simplified geometries capable of withstanding very high pressures can be manufactured from quartz [23-24] and sapphire [7, 25]. Recent developments allow transparent models to be manufactured at the small scales relevant to fuel injection [11,26]. However, the operating lifetime is generally limited and the surface finish achieved in such models is often different from that found in metal nozzles due to the limitations of machining and
polishing different materials [27], and this can have an effect on cavitation nucleation. Although they provide a wealth of data, optical measurements of cavitation are difficult owing to the multiple scattering of light by the gas-liquid interfaces and the refraction introduced by a curved nozzle wall, since refractive index matching is not always feasible. While clouds of cavitation bubbles clearly block the passage of light through a cavitating flow, it is unclear how the optical transmission can quantitatively determine fluid density or vapor fraction.
In prior work, we have shown that x-ray radiography provides quantitative measurements of the line of sight, time averaged vapor fraction in a submerged cavitating nozzle [28-30]. However, these experiments have been limited to plastic nozzles at modest pressures owing to the need for a nozzle wall material which is sufficiently transparent to x-rays at the energies which are absorbed well in the liquid phase. Time-resolved studies of cavitation in metal nozzles [31] were done at much higher energies using a polychromatic source, and this prohibited direct quantitative measurement of the density.
In order to overcome the limits of plastic nozzles, we can instead turn to beryllium, which is commonly used to make x-ray windows. Since photoelectric absorption increases roughly with the 4th power of the atomic number [32], beryllium is highly transparent to x-rays at the relevant energies for radiography, and can be machined with a surface finish similar to that found in a steel fuel injector. A beryllium nozzle suitable for radiography can be fashioned to be significantly stronger than plastic nozzles, and beryllium is less subject to radiation damage than plastic.
In this paper, we present measurements of cavitation in a beryllium nozzle 500 µm in diameter with Reynolds and cavitation numbers approaching those found in typical gasoline and diesel fuel injection systems under steady state flow conditions [4]. The nozzle is submerged (injecting into liquid rather than gas) and the fluid is at room temperature. A cerium contrast agent was used to improve the signal to noise ratio in order to make time-resolved measurements. Using a high flux monochromatic synchrotron x-ray beam, time-resolved measurements at 6.5 MHz and spatial resolution of 5 µm were achieved. The resolution of these experiments allowed us to capture a wide frequency spectrum of the flow, from the longer time scale hydrodynamic fluctuations (kHz) up to the cloud collapse phenomena at microsecond time scales. The experimental data are compared against high fidelity simulations performed using a homogeneous relaxation model with both RANS and LES turbulence modeling. In addition to directly comparing the time average vapor fraction, it is also now possible to compare the local power spectral density of the vapor fraction directly against LES spectra.

Experimental Method X-ray radiography experiments were performed in
a nozzle of diameter D = 0.50 mm machined from S200 beryllium alloy. The beryllium component was held in compression between two aluminum blocks as shown in Figure 1. Fluid was supplied from a piston accumulator at constant pressure and flow rate, and the back pressure was maintained by a needle value and evacuated drain vessel [30]. A turbine flow meter was used to monitor the flow rate independently of the pressure. The working fluid was a gasoline calibration fluid (Viscor 16BR) doped with a cerium contrast agent (Rhodia DPX9) at 9:1 volume ratio.
We define the cavitation number in the nozzle in terms of the static inlet pressure P1, back pressure P2 and vapor pressure Pv as:
𝐾 =𝑃! − 𝑃!𝑃! − 𝑃!
(1)
such that K=1 is strongly cavitating, and there is no cavitation above K ~ 3. In addition, the nozzle Reynolds number is defined in terms of the volume flow rate 𝑄 and viscosity 𝜈 as:
Re! =4𝑄𝜋𝐷𝜈
(2)
A range of experimental conditions were considered, spanning K values from 1.01 up to 5, over the full range of cavitation from non-cavitating to incipient to fully saturated behavior. The full K range was also studied at various ReD in the range 7.5 ×10! up to 3 × 10!. The maximum ReD and minimum K conditions approach those typically found in gasoline and diesel direct injection systems, however the fluid was at room temperature and the pressures were much lower owing to the larger nozzle diameter (about 2-3x that of a typical fuel injector nozzle).
Figure 1. Geometry of beryllium nozzle.
Independent variation of K and ReD was achieved by controlling both the inlet and back pressures; the back pressure was set at a partial vacuum to achieve the lowest K conditions. The maximum injection pressure in this study was limited to 30 bar.
The experiments were conducted at the 7-BM beamline of the Advanced Photon Source (APS) at Argonne National Laboratory [33]. A simplified schematic of the experiment is shown in Figure 2. The principle of the x-ray radiography technique has been discussed in detail in previous publications [28-30,34]. In brief, a monochromatic x-ray beam of mean energy 9 keV (1.0% FWHM band-pass) was focused to a 5 µm × 6 µm spot using a pair of x-ray focusing mirrors. The center of the beryllium nozzle was aligned with the focal plane of the beam. The beam passed through an intensity monitor (diamond photodiode, 52 µm thick) which recorded the incoming intensity, and the transmitted beam intensity was recorded by a PIN diode (300 µm thick). Each x-ray pulse from the synchrotron was recorded, with a pulse repetition rate of 6.5 MHz.
The projected density of displaced liquid (∆M, units mass per area) along a line of sight through the nozzle at one location in the x-y plane was measured from the transmitted intensity using the Lambert-Beer law:
aluminum
beryllium
ø2.5 mm
flow
L =
3.0
5 m
m
D = 0.50 mm
z
y
x
X-ray focusing mirrors(not to scale)
Incoming x-ray beam(monochromatic)
Incomingbeam intensity
monitor
PIN Diode
8 mm
Flow passageD = 0.50 mm(flow out of page)
Beryllium nozzle
Figure 2. Simplified schematic of experiment layout.
ΔM=∫ρ dz=−1𝜇log
𝐼𝐼!⋅𝐼!,!"#𝐼!"#
(3)
Where I is the intensity recorded at the PIN diode during the cavitation measurement and Iref is a measurement made at the same location in the nozzle under static conditions with no cavitation (i.e. the nozzle is full of liquid at the same pressure and temperature). I0 and I0,ref represent the incoming beam intensities for both measurements and µ is the x-ray attenuation coefficient of the fluid, which is determined from a calibration test in a cuvette. If the liquid phase density is known, then the projected displaced density can be converted into a path length of vapor in the beam:
α dz=𝛥𝑀 𝜌!
(4)
If the path length through the geometry is also known, this can be converted into a line of sight average vapor volume fraction.
The uncertainty in the vapor volume fraction is primarily determined by photon shot noise at the detec-tor, which follows a Poisson distribution. Due to the high photon flux (1012 photons/sec), the SNR is approx-imately 400 for each pulse from the x-ray source (153 ns duration). Since the dynamic range of the measure-ment is on the order of 30%, the uncertainty over the full dynamic range of measurement is approximately 0.85%. Allowing for the uncertainty in calculating µ and the error propagation in eqn. 3, the uncertainty in the vapor volume fraction is conservatively 1%. Numerical Method
The numerical simulations presented in this paper have been performed using HRMFoam, an in-house homogeneous relaxation code [13] developed in the OpenFOAM CFD framework [35]. Additional information regarding the numerical model may be found in prior work [18,36]. Here, we give a brief overview. HRMFoam is an Eulerian mixed-fluid solver. It assumes the liquid and vapor phases are well mixed within an individual cell such that they can be considered a single fluid and modeled with one set of governing equations. The model does not assume thermodynamic equilibrium, so an equation of state cannot be used for closure. Instead, HRM assumes relaxation of the local mass fraction of vapor (X) to equilibrium over an empirical time scale 𝜃 which is governed by the Downar-Zapolski relation [37]:
𝑑𝑋𝑑𝑡
=𝑋 − 𝑋𝜃
(5)
𝜃 = 𝜃!𝛼!!.!"𝜓!!.!"
(6)
𝜓 =𝑃!"# − 𝑃𝑃!"# − 𝑃!"#$
(7)
where 𝜃! = 3.84 ×10!! s [13], Psat and Pcrit are the critical and saturation pressures, and the vapor volume fraction 𝛼 is defined in terms of the liquid, vapor and total densities as:
𝛼 =𝜌! − 𝜌𝜌! − 𝜌!
(8)
Conservation equations are solved for mass, momentum and energy in terms of mass flux and enthalpy. Equations 5-7 provide closure. A pressure-implicit split-operator (PISO) method is used to solve the implicit pressure equation. Compressibility in both the liquid and gas phases was considered. Turbulence was modeled using RANS for the mean fields (with a realizable k-epsilon) and a single-equation large eddy simulations (LES) for transient studies. All the divergence terms were solved using upwind differencing in the RANS implementation, and Gamma NVD in the LES implementation. Second-order central differencing was used to solve the Laplacian term, and a generalized algebraic multi-grid method with preconditioning was used to solve the pressure field in both implementations.
The simulations were performed on a three-dimensional hex-cell mesh with a minimum cell size in the nozzle throat of 3.125 µm, corresponding to a spatial resolution of 160 cells across the nozzle throat. The simulations were solved at high resolution in this study in order to match the resolution of the radiography experiments. The Argonne Laboratory Computing Resource Center Blues cluster was used to perform the simulations parallelized on 120 CPUs. The meshes had approx. 135 million cells, and the time steps were 38ns. In previous comparisons between HRM simulation results and experiments, the effects of inconsistency in the fluid properties has been proposed as one possible explanation for the differences between simulations and experiments [18,36]. Prior solutions for plastic nozzles used a four-component gasoline model with a pressure-enthalpy lookup table based on NIST data [37] to determine density, viscosity, vapor pressure, equilibrium quality, and other parameters. The gasoline model, comprising isopentane, hexane, isooctane and decane has a very different distillation curve and higher vapor pressure from the fluid used in the present experiments, as can be seen in Figure 4. The dashed

Figure 4. ASTM D86 distillation curve data for the test fluid (blue dots) as compared to a typical 4-component
gasoline model and the new fluid model.
lines represent the boiling points of octane through undecane. The gasoline calibration fluid used in the experiments had an unknown composition (being heavier than nonane and lighter than dodecane) and the cerium additive has the effect of increasing both density and viscosity.
In order to develop an accurate model of the calibration fluid with the cerium additive, empirical distillation curve data was obtained and simulated annealing was performed using the NIST REFPROP database to determine the blend of hydrocarbons in the C5 to C12 range which would best match the ASTM D86 curve. The results are shown in Fig. 4 for the solution fluid model, which has properties similar to decane and contains a mixture of nonane, decane, and undecane. Good agreement was observed except for the points near to 100% evaporated, since the cerium additive contains residual components that limit the maximum evaporable fraction. Once the distillation curve was matched, the density and viscosity were adjusted by 30% and 14% respectively to accommodate the effects of the cerium additive. The results are shown against empirical test data in Figure 5. Here, the red triangles indicate laboratory measurements of the fluid properties. The black and blue crosses represent the lookup table data for the mixed-fluid and compressed liquid phases respectively. The dashed blue line indicates a line of best fit through the compressed liquid data which was used to match the experimental data points. The vertical black dashed line indicates the temperature condition for the x-ray radiography experiment. Fig 5. indicates that the new model matches the density, viscosity and vapor pressure of the working fluid closely.
(a) Viscosity-temperature curves
(b) Density-temperature curves
(c) Vapor pressure curve
Figure 5. Lookup table model data for (a) viscosity and
(b) density vs. temperature and (c) vapor pressure, as compared to empirical test data.

Results and Discussion Experimental measurements of the path-integrated vapor fraction (Eqn. 4) are shown for one of the tested conditions in Figure 6. Here, the bulk flow is from left to right. The Reynolds number is 2.4 x 10⁴ and the cavitation number is K=1.013, with P1=23.71 bar and P2=0.31 bar. At these conditions, the ReD and K values are similar to those found in a diesel nozzle (although with larger diameter and lower pressure and velocity). The nozzle is nominally axisymmetric; this was confirmed using x-ray tomography at 1.2 µm resolution. However, strong asymmetry is still evident in the vapor distribution. This suggests that a separation of the flow may be occurring along the upper nozzle wall. This is similar to a hydraulic flip in a jet injecting into gas, but in this case the outlet is submerged. At the nozzle exit, the path length integrated vapor increases substantially as the path length through the nozzle volume is much larger here (by a factor of 5). There is also a large amount of vapor present in the outlet plenum; this may be due to expansion of dissolved gas in the liquid after it exits the nozzle. The vertical stripes at the inlet and outlet of Figure 6 are caused by scattering of the x-rays off the flat surface of the nozzle inlet and outlet plenum walls, and are not due to fluctuations in the vapor.
Experimental data were collected over a wide range of ReD and K, spanning injection pressures of 2 to 30 bar and back pressures of 0.1 to 6 bar. This gave a non-dimensional parameter space spanning ReD from 7,500 to 25,000 and K from 1.01 to 2.5. Cavitation inception occurred around K ~ 1.66, with incipient cavitation at the nozzle inlet lip extending further downstream as K was reduced. Since the fluid volume flow rate in the circuit was measured independently of
Figure 7. Discharge coefficients vs. cavitation number
for all conditions studied in the experiments.
Figure 8. Total integrated vapor fraction in the nozzle
vs. cavitation number, measured from radiography.
(a) 0 degrees rotation. Flow is from left to right, nozzle exit is at x/D=6.1.
(b) 90 degrees rotation. Flow is from left to right, nozzle exit is at x/D = 6.1.
Figure 6. Path-length integrated vapor volume fraction (eqn. 4) at two rotations, with ReD = 2.4 x 10⁴ and K = 1.013.

pressure, the discharge coefficient was also determined for each experimental condition;
𝐶! =4𝑄
𝜋𝐷!𝜌 2 𝑃! − 𝑃!
(9)
Figure 7 shows the variation in CD with K. In the absence of cavitation, CD up to 0.91 was recorded, and under fully saturated cavitation conditions, CD values reached a minimum of 0.74. This is slightly higher than would be expected in an ideal nozzle geometry, and may be due to imperfection in the sharpness of the nozzle inlet lip, or an effect of the upstream geometry As expected, CD was only weakly dependent on ReD compared to K. However, around the inception point (K~1.66) we found that at higher ReD conditions, CD would occasionally spike to very high values (higher than in the absence of cavitation) before suddenly reducing to the lower values associated with cavitation. This effect may be due to the hysteresis associated with cavitation onset.
The reduced CD during cavitation is understood to be due to the vena contracta formed by the vapor annulus around the nozzle wall (Fig. 6) which reduces the effective area through which liquid can flow, throttling the flow and lowering CD. This agrees with measurements that have been made in real-size fuel injectors [36].
Using the time-average radiography data, we can independently verify this phenomenon by integrating across and along the channel in Fig. 6 to obtain a total volume fraction of vapor in the entire nozzle hole. This volume fraction captures not only the vena contracta, but also the total volume of all cavitation clouds and bubbles inside the nozzle. Figure 8 shows how the total integrated volume fraction correlates with K across the full ReD range of the experiments. As K reduces, the integrated volume of vapor increases following an approximate power law curve. It asymptotes as cavitation saturates (K asymptotically approaches a value just above 1). The highest volume fraction was 25% of the nozzle volume at K < 1.02. As K was
(a) Line of sight projection of vapor volume fraction field
(b) Cut plane of vapor volume fraction field (c) Cut plane of velocity magnitude field
(d) Cut plane of density field (e) Cut plane of pressure field
Figure 9. Line of sight projections (a) and cut planes (b) from RANS simulations of the nozzle at Re=2.4 x 10⁴, K=1.013, matching the experimental data in Fig. 6. The simulation domain has been truncated in the plots.
lowered past the inception point, the high vapor fraction region attached to the nozzle lip persisted further downstream before collapse, and also became thicker, extending further into the flow particularly near the nozzle outlet. This is evident in Fig. 6, which is in the asymptotic regime of K < 1.02.
The time-average vapor projections shown in Fig. 6 can be directly compared to similar line-of-sight projections made in the realizable k-epsilon RANS models using the same geometry, inlet and outlet conditions. Line of sight projections of the 3D vapor volume fraction field are shown for conditions matching Figure 6 (ReD = 2.4 x 10⁴, K = 1.013, P1 = 23.71 bar, P2 = 0.31 bar) in Figure 9a. Figures 9b-e show cut-planes of relevant fields at the same time step. In these simulations, the vapor volume fraction is within 5% of grid-independent values. In contrast with the consistent over-prediction of cavitation vapor found from prior simulations, we now see an over-prediction of vapor volume fraction at the nozzle lip, and an under-prediction of vapor volume fraction further
downstream. The attached cavitation bubble collapses at 0.5 diameters from the inlet, more quickly than observed in Fig. 6. However, the total integrated volume fraction of vapor in the nozzle is about 9%, lower than the range shown in Fig. 8. Since the fluid vapor pressure, density and viscosity are now being more accurately modeled, the remaining discrepancy can be attributed to sources other than the properties of the vaporizing component of the fluid. The effect of the non-vaporizing cerium additive on cavitation nucleation is a matter that requires further investigation. In the experiment, dissolved gas was also removed from the fluid, as this can also contribute to increased vapor volume [39].
Although the time-average data in Figs. 6-8 provide valuable data regarding the time average structure and vapor distribution of steady-state cavitation, these flows exhibit strong local fluctuations due to periodic shedding of vapor clouds, re-entrant jets, oscillatory cavitation collapse, and other phenomena [40]. To study the dynamics of the flow,
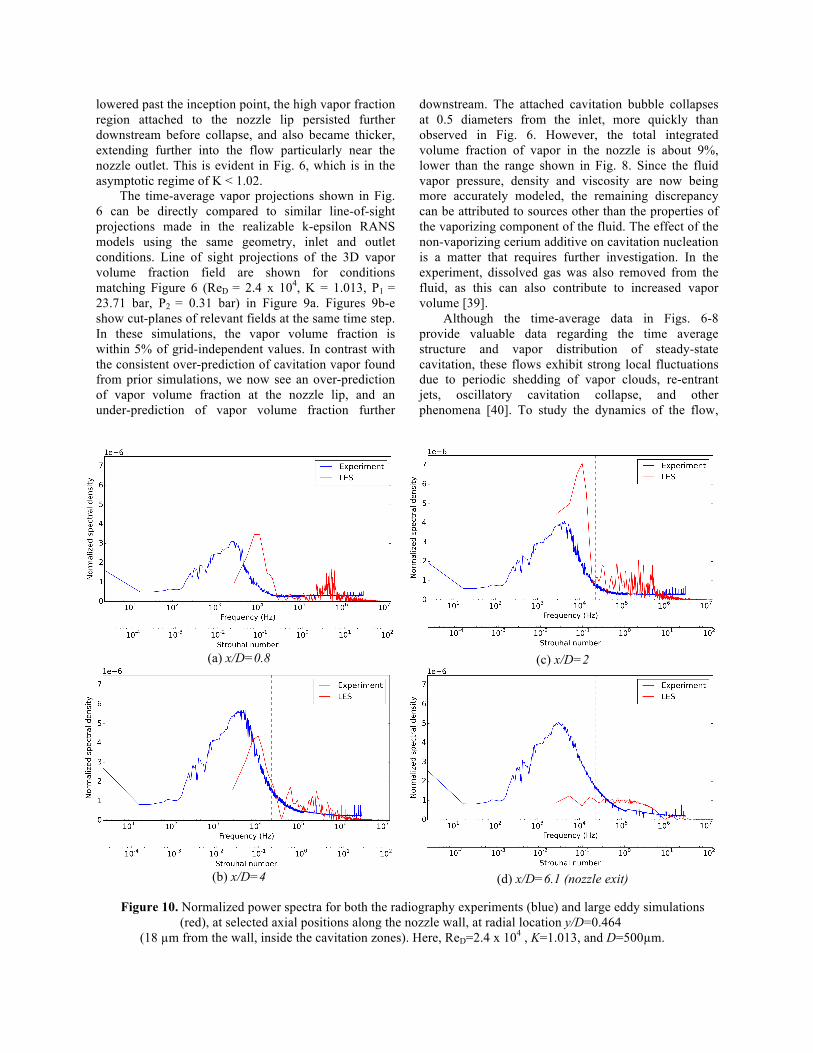
(a) x/D=0.8
(c) x/D=2
(b) x/D=4
(d) x/D=6.1 (nozzle exit)
Figure 10. Normalized power spectra for both the radiography experiments (blue) and large eddy simulations (red), at selected axial positions along the nozzle wall, at radial location y/D=0.464
(18 µm from the wall, inside the cavitation zones). Here, ReD=2.4 x 10⁴ , K=1.013, and D=500µm.

time-resolved radiography data were collected under the same conditions as Figure 6 (ReD=2.4 x 10⁴, K=1.013, P1=23.71 bar, P2=0.31 bar) at selected sample points in the nozzle. The power spectra of the fluctuations in the line of sight integrals of the vapor volume fraction were calculated. The spectra S(x,y,f) were normalized such that ∫ 𝑆 𝑑𝑓 = 1, and the background spectrum measured in the nozzle wall was subtracted in order to remove frequency components caused by fluctuations in the incoming beam.
Figure 10 shows several experimental spectra at locations near to the nozzle wall (blue lines). Here, the range of frequencies spans 10 Hz to 3.25 MHz. The experimental spectra in Figure 10 have been directly compared to the spectra measured in large eddy simulations (LES) of the nozzle, from probes placed at cell locations that match the experiments. The sample rate of the simulations is high (14.7 MHz) due to the short delta-T required for CFL ~ 1 (34ns), but the LES spectra are constrained to a higher minimum frequency than the experiments (~2.8kHz) due to the high computational cost of running long enough simulations under steady mean flow conditions to capture sub-kHz transients; much of the computational expense is expended in reaching steady state flow conditions. In this paper, the simulation time record at steady state is approximately 175µs. Figure 10 shows that the bandwidth of both the experiments and simulations is sufficient to capture most of the fluctuations, with no
evidence of aliasing. Snapshots of the LES are shown in Figure 11 at conditions that match the radiography experiment.
The main difference between the experiments and simulations is that the experimental peak amplitude is found at 1-3 kHz, while the LES peak is at approx. 10 kHz. As we progress along the nozzle wall from inlet to outlet (Fig. 10a-d), the experimentally measured spectral density increases, and the peak frequency roughly doubles from 1.5 kHz up to 3 kHz. At the same time, the mean vapor fraction is decreasing (Fig. 6), although the fluctuations are increasing. Conversely, the LES does not show a substantial change in peak frequency, but the intensity increases until we reach the nozzle exit at x/D=6.1. In order to capture the experimentally observed frequencies in the simulations, much longer run times (and associated computational expense) will be required.
The frequency axes in Fig. 10 are also expressed in terms of non-dimensional Strouhal number;
𝑆𝑡 =𝑓𝐷𝑈≡𝑓𝜋𝐷!
4 𝑄
(10)
Where the ratio 𝐷/𝑈 gives a characteristic time scale of about 10µs for this experimental condition. In Fig. 10, a dashed line is used to represent St = 0.2, where we would expect to see classical unsteady cloud shedding of the kind observed on cavitating hydrofoils. We note that the oscillations in the vapor fraction are slightly
(a) Cut plane of vapor volume fraction field (b) Cut plane of velocity magnitude field
(c) Inset zoom on nozzle wall, vapor volume fraction. (d) Cut plane of density field
Figure 11. Cut-planes of large eddy simulations of the cavitating nozzle at ReD=2.4 x 10⁴, K=1.013, matching the
experimental data in Fig. 6. The simulation domain has been truncated in the plots. Flow is left to right.

lower in the simulations (St ~ 0.1), and substantially lower in the experiments (St ~ 0.03). This suggests that in the experiments, we are not seeing a classical cloud shedding and re-entrant jet mechanism, but some vari-ant of this phenomenon which occurs over longer time scales (hundreds of microseconds).
Beyond the nozzle exit, the simulations show markedly decreasing fluctuations. The experiments show relatively strong fluctuations in the vapor fraction continuing past the nozzle exit. An explanation for the LES spectra is seen in Figure 11a; the vapor fraction is very low at the outlet plane, unlike in the experiments. Furthermore, the frequency content of the LES is mostly attributed to unsteady cloud shedding of cavitation vapor (shown in the enlarged view of the nozzle inlet lip in Figure 11c). In contrast with Fig 11c, the experimental data suggest that the flow is relatively steady around the nozzle inlet, and that cloud shedding happens further downstream. Cavitation vapor is observed to mix more readily into the freestream and collapse past the nozzle exit, rather than along the nozzle walls. Further work will be required to confirm this; it is difficult to confirm the local cavitation behavior from the radiography data alone, as the measurement is line of sight integrated.
Conclusions
In this paper, we have performed quantitative time-resolved x-ray radiography measurements of cavitation
vapor fraction in a submerged metal nozzle. The flow was studied at Reynolds and cavitation number similar to those found in a diesel injector, however the nozzle diameter was relatively large (500 µm) and the pressure was correspondingly lower. A piston-accumulator was used to ensure steady inflow conditions. In order to reduce the influence of dissolved gas, the fuel was degassed prior to the experiment. Unlike previous experiments, the nozzle velocity was sufficiently high and the walls sufficiently smooth that no residual effect of dissolved gas nucleation was observed.
The experimental data were compared to three-dimensional RANS and LES models of the flow, which used an Eulerian homogeneous relaxation model. A high resolution mesh with 3.125 µm cells was used used to ensure that the grid convergence error was within experimental uncertainty, and the cell size and time step were smaller than the spatial and temporal resolution of the experiments. Discrepancies in fluid properties between simulations and experiments were eliminated through the development of an accurate fluid
property lookup table which allowed for the effects of the x-ray contrast agent on the fluid. Controlling for all these effects, we found that the simulations capture the initiation of cavitation well, but under-predicted the vapor production further downstream. In prior simulation efforts, downstream vapor extent was consistently over-predicted.
In addition to measuring the time average line of sight vapor fraction, the time-resolved data have sufficient bandwidth to capture the spectrum of the vapor volume fraction. The spectral energy is broadly distributed at frequencies up to about 100 kHz (St=1). It peaks at around 1.5 to 3 kHz, which is an order of magnitude slower than would be expected for a canonical re-entrant jet with cloud shedding. The time scales associated with cloud shedding in the LES were found to be around St = 0.1, an order of magnitude higher than the experiments. This suggests that the physical processes that determine cavitation bubble convection and collapse in these nozzles is not captured in the model, and may therefore depend on small-scale phenomena which are not yet captured in homogeneous equilibrium models. However, the run time for the simulations was not sufficient to study the low frequencies (~1 kHz) observed in the experiments. This highlights one of the major challenges in attempting to validate transient simulations against experimental data; the longest time scales are on the order of milliseconds and this requires simulation times that are several times
longer than are typically used. This brings with it substantial computational expense.
The experimental data suggest that the time scales associated with instabilities in the vapor distribution are much larger in round nozzles than they are in channel flows or over hydrofoils or bluff bodies, and that the time scales become shorter as cavitation bubbles convect through the nozzle. A physical explanation for these results is a matter of ongoing study. Acknowledgements This research was performed at the 7-BM beamline of the Advanced Photon Source at Argonne National Laboratory. Use of the APS is supported by the U.S. Department of Energy (DOE) under Contract No. DE-AC02-06CH11357. Argonne’s x-ray fuel spray research is sponsored by the DOE Vehicle Technologies Program under the direction of Gurpreet Singh and Leo Breton. The authors gratefully acknowledge the computing resources provided on the Blues and Fusion high-

performance computing clusters operated by the Laboratory Computing Resource Center at Argonne National Laboratory. David P. Schmidt acknowledges the financial support of General Motors Research Center. References
1. Arcoumanis, C, & Gavaises, M. (1997). Effect of fuel injection processes on the structure of diesel sprays. SAE Transactions 970799.
2. Sou, A, Hosokawa, S, & Tomiyama, A. (2007). Effects of cavitation in a nozzle on liquid jet atom-ization. International Journal of Heat and Mass Transfer, 50(17-18), 3575–3582.
3. Payri, R., Salvador, F.J., Gimeno, J., de la Morena, J. (2009). Study of cavitation phenomena based on a technique for visualizing bubbles in a liquid pres-surized chamber. International Journal of Heat and Fluid Flow 30 (4), pp. 768-779.
4. Desantes J.M., Payri, R., Salvador, F.J., De la Mo-rena, J (2010), Influence of cavitation phenomenon on primary break-up and spray behavior at station-ary conditions, Fuel 89(10), pp. 3033-3041.
5. Gavaises, M. (2008). Flow in valve covered orifice nozzles with cylindrical and tapered holes and link to cavitation erosion and engine exhaust emissions. Int J Engine Res, 9, 435–447.
6. Suh, H. K, & Lee, C. S. (2008). Effect of cavitation in nozzle orifice on the diesel fuel atomization characteristics. International Journal of Heat and Fluid Flow, 29(4), 1001–1009.
7. Falgout, Z, & Linne, M. (2015). Cavitation Inside High-Pressure Optically Transparent Fuel Injector Nozzles. Journal of Physics: Conference Series, 656, 012082–5.
8. Sou, A, & Pratama, R. H. (2015). Effects of Asymmetric Inflow on Cavitation in Fuel Injector and Discharged Liquid Jet Akira Sou, Raditya Hendra Pratama. Atomization and Sprays, doi: 10.1615/AtomizSpr.2015013501.
9. Giannadakis, E, Gavaises, M, & Arcoumanis, C. (2008). Modelling of cavitation in diesel injector nozzles. Journal of Fluid Mechanics, 616, 153–193.
10. Saha, K, & Li, X. (2016). Assessment of Cavitation Models for Flows in Diesel Injectors With Single- and Two-Fluid Approaches. J. Engineering for Gas Turbines and Power, 138(1), 011504–18.
11. Payri, R., Salvador, F.J., Gimeno, J., Venegas, O, (2013). Study of Cavitation Phenomenon Using
Different Fuels in a Transparent Nozzle by Hy-draulic Characterization and Visualization. Exper-imental Thermal and Fluid Science 44, pp. 235-244
12. Salvador, F. J, Carreres, M, Jaramillo, D, & Mar-tínez-López, J. (2015). Comparison of microsac and VCO diesel injector nozzles in terms of inter-nal nozzle flow characteristics. Energy Conversion and Management, 103(C), 284–299.
13. Neroorkar, K, Shields, B, Grover, R. O, Jr, Torres Plazas, A, & Schmidt, D. P. (2012). Application of the Homogeneous Relaxation Model to Simulating Cavitating Flow of a Diesel Fuel. SAE Journal, 2012-01-1269.
14. Duke, D. J, Schmidt, D. P, Neroorkar, K, Kasten-gren, A. L, & Powell, C. F. (2013). High-resolution large eddy simulations of cavitating gasoline-ethanol blends. International Journal of Engine Research, 14(6), 578–589.
15. Brusiani, F, Negro, S, Bianchi, G. M, Moulai, M, Neroorkar, K, & Schmidt, D. (2012). Comparison of the Homogeneous Relaxation Model and a Ray-leigh Plesset Cavitation Model in Predicting the Cavitating Flow Through Various Injector Hole Shapes. SAE Paper 2013-011613.
16. Biçer, B & Sou, A. (2015). Application of the Im-proved Cavitation Model to Turbulent Cavitating Flow in Fuel Injector Nozzle. Applied Mathemati-cal Modelling, doi:10.1016/j.apm.2015.11.049
17. Hickel, S. (2015). DNS and LES of Two-Phase Flows with Cavitation. In J. Fröhlich, H. Kuerten, J. B. Geurts, & V. Armenio (Eds.), Direct and Large-Eddy Simulation IX (pp. 595–604). Springer International Publishing.
18. Duke, D. J, Battistoni, M, Swantek, A. B, Sovis, N, Kastengren, A. L, Powell, C. F, et al. (2015). Vali-dation of Cavitation Simulations in Submerged Nozzles (pp. 1–15). Proc. ILASS-Americas 27th Annual Conference on Liquid Atomization and Spray Systems, Raleigh, NC.
19. Sou, A, Tomiyama, A, Hosokawa, S, Nigorikawa, S, & Maeda, T. (2006). Cavitation in a two-dimensional nozzle and liquid jet atomization. JSME Int. J. Series B, 49(4), 1253–1259.
20. Gavaises, M, Villa, F, Koukouvinis, P, Marengo, M, & Franc, J.-P. (2015). Visualisation and LES simulation of cavitation cloud formation and col-lapse in an axisymmetric geometry. International Journal of Multiphase Flow, 68, 14–26.
21. D. P. Schmidt, C. J. Rutland, M. L. Corradini, P. Roosen and O. Genge (1999). “Cavitation in Two-

Dimensional Asymmetric Nozzles,” SAE Paper 1999-01-0518.
22. Chaves, H, Knapp, M, & Kubitzek, A. (1995). Ex-perimental study of cavitation in the nozzle hole of diesel injectors using transparent nozzles. SAE Technical Paper 950290, 199–211.
23. Arcoumanis, C, Badami, M, & Flora, H. (2000). Cavitation in real-size, multi-hole diesel injector nozzles. SAE Transactions 2000-01-1249.
24. Payri, F., Payri, R., Salvador, F.J., Martinez, J. (2012). A contribution to the understanding of cav-itation effects in Diesel injector nozzles through a combined experimental and computational investi-gation. Computers and fluids 58, pp. 88-101.
25. Reid, B. A, Gavaises, M, Mitroglou, N, Hargrave, G. K, Garner, C. P, & McDavid, R. M. (2015). String cavitation formation inside fuel injectors. J Phys: Conf. Ser, 656, 012099–5.
26. Mitroglou, N, Gavaises, M, & Arcoumanis, C. (2011). Cavitation inside enlarged and real-size ful-ly transparent injector nozzles and its effect on near nozzle spray formation. Proc. DIPSI Workshop on Droplet Impact Phenomena & Spray Investigation, Bergamo, Italy.
27. Drozda, T, “Tool and Manufacturing Engineers Handbook, Vol 1 : Machining,” 4th ed, Society of Manufacturing, March 1983. ISBN:0872630854
28. Duke, D. J, Kastengren, A. L, Tilocco, F, Swantek, A. B, & Powell, C. (2013). X-ray Radiography Measurements of Cavitating Nozzle Flow. Atomi-zation and Sprays, 23(9), pp. 841–860.
29. Duke, D. J, Swantek, A. B, Kastengren, A. L, & Powell, C. F. (2015a). X-ray Diagnostics for Cavi-tating Nozzle Flow. J. Phys: Conf. Ser, 656, 012110–5.
30. Duke, D. J, Swantek, A, Kastengren, A, Fezzaa, K, & Powell, C. (2015b). Recent Developments in X-ray Diagnostics for Cavitation. SAE Int. J. Fuels & Lubricants, 8(1), pp. 135–146.
31. Duke, D. J, Swantek, A, Tilocco, Z, Kastengren, A, Fezzaa, K, Neroorkar, K, et al. (2014). X-ray Imag-ing of Cavitation in Diesel Injectors. SAE Int. J. Engines, 7(2), pp. 1003–1016.
32. Als-Nielsen, J, & McMorrow, D. (2011). Elements of Modern X-ray Physics. John Wiley & Sons, Inc, Hoboken, NJ, USA.
33. Kastengren, A, Powell, C. F, Arms, D, Dufresne, E. M, Gibson, H, & Wang, J. (2012). The 7BM beamline at the APS: a facility for time-resolved
fluid dynamics measurements. Journal of Synchro-tron Radiation, 19(4), pp. 654–657.
34. Kastengren, A, & Powell, C. F. (2014). Synchro-tron X-ray techniques for fluid dynamics. Experi-ments in Fluids, 55(3), 1686.
35. Weller, H. G, Tabor, G, Jasak, H, & Fureby, C. (1998). A Tensorial Approach to Computational Continuum Mechanics Using Object-Oriented Techniques. Comput Phys, 12(6), pp. 620–631.
36. Duke, D. J, Kastengren, A. L, Swantek, A. B, So-vis, N, Fezzaa, K, Neroorkar, K, et al. (2014). Comparing Simulations and X-ray Measurements of a Cavitating Nozzle. Proc. ILASS-Americas 26th Annual Conference on Liquid Atomization and Spray Systems, Portland, OR.
37. Downar-Zapolski, P, Bilicki, Z, Bolle, L, & Fran-co, F. (1999). The Non-Equilibrium Relaxation Model for One-Dimensional Flashing Liquid Flow. Proc. 3rd ASME/JSME Joint Fluids Engineering Conference, 208(616).
38. Lemmon, E. W, Huber, M. L, & McLinden, M. O. (2007). NIST Standard Reference Database 23: Reference Fluid Thermodynamic and Transport Properties-REFPROP, Version 8.0. National Insti-tute of Standards and Technology.
39. Battistoni, M., Duke, D. J., Swantek, A. B., Tiloc-co, F. Z., Powell, C. F., & Som, S. (2015). EF-FECTS OF NONCONDENSABLE GAS ON CAVITATING NOZZLES. Atomization and Sprays, 25(6), pp. 453–483.
40. Callenaere, M., Franc, J.P., Michel, J.M., & Riondet, M. (2001). The cavitation instability in-duced by the development of a re-entrant jet. J Flu-id Mech 444. pp. 223-256.