yangyang chen, monash university ferdinand a. gul, monash...
TRANSCRIPT

1
Executive Equity Risk-Taking Incentives and Audit Service Pricing
Yangyang Chen, Monash University
Ferdinand A. Gul, Monash University
Madhu Veeraraghavan, Monash University
Leon Zolotoy, Melbourne Business School, University of Melbourne
We are grateful to Chris Armstrong, Nampuna Dolok Gultam, Teh Chee Ghee, Steven Low,
C.H. Tee and seminar participants at Monash University for helpful comments and
suggestions. The usual disclaimer applies.

2
Executive Equity Risk-Taking Incentives and Audit Service Pricing
ABSTRACT: Using a sample of 11,120 firm-year observations for 1,873 U.S. firms
spanning the period 2000-2010, we show a positive association between the
sensitivity of CEO compensation to stock return volatility (vega) and audit fees. We
also show that the positive association between vega and audit fees is more
pronounced for firms that are susceptible to litigation risk and weakens in the post-
Sarbanes-Oxley Act (SOX) period. In supplementary tests, we show that CEO age
and power also affect the association between vega and audit fees. Collectively, our
results suggest that audit firms incorporate executive risk-taking incentives in the
fees they charge for their services.
Keywords: Executive Compensation; Audit Fees; Vega; Litigation Risk; SOX
JEL Classifications: M41; M42; M52

3
I. INTRODUCTION
In this paper we examine how auditors respond, in terms of audit fees, to risk-
taking incentives induced by CEO compensation portfolio. More specifically, we
examine whether CEO equity incentives, such as the sensitivities of CEO
compensation to stock return volatility (vega) and stock price (delta), are associated
with audit fees. We build on prior studies that argue that a higher vega is likely to
induce managers to be less risk averse and consequently engage more in financial
misreporting (Armstrong et al., 2013). The higher likelihood of financial misreporting,
in turn, is likely to affect audit risks and audit fees, ceteris paribus.
A primary motivation for our study is based on the call by the Public Company
Accounting Oversight Board (PCAOB) that auditors carefully evaluate and consider
client executive compensation practices (see PCAOB Release No. 2012-001
proposing a new auditing standard for related party transactions and amendments to
auditing standards regarding significant unusual transactions). The proposed
standard addresses three areas for auditors: (a) evaluating a company’s
identification of, accounting for, and disclosure of relationships and transactions
between the company and its related parties; (b) identifying and evaluating a
company’s accounting and disclosure of its significant unusual transactions; and
(c) obtaining an understanding of a company’s financial relationships and
transactions with its executive officers that is sufficient to identify risks of material
misstatement.

4
Our research question is motivated more specifically by the third area identified
in the release, since it requires auditors to perform procedures to obtain an
understanding of the company’s financial relationships with its executive officers.1 In
particular, PCAOB Release 2012-001 (p. 2) states that
“Incentives and pressures for executive officers to meet financial targets can
result in risks of material misstatement to a company’s financial statements.
Such incentives and pressures can be created by a company’s financial
relationships and transactions with its executive officers (e.g. executive
compensation including perquisites and any other arrangements)”.
Hence, examining the association between executive equity risk incentives and
audit fees constitutes an important step toward our understanding of the auditing
process, on the one hand, and the effect of executive compensation on the quality of
financial reporting, on the other. In addition, the use of equity-based compensation in
the form of stock and options has not only grown substantially in recent years but
has also attracted the attention of regulators (Perry and Zenner, 2000; Coles et al.,
2006; Murphy and Sandino, 2010).
Our study integrates the executive compensation literature with the audit fee
literature. Although the two literatures are rich and have generated significant debate
and research, empirical evidence linking them is almost non-existent (Wysocki,
1 Appendix 4 - Additional Discussion (p. A4-41) states that the auditor should perform procedures that include but
are not limited to (1) reading employment and compensation contracts and (2) reading proxy statements and other relevant company filings with the U.S. Securities and Exchange Commission (SEC) and other regulatory agencies that relate to the company’s financial relationships and transactions with its executive officers. Paragraph 10A of the proposed amendments to Auditing Standard No. 12 requires the auditor to perform procedures designed to identify risks of material misstatement related to the company’s financial relationships and transactions with its executive officers. Page A4-42 of PCAOB release No. 2012-001 states “understanding how a company has structured its compensation for executive officers can assist the auditor in understanding whether such compensation arrangements affect the assessment of the risks of material misstatement.” Page A4-43 of PCAOB release No. 2012-001 states that the proposed amendment requires “the auditor to consider inquiring the chair of the compensation committee or its equivalent and any compensation consultants engaged by either the compensation committee or the company regarding the structuring of the compensation for executive officers.”

5
2010). In a recent paper, Wysocki (2010, pp. 155-156) notes that “fertile ground
exists for future research on the links between the two compensation literatures.”
Our intuition regarding the link between risk-taking incentives induced by CEO
compensation portfolio on audit fees is straightforward and draws on two strands of
related literature. The first strand examines the association between audit risk and
audit fees. Auditors face audit risk, the risk of failure to discover material
misreporting, which exposes audit firms to substantial litigation risk. With a total of
$5.66 billion in private litigation payments paid by U.S. audit firms over 1996–2007
(Badertscher et al., 2011), exposure to litigation risk can also lead to severe
reputational damage, substantial loss of market share, and declarations of
bankruptcy (Seetharaman et al., 2002; Hilary and Lennox, 2005; Weber et al., 2008;
Skinner and Srinivasan, 2012). Prior studies also show that auditors charge higher
audit fees from clients with lower reporting quality and a higher likelihood of financial
misreporting (Pratt and Stice, 1994; Gul et al., 2003; Bédard and Johnstone, 2004;
Hogan and Wilkins, 2008; Charles et al., 2010).
The focus of prior research in the second strand is on the relation between
financial misreporting, equity risk, and CEO compensation portfolio sensitivities.
Studies show that managers who decide to engage in financial misreporting face
substantial monetary and non-monetary risks, suggesting that the decision to
misreport will alter managers’ perceived risk of their portfolio holdings (Karpoff et al.,
2008; Armstrong et al., 2013). Prior research also provides evidence consistent with
the argument that a lower quality of financial reporting increases the reporting firm ’s
equity risk by adversely affecting transparency and increasing information
asymmetry (Hribar and Jenkins, 2004; Gray et al., 2009; Kravet and Shevlin, 2010;
Rajgopal and Venkatachalam, 2011). Consequently, CEO equity incentives can

6
encourage or discourage financial misreporting, depending on whether the expected
benefits of misreporting outweigh its effect on manager risk aversion. In particular,
since vega measures the sensitivity of CEO wealth to stock return volatility, a higher
vega is likely to induce managers to be less risk averse and, consequently,
encourage misreporting (Armstrong et al., 2013).
Taken together, the evidence provided in prior research is consistent with the
notions that (a) auditors charge higher fees from clients with lower reporting quality
and a higher likelihood of financial misreporting and (b) a higher vega encourages
misreporting. These findings suggest that auditors are expected to increase their
assessments of audit risks and charge higher fees from firms with higher vega, a
prediction that forms the basis for our main research question. We also address two
subsidiary questions: In the first question we examine how this effect varies across
firms with different levels of litigation risk, while in the second we examine whether
the vega-audit fee relation is weaker in the post-Sarbanes-Oxley Act (SOX) period.
The motivation for the first subsidiary question is that prior studies document a
positive relation between audit fees and client firm litigation risk (Seetharaman et al.,
2002; Venkatachalam, 2008; Choi et al., 2009; Kim et al., 2012). If vega reflects
managerial incentives to engage in financial misreporting, then its effect on audit
fees will depend, among other factors, on how likely the failure to detect financial
misreporting will lead to subsequent legal actions from client firm stakeholders.
Therefore, we hypothesize that the effect of vega on audit fees should be stronger
for firms that are more susceptible to litigation risk.
The motivation for the second subsidiary question is that a major purpose of
SOX is to protect investors by improving the accuracy and reliability of corporate
disclosures and to restore investor confidence in the integrity of firms’ financial

7
reporting (Lobo and Zhou, 2006). In addition, SOX directs the Securities and
Exchange Commission (SEC) to require the CEOs and CFOs of all listed firms to
certify the material accuracy and completeness of financial statements. Prior
research provides evidence consistent with SOX regulations having a positive effect
on reporting quality (Lobo and Zhou, 2006; Bartov and Cohen, 2009; Iliev, 2010). In
addition, SOX imposes significant criminal penalties on CEOs and CFOs for
certifying financial statements that do not comply with the requirements of SOX. In
short, since regulatory scrutiny and penalties for aggressive financial reporting is
greater post-SOX, we hypothesize that the positive association between vega and
audit fees is weaker in the post-SOX period.
We establish four findings. First, using a sample of 11,120 firm-year
observations for 1,873 unique U.S. firms spanning 2000-2010, we show that firms
with a high vega, on average, pay significantly higher audit fees. Specifically, we
document that increasing vega from the first to the tenth decile leads to an increase
of approximately 29% in audit fees. Second, we show that the association between
vega and audit fees is more pronounced for firms susceptible to litigation risk. Third,
we find that the association between vega and audit fees, while remaining
significant, has weakened in the post-SOX period. Finally, we document that CEO
age and power have a significant impact on the association between vega and audit
fees. Collectively, our results suggest that audit firms incorporate executive risk-
taking incentives in their fees and that the strength of the association between audit
fees and vega depends in a predictable manner on firm litigation risk and changes in
regulatory environment, as well as CEO characteristics.
We perform a battery of robustness tests to validate our main findings. First, we
examine the sensitivity of our results to alternative measures of vega, suggested in

8
the prior literature (Armstrong et al., 2013). Second, we investigate whether the
effect of vega on audit fees remains significant after controlling for prior misreporting
and corporate governance. Third, we control for projected changes in firm’s business
risk induced by high vega (Coles et al., 2006), Last, we address endogeneity
concerns by employing changes-in-variables analysis (Anderson et al., 2004; Klock
et al., 2005) and two-stage least squares (2SLS) approach (Larcker and Rusticus,
2010). Our main results continue to hold.
Our paper makes four contributions to the literature. First, at a general level, we
contribute to the compensation and corporate governance literatures on how
compensation arrangements affect the pricing of audit services offered to the firm.
The issue of whether compensation policies can provide value-increasing or value-
decreasing incentives to managers still remains uncharted territory (e.g., Jensen and
Murphy, 1990; Garvey and Milbourn, 2006). By establishing a link between CEO
compensation portfolio sensitivities and audit fees, we make a major contribution to
this evolving literature. Second, our study responds to the concerns expressed by
the PCAOB that compensation incentives for executive officers to meet financial
targets can result in risks of material misstatement. We provide evidence that these
concerns are justified, at least in terms of auditors’ assessments of audit risks. Our
third contribution is to the auditor compensation literature. Prior studies in the auditor
compensation strand document audit fees to be associated with a variety of factors,
such as client firm size, corporate governance, business complexity, and auditor
characteristics (Hay et al., 2006). However, none of the prior studies examine the
relation between audit fees and managerial equity incentives. Our study is the first to
clearly establish such a link.

9
Last but not least, we contribute to a growing stream of research that examines
the association between executive compensation portfolio sensitivities and the
quality of reporting (Burns and Kedia, 2006; Erickson, 2006; Armstrong et al., 2010,
2013; Jiang et al., 2010; Feng et al., 2011). In particular, our study is related to the
work of Armstrong et al. (2013), who document strong evidence of a positive relation
between portfolio vega and misreporting. Our findings emphasize the economic
implications of vega in encouraging managers to misreport by showing that audit
firms incorporate an increase in audit risk associated with higher vega by charging
higher fees. Overall, our study improves our understanding of how compensation
portfolio sensitivities affect auditor assessments of audit risks.
The remainder of the paper is organized as follows. Section II discusses the
related literature and develops our testable hypotheses. Section III describes the
sample and variable definitions. Our main empirical results are presented in Section
IV and robustness checks are reported in Section V. Section VI presents the results
for litigation risk and Section VII presents the results for SOX. Section VIII examines
the effect of CEO characteristics on the association between vega and audit fees
and Section IX concludes the paper.
II. RELATED LITERATURE AND HYPOTHESIS DEVELOPMENT
Audit Fees
Prior studies have examined the association between the risk of client
misreporting, litigation risk and audit fees. Studies show that auditors incorporate
litigation risk by supplying higher audit effort or charging higher fees to clients with
higher risk of misreporting. For instance, Kim et al. (2012) develop an analytical audit

10
fee model in which auditors choose an optimal auditing effort to minimize total audit
costs. The authors show that audit fees are inversely related to the client’s reporting
quality, since an increase in the probability of client misreporting increases the
auditor's litigation risk. Consequently, auditors respond to a decline in reporting
quality by either increasing auditing effort (Simunic, 1980; Simunic and Stein, 1996)
or charging higher premiums to cover potential litigation losses (Pratt and Stice,
1994; Gramling et al., 1998), which leads to an increase in auditor remuneration
(Kim et al., 2012). In their review of the early audit fee literature, Simunic and Stein
(1996) conclude that the U.S. evidence is generally consistent with audit firms
increasing their fees in the face of higher than usual litigation risk. Among more
recent studies, Gul et al. (2003) find a positive association between earnings
management and audit fees. In a similar vein, Bédard and Johnstone (2004) report
that heightened earnings management risk increases planned audit effort and higher
auditor billing rates. Hogan and Wilkins (2008) find that audit fees are higher for firms
that disclose internal control deficiencies (ICDs), suggesting that auditors either
increase their effort or charge higher premiums for firms in the presence of increased
control and information risks. Charles et al. (2010) report a positive association
between audit fees and Audit Integrity’s proprietary measure of financial reporting
risk.
Vega, Misreporting and Firm Risk Taking
Misreporting increases the risk of managerial wealth for at least two reasons.
First, financial misreporting exposes managers to substantial risks, such as
restrictions on their future employment, and SEC fines (Karpoff et al., 2008). Second,
misreporting decreases the quality of financial reports and hence adversely affects

11
transparency, which, in turn, increases risk. These studies include, among others,
those of Francis et al. (2004, 2005), Hribar and Jenkins (2004), Gray et al. (2009),
Kravet and Shevlin (2010), and Rajgopal and Venkatachalam (2011).
Three prior studies are related to ours. Engel et al. (2010) investigate the
relation between compensation paid to members of the audit committee and demand
for monitoring the financial reporting process. The authors report a positive relation
between audit committee compensation and audit fees, suggesting that firms are
willing to deviate from a one-size-fits-all approach in director pay in response to
increasing demand for monitoring. Rego and Wilson (2012) examine the effect of
equity risk incentives on corporate tax planning and conclude that a high vega is
associated with greater tax avoidance. Armstrong et al. (2013) examine the role of
vega on managerial incentives to misreport and document strong evidence of a
positive relation between vega and misreporting, suggesting that a higher vega is
associated with a lower quality of financial reporting.
Our study differs from that of Engel et al. (2010) in that they focus on the relation
between the levels of compensation paid to members of the audit committee and
audit fees, whereas we focus on the effect of CEO compensation portfolio
sensitivities on audit fees. Similarly, while Rego and Wilson (2012) examine the
association between vega and corporate tax planning and Armstrong et al. (2013)
study the link between vega and financial misreporting, we extend their work by
considering audit fees.
Hypothesis Development
The studies outlined above find that deterioration in quality of reported earnings
is associated with a higher cost of equity and an increase in firm-specific volatility,

12
concluding that financial misreporting increases equity risk. Since vega measures
the sensitivity of CEO compensation portfolio to stock return volatility, higher vega is
likely to encourage managerial risk-taking behavior (Armstrong and Vashishtha,
2012). Rego and Wilson (2012) show that firms with a high vega engage in more
aggressive tax avoidance, consistent with the notion that a high vega encourages
managers to engage in more risky corporate tax planning. More importantly, since
financial misreporting increases equity risk, a higher vega provides managers with a
clear incentive to misreport. Consistent with this notion, Armstrong et al. (2013) find
strong evidence of a positive relation between vega and misreporting. They also
show that the effect of vega on misreporting is economically larger than many other
determinants of misreporting. In sum, prior studies suggest that (a) audit fees are
positively related to a client–firm’s propensity to misreport and (b) the propensity to
misreport is positively related to vega. This discussion leads to our first hypothesis.
HYPOTHESIS 1: Ceteris paribus, firms with greater CEO compensation portfolio
volatility sensitivity (vega) pay higher audit fees.
We note that in contrast to vega, the theoretical relation between delta, which
measures the sensitivity of CEO compensation portfolio with respect to share price,
and misreporting is ambiguous (Armstrong et al., 2013). On the one hand, high delta
might encourage misreporting by providing the CEO incentives to boost stock price
through manipulating financial statements (Smith and Stulz, 1985). On the other
hand, high delta might discourage misreporting by increasing CEO risk aversion.
Since the wealth of CEOs relies more on firm stock price, their incentive to engage in
risky misreporting is reduced (Ross, 2004; Lewellen, 2006; Armstrong and
Vashishtha, 2012). Consistent with the notion of delta having two countervailing

13
effects on managerial incentives to misreport, the prior literature provides
inconclusive evidence on the relation between delta and the quality of reporting.2
Hence, we control for delta in our analysis but do not have any theoretical
predictions and, consequently, do not offer any formal hypothesis on the relation
between delta and audit fees.
We next address two subsidiary questions. First, we examine how the vega-audit
fee relation varies across firms with different levels of litigation risk. Prior studies list
client business risk among the primary risks that need to be assessed by auditors in
their client-acceptance decisions (Huss and Jacobs, 1991; Johnstone, 2000; Bell et
al., 2001).
Seetharaman et al. (2002) and Choi et al. (2009) show that auditors charge
higher fees for firms that are cross-listed in countries with stronger legal regimes
than they do for non-cross-listed firms, concluding that higher audit fees reflect an
increase in auditors’ legal liability. Venkataraman et al. (2008) examine the
association between auditors’ exposure to legal liability and audit fees in an IPO
(initial public offering) setting. Legally, auditing an IPO-filing company exposes the
auditor to substantially higher litigation risk compared to that associated with auditing
the same company after it goes public. The authors show that auditors earn higher
fees in IPO engagements compared to post-IPO engagements, consistent with
auditor firms charging higher fees as compensation for an increase in litigation risk.
Based on prior studies, we predict that the effect of vega on audit fees will depend
on the perceived auditor risk resulting from engagement with the firm. If the vega
reflects managerial incentives to engage in financial misreporting, then its effect on
2 See, for example, Burns and Kedia (2006), Erickson (2006), Armstrong et al. (2010), Jiang et al. (2010), Feng
et al. (2011), and Armstrong et al. (2013).

14
audit fees will depend, among other factors, on how likely the failure to detect
financial misreporting will lead to subsequent legal actions from client-firm
stakeholders. Consequently, we predict that the effect of vega on audit fees will be
more pronounced for firms with a higher likelihood of litigation. This discussion leads
to our second hypothesis.
HYPOTHESIS 2: Ceteris paribus, the positive association between CEO
compensation portfolio volatility sensitivity (vega) and audit fees is stronger for firms
with higher litigation risk.
Second, we examine the effect of SOX on the association between vega and
audit fees. Enacted as a response to numerous incidents of accounting restatements
and corporate fraud, SOX’s primary goal was to improve the quality of financial
reporting and restore investor confidence by increasing governance requirements,
imposing more severe penalties for managerial misconduct, and implementing
incentives for firms to enhance internal control systems (Coates, 2007; Iliev, 2010;
Hirschey et al., 2012). Prior literature provides evidence consistent with SOX
regulations having a positive effect on reporting quality. For instance, Lobo and Zhou
(2006) document that firms tend to engage less in accrual-based earnings
management and resort to more conservative accounting reporting in the post-SOX
period. Bartov and Cohen (2009) document a decline in the downward management
of earnings expectations and upward accrual-based earnings management. Singer
and You (2011) find that firms that were required to comply with SOX during the first
two years of its implementation improved the quality of their financial reporting
compared to control firms that were not required to comply. Iliev (2010) documents
that following the introduction of SOX, firms report lower discretionary earnings,

15
concluding that SOX legislation leads to more conservative accounting. Given that
the primary goal of SOX was to improve the quality of financial reporting, it provides
an appealing setting to examine the informational content of vega and its effect on
audit fees. Our argument is that SOX should reduce managerial incentives to
misreport. Hence, if vega is incrementally informative about the managerial
propensity to misreport, we expect to observe a weaker effect of vega on audit fees
in the post-SOX period. This leads to our third hypothesis.
HYPOTHESIS 3: Ceteris paribus, the positive association between CEO
compensation portfolio volatility sensitivity (vega) and audit fees is weaker in the
post-SOX period.
III. DATA AND VARIABLES
We obtain the data for this study from three sources. The audit fee data are from
the Audit Analytics database. Audit Analytics collect information about the identity of
the auditor practice office that provides auditing services to the firm, as well as the
audit and non-audit fees they charge, from the audit report in SEC filings since 2000.
We collect CEO compensation data from the Standard and Poor’s (S&P)
ExecuComp database. This database contains detailed information of the options
and stock holdings of the top managers for S&P 1500 firms since 1992. Firm
financial information is obtained from Compustat annual files. Since the audit fee
data are available from 2000 onward, our empirical analysis spans the period 2000-
2010. Merging the three databases results in a final sample of 11,120 firm-year
observations for 1,873 unique firms. We winsorize the variables at both the upper
and lower one percentile to mitigate the effect of outliers.

16
We adopt the audit fee model developed by Simunic (1980) and follow prior
literature (Simunic and Stein, 1996; Johnstone and Bédard, 2003; Gul and Goodwin,
2010) in selecting the control variables. We define audit fees (AFEE) as the dollar
amount of audit fees the firm pays the auditor over the fiscal year. The Big 4 dummy
(BIG4) is a dummy variable equal to one if the firm is audited by one of the Big 4
auditors and zero otherwise. The auditor office size (OFC) is the number of clients of
the firm’s auditor practice office. Auditor tenure (TNR) is the number of years the firm
has retained the current auditor. Book assets (BVA) are the book value of the firm’s
total assets. Market-to-book (MB) is the ratio of the firm’s market capitalization over
its book value of equity. Leverage (LEV) is the ratio of long-term debt to total assets.
The current ratio (CURR) is the ratio of current assets to total assets. The quick ratio
(QUICK) is the ratio of current assets net of inventory to current liabilities. The return
on assets (ROA) is the ratio of operating income to total assets. The foreign currency
translation dummy (FRGN) is a dummy variable equal to one if the firm has foreign
currency translation and zero otherwise. The number of segments (SEG) is the
number of the firm’s business segments. Following prior research, our analysis uses
the natural logarithm of audit fees (LAFEE), auditor office size (LOFC), auditor
tenure (LTNR), book assets (LBVA), and the number of segments (LSEG).
We define CEO compensation portfolio volatility sensitivity or vega (VOLSEN) as
the change in the value of the CEO’s option portfolio in response to a 0.01 change in
the annualized standard deviation of the firm’s stock return, while we define CEO
compensation portfolio price sensitivity or delta (PRCSEN) as the change in the
value of the CEO’s stock and options portfolio in response to a 1% increase in the
firm’s stock price. We follow Guay (1999) and Core and Guay (2002) in computing
both variables. Partial derivatives of the option value with respect to stock return

17
volatility and stock price are based on the Black-Scholes model adjusted for
dividends by Merton (1973). Following prior research (Brockman et al., 2010;
Armstrong and Vashishtha, 2012; Armstrong et al., 2013), our analysis uses the
natural logarithm of the two variables (LVOLSEN and LPRCSEN).
Table 1 presents the summary statistics of the variables and shows that the
mean and median dollar values of the audit fees of our sample firms are
$2.663 million and $1.390 million, respectively. Regarding the incentive variables,
the mean vega indicates that, on average, CEO compensation increases by
$157,400 in our sample for a 0.01 increase in stock return volatility. The mean delta
in our sample implies that a 1% increase in stock price, on average, is associated
with an increase of $595,900 in CEO compensation. Further, 92.3% of our sample
firms are audited by Big 4 auditors. The average number of clients of the auditor
offices is 54.9 and the average auditor tenure is 14.4 years. Our sample firms also
have mean book assets of $4,512.4 million and a mean market to book of 2.889. On
average, these firms have long-term debt that is 18.6% of total assets and current
assets that are 44.4% of total assets. Their mean quick ratio is 1.883 and their mean
return on assets is 0.088. Table 1 also reports that 47.1% of our sample firms have
foreign currency translation and the average number of business segments is 2.642.
[Insert Table 1 about here]
IV. AUDIT FEES AND CEO COMPENSATION PORTFOLIO SENSITIVITIES
First, we report the results of the univariate analysis of the association between
vega and audit fees. The sample is split into deciles based on vega (VOLSEN). We
then calculate the mean and median audit fees (LAFEE) for each group. As shown in
Figure 1, the mean value of audit fees for the lowest vega group is around 6.67. It

18
increases monotonically with the increase in vega. The mean value of audit fees for
the highest vega group reaches 8.31. The difference in mean audit fees between the
lowest and highest vega deciles is 1.64 and is significant at the 1% level (t-statistics
37.16). The change in the median value of audit fees follows a similar pattern.
Univariate analysis demonstrates a positive and monotonic relation between vega
and audit fees. This finding is consistent with our first hypothesis.
[Insert Figure 1 about here]
We next proceed with the multivariate analysis by estimating the following regression
, 0 1 , 2 , 3 , 4 ,
5 , 6 , 7 , 8 , 9 , 10 ,
11 , 12 , 13 , ,
4i t i t i t i t i t
i t i t i t i t i t i t
i t i t i t i t
LAFEE LVOLSEN LPRCSEN BIG LOFC
LTNR LBVA MB LEV CURR QUICK
ROA FRGN LSEG Ind Yr
(1)
Here i denotes firm, t denotes the year, Ind is industry fixed effects based on two-
digit SIC codes, Yr is year fixed effects, and ε is the error term. The dependent
variable is LAFEE, the natural logarithm of audit fees. The independent variable of
interest is LVOLSEN, the natural logarithm of vega. Our first hypothesis predicts a
positive and significant coefficient for LVOLSEN. The regression is performed by
pooled ordinary least squares (OLS), with t-statistics robust to heteroskedasticity and
clustering at the firm level. We present the regression results in Table 2.
Column (1) of Table 2 presents the results of the regression with CEO
compensation portfolio sensitivity variables only. This column shows that LVOLSEN
is positively and significantly related to LAFEE, thus suggesting that auditors charge
higher fees for firms with higher vega. This finding is also consistent with our
univariate analysis. In column (2) we add several auditor characteristics and in
column (3) we further add a number of firm characteristics. We add both industry and

19
year fixed effects in column (4). In all four regressions, the coefficient of LVOLSEN
remains positive and statistically significant. Last, to facilitate economic interpretation
of our results, we rank each independent variable, except for the two dummy
variables (the Big 4 and foreign currency translation dummies) for each year, and
then partition the resulting ranks into deciles labeled from 1 (lowest decile) to 10
(highest decile). Next, we regress LAFEE against the decile ranking of independent
variables. The results are presented in column (5) of Table 2 and further confirm the
positive relation between vega and audit fees. The effect of vega on audit fees is
also economically significant. Specifically, the magnitude of the coefficient in column
(5) demonstrates that moving from the first to the tenth decile of vega increases log
audit fees by 0.032*(10-1) = 0.288, which constitutes, approximately, an increase of
29% in audit fees. Table 2 also shows that the effect of delta on audit fees is less
robust compared to that of vega. We find that the coefficient of LPRCSEN is
insignificant in columns (1), (2), and (5) and becomes negative and significant in
columns (3) and (4). Hence, no specific conclusion can be reached regarding the
effect of delta on audit fees, consistent with delta having two countervailing effects
on executive risk-taking behavior.
Table 2 also shows that LAFEE is positively related to BIG4, LOFC, and LTNR,
suggesting that Big 4 auditors, larger auditor practice offices, and auditors with
longer tenure charge higher audit fees. Further, LAFEE is also positively related to
LMVE, LEV, CURR, and FRGN and negatively related to MB, QUICK, and ROA.
These results suggest that larger firms, firms with a higher leverage ratio and current
ratio, firms with foreign currency translation (i.e., have foreign business), and firms
with more business segments are charged higher audit fees, while firms with a
higher market-to-book ratio, quick ratio, and return on assets are charged lower audit

20
fees. Overall, these findings are largely consistent with the prior literature (e.g., Gul
and Goodwin, 2010).
[Insert Table 2 about here]
V. ROBUSTNESS CHECKS
Alternative Measures of Vega
In this section, we conduct a number of robustness tests to validate our main
findings. We start by examining the sensitivity of our results to the way vega is
constructed to ensure that our results are robust to alternative definitions. We
employ four alternative measures of vega. In our first measure, we investigate
whether our results hold for the top five executives (including the CEO) instead of
only the CEO. Since firm decisions are usually made in teams (Aggarwal and
Samwick, 2003), we check how the aggregate compensation portfolio sensitivities of
the top five executives influence audit fees. The regression results for the top five
executives vega (LVOLSEN_MGM) and delta (LPRCSEN_MGM) are presented in
column (1) of Table 3. The table shows that the coefficient of LVOLSEN_MGM is
positive and significant, suggesting that a higher vega for the top five managers is
associated with higher audit fees.
In our second measure, we decompose the CEO vega into a vega from
previously granted options (LVOLSEN_OLD) and a vega of new options granted
during the year (LVOLSEN_NEW). Full information about the exercise price and time
to maturity is available from ExecuComp for new grants; however, such data are
unavailable for previous option grants. For the old grants we estimate vega using the
approximation method of Core and Guay (2002). We present the regression results

21
in column (2) of Table 3. We find the coefficients for both old and new option grant
vegas to be positive and significant, suggesting that our results are not driven by a
potential measurement error induced by the old option grants. In our third measure,
we decompose the vega of the option grants into a vega from exercisable options
(LVOLSEN_EX) and a vega of non-exercisable options (LVOLSEN_UNEX) and
report the results in column (3) of Table 3. Both coefficients are positive and
significant. In our last measure, we follow Armstrong et al. (2013) and examine the
component of vega that is unrelated to recent stock performance. Since vega is a
function of both current stock price and option grant features, variation in vega and
consequently its effect on audit fees can be driven by recent stock performance
rather than option grant features (Armstrong et al., 2013). To rule out this possibility,
we regress vega against stock returns over the past year and define performance-
unrelated vega (LVOLSEN_NONPERF) as the residuals from the regression. The
results in column (4) of Table 3 show that the coefficient for performance-unrelated
vega is positive and significant, suggesting that our results are not driven by recent
stock performance.
[Insert Table 3 about here]
Omitted Variables
We also investigate whether the association between vega and audit fees is
caused by omitted variables. To mitigate this concern we first examine whether our
main results hold after controlling for prior misreporting, which can be used by the
auditor in assessing the risk of a firm’s future misreporting. If the effect of vega on
audit fees is associated with it being informative about a CEO’s propensity to
misreport in the future, it should have an incremental effect on audit fees after other

22
potential indicators of misreporting are controlled for. Following the prior literature,
we employ two measures of misreporting. The first measure is the restatement
dummy (RST), a dummy variable equal to one if the firm restates its financial
statements in the previous year and zero otherwise. The second measure is the
MDD measure (MDD), which is Dechow and Dichev’s (2002) accruals quality
measure as modified by McNichols (2002). The measure is estimated over the past
five years and reflects the portion of current accruals left unexplained by the model.
Therefore, a higher value of the MDD measure indicates poorer accruals quality. We
present the results in Table 4. The coefficients for both the restatement dummy and
MDD measure are positive and significant, consistent with the notion that audit firms
require higher compensation from firms with higher past misreporting. More
importantly, the coefficient for LVOLSEN remains positive and statistically significant
when we include each of the prior misreporting measures individually, as well as
when both variables are included simultaneously.
Second, we examine whether our results remain robust after controlling for
corporate governance measures. We re-estimate our basic model with corporate
governance characteristics included as additional control variables. More specifically,
we include three measure of corporate governance: the governance index
(GINDEX), dedicated institutional ownership (DEDIO), and board independence
(BIDP).
We obtain the data from RiskMetrics and follow Gompers et al. (2003) in
constructing the governance index. The variable GINDEX is a count of the number of
antitakeover provisions in a firm’s charter and in the legal code of the state in which
the firm is incorporated. 3 Our second measure of governance is dedicated
3 Our results also hold for the entrenchment index of Bebchuk et al. (2009).

23
institutional ownership, which is the proportion of shares held by dedicated
institutional investors.4 Bushee (1998, 2001) defines dedicated institutional investors
as those with long investment horizons and concentrated share holdings. Dedicated
institutional investors are shown in the prior literature (Gaspar et al., 2005;
Ramalingegowda and Yu, 2012) to be the group of institutional investors that is most
likely to monitor managers. We obtain the institutional ownership data from Thomson
Financial and the institutional investor classification from Brian Bushee’s website.5
Our final governance measure is board independence, defined as the proportion
of independent directors on the board. Prior studies show that stronger boards are
negatively associated with earnings management, restatements, and fraud and
positively associated with audit effort and earnings quality (Dechow et al., 1996;
Beasley et al., 2000; Carcello et al., 2002; Klein, 2002; Bédard et al., 2004). The
results reported in columns (4) to (7) of Table 4 are consistent with those of Carcello
et al. (2002), in that we document a positive relation between governance measures
and audit fees. After controlling for governance measures, the coefficient of
LVOLSEN remains positive and significant, suggesting that the effect of vega on
audit fees is not driven by their correlation with corporate governance.
[Insert Table 4 about here]
Changes in Business Risk
Next we investigate whether the effect of vega on audit fees remains significant
after controlling for projected changes in a firm’s business risk. Prior studies
document strong causal relation between vega and firm risk, in that a firm with a high
4
We also employed total institutional ownership and the top five institutional ownership defined as the percentage of shares held by all institutional investors and the top five institutional investors as additional measures of institutional ownership. Our findings hold. 5 See http://accounting.wharton.upenn.edu/faculty/bushee/IIclass.html.

24
vega tends to implement riskier investment policies (Guay, 1999; Coles et al., 2006;
Low, 2009). Since auditing standards require auditors to gain an understanding of
client business risk to better identify areas that may create pressure on financial
reporting (Winograd et al., 2000), projected changes in business risk can potentially
affect audit fees.
To control for the effect of vega on business risk, we employ a two-step
procedure. First, we follow Coles et al. (2006) and regress measures of firm
investment policy - R&D intensity (R&D) and capital expenditure (CAPEX) - against
the lagged values of LVOLSEN and LPRCSEN, and a set of control variables. Next,
we re-estimate our basic regression, with the fitted values from the first step included
as additional control variables. If our results are not driven by the effect of vega on
firm investment policy, the coefficient of vega should remain positive and significant.
Consistent with Coles et al. (2006), we show in Table 5 that a higher vega is
associated with a riskier investment policy, as evident by its positive effect on R&D
intensity and negative effect on firm capital expenditure. More importantly, after
including the fitted values of both R&D and CAPEX in our basic regression, the
coefficient for LVOLSEN remains positive and significant, as reported in columns (3)
to (5) of Table 5. The effect of vega on audit fees remains significant irrespective of
whether we include the fitted measures individually or jointly 6 . Accordingly, we
conclude that our main results are not driven by changes in firm business risk. While
we use delta as a control variable, its effect on audit fees is also of some interest. In
particular, we note that when we include the fitted values of R&D intensity and
capital expenditure in our basic regression, the effect of delta on audit fees becomes
6 As an additional robustness test we repeat our analysis with actual values of CAPEX and R&D included as
control variables. The coefficient for LVOLSEN remains positive and statistically significant.

25
statistically insignificant, thus suggesting that the negative effect of delta on audit
fees as documented in Table 2 is likely due to its effect on firm business risk.
[Insert Table 5 about here]
Endogeneity
Since the relation between vega and audit fees could be driven by endogenous
effects, we also conduct tests for endogeneity. It is possible that both audit fees and
vega are correlated with some time-invariant firm characteristics, resulting in their
apparent relation. We adopt two methods in this section to address this potential
endogeneity problem.
The first method is the changes-in-variables approach (Anderson et al., 2004;
Klock et al., 2005; Jayaraman and Milbourn, 2012). In this approach, we regress the
annual change in LAFEE against the annual change in LVOLSEN, LPRCSEN, and
the control variables. Weber (2006) argues that changes-in-variables analysis is less
affected by endogeneity problems. In addition to providing time-series evidence of
the link between audit fees and vega, firm-specific changes regressions also help
alleviate concerns about correlated omitted variables (Jayaraman and Milbourn,
2012)The results are presented in Table 6. Column (1) presents the results with
changes in CEO compensation portfolio sensitivities only, column (2) presents the
results with changes in auditor characteristics as controls, and column (3) presents
the results with changes in additional firm characteristics as controls. In all three
columns, the change in LVOLSEN is positively and significantly associated with a
change in LAFEE, suggesting that an increase in vega results in an immediate
increase in audit fees. Therefore, the results from the changes-in-variables analysis
suggest that our findings are not driven by endogenous effects.

26
[Insert Table 6 about here]
The second method is the 2SLS approach, a common method in accounting
research in addressing potential endogeneity problem (e.g., Larcker and Rusticus,
2010). In the first stage, we regress LVOLSEN and LPRCSEN against a set of
instrumental variables suggested by prior research (Himmelberg et al., 1999; Knopf
et al., 2002; Coles et al., 2006; Ortiz-Molina, 2006; Brockman et al., 2010), as well as
all the control variables in Eq. (1). The instrumental variables include the cash ratio
(CASH), log CEO tenure (LCEOTNR), log CEO salary and bonus compensation
(LCEOCOMP), sales growth (SGRTH), R&D (RND), and capital expenditure
(CAPEX). Specifically, the cash ratio is the ratio of firm cash holdings to total assets;
log CEO tenure is the natural logarithm of the number of years since the current
CEO became CEO; log CEO salary and bonus compensation is the natural logarithm
of the dollar amount of the CEO’s annual base salary and bonus; sales growth is the
annual growth rate of sales; R&D is the ratio of R&D expenses to sales; and capital
expenditure is the ratio of capital expenses to total assets. In the second stage, we
regress LAFEE against the fitted values of LVOLSEN and LPRCSEN from the first-
stage regressions.
The results for the 2SLS regression are presented in Table 7. Columns (1) and
(2) present the results for the first-stage regression and column (3) presents the
results for the second-stage regression. The table shows that the fitted value of
LVOLSEN is positively and significantly associated with LAFEE, further confirming
that our findings are not driven by endogenous effects.
[Insert Table 7 about here]

27
VI. VEGA, AUDIT FEES, AND LITIGATION RISK
In this section we test the second hypothesis by interacting vega with multiple
measures of litigation risk. Following prior research, we consider three measures of
litigation risk. Our first measure of litigation risk is firm size (LBVA). Prior studies
consistently show that auditor litigation risk increases with client size (Stice, 1991;
Carcello and Palmrose, 1994; Lys and Watts, 1994; Heninger, 2001). Our second
measure is the high litigation industry dummy (LITIND), a dummy variable equal to
one if the firm is in the biotechnology, computer, electronics, or retail industries and
zero otherwise. This measure was first suggested by Francis et al. (1994), who show
that firms in these industries are subject to a higher number of litigations compared
to other industries. The industry-based litigation measure is employed by Ajinkya et
al. (2005), Beatty et al. (2008), and Brown and Tucker (2011).
Our third measure is the high litigation risk indicator (LITRISK), which is the
principal component of a set of litigation predictor variables suggested by Shu (2000)
and Kim and Skinner (2012). A higher value of the measure indicates a higher
likelihood of litigation risk. The predictor variables include firm size (LBVA), a high
litigation industry dummy (LITIND), sales growth (SGRTH), stock return, return
volatility, and return skewness. Stock return is the cumulative stock return over the
fiscal year, return volatility is the standard deviation of monthly stock returns over the
fiscal year, and return skewness is the skewness of monthly returns over the fiscal
year. The results reported in column (1) of Table 8 show that the coefficient for the
interaction term between LBVA and LVOLSEN is positive and significant, suggesting
that the effect of vega on audit fees is stronger for larger firms. Column (2) presents
the results for the high litigation industry dummy and our findings show that the effect

28
of vega on audit fees is more pronounced for firms in high litigation risk industries.
Column (3) presents the results for the high litigation risk indicator and our findings
show that the interaction between LITRISK and LVOLSEN is positive and significant.
Since a higher value of LITRISK indicates higher litigation risk, our results suggest a
more significant effect of vega on audit fees for firms subject to higher litigation risk.
These findings are in line with our second hypothesis.
[Insert Table 8 about here]
VII. VEGA, AUDIT FEES, AND SOX
To test our third hypothesis, we interact vega with the SOX dummy (SOXD), a
dummy variable equal to one for the post-SOX era (after year 2002) and zero for the
pre-SOX era (before year 2002). The results presented in column (1) of Table 9
show that the coefficient for the interaction term between SOXD and LVOLSEN is
negative and statistically significant, suggesting that the effect of vega on audit fees
is less pronounced since the implementation of SOX.
To gain further insights into the effect of SOX on the association between vega
and audit fees, we distinguish between the pre- and post-compensation recovery
provision (commonly known as clawbacks) periods. These provisions, first
introduced by the passage of Section 304 of the SOX of 2002 (SOX 304), authorizes
the SEC to enforce the recovery of bonuses paid to corporate executives when a
firm’s financial restatements are due to noncompliance with financial reporting
requirements as a result of misconduct (Babenko et al., 2012; Chan et al., 2012).
Though SOX 304 has been successfully enforced in only a few cases (Salehi and
Marino, 2008; Fried and Shilon, 2011), voluntary adoption of clawback provisions by
companies has become increasingly popular over the last decade (Babenko et al.,

29
2012). Babenko et al. (2012) document that among the S&P 1500 firms, reported
usage of clawback provisions increased from less than 1% in 2000 to over 48% by
2011. The authors also report that by 2011 almost 70% of S&P 500 firms had
adopted a clawback policy. Chan et al. (2012) find that the voluntary adoption of
clawback provisions leads to a reduction in financial misstatements and is perceived
by auditors as associated with lower audit risk, consistent with clawback provisions
reducing managerial incentives to misreport. Since the adoption of clawback
provisions were rare prior to 2005 (Babenko et al., 2012; Chan et al., 2012), we
repeat our analysis on the SOX dummy for the pre-clawback provision sample (i.e.,
2000–2004) to investigate whether the diminishing effect of vega on audit fees in the
post-SOX era is driven by the popularity of clawback provisions.
The results reported in column (2) of Table 9 show that the interaction between
the SOX dummy and vega remains negative and significant, suggesting an
immediate drop in the effect of vega on audit fees since the passage of SOX. We
then investigate whether the adoption of clawback provisions further mitigates the
effect of vega on audit fees. Specifically, we interact vega with the clawback dummy
(CLAWD), a dummy variable equal to one for the years 2003-2005 and zero for the
years after 2005. We perform the test on the post-SOX sample (2003–2010) and the
results presented in column (3) show that the interaction term between CLAWD and
LVOLSEN is negative and significant. Therefore, the effect of vega on audit fees is
further mitigated in the 2005-2010 period. For robustness check purposes, we
conduct all three tests on a sample of firms with observations both before and after
the two events. The purpose of the exercise is to check whether our findings are
driven by differences between the group of firms that exit the sample before the
30
events and the group of firms that enter the sample after the events. Our untabulated
results available upon request are similar to those reported in Table 9.
[Insert Table 9 about here]
VIII. VEGA, AUDIT FEES, AND CEO CHARACTERISTICS
In this section we complement our analysis by examining the effect of CEO
characteristics on the association between vega and audit fees7. More specifically,
we investigate the effect of CEO age, tenure, and power on the relation between
vega and audit fees. Recent research in corporate finance documents that CEO
characteristics impact corporate policies. For example, Malmendier et al. (2011) and
Cronqvist et al. (2012) show that managerial characteristics have significant
explanatory power for corporate financing decisions, while Serfling (2013) suggests
that CEO personal traits may affect risk-taking behavior. Prior theoretical research
suggests that CEO age impacts risk-taking behavior, but the findings are mixed and
inconclusive. For instance, the theoretical models of Scharfstein and Stein (1990),
Hirshleifer and Thakor (1992), Zwiebel (1995), and Holmström (1999) suggest that
career concerns make younger CEOs more risk averse, leading to conservative
investment policies. In contrast, the managerial signaling model of Prendergast and
Stole (1996) suggests that younger CEOs invest aggressively, taking greater risks to
signal their superior ability. Following these studies, we define CEO age (CEOAGE)
7 We also investigate the effect of auditor characteristics on the association between vega and audit fees. For the
sake of brevity, we do not tabulate the results. We consider Big 4, office size, and auditor tenure auditor characteristics. We do not find a significant effect of Big 4 or office size on the relation between vega and audit fees. However, our results show that the relation between vega and audit fee is stronger if the auditor has longer tenure. This finding is consistent with those of Geiger and Raghunanadan (2002), Myers et al. (2003), Ghosh and Moon (2005), and Gul et al. (2007), since they suggest that auditors with longer tenure are able to provide higher-quality auditing services, since auditors need time to develop client-specific knowledge to perform an effective audit. Our intuition is that longer auditor tenure helps auditors understand the compensation policies of the firms they audit.

31
as an ordinal variable equal to one for CEOs with age below 35, two for CEOs with
age between 36-45, three for CEOs with age between 46-55, and four for CEOs with
age above 55. Chen and Zheng (2012) document a positive relation between CEO
tenure and risk taking, suggesting that longer tenure is associated with declining
career concerns. On the other hand, longer tenure is also related to CEO reputation
(Milbourn, 2003). Since misreporting increases firm risk, longer tenure may also
have an adverse effect on CEO incentives to misreport. This discussion suggests
that the effect of CEO age and tenure on the relation between audit fees and vega is
an empirical question, which we address here. We define CEO tenure (LCEOTNR)
as the natural logarithm of the number of years the current CEO became the CEO.
We examine CEO power in terms of unitary versus dual leadership styles.
Following Brickley et al. (1997), we define unitary leadership (CEOUNI) as the case
when the CEO and the chairman of the board titles are vested in one individual and
dual leadership as the case where the two positions are held by different individuals.
Overall, there is a general consensus that unitary leadership enhances CEO power
and leads to negative consequences (e.g., Conyon and Peck, 1998; Goyal and Park,
2002; Adams et al., 2005). Accordingly, we predict that greater CEO power
magnifies the positive relation between audit fees and CEO vega. Table 10 reports
the results for the effect of CEO characteristics (age, tenure, and power) on the
association between vega and audit fees in three columns. Column (1) shows that
the relation between vega and audit fees is stronger if the CEO is older, while in
column (2) we do not find a significant effect for CEO tenure. Our findings in column
(3) show that the relation between vega and audit fees is stronger if the CEO is also
the chairman of the board. Taken together, the findings reported in column (1) are
consistent with the theoretical prediction of the career concerns hypothesis of

32
Scharfstein and Stein (1990), Hirshleifer and Thakor (1992), Zwiebel (1995), and
Holmström (1999) and the results of column (3) are consistent with the notion that
unitary leadership enhances the ability of CEOs to misreport, since CEO power is
greater.
[Insert Table 10 about here]
IX. CONCLUSION
With Release No. 2012-001, the PCAOB proposed a new auditing standard for
related party transactions and amendments to auditing standards regarding
significant unusual transactions. The release stated that auditors must carefully
evaluate and consider the client’s executive compensation practices and specifically
consider executive compensation practices in the context of a company’s financial
relationships and transactions with its executive officers. Although auditors may have
considered these risks prior to the call by the PCAOB, little or no research exists on
the association between executive compensation and auditor compensation. Our
paper is the first attempt to fill the void.
For a large sample of U.S. firms spanning 2000-2010, we show that firms with
high vega, on average, pay higher audit fees. We also find that the association
between vega and audit fees is pronounced for firms that are more susceptible to
litigation risk and the vega-audit fee relation weakens in the post-SOX period. In
addition, we document that CEO age and power and auditor tenure significantly
affect the association between vega and audit fees. Taken together, our results
provide first major evidence that auditors incorporate audit risk associated with risk-
taking incentives induced by executive compensation by charging larger fees from
firms with a high vega.

33
REFERENCES
Adams, R. B., H. Almeida, and D. Ferreira. 2005. Powerful CEOs and Their Impact on
Corporate Performance. Review of Financial Studies 18: 1403-1432.
Aggarwal, R. K., and A. A. Samwick. 2003. Performance Incentives within Firms: The Effect
of Managerial Responsibility. Journal of Finance 58: 1613-1650.
Ajinkya, B., S. Bhojraj, and P. Sengupta. 2005. The Association between Outside Directors,
Institutional Investors and the Properties of Management Earnings Forecasts.
Journal of Accounting Research 43: 343-376.
Anderson, R. C., S. A. Mansi, and D. M. Reeb. 2004. Board Characteristics, Accounting
Report Integrity, and the Cost of Debt. Journal of Accounting & Economics 37: 315-
342.
Armstrong, C. S., A. D. Jagolinzer, and D. F. Larcker. 2010. Chief Executive Officer Equity
Incentives and Accounting Irregularities. Journal of Accounting Research 48: 225-
271.
Armstrong, C. S., and R. Vashishtha. 2012. Executive Stock Options, Differential Risk-
Taking Incentives, and Firm Value. Journal of Financial Economics 104: 70-88.
Armstrong, C., F. Larcker, G. Ormazabal, and D. Taylor. 2013. The Relation Between Equity
Incentives and Misreporting: The Role of Risk-Taking Incentives. Journal of Financial
Economics (forthcoming).
Babenko, I., B. Bennett, J. Bizjak, and J. L. Coles. 2012. Clawback Provisions, Working
paper, Arizona State University.
Badertscher, B., B. Jorgensen, S. Katz, and W. Kinney. 2011. The Effect of Private and
Public Equity Ownership on Litigation Risk and Audit Fees, AAA Annual Meeting
Proceedings.
Bartov, E., and D. A. Cohen. 2009. The "Numbers Game" in the Pre- and Post-Sarbanes-
Oxley Eras. Journal of Accounting, Auditing & Finance 24: 505-534.
Beasley, M. S., J. V. Carcello, D. R. Hermanson, and P. D. Lapides. 2000. Fraudulent
Financial Reporting: Consideration of Industry Traits and Corporate Governance
Mechanisms. Accounting Horizons 14: 441-454.
Beatty, A., J. Weber, and J. J. Yu. 2008. Conservatism and Debt. Journal of Accounting &
Economics 45: 154-174.
Bebchuk, L., A. Cohen, and A. Ferrell. 2009. What matters in corporate governance? Review
of Financial Studies 22: 783-827.

34
Bédard, J., S. M. Chtourou, and L. Courteau. 2004. The Effect of Audit Committee Expertise,
Independence, and Activity on Aggressive Earnings Management. Auditing: A
Journal of Practice and Theory 23: 15-37.
Bédard, J. C., and K. M. Johnstone. 2004. Earnings Manipulation Risk, Corporate
Governance Risk, and Auditors' Planning and Pricing Decisions. Accounting Review
79: 277-304.
Bell, T. B., W. R. Landsman, and D. A. Shackelford. 2001. Auditor's Perceived Business
Risk and Audit Fees: Analysis and Evidence. Journal of Accounting Research 39: 35-
43.
Brickley, J. A., J. Coles, and G. A. Jarrell. 1997. Leadership Structure: Separating the CEO
and Chairman of the Board. Journal of Corporate Finance 3: 189-220.
Brockman, P., X. Martin, and E. Unlu. 2010. Executive Compensation and the Maturity
Structure of Corporate Debt. Journal of Finance 65: 1123-1161.
Brown, S. V., and J. W. Tucker. 2011. Large-Sample Evidence on Firms' Year-over-Year
MD&A Modifications. Journal of Accounting Research 49: 309-346.
Burns, N., and S. Kedia. 2006. The Impact of Performance-Based Compensation on
Misreporting. Journal of Financial Economics 79: 35-67.
Bushee, B. J. 1998. The Influence of Institutional Investors in Myopic R&D Investment
Behavior. Accounting Review 73: 305.
Bushee, B. J. 2001. Do Institutional Investors Prefer Near-Term Earnings over Long-Run
Value? Contemporary Accounting Research 18: 207-246.
Carcello, J. V., D. R. Hermanson, T. L. Neal, and R. A. Riley Jr. 2002. Board Characteristics
and Audit Fees. Contemporary Accounting Research 19: 365-384.
Carcello, J. V., and Z.-V. Palmrose. 1994. Auditor Litigation and Modified Reporting on
Bankrupt Clients. Journal of Accounting Research 32: 1-30.
Chan, L. H., K. C. W. Chen, T.-Y. Chen, and Y. Yu. 2012. The Effects of Firm-Initiated
Clawback Provisions on Earnings Quality and Auditor Behavior. Journal of
Accounting and Economics 54: 180-196.
Charles, S. L., S. M. Glover, and N. Y. Sharp. 2010. The Association between Financial
Reporting Risk and Audit Fees before and after the Historic Events Surrounding
SOX. Auditing: A Journal of Practice and Theory 29: 15-39.
Chen, D., and Y. Zheng. 2012. CEO Tenure and Risk Taking. Working Paper, University of
Baltimore.
Choi, J.H., J.B. Kim, X. Liu, and D.A. Simunic. 2009. Cross-listing audit fee premiums: theory
and evidence. The Accounting Review 84: 1429-1463
35
Coates, J. C. 2007. The Goals and Promise of the Sarbanes–Oxley Act. Journal of
Economic Perspectives 21: 91-116.
Coles, J. L., N. D. Daniel, and L. Naveen. 2006. Managerial Incentives and Risk-Taking.
Journal of Financial Economics 79: 431-468.
Conyon, M. J., and S. I. Peck. 1998. Board Control, Remuneration Committees, and Top
Management Compensation. Academy of Management Journal 41: 146-157.
Core, J., and W. Guay. 2002. Estimating the Value of Employee Stock Option Portfolios and
Their Sensitivities to Price and Volatility. Journal of Accounting Research 40: 613-
630.
Cronqvist, H., A. K. Makhija, and S. E. Yonker. 2012. Behavioral Consistency in Corporate
Finance: CEO Personal and Corporate Leverage. Journal of Financial Economics
103: 20-40.
Dechow, P. M., and I. D. Dichev. 2002. The Quality of Accruals and Earnings: The Role of
Accrual Estimation Errors. Accounting Review 77: 35-59.
Dechow, P. M., R. G. Sloan, and A. P. Sweeney. 1996. Causes and Consequences of
Earnings Manipulation: An Analysis of Firms Subject to Enforcement Actions by the
SEC. Contemporary Accounting Research 13: 1-36.
Engel, E., R. M. Hayes, and X. Wang. 2010. Audit Committee Compensation and the
Demand for Monitoring of the Financial Reporting Process. Journal of Accounting
and Economics 49: 136-154.
Erickson, M., M. Hanlon, and E. L. Maydew. 2006. Is There a Link between Executive Equity
Incentives and Accounting Fraud? Journal of Accounting Research 44: 113-143.
Feng, M., W. Ge, S. Luo, and T. Shevlin. 2011. Why do CFOs Become Involved in Material
Accounting Manipulations? Journal of Accounting and Economics 51: 21-36.
Francis, J., R. LaFond, P. M. Olsson, and K. Schipper. 2004. Costs of Equity and Earnings
Attributes. Accounting Review 79: 967-1010.
Francis, J., D. Philbrick, and K. Schipper. 1994. Shareholder Litigation and Corporate
Disclosures. Journal of Accounting Research 32: 137-164.
Francis, J., R. LaFond, P. Olsson, and K. Schipper. 2005. The Market Pricing of Accruals
Quality. Journal of Accounting and Economics 39: 295-327.
Fried, J., and N. Shilon. 2011. Excess-Pay Clawbacks. Journal of Corporation Law 36: 721-
751.
Garvey, G. T., and T. T. Milbourn. 2006. Asymmetric Benchmarking in Compensation:
Executives Are Rewarded for Good Luck but Not Penalized for Bad. Journal of
Financial Economics 82: 197-225.

36
Gaspar, J.M., M. Massa, and P. Matos. 2005. Shareholder Investment Horizons and the
Market for Corporate Control. Journal of Financial Economics 76: 135-165.
Geiger, M., and K.Raghunandan. 2002. Auditor tenure and auditor reporting failures.
Auditing: A Journal of Practice and Theory 21: 67–78.
Ghosh, A., and D.Moon 2005. Auditor tenure and perceptions of audit quality. The
Accounting Review 80: 585–612.
Gompers, P., J. Ishii, and A. Metrick. 2003. Corporate Governance and Equity Prices.
Quarterly Journal of Economics 118: 107.
Goyal, V. K., and C. W. Park. 2002. Board Leadership Structure and CEO Turnover. Journal
of Corporate Finance 8: 49-66.
Gramling, A. A., J. W. Schatzberg, A. D. Bailey Jr, and Z. Hao. 1998. The Impact of Legal
Liability Regimes and Differential Client Risk on Client Acceptance, Audit Pricing, and
Audit Effort Decisions. Journal of Accounting, Auditing & Finance 13: 437-460.
Gray, P., P.S. Koh, and Y. H. Tong. 2009. Accruals Quality, Information Risk and Cost of
Capital: Evidence from Australia. Journal of Business Finance & Accounting 36: 51-
72.
Guay, W. R. 1999. The Sensitivity of CEO Wealth to Equity Risk: An Analysis of the
Magnitude and Determinants. Journal of Financial Economics 53: 43-71.
Gul, F. A., C. J. P. Chen, and J. S. L. Tsui. 2003. Discretionary Accounting Accruals,
Managers' Incentives, and Audit Fees. Contemporary Accounting Research 20: 441-
464.
Gul, A. F.A., B. Jaggi, and G. Krishnan. 2007. Auditor independence: evidence on the joint
effects of auditor tenure and nonaudit fees. Auditing: A Journal of Practice and Theory
26, 117–142.
Gul, F. A., and J. Goodwin. 2010. Short-Term Debt Maturity Structures, Credit Ratings, and
the Pricing of Audit Services. Accounting Review 85: 877-909.
Hay, D. C., W. R. Knechel, and N. Wong. 2006. Audit Fees: A Meta-analysis of the Effect of
Supply and Demand Attributes. Contemporary Accounting Research 23: 141-191.
Heninger, W. G. 2001. The Association between Auditor Litigation and Abnormal Accruals.
Accounting Review 76: 111-126.
Hilary, G., and C. Lennox. 2005. The Credibility of Self-Regulation: Evidence from the
Accounting Profession's Peer Review Program. Journal of Accounting and
Economics 40: 211-229.
Himmelberg, C. P., R. G. Hubbard, and D. Palia. 1999. Understanding the Determinants of
Managerial Ownership and Link Between Ownership and Performance. Journal of
Financial Economics 53: 353-384.

37
Hirschey, M., K. Smith, and W. Wilson. 2012. Financial Reporting Credibility After SOX”
Evidence from Earnings Restatements. AAA Annual Meeting proceedings.
Hirshleifer, D., D. Hirshleifer, A. V. Thakor, and A. V. Thakor. 1992. Managerial
Conservatism, Project Choice, and Debt. Review of Financial Studies 5: 437-470.
Hogan, C. E., and M. S. Wilkins. 2008. Evidence on the Audit Risk Model: Do Auditors
Increase Audit Fees in the Presence of Internal Control Deficiencies? Contemporary
Accounting Research 25: 219-242.
Holmström, B. 1999. Managerial Incentive Problems: A Dynamic Perspective. Review of
Economic Studies 66: 169-182.
Hribar, P., and N. T. Jenkins. 2004. The Effect of Accounting Restatements on Earnings
Revisions and the Estimated Cost of Capital. Review of Accounting Studies 9: 337-
356.
Huss, F. H., and F. A. Jacobs. 1991. Risk Containment: Exploring Auditor Decisions in the
Engagement Process. Auditing: A Journal of Practice and Theory 10: 16-32.
Iliev, P. 2010. The Effect of SOX Section 404: Costs, Earnings Quality, and Stock Prices.
Journal of Finance 65: 1163-1196.
Jayaraman, S., and T. T. Milbourn. 2012. The Role of Stock Liquidity in Executive
Compensation. The Accounting Review 87: 537-563.
Jensen, M. C., and K. J. Murphy. 1990. Performance Pay and Top-Management Incentives.
Journal of Political Economy 98: 225-264.
Jiang, J., K. R. Petroni, and I. Y. Wang. 2010. CFOs and CEOs: Who Have the Most
Influence on Earnings Management? Journal of Financial Economics 96: 513-526.
Johnstone, K. M. 2000. Client-Acceptance Decisions: Simultaneous Effects of Client
Business Risk, Audit Risk, Auditor Business Risk, and Risk Adaptation. Auditing: A
Journal of Practice and Theory 19: 1-25.
Johnstone, K. M., and J. C. Bédard. 2003. Risk Management in Client Acceptance
Decisions. Accounting Review 78: 1003-1025.
Karpoff, J. M., D. Scott Lee, and G. S. Martin. 2008. The Consequences to Managers for
Financial Misrepresentation. Journal of Financial Economics 88: 193-215.
Kim, I., and D. J. Skinner. 2012. Measuring Securities Litigation Risk. Journal of Accounting
and Economics 53: 290-310.
Klein, A. 2002. Audit Committee, Board of Director Characteristics, and Earnings
Management. Journal of Accounting & Economics 33: 375-400.
Klock, M. S., S. A. Mansi, and W. F. Maxwell. 2005. Does Corporate Governance Matter to
Bondholders? Journal of Financial and Quantitative Analysis 40: 693-719.
38
Knopf, J. D., J. Nam, and J. J. H. Thornton. 2002. The Volatility and Price Sensitivities of
Managerial Stock Option Portfolios and Corporate Hedging. Journal of Finance 57:
801-813.
Kravet, T., and T. Shevlin. 2010. Accounting Restatements and Information Risk. Review of
Accounting Studies 15: 264-294.
Larcker, D. F., and T. O. Rusticus. 2010. On the Use of Instrumental Variables in Accounting
Research. Journal of Accounting and Economics 49: 186-205.
Lewellen, K. 2006. Financing Decisions When Managers Are Risk Averse. Journal of
Financial Economics 82: 551-589.
Lobo, G. J., and J. Zhou. 2006. Did Conservatism in Financial Reporting Increase after the
Sarbanes-Oxley Act? Initial Evidence, Accounting Horizons 20: 57-73.
Low, A. 2009. Managerial Risk-Taking Behavior and Equity-Based Compensation. Journal of
Financial Economics 92: 470-490.
Lys, T., and R. L. Watts. 1994. Lawsuits against Auditors. Journal of Accounting Research
32: 65-93.
Malmendier, U., G. Tate, and J. O. N. Yan. 2011. Overconfidence and Early-Life
Experiences: The Effect of Managerial Traits on Corporate Financial Policies. Journal
of Finance 66: 1687-1733.
McNichols, M. F. 2002. Discussion of The Quality of Accruals and Earnings: The Role of
Accrual Estimation Errors. Accounting Review 77: 61-69.
Merton, R. C. 1973. Theory of Rational Option Pricing. Bell Journal of Economics &
Management Science 4: 141-183.
Milbourn, T. T. 2003. CEO Reputation and Stock-Based Compensation. Journal of Financial
Economics 68: 233-262.
Murphy, K. J., and T. Sandino. 2010. Executive Pay and “Independent” Compensation
Consultants. Journal of Accounting and Economics 49: 247-262.
Myers, J., L. Myers, and T. Omer. 2003. Exploring the term of the auditor–client relationship
and the quality of earnings: a case for mandatory auditor rotation? The Accounting
Review 78: 779–799.
Ortiz-Molina, H. 2006. Top Management Incentives and the Pricing of Corporate Public
Debt. Journal of Financial and Quantitative Analysis 41: 317-340.
Public Company Accounting Oversight Board (PCAOB). 2012. Proposed Auditing Standards
– Related Parties, Proposed Amendments to Certain PCAOB Auditing Standards
Regarding Significant Unusual Transactions and Other Proposed Amendments to
PCAOB Auditing Standards. PCAOB Release No – 2012-001, February 28, 2012.

39
Perry, T., and M. Zenner. 2000. CEO Compensation in the 1990s: Shareholder Alignment or
Shareholder Expropriation? Wake Forest Law Review 35: 123-162.
Pratt, J., and J. D. Stice. 1994. The Effects of Client Characteristics on Auditor Litigation
Risk Judgments, Required Audit Evidence, and Recommended Audit Fees.
Accounting Review 69: 639-656.
Prendergast, C., and L. Stole. 1996. Impetuous Youngsters and Jaded Old-Timers:
Acquiring a Reputation for Learning. Journal of Political Economy 104: 1105-1134.
Rajgopal, S., and M. Venkatachalam. 2011. Financial Reporting Quality and Idiosyncratic
Return Volatility. Journal of Accounting and Economics 51: 1-20.
Ramalingegowda, S., and Y. Yu. 2012. Institutional Ownership and Conservatism. Journal of
Accounting and Economics 53: 98-114.
Rego, S. O., and R. Wilson. 2012. Equity Risk Incentives and Corporate Tax
Aggressiveness. Journal of Accounting Research 50: 775-810.
Ross, S. A. 2004. Compensation, Incentives, and the Duality of Risk Aversion and
Riskiness. Journal of Finance 59: 207-225.
Salehi, N. H., and E. A. Marino. 2008. Section 304 of SOX: New Tool for Disgorgement?
New York Law Journal.
Scharfstein, D. S., and J. C. Stein. 1990. Herd Behavior and Investment. American
Economic Review 80: 465-479.
Seetharaman, A., F. A. Gul, and S. G. Lynn. 2002. Litigation Risk and Audit Fees: Evidence
from UK Firms Cross-Listed on US Markets. Journal of Accounting and Economics
33: 91-115.
Serfling, M. A. 2013. CEO Age and the Riskiness of Corporate Policies. Working paper,
University of Arizona.
Simunic, D. A. 1980. The Pricing of Audit Services: Theory and Evidence. Journal of
Accounting Research 18: 161-190.
Simunic, D. A., and M. T. Stein. 1996. The Impact of Litigation Risk on Audit Pricing: A
Review of the Economics and the Evidence. Auditing: A Journal of Practice and
Theory 15: 119-134.
Singer, Z., and H. You. 2011. The Effect of Section 404 of the Sarbanes-Oxley Act on
Earnings Quality. Journal of Accounting, Auditing and Finance 26: 556-589.
Skinner, D. J., and S. Srinivasan. 2012. Audit Quality and Auditor Reputation: Evidence from
Japan. Accounting Review 87: 1737-1765.
Shu, Z. S. 2000. Auditor Resignations: Clientele Effects and Legal Liability. Journal of
Accounting and Economics 29: 173-205.
40
Smith, C. W., and R. M. Stulz. 1985. The Determinants of Firms' Hedging Policies. Journal
of Financial and Quantitative Analysis 20: 391-405.
Stice, J. D. 1991. Using Financial and Market Information to Identify Pre-Engagement
Factors Associated with Lawsuits Against Auditors. Accounting Review 66: 516-533.
Venkataraman, R., J. P. Weber, and M. Willenborg. 2008. Litigation Risk, Audit Quality, and
Audit Fees: Evidence from Initial Public Offerings. Accounting Review 83: 1315-1345.
Weber, J. 2006. Discussion of the Effects of Corporate Governance on Firms’ Credit
Ratings. Journal of Accounting and Economics 42: 245-254.
Weber, J., M. Willenborg, and J. Zhang. 2008. Does Auditor Reputation Matter? The Case of
KPMG Germany and ComROAD AG. Journal of Accounting Research 46: 941-972.
Winograd, B. N., J. S. Gerson, and B. L. Berlin. 2000. Audit Practices of
PricewaterhouseCoopers, Auditing: A Journal of Practice and Theory 19: 176-182.
Wysocki, P. 2010. Corporate Compensation Policies and Audit Fees. Journal of Accounting
and Economics 49: 155-160.
Zwiebel, J. 1995. Corporate Conservatism and Relative Compensation. Journal of Political
Economy 103: 1-25.
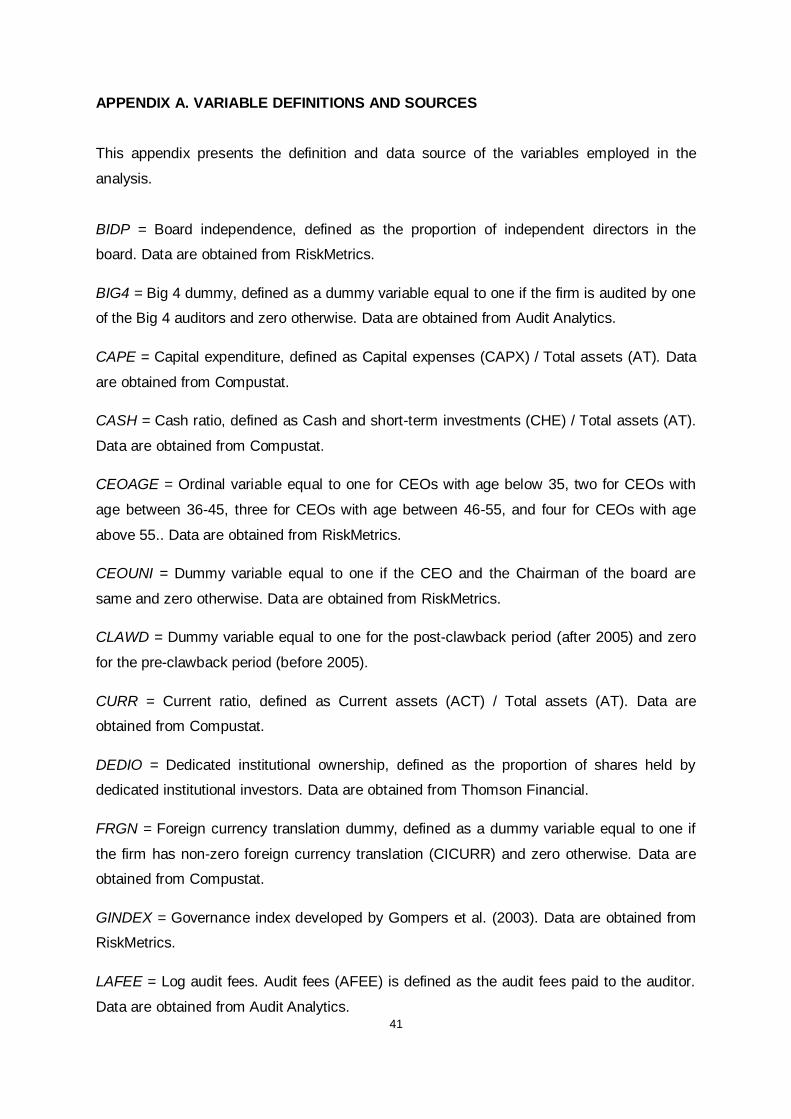
41
APPENDIX A. VARIABLE DEFINITIONS AND SOURCES
This appendix presents the definition and data source of the variables employed in the
analysis.
BIDP = Board independence, defined as the proportion of independent directors in the
board. Data are obtained from RiskMetrics.
BIG4 = Big 4 dummy, defined as a dummy variable equal to one if the firm is audited by one
of the Big 4 auditors and zero otherwise. Data are obtained from Audit Analytics.
CAPE = Capital expenditure, defined as Capital expenses (CAPX) / Total assets (AT). Data
are obtained from Compustat.
CASH = Cash ratio, defined as Cash and short-term investments (CHE) / Total assets (AT).
Data are obtained from Compustat.
CEOAGE = Ordinal variable equal to one for CEOs with age below 35, two for CEOs with
age between 36-45, three for CEOs with age between 46-55, and four for CEOs with age
above 55.. Data are obtained from RiskMetrics.
CEOUNI = Dummy variable equal to one if the CEO and the Chairman of the board are
same and zero otherwise. Data are obtained from RiskMetrics.
CLAWD = Dummy variable equal to one for the post-clawback period (after 2005) and zero
for the pre-clawback period (before 2005).
CURR = Current ratio, defined as Current assets (ACT) / Total assets (AT). Data are
obtained from Compustat.
DEDIO = Dedicated institutional ownership, defined as the proportion of shares held by
dedicated institutional investors. Data are obtained from Thomson Financial.
FRGN = Foreign currency translation dummy, defined as a dummy variable equal to one if
the firm has non-zero foreign currency translation (CICURR) and zero otherwise. Data are
obtained from Compustat.
GINDEX = Governance index developed by Gompers et al. (2003). Data are obtained from
RiskMetrics.
LAFEE = Log audit fees. Audit fees (AFEE) is defined as the audit fees paid to the auditor.
Data are obtained from Audit Analytics.
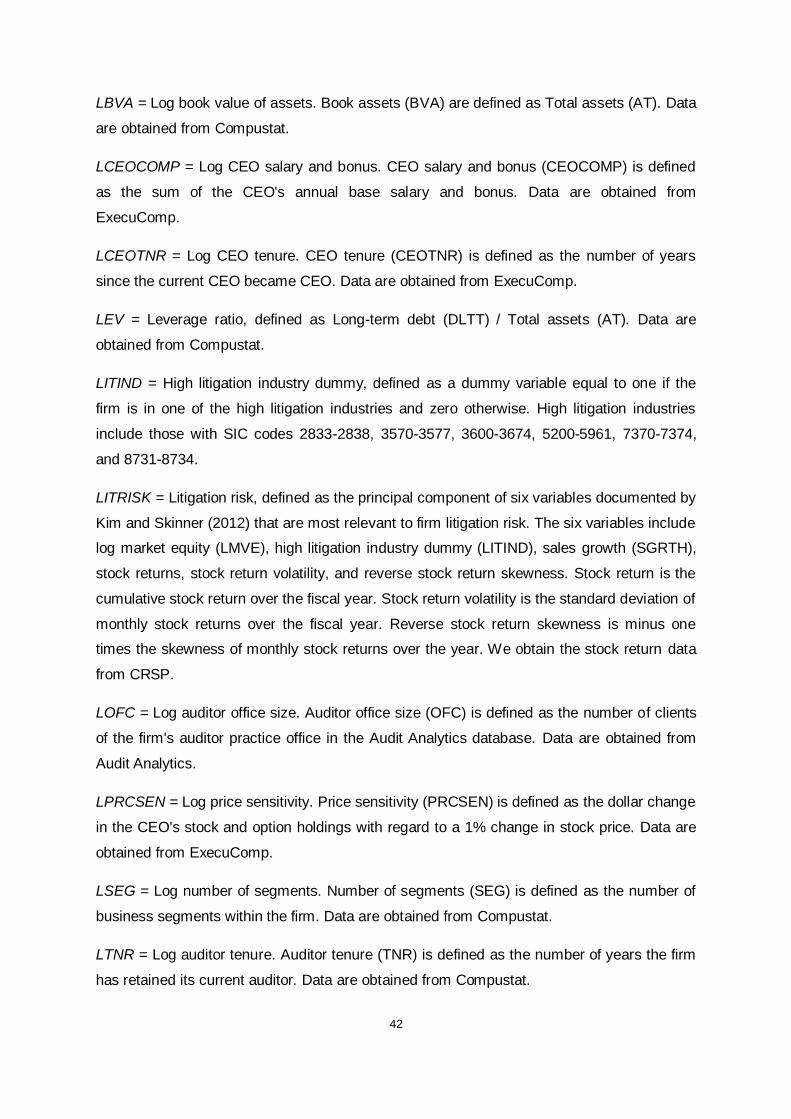
42
LBVA = Log book value of assets. Book assets (BVA) are defined as Total assets (AT). Data
are obtained from Compustat.
LCEOCOMP = Log CEO salary and bonus. CEO salary and bonus (CEOCOMP) is defined
as the sum of the CEO's annual base salary and bonus. Data are obtained from
ExecuComp.
LCEOTNR = Log CEO tenure. CEO tenure (CEOTNR) is defined as the number of years
since the current CEO became CEO. Data are obtained from ExecuComp.
LEV = Leverage ratio, defined as Long-term debt (DLTT) / Total assets (AT). Data are
obtained from Compustat.
LITIND = High litigation industry dummy, defined as a dummy variable equal to one if the
firm is in one of the high litigation industries and zero otherwise. High litigation industries
include those with SIC codes 2833-2838, 3570-3577, 3600-3674, 5200-5961, 7370-7374,
and 8731-8734.
LITRISK = Litigation risk, defined as the principal component of six variables documented by
Kim and Skinner (2012) that are most relevant to firm litigation risk. The six variables include
log market equity (LMVE), high litigation industry dummy (LITIND), sales growth (SGRTH),
stock returns, stock return volatility, and reverse stock return skewness. Stock return is the
cumulative stock return over the fiscal year. Stock return volatility is the standard deviation of
monthly stock returns over the fiscal year. Reverse stock return skewness is minus one
times the skewness of monthly stock returns over the year. We obtain the stock return data
from CRSP.
LOFC = Log auditor office size. Auditor office size (OFC) is defined as the number of clients
of the firm's auditor practice office in the Audit Analytics database. Data are obtained from
Audit Analytics.
LPRCSEN = Log price sensitivity. Price sensitivity (PRCSEN) is defined as the dollar change
in the CEO's stock and option holdings with regard to a 1% change in stock price. Data are
obtained from ExecuComp.
LSEG = Log number of segments. Number of segments (SEG) is defined as the number of
business segments within the firm. Data are obtained from Compustat.
LTNR = Log auditor tenure. Auditor tenure (TNR) is defined as the number of years the firm
has retained its current auditor. Data are obtained from Compustat.

43
LVOLSEN = Log volatility sensitivity. Volatility sensitivity (VOLSEN) is defined as the dollar
change in the CEO's option holdings in response to 0.01 unit change in stock return
volatility. Data are obtained from ExecuComp.
MB = Market-to-book ratio, defined as (Stock Price (PRCC_F) * Shares Outstanding
(CSHPRI)) / Book equity (CEQ). Data are obtained from Compustat.
MDD = Modified Dechow and Dichev (2002) accruals quality measure by McNichols (2002).
Estimated using the data obtained from Compustat. QUICK = Current ratio, defined as
(Current assets (ACT) - Inventories (INVT)) / Current liabilities (LCT).
RET = Stock return, defined as the cumulative stock returns over the fiscal year. Data are
obtained from CRSP.
RND = R&D ratio, defined as R&D expenses (XRD) / Sales (SALE). Data are obtained from
Compustat.
ROA = Return on assets, defined as Operating income before depreciation (OIADP) / Total
assets (AT). Data are obtained from Compustat.
RST = Dummy variable equal to one if the firm restates its financial statements in the
previous year and zero otherwise. Data are obtained from Audit Analytics.
SGRTH = Sales growth, defined as the annual growth rate of sales (SALE). Data are
obtained from Compustat.
SOXD = SOX dummy, defined as a dummy variable equal to one for the post-SOX era (after
2002) and zero for the pre-SOX era (before 2002).
SGRTH = Sales growth, defined as the annual growth rate of Sales (SALE). Data are
obtained from Compustat.
.
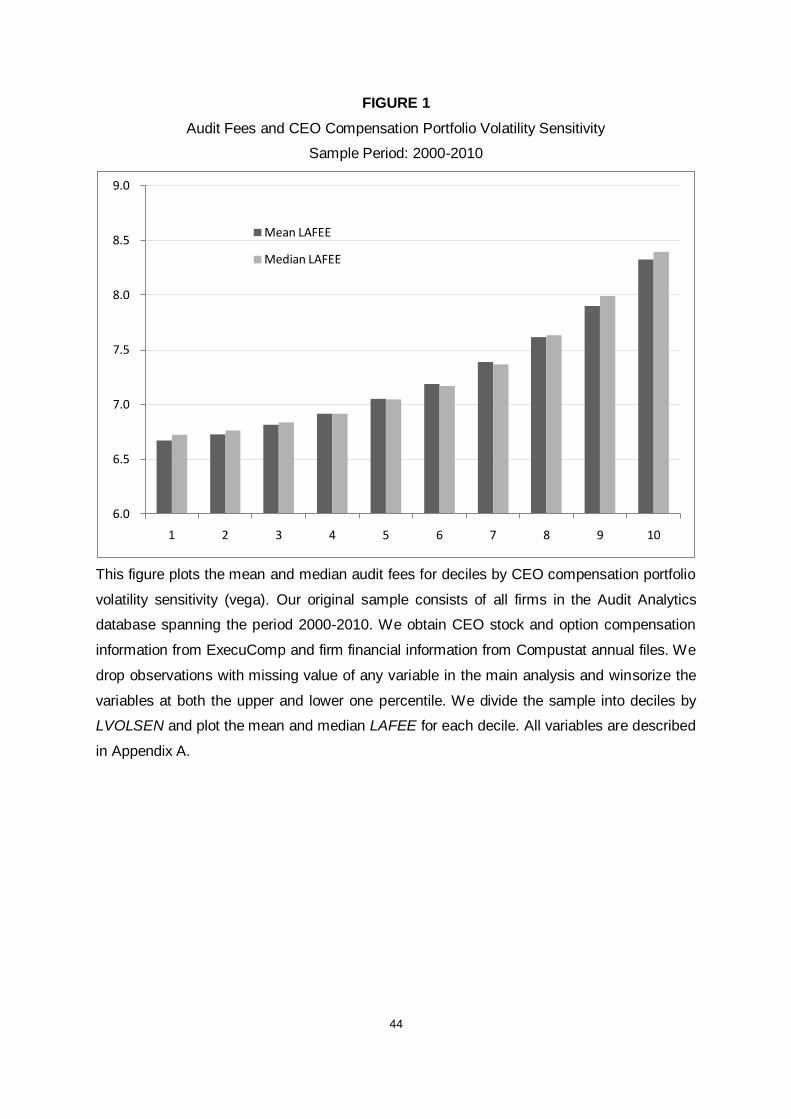
44
FIGURE 1
Audit Fees and CEO Compensation Portfolio Volatility Sensitivity
Sample Period: 2000-2010
This figure plots the mean and median audit fees for deciles by CEO compensation portfolio
volatility sensitivity (vega). Our original sample consists of all firms in the Audit Analytics
database spanning the period 2000-2010. We obtain CEO stock and option compensation
information from ExecuComp and firm financial information from Compustat annual files. We
drop observations with missing value of any variable in the main analysis and winsorize the
variables at both the upper and lower one percentile. We divide the sample into deciles by
LVOLSEN and plot the mean and median LAFEE for each decile. All variables are described
in Appendix A.
6.0
6.5
7.0
7.5
8.0
8.5
9.0
1 2 3 4 5 6 7 8 9 10
Mean LAFEE
Median LAFEE

45
TABLE 1
Summary Statistics
Mean S.D. 25% Median 75%
AFEE ($'000) 2,663.1 3,489.0 653.2 1,390.0 3,083.6
LAFEE 7.259 1.156 6.482 7.237 8.034
VOLSEN ($'000) 157.4 243.7 24.6 66.9 176.5
LVOLSEN 4.134 1.484 3.202 4.203 5.173
PRCSEN ($'000) 595.9 1278.6 85.6 213.3 548.8
LPRCSEN 5.357 1.453 4.450 5.363 6.308
BIG4 0.923 0.266 1.000 1.000 1.000
OFC 54.9 69.1 12.0 29.0 62.0
LOFC 3.335 1.206 2.485 3.367 4.127
TNR 14.4 9.9 7.0 12.0 20.0
LTNR 2.370 0.862 1.946 2.485 2.996
BVA ($'000,000) 4,512.4 6,614.0 554.9 1,519.3 4,639.1
LBVA 7.487 1.357 6.319 7.326 8.442
MB 2.889 2.946 1.442 2.189 3.532
LEV 0.186 0.164 0.017 0.17 0.29
CURR 0.444 0.215 0.280 0.435 0.604
QUICK 1.883 1.696 0.908 1.360 2.133
ROA 0.088 0.095 0.049 0.089 0.137
FRGN 0.471 0.499 0.000 0.000 1.000
SEG 2.642 2.018 1.000 1.000 4.000
LSEG 0.690 0.744 0.000 0.000 1.386
Obs. 11,120
This table presents the mean, standard deviation (S.D.), 25-percentile (25%), median, and
75-percentile (75%) of each variable. Our original sample consists of all firms in the Audit
Analytics database spanning the period 2000-2010. We obtain CEO stock and option
compensation information from ExecuComp and firm financial information from Compustat
annual files. We drop observations with missing value of any variable in the main analysis
and winsorize the variables at both the upper and lower one percentile. All variables are
described in Appendix A.

46
TABLE 2
The Relation between Audit Fees and CEO Compensation Portfolio Sensitivities
Dependent Variable: LAFEE
Model: Raw Value Decile
Ranking
(1) (2) (3) (4) (5)
LVOLSEN 0.328 0.281 0.044 0.074 0.032
(19.303)*** (16.810)*** (3.815)*** (7.025)*** (5.859)***
LPRCSEN 0.002 0.014 -0.027 -0.025 -0.007
(0.124) (0.889) (-2.345)** (-2.316)** (-1.448)
BIG4 0.554 0.293 0.159 0.124
(9.665)*** (6.706)*** (3.963)*** (3.261)***
LOFC 0.044 0.048 0.049 0.024
(2.595)*** (4.393)*** (4.719)*** (5.591)***
LTNR 0.194 0.057 0.052 0.014
(9.125)*** (4.189)*** (3.997)*** (3.332)***
LBVA 0.689 0.678 0.248
(39.802)*** (39.306)*** (40.157)***
MB -0.004 -0.004 -0.007
(-1.284) (-1.373) (-1.565)
LEV 0.063 0.205 0.011
(0.692) (2.355)** (2.361)**
CURR 0.560 0.501 0.040
(7.136)*** (5.692)*** (6.101)***
QUICK -0.068 -0.095 -0.051
(-8.137)*** (-12.023)*** (-9.581)***
ROA -0.299 -0.426 -0.018
(-2.353)** (-3.425)*** (-4.357)***
FRGN 0.831 0.298 0.313
(40.636)*** (9.996)*** (10.575)***
LSEG 0.115 0.120 0.032
(6.770)*** (6.627)*** (7.825)***
Industry FE No No No Yes Yes
Year FE No No No Yes Yes

47
Obs. 11,120 11,120 11,120 11,120 11,120
Adj. R2 0.179 0.225 0.666 0.744 0.738
This table presents the regression results for the relation between audit fees and CEO
compensation portfolio sensitivities. All variables are described in Appendix A. All
regressions were estimated by pooled OLS, with t-statistics computed using standard
errors robust to both clustering at the firm level and heteroskedasticity. Constant term is
included in all the regressions. ***, **, and * denote significance at the 1%, 5%, and 10%
levels, respectively.

48
TABLE 3
Alternative Measures of Compensation Portfolio Sensitivities
Dependent Variable: LAFEE
(1) (2) (3) (4)
LVOLSEN_MGM 0.095
(7.671)***
LPRCSEN_MGM -0.042
(-3.337)***
LVOLSEN_OLD 0.033
(5.296)***
LVOLSEN_NEW 0.032
(4.818)***
LVOLSEN_EX 0.029
(4.942)***
LVOLSEN_UNEX 0.037
(4.805)***
LVOLSEN_NONPERF 0.084
(6.766)***
LPRCSEN -0.016 -0.019 -0.030
(-1.548) (-1.799)* (-2.420)**
BIG4 0.156 0.164 0.160 0.189
(3.864)*** (4.101)*** (4.001)*** (3.487)***
LOFC 0.049 0.050 0.050 0.043
(4.717)*** (4.818)*** (4.776)*** (3.780)***
LTNR 0.050 0.053 0.053 0.054
(3.828)*** (4.073)*** (4.073)*** (3.628)***
LBVA 0.673 0.683 0.682 0.674
(37.700)*** (39.694)*** (38.880)*** (35.351)***
MB -0.004 -0.004 -0.004 -0.005
(-1.287) (-1.377) (-1.319) (-1.492)
LEV 0.209 0.208 0.207 0.175
(2.385)** (2.382)** (2.352)** (1.817)*
CURR 0.507 0.506 0.498 0.461
(5.759)*** (5.731)*** (5.652)*** (4.887)***

49
QUICK -0.096 -0.095 -0.095 -0.093
(-12.117)*** (-11.921)*** (-11.908)*** (-9.639)***
ROA -0.423 -0.433 -0.427 -0.434
(-3.371)*** (-3.476)*** (-3.412)*** (-3.109)***
FRGN 0.297 0.301 0.300 0.302
(9.955)*** (10.098)*** (10.108)*** (9.098)***
LSEG 0.122 0.121 0.120 0.119
(6.726)*** (6.640)*** (6.615)*** (5.900)***
Obs. 11,120 11,120 11,120 8,202
Adj. R2 0.745 0.744 0.744 0.734
This table presents the regression results for the relation between audit fees and the
alternative measures of compensation portfolio sensitivities. LVOLSEN_MGM is the vega for
the top five management. LPRCSEN_MGM is the delta of the top five management.
LVOLSEN_OLD is the vega of CEO options granted in the past. LVOLSEN_NEW is the
vega of CEO options granted in the current year. LVOLSEN_EX is the vega of CEO
exercisable options. LVOLSEN_UNEX is the vega of CEO unexercisable options.
LVOLSEN_NONPERF is non-performance correlated vega of CEO options. The rest of the
variables are described in Appendix A. All regressions are estimated by pooled OLS, with t-
statistics computed using standard errors robust to both clustering at the firm level and
heteroskedasticity. Constant term, year fixed-effects, and industry fixed-effects based on
two-digit SIC codes are included in all the regressions. ***, **, and * denote significance at
the 1%, 5%, and 10% levels, respectively.

50
TABLE 4
Controlling for Past Misreporting and Corporate Governance
Dependent Variable: LAFEE
(1) (2) (3) (4) (5) (6) (7)
LVOLSEN 0.073 0.078 0.078 0.084 0.074 0.074 0.081
(7.021)*** (6.832)*** (6.845)*** (6.549)*** (6.987)*** (6.084)*** (5.856)***
LPRCSEN -0.023 -0.025 -0.023 -0.028 -0.024 -0.014 -0.019
(-2.147)** (-2.231)** (-2.092)** (-2.257)** (-2.310)** (-1.185) (-1.389)
BIG4 0.156 0.139 0.136 0.111 0.159 0.070 0.062
(3.926)*** (3.284)*** (3.244)*** (2.105)** (3.958)*** (1.586) (1.190)
LOFC 0.050 0.052 0.052 0.047 0.049 0.045 0.049
(4.768)*** (4.769)*** (4.807)*** (4.044)*** (4.714)*** (4.002)*** (4.079)***
LTNR 0.055 0.055 0.057 0.056 0.052 0.054 0.053
(4.224)*** (4.034)*** (4.227)*** (3.758)*** (3.997)*** (3.816)*** (3.459)***
LBVA 0.678 0.686 0.686 0.690 0.678 0.681 0.695
(39.675)*** (37.876)*** (38.245)*** (34.478)*** (39.248)*** (36.395)*** (33.428)***
MB -0.004 -0.007 -0.007 -0.004 -0.004 -0.003 -0.002
(-1.376) (-1.987)** (-1.986)** (-1.266) (-1.378) (-0.838) (-0.585)
LEV 0.205 0.218 0.218 0.200 0.205 0.061 0.066
(2.364)** (2.422)** (2.439)** (2.096)** (2.349)** (0.629) (0.636)
CURR 0.490 0.469 0.460 0.589 0.501 0.491 0.512

51
(5.601)*** (5.132)*** (5.068)*** (5.822)*** (5.699)*** (5.209)*** (4.877)***
QUICK -0.094 -0.096 -0.095 -0.108 -0.095 -0.103 -0.110
(-11.962)*** (-11.530)*** (-11.493)*** (-11.316)*** (-12.035)*** (-11.955)*** (-11.110)***
ROA -0.400 -0.378 -0.354 -0.640 -0.427 -0.583 -0.658
(-3.245)*** (-2.837)*** (-2.677)*** (-4.138)*** (-3.424)*** (-4.084)*** (-3.984)***
FRGN 0.300 0.292 0.293 0.332 0.298 0.284 0.311
(10.117)*** (9.323)*** (9.413)*** (9.205)*** (9.995)*** (8.559)*** (8.285)***
LSEG 0.119 0.126 0.125 0.115 0.120 0.104 0.105
(6.609)*** (6.588)*** (6.560)*** (5.744)*** (6.636)*** (5.324)*** (5.088)***
RST 0.232 0.223 -0.011 -0.014
(8.700)*** (8.325)*** (-1.657)* (-2.098)**
MDD 0.917 0.890 0.084 0.074 0.074 0.081
(2.594)*** (2.536)** (6.549)*** (6.987)*** (6.084)*** (5.856)***
GINDEX -0.011 -0.014
(-1.657)* (-2.098)**
DEDIO 0.022 -0.049
(0.231) (-0.433)
BIDP 0.460 0.471
(5.677)*** (5.305)***
Obs. 10,052 10,052 10,052 7,816 7,816 7,816 7,816
Adj. R2 0.747 0.744 0.744 0.737 0.744 0.751 0.748

52
This table presents the regression results for the relation between audit fees and CEO compensation portfolio sensitivities after controlling for
past misreporting (Columns (1) and (2)) and corporate governance (Columns (3) to (5)). All variables are described in Appendix A. All
regressions were estimated by pooled OLS, with t-statistics computed using standard errors robust to both clustering at the firm level and
heteroskedasticity. Constant term, year fixed-effects and industry fixed-effects based on two-digit SIC codes are included in all the regressions.
All variables are described in Appendix A. ***, **, and * denote significance at the 1%, 5%, and 10% levels, respectively.

53
TABLE 5
Controlling for Business Risk
Predicting Investments Fitted Investment Measures
Dependent
Variable: RND CAPEX LAFEE LAFEE LAFEE
(1) (2) (3) (4) (5)
LVOLSEN 0.002 -0.003 0.081 0.073 0.068
(2.858)*** (-4.547)*** (7.331)*** (6.366)*** (6.104)***
LPRCSEN -0.002 0.004 -0.028 -0.023 -0.005
(-2.201)** (6.792)*** (-2.533)** (-1.805)* (-0.450)
BIG4 0.160 0.158 0.160
(4.005)*** (3.936)*** (4.010)***
LOFC 0.051 0.049 0.051
(4.920)*** (4.691)*** (4.922)***
LTNR 0.051 0.052 0.050
(3.907)*** (3.996)*** (3.862)***
LBVA -0.003 -0.004 0.672 0.677 0.646
(-3.142)*** (-3.625)*** (39.032)*** (35.915)*** (34.785)***
MB 0.001 0.001 -0.002 -0.004 0.002
(2.400)** (3.728)*** (-0.555) (-1.348) (0.664)
LEV -0.000 -0.022 0.200 0.202 0.064
(-0.038) (-4.696)*** (2.280)** (2.107)** (0.676)
CURR 0.654 0.498 0.646
(5.748)*** (5.205)*** (5.688)***
QUICK -0.082 -0.096 -0.081
(-8.741)*** (-11.847)*** (-8.653)***
ROA -0.505 -0.434 -0.477
(-4.079)*** (-3.431)*** (-3.827)***
FRGN 0.290 0.299 0.289
(9.559)*** (9.984)*** (9.506)***
LSEG 0.116 0.120 0.115
(6.314)*** (6.604)*** (6.293)***
SGRTH -0.006 0.012
(-2.027)** (5.686)***

54
RET -0.001 -0.004
(-1.445) (-7.327)***
CASH 0.128 -0.030
(14.714)*** (-8.193)***
Fitted RND -2.434 -3.875
(-2.404)** (-3.529)***
Fitted CAPEX -0.263 -6.035
(-0.152) (-3.685)***
Obs. 11,068 11,068 11,068 11,068 11,068
Adj. R2 0.486 0.453 0.745 0.744 0.745
This table presents the regression results for the relation between audit fees and CEO
compensation portfolio sensitivities after controlling for fitted investment measures. In the first
stage, we regress capital expenditure (CAPEX) and R&D expenses (RND) against the set of
predictor variables and in the second stage, we include fitted values of CAPEX and RND from
the first-stage regression control variables in our baseline model. Predictive regressions for
investment measures were estimated following Coles et al. (2006). All regressions were
estimated by pooled OLS, with t-statistics computed using standard errors robust to both
clustering at the firm level and heteroskedasticity. All variables are described in Appendix A.
Constant term, year fixed-effects and industry fixed effects based on two-digit SIC codes are
included in all the regressions. ***, **, and * denote significance at the 1%, 5%, and 10%
levels, respectively.

55
TABLE 6
Change-in-variable Analysis
Dependent Variable: ΔLAFEE
(1) (2) (3)
ΔLVOLSEN 0.023 0.019 0.013
(3.666)*** (3.153)*** (2.198)**
ΔLPRCSEN -0.020 -0.020 -0.026
(-2.969)*** (-2.951)*** (-3.501)***
ΔBIG4 0.284 0.298
(3.960)*** (4.163)***
ΔLOFC 0.046 0.051
(3.019)*** (3.377)***
ΔLTNR 0.121 0.116
(7.241)*** (7.112)***
ΔLBVA 0.039
(3.040)***
ΔMB -0.002
(-1.358)
ΔLEV 0.286
(4.391)***
ΔCURR -0.150
(-2.087)**
ΔQUICK -0.030
(-4.304)***
ΔROA -0.040
(-0.485)
ΔFRGN 0.440
(20.430)***
ΔLSEG 0.076
(9.267)***
Obs. 8,231 8,231 8,231
Adj. R2 0.001 0.035 0.145

56
This table presents the regression results for the relation between change in log
audit fees and change in CEO compensation portfolio sensitivities. All regressions
were estimated by pooled OLS, with t-statistics computed using standard errors
robust to both clustering at the firm level and heteroskedasticity. All variables are
described in Appendix A. Constant term, year fixed-effects and industry fixed-
effects based on two-digit SIC codes are included in all the regressions. ***, **, and
* denote significance at the 1%, 5%, and 10% levels, respectively.

57
TABLE 7
Two-stage Least Squares Regression
Model: First-stage Regression
Second-stage
Regression
Dependent
Variable:
LVOLSEN
LPRCSEN
LAFEE
(1) (2) (3)
Fitted LVOLSEN 0.574
(7.974)***
Fitted LPRCSEN -0.318
(-5.843)***
BIG4 0.225 0.076 0.071
(3.403)*** (1.171) (1.154)
LOFC 0.043 0.024 0.032
(2.713)*** (1.493) (2.413)**
LTNR 0.069 -0.032 -0.003
(3.398)*** (-1.561) (-0.157)
LBVA 0.721 0.606 0.420
(25.707)*** (20.673)*** (9.177)***
MB 0.027 0.058 -0.003
(4.602)*** (8.580)*** (-0.577)
LEV -0.835 -1.131 0.283
(-6.439)*** (-8.691)*** (2.453)**
CURR -0.931 -0.888 0.454
(-5.241)*** (-4.816)*** (4.012)***
QUICK 0.023 0.025 -0.102
(1.466) (1.416) (-9.082)***
ROA 2.703 3.506 -0.595
(11.858)*** (15.082)*** (-3.148)***
FRGN 0.169 0.113 0.265
(3.480)*** (2.443)** (6.717)***
LSEG 0.000 0.003 0.109
(0.001) (0.107) (4.770)***
CASH 0.897 0.660
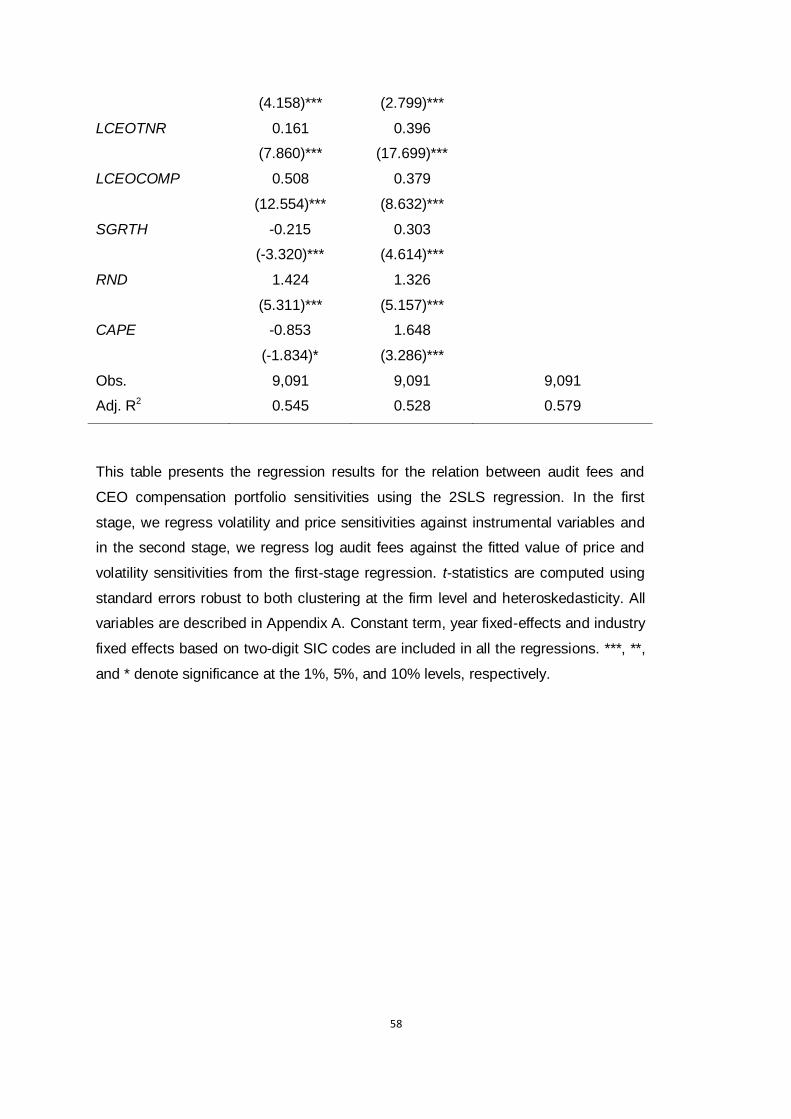
58
(4.158)*** (2.799)***
LCEOTNR 0.161 0.396
(7.860)*** (17.699)***
LCEOCOMP 0.508 0.379
(12.554)*** (8.632)***
SGRTH -0.215 0.303
(-3.320)*** (4.614)***
RND 1.424 1.326
(5.311)*** (5.157)***
CAPE -0.853 1.648
(-1.834)* (3.286)***
Obs. 9,091 9,091 9,091
Adj. R2 0.545 0.528 0.579
This table presents the regression results for the relation between audit fees and
CEO compensation portfolio sensitivities using the 2SLS regression. In the first
stage, we regress volatility and price sensitivities against instrumental variables and
in the second stage, we regress log audit fees against the fitted value of price and
volatility sensitivities from the first-stage regression. t-statistics are computed using
standard errors robust to both clustering at the firm level and heteroskedasticity. All
variables are described in Appendix A. Constant term, year fixed-effects and industry
fixed effects based on two-digit SIC codes are included in all the regressions. ***, **,
and * denote significance at the 1%, 5%, and 10% levels, respectively.

59
TABLE 8
Interaction between CEO Compensation Portfolio Volatility Sensitivity and Litigation Risk
Dependent Variable: LAFEE
(1) (2) (3)
LVOLSEN -0.393 0.044 0.097
(-6.931)*** (2.936)*** (7.470)***
LVOLSEN×LBVA 0.063
(8.098)***
LVOLSEN×LITIND 0.043
(2.531)**
LITIND -0.172
(-2.185)**
LVOLSEN×LITRISK 0.040
(6.091)***
LITRISK -0.197
(-7.210)***
LPRCSEN -0.027 -0.023 -0.038
(-2.593)*** (-2.137)** (-2.979)***
BIG4 0.200 0.163 0.207
(5.019)*** (4.071)*** (3.730)***
LOFC 0.048 0.049 0.039
(4.700)*** (4.754)*** (3.359)***
LTNR 0.051 0.053 0.058
(3.973)*** (4.039)*** (3.895)***
LBVA 0.405 0.680 0.697
(11.183)*** (39.301)*** (31.603)***
MB -0.006 -0.004 -0.008
(-1.768)* (-1.371) (-2.125)**
LEV 0.274 0.201 0.171
(3.231)*** (2.325)** (1.749)*
CURR 0.483 0.502 0.425
(5.545)*** (5.694)*** (4.299)***
QUICK -0.091 -0.095 -0.095
(-11.528)*** (-11.840)*** (-9.429)***

60
ROA -0.299 -0.399 -0.193
(-2.449)** (-3.203)*** (-1.260)
FRGN 0.294 0.295 0.302
(10.027)*** (9.865)*** (8.759)***
LSEG 0.120 0.120 0.117
(6.813)*** (6.620)*** (5.763)***
Obs. 11,107 11,107 7,744
Adj. R2 0.750 0.745 0.741
This table presents the regression results for the effect of litigation risk on the
relation between audit fees and CEO compensation portfolio volatility sensitivity. All
variables are described in Appendix A. All regressions were estimated by pooled
OLS, with t-statistics computed using standard errors robust to both clustering at
the firm level and heteroskedasticity. Constant term, year fixed-effects and industry
fixed-effects based on two-digit SIC codes are included in all the regressions. ***,
**, and * denote significance at the 1%, 5%, and 10% levels, respectively.

61
TABLE 9
Interaction between CEO Compensation Portfolio Volatility Sensitivity and SOX
Dependent Variable: LAFEE
Sample: Full Sample Pre-Clawback
Provision Sample Post-SOX Sample
(1) (2) (3)
LVOLSEN 0.126 0.118 0.090
(8.436)*** (6.488)*** (5.815)***
LVOLSEN×SOXD -0.089 -0.053
(-6.803)*** (-3.454)***
SOX 1.102 0.693
(19.603)*** (10.104)***
LVOLSEN×CLAWD -0.038
(-2.917)***
CLAW 0.542
(8.590)***
LPRCSEN -0.025 -0.040 -0.008
(-2.365)** (-2.564)** (-0.713)
BIG4 0.086 0.104 0.161
(2.157)** (2.275)** (2.700)***
LOFC 0.039 0.058 0.051
(3.842)*** (4.269)*** (4.704)***
LTNR 0.064 0.052 0.042
(4.743)*** (3.051)*** (2.776)***
LBVA 0.687 0.723 0.650
(40.827)*** (30.428)*** (36.784)***
MB -0.007 0.000 -0.006
(-2.121)** (0.068) (-1.770)*
LEV 0.177 0.335 0.211
(2.010)** (2.752)*** (2.307)**
CURR 0.488 0.438 0.509
(5.402)*** (3.638)*** (5.319)***
QUICK -0.090 -0.110 -0.084
(-10.769)*** (-13.092)*** (-8.790)***

62
ROA -0.300 -0.371 -0.496
(-2.454)** (-2.168)** (-3.645)***
FRGN 0.503 0.563 0.401
(20.319)*** (18.238)*** (14.320)***
LSEG 0.108 0.125 0.127
(6.805)*** (5.354)*** (7.882)***
Obs. 10,132 3,480 7,680
Adj. R2 0.727 0.725 0.704
This table presents the regression results for the effect of SOX on the relation
between audit fees and CEO compensation portfolio volatility sensitivity. All
variables are described in Appendix A. All regressions were estimated by pooled
OLS, with t-statistics computed using standard errors robust to both clustering at
the firm level and heteroskedasticity. Constant term, year fixed-effects and industry
fixed effects based on two-digit SIC codes are included in all the regressions. ***,
**, and * denote significance at the 1%, 5%, and 10% levels, respectively.

63
TABLE 10
Interaction between CEO Compensation Portfolio Volatility Sensitivity and CEO
Characteristics
Dependent Variable: LAFEE
(1) (2) (3)
LVOLSEN -0.010 0.083 0.043
(-0.253) (6.454)*** (2.739)***
LVOLSEN×CEOAGE 0.025
(2.181)**
CEOAGE -0.059
(-1.289)
LVOLSEN×LCEOTNR -0.019
(-1.514)
LCEOTNR 0.053
(1.041)
LVOLSEN×CEOUNI 0.057
(3.641)***
CEOUNI -0.221
(-3.479)***
LPRCSEN -0.017 -0.021 -0.023
(-1.446) (-1.951)* (-1.926)*
BIG4 0.141 0.129 0.053
(2.900)*** (3.257)*** (1.214)
LOFC 0.054 0.052 0.047
(4.969)*** (4.998)*** (4.210)***
LTNR 0.052 0.055 0.054
(3.581)*** (4.225)*** (3.805)***
LBVA 0.652 0.674 0.685
(37.991)*** (39.515)*** (36.783)***
MB -0.004 -0.005 -0.003
(-1.082) (-1.435) (-0.859)
LEV 0.230 0.232 0.121
(2.371)** (2.689)*** (1.265)
CURR 0.504 0.514 0.530

64
(5.206)*** (5.908)*** (5.659)***
QUICK -0.087 -0.095 -0.105
(-8.990)*** (-12.049)*** (-11.809)***
ROA -0.425 -0.428 -0.585
(-3.237)*** (-3.459)*** (-4.157)***
FRGN 0.320 0.301 0.288
(9.884)*** (10.107)*** (8.641)***
LSEG 0.123 0.124 0.118
(6.551)*** (6.869)*** (6.031)***
Obs. 8,264 8.354 8,846
Adj. R2 0.749 0.745 0.751
This table presents the regression results for the effect of CEO characteristics (age, tenure
and power) on the relation between audit fees and CEO compensation portfolio volatility
sensitivity. All variables are described in Appendix A. All regressions were estimated by
pooled OLS, with t-statistics computed using standard errors robust to both clustering at the
firm level and heteroskedasticity. Constant term, year fixed-effects and industry fixed-effects
based on two-digit SIC codes are included in all the regressions. ***, **, and * denote
significance at the 1%, 5%, and 10% levels, respectively.