yara q4 report 11 february 2015
TRANSCRIPT
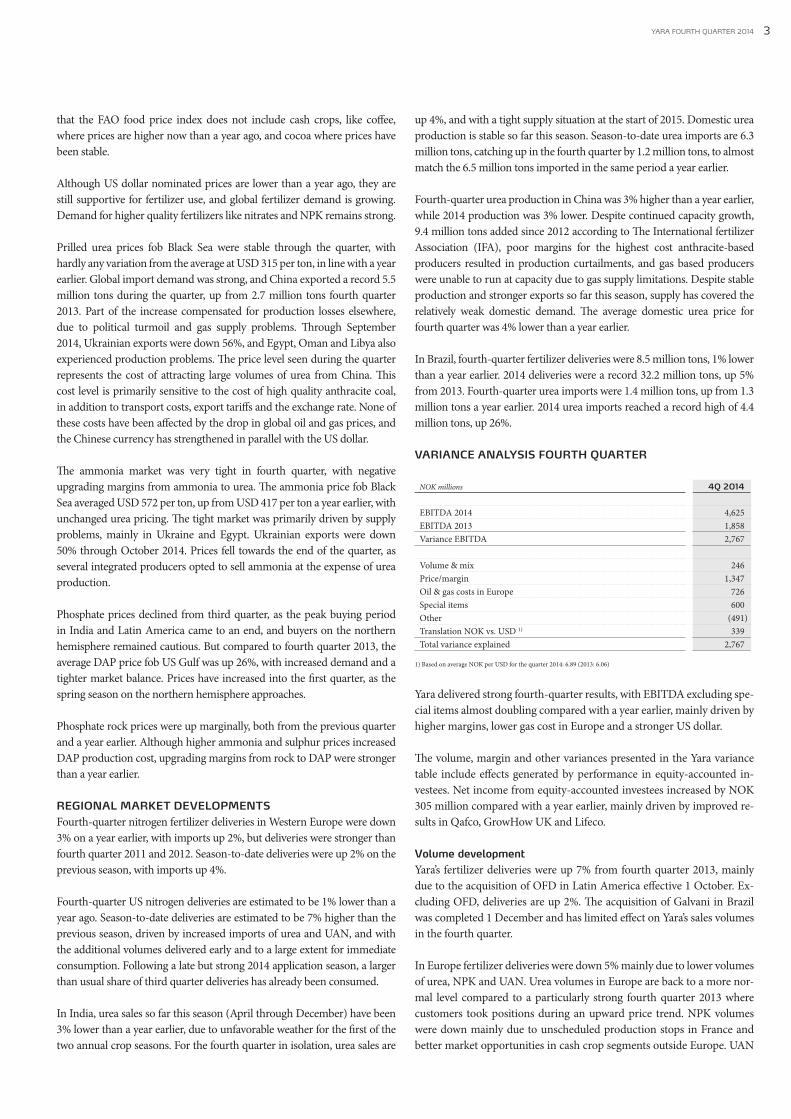
EBITDA (NOK millions) Earnings per share (NOK) Debt/equity ratio
0
2000
4000
6000
4Q143Q142Q141Q144Q133Q132Q130.0
2.5
5.0
7.5
10.0
4Q143Q142Q141Q144Q133Q132Q130.00
0.05
0.10
0.15
0.20
4Q143Q142Q141Q144Q133Q132Q13
REPORT
EARNINGS PER SHARE
NOK 6.74
Yara International ASA – quarterly report
• Strong result driven by higher margins
• Margins benefit from lower European gas prices and stronger US dollar
• Continued volume and margin growth in Brazil
• Further growth in Latin America with OFD and Galvani acquisitions
• Proposed dividend NOK 13 per share, 47% of net income
Fourth quarter 2014
Yara reports strong fourth-quarter results with improved margins, lower natural gas cost in Europe and a stronger US dollar.

2 YARA FOURTH QUARTER 2014
FINANCIAL HIGHLIGHTS
NOK millions, except where indicated otherwise 4Q 2014 4Q 2013 2014 2013
Revenue and other income 26,230 20,573 95,343 85,092 Operating income 2,688 583 10,305 8,074 Share net income equity-accounted investees 265 (41) 786 1,076 EBITDA 4,625 1,858 16,407 13,399 EBITDA excl. special items 4,528 2,360 16,544 13,834 Net income after non-controlling interests 1,860 63 7,625 5,759 Earnings per share 1) 6.74 0.23 27.59 20.67 Earnings per share excl.currency 1) 7.64 0.90 29.33 23.20 Earnings per share excl.currency and special items 1) 8.17 2.80 30.66 24.95Average number of shares outstanding (millions) 275.8 277.2 276.4 278.6 CROGI (12-month rolling average) 2) 13.3 % 12.6 %ROCE (12-month rolling average) 13.3 % 12.6 %
1) NOK per share. Yara currently has no share-based compensation programs that result in a dilutive effect on EPS.2) Fourth-quarter 2014 CROGI excl. special items annualized 13.6%.
KEY STATISTICS
4Q 2014 4Q 2013 2014 2013
Average pricesUrea prilled (fob Black Sea) USD per ton 315 314 318 341CAN (cif Germany) USD per ton 310 291 329 315Ammonia (fob Black Sea) USD per ton 572 417 496 477DAP (fob US Gulf) USD per ton 459 365 473 443Phosphate rock (fob Morocco) USD per ton 122 117 118 143
European gas (Zeebrugge) USD per MMBtu 8.2 10.7 8.1 10.6US gas (Henry Hub) USD per MMBtu 3.8 3.8 4.4 3.7Yara's gas & oil cost (weighted average) 1) USD per MMBtu 6.5 7.8 6.9 8.0Yara's European gas & oil cost (weighted average) 1) USD per MMBtu 8.5 11.2 9.1 11.4USD/NOK currency rate 6.89 6.06 6.30 5.87
Production (Thousand tons) 1)
Ammonia 1,792 1,844 7,096 7,360 Finished fertilizer and industrial products, excl. bulk blends 4,685 4,778 18,828 18,649 Total 6,477 6,623 25,924 26,009
Sales (Thousand tons)Ammonia trade 507 490 2,041 2,203 Fertilizer 6,585 6,146 26,317 23,668 Industrial products 2) 1,720 1,665 6,593 6,255 Total 8,813 8,301 34,951 32,127
1) Including Yara’s share in equity-accounted investees. 2) Including feed phospates and CO2 as from 2014 reporting (2013 restated)
Yara’s fourth-quarter net income after non-controlling interests was NOK 1,860 million, compared with NOK 63 million a year earlier. Excluding net foreign exchange gain/loss and special items, the result was NOK 2,253 million, compared with NOK 776 million in fourth quarter 2013. The corresponding earnings per share were NOK 8.17 compared with NOK 2.80 a year earlier.
“Yara reports strong fourth-quarter results with improved margins, lower natural gas cost in Europe and a stronger US dollar,” said Torgeir Kvidal, acting Chief Executive Officer of Yara.
“Our Brazilian activities continue to perform well, with both higher volumes and margins. We are also ahead of plan with synergy capture from the Bunge acquisition, with USD 55 million realized in 2014 ,” said Torgeir Kvidal.
FERTILIZER MARKET CONDITIONSFollowing two consecutive record global grain harvests, global grain ending stocks are expected to increase to a level corresponding to 77 days of consumption, up 4 days over the last two years, according to the latest US Department of Agriculture (USDA) forecast. The strong harvests also resulted in lower prices for several key crops. The Food and Agriculture Organization of the United Nations (FAO) food price index was down 7% on fourth quarter 2013 (8% lower than the five-year average), while its cereal price index was down 6% (16% lower than the five-year average). From its low point in September, the cereal price index ended the year 3% higher, with increased market attention on the need for another record crop in 2015. As the US dollar has strengthened against most relevant currencies, the price developments have been significantly more positive in many key producing regions outside the US, including Europe. It is also worth noting
Fourth quarter 2014
3YARA FOURTH QUARTER 2014
that the FAO food price index does not include cash crops, like coffee, where prices are higher now than a year ago, and cocoa where prices have been stable.
Although US dollar nominated prices are lower than a year ago, they are still supportive for fertilizer use, and global fertilizer demand is growing. Demand for higher quality fertilizers like nitrates and NPK remains strong.
Prilled urea prices fob Black Sea were stable through the quarter, with hardly any variation from the average at USD 315 per ton, in line with a year earlier. Global import demand was strong, and China exported a record 5.5 million tons during the quarter, up from 2.7 million tons fourth quarter 2013. Part of the increase compensated for production losses elsewhere, due to political turmoil and gas supply problems. Through September 2014, Ukrainian exports were down 56%, and Egypt, Oman and Libya also experienced production problems. The price level seen during the quarter represents the cost of attracting large volumes of urea from China. This cost level is primarily sensitive to the cost of high quality anthracite coal, in addition to transport costs, export tariffs and the exchange rate. None of these costs have been affected by the drop in global oil and gas prices, and the Chinese currency has strengthened in parallel with the US dollar.
The ammonia market was very tight in fourth quarter, with negative upgrading margins from ammonia to urea. The ammonia price fob Black Sea averaged USD 572 per ton, up from USD 417 per ton a year earlier, with unchanged urea pricing. The tight market was primarily driven by supply problems, mainly in Ukraine and Egypt. Ukrainian exports were down 50% through October 2014. Prices fell towards the end of the quarter, as several integrated producers opted to sell ammonia at the expense of urea production.
Phosphate prices declined from third quarter, as the peak buying period in India and Latin America came to an end, and buyers on the northern hemisphere remained cautious. But compared to fourth quarter 2013, the average DAP price fob US Gulf was up 26%, with increased demand and a tighter market balance. Prices have increased into the first quarter, as the spring season on the northern hemisphere approaches.
Phosphate rock prices were up marginally, both from the previous quarter and a year earlier. Although higher ammonia and sulphur prices increased DAP production cost, upgrading margins from rock to DAP were stronger than a year earlier.
REGIONAL MARKET DEVELOPMENTSFourth-quarter nitrogen fertilizer deliveries in Western Europe were down 3% on a year earlier, with imports up 2%, but deliveries were stronger than fourth quarter 2011 and 2012. Season-to-date deliveries were up 2% on the previous season, with imports up 4%.
Fourth-quarter US nitrogen deliveries are estimated to be 1% lower than a year ago. Season-to-date deliveries are estimated to be 7% higher than the previous season, driven by increased imports of urea and UAN, and with the additional volumes delivered early and to a large extent for immediate consumption. Following a late but strong 2014 application season, a larger than usual share of third quarter deliveries has already been consumed.
In India, urea sales so far this season (April through December) have been 3% lower than a year earlier, due to unfavorable weather for the first of the two annual crop seasons. For the fourth quarter in isolation, urea sales are
up 4%, and with a tight supply situation at the start of 2015. Domestic urea production is stable so far this season. Season-to-date urea imports are 6.3 million tons, catching up in the fourth quarter by 1.2 million tons, to almost match the 6.5 million tons imported in the same period a year earlier.
Fourth-quarter urea production in China was 3% higher than a year earlier, while 2014 production was 3% lower. Despite continued capacity growth, 9.4 million tons added since 2012 according to The International fertilizer Association (IFA), poor margins for the highest cost anthracite-based producers resulted in production curtailments, and gas based producers were unable to run at capacity due to gas supply limitations. Despite stable production and stronger exports so far this season, supply has covered the relatively weak domestic demand. The average domestic urea price for fourth quarter was 4% lower than a year earlier.
In Brazil, fourth-quarter fertilizer deliveries were 8.5 million tons, 1% lower than a year earlier. 2014 deliveries were a record 32.2 million tons, up 5% from 2013. Fourth-quarter urea imports were 1.4 million tons, up from 1.3 million tons a year earlier. 2014 urea imports reached a record high of 4.4 million tons, up 26%.
VARIANCE ANALYSIS FOURTH QUARTER
NOK millions 4Q 2014
EBITDA 2014 4,625 EBITDA 2013 1,858 Variance EBITDA 2,767
Volume & mix 246 Price/margin 1,347 Oil & gas costs in Europe 726 Special items 600 Other (491)Translation NOK vs. USD 1) 339 Total variance explained 2,767
1) Based on average NOK per USD for the quarter 2014: 6.89 (2013: 6.06)
Yara delivered strong fourth-quarter results, with EBITDA excluding spe-cial items almost doubling compared with a year earlier, mainly driven by higher margins, lower gas cost in Europe and a stronger US dollar.
The volume, margin and other variances presented in the Yara variance table include effects generated by performance in equity-accounted in-vestees. Net income from equity-accounted investees increased by NOK 305 million compared with a year earlier, mainly driven by improved re-sults in Qafco, GrowHow UK and Lifeco.
Volume developmentYara’s fertilizer deliveries were up 7% from fourth quarter 2013, mainly due to the acquisition of OFD in Latin America effective 1 October. Ex-cluding OFD, deliveries are up 2%. The acquisition of Galvani in Brazil was completed 1 December and has limited effect on Yara’s sales volumes in the fourth quarter.
In Europe fertilizer deliveries were down 5% mainly due to lower volumes of urea, NPK and UAN. Urea volumes in Europe are back to a more nor-mal level compared to a particularly strong fourth quarter 2013 where customers took positions during an upward price trend. NPK volumes were down mainly due to unscheduled production stops in France and better market opportunities in cash crop segments outside Europe. UAN

4 YARA FOURTH QUARTER 2014
deliveries were down due to increased urea / Air1 and nitrate production at the expense of UAN. Nitrates were up 5% mainly due to catchup of order backlogs in Scandinavia.
Fertilizer deliveries outside Europe were up 15%. Excluding OFD the de-liveries were up 7%, driven by higher sales in Brazil and tenders awarded in Africa. NPK deliveries to Latin America partly offset the reduced vol-umes in Europe and reduced deliveries to Asia caused by weak rubber crop prices.
Industrial sales volumes increased by 3% compared with fourth quarter 2013. Deliveries of automotive NOx abatement product (Air1) were up 32%, with SCR-technology now the standard for NOx emission reduc-tion in all new heavy-duty diesel trucks in Europe, US and Brazil. Sales of process chemicals were up 7%, mainly driven by increased ammonia and technical urea sales to European export-driven process industries. Techni-cal ammonium nitrate (TAN) sales were 25% lower due to decreased coal mining activity.
Yara’s ammonia production was 3% lower than in fourth quarter 2013, mainly impacted by scheduled turnarounds which saw longer duration than planned due to unforeseen repairs, as well as an energy efficiency improvement project at the Tringen 1 plant in Trinidad. The Lifeco plant in Libya produced at less than 50% capacity during the quarter as gas supply was curtailed, however, disruptions were more severe a year ear-lier. The production losses were partly offset by increased production in several other plants, with record production in the Pilbara plant in Australia.
Finished fertilizer production was 2% below fourth quarter 2013 partly as a result of scheduled turnarounds mainly impacting urea production and unscheduled stops primarily in the NPK plants. New production capac-ity from the acquired Cartagena plant (OFD) in Colombia included from October offset part of the losses. SSP production increased 8% due to in-clusion of the Galvani plants in Brazil from December.
Yara stocks are up 21% compared to end of 2013. Excluding OFD, Gal-vani and adjusted for stock in transit to Asia the underlying increase is 7% compared to the low levels in 2013, but in line with previous years.
Margin developmentYara’s average European gas and oil cost was 24% below fourth quarter 2013 on a USD per MMBtu basis as average spot gas prices declined significantly. Yara’s global average oil and gas cost decreased 17%. The European spot gas decline was partly offset by an increase in ammonia-linked gas cost and higher North American gas prices.
Ammonia market prices increased by 37%, while Yara’s average realized urea prices increased 5%. The increase in average urea price is driven by geographical volume mix and improved relative pricing in North America. Realized nitrate prices were up 2% compared to fourth quarter 2013, while NPK compound prices decreased on average 1%. Underlying NPK blend margins in Brazil were moderately up.
Industrial margins were up compared with the previous year. Air 1 deliv-ered robust margins boosted by higher market penetration of new heavy-duty diesel trucks with SCR technology in Europe and in the US. Margins on technical urea sales were higher due to increased demand for building materials in housing construction. Rapid adoption of Yara’s SOx scrubber technology in the cruise lines sector led to increased margins for the envi-ronmental technology business. Technical ammonium nitrate (TAN) mar-gins were significantly lower compared with fourth quarter 2013 due to slow down in the mining sector.
Other items Total special items were a net positive NOK 97 million, with the main positive effects from liquidated damages related to a gas contract in Pil-bara and contract derivatives, partly offset by scrapping of production equipment following turnaround, Industrial contract settlement and OFD integration costs. There is also a net positive effect in the Downstream seg-ment of around NOK 100 million resulting from a number of items that are not directly linked to business performance but that are not classified as special items. These include favorable outcome in several sales tax cases in Brazil and rebates recognized on an annual basis in the fourth quarter. A further NOK 100 million of integration costs for OFD is expected in first half 2015. Fourth-quarter 2013 special items were a net negative NOK 502 million. For further details on special items see pages 10 and 11.
The major part of the “Other” variance is related to increased fixed costs, primarily due to the acquisitions of OFD in Latin America and Galvani in Brazil and other growth related activities.
The US dollar was approximately 14% stronger versus the Norwegian kro-ne compared with fourth quarter 2013, resulting in a positive translation effect in Yara’s results.

5YARA FOURTH QUARTER 2014
PRODUCTION VOLUMES 1)
Thousand tons 4Q 2014 4Q 2013 2014 2013
Ammonia 1,792 1,844 7,096 7,360 of which equity-accounted investees 397 360 1,410 1,488
Urea 1,173 1,189 4,790 4,841 of which equity-accounted investees 376 365 1,440 1,616
Nitrate 1,576 1,587 6,252 6,224 of which equity-accounted investees 99 100 389 361
NPK 1,210 1,241 4,755 4,646 of which equity-accounted investees 40 67 216 181
CN 297 285 1,287 1,199UAN 213 276 934 1,081SSP-based fertilizer 217 201 810 659Total production 1) 6,477 6,623 25,924 26,009
1) Including Yara share of production in equity-accounted investees. Tringen is from 2014 classified as “Joint operations” in line with IFRS 11, and is not any longer included as equity-accounted investee. 2013 has been restated accordingly.
SALES VOLUMES
Thousand tons 4Q 2014 4Q 2013 2014 2013
Ammonia 732 705 2,859 3,050 of which industrial products 1) 206 172 715 669
Urea 1,849 1,769 6,908 6,741 of which fertilizer 1,426 1,429 5,298 5,494 of which Yara-produced fertilizer 482 564 1,997 1,923 of which Yara-produced industrial products 2) 306 313 1,241 1,123 of which equity-accounted investees 626 778 2,471 3,100
Nitrate 1,610 1,566 6,249 6,489 of which fertilizer 1,464 1,389 5,542 5,699 of which Yara-produced fertilizer 1,328 1,260 5,100 5,243 of which Yara-produced industrial products 129 138 570 649
NPK 2,408 2,343 9,925 8,183 of which Yara-produced compounds 1,099 1,089 4,386 4,391 of which Yara-produced blends 1,208 1,210 5,139 3,546
CN 310 278 1,380 1,323 of which fertilizer 203 183 1,002 987 of which Yara-produced fertilizer 197 178 975 971 of which Yara-produced industrial products 97 86 349 309
UAN 233 247 1,332 1,290 of which Yara-produced fertilizer 205 236 1,200 1,196
DAP/MAP 242 103 777 377 MOP/SOP 235 189 989 596 Other products 1,194 1,102 4,533 4,079
of which industrial products 3) 839 882 3,184 3,214
Total sales 8,813 8,301 34,951 32,127
1) 82% ammonia equivalents.2) 46% urea equivalents.3) Including feed phosphates and CO2 as from 2014 reporting (2013 restated).
FERTILIZER VOLUMES BY REGION
Thousand tons 4Q 2014 4Q 2013 2014 2013
Europe 2,267 2,398 9,755 10,199 Latin America 2,667 2,152 9,864 6,900 North America 766 773 3,320 3,265 Asia 477 607 2,011 2,279 Africa 408 215 1,368 1,026 Total 6,585 6,146 26,317 23,668
For a description of the key global fertilizer products, see the Yara Fertilizer Industry Handbook:http://www.yara.com/investor relations/report presentations/index.aspx

6 YARA FOURTH QUARTER 2014
VARIANCE ANALYSIS FULL YEAR
NOK millions 2014
EBITDA 2014 16,407 EBITDA 2013 13,399 Variance EBITDA 3,009
Volume & mix 399 Price/margin 560 Oil & gas costs in Europe 2,314 Special items 299 Other (1,499)Translation NOK vs. USD 1) 936 Total variance explained 3,009
1) Based on quarterly average NOK per USD rates as detailed in Yara 2014 reports.
Full-year EBITDA excluding special items increased by 20%, mainly driv-en by lower gas costs in Europe.
The volume, margin and other variances presented in the Yara variance table include effects generated by performance in equity-accounted in-vestees. Net income from equity-accounted investees decreased by NOK 290 million compared with 2013, mainly driven by lower result in Lifeco and Qafco.
Volume developmentGlobal Yara fertilizer deliveries were 26.3 million tons, up 11% compared with the full year of 2013. This includes the new volumes from Bunge from 8 August 2013, which is the main driver to the increase of NPK blends of 44% and other fertilizers of 60% (mainly phosphates and potash fertilizers). NPK compounds increased 3% while nitrates were down 3%, and urea down 4%. The value of the NPK volume growth more than com-pensated for the reduced deliveries of both nitrates and urea.
Excluding Brazil and OFD, volumes were down 1%, with 11% lower urea deliveries, 2% lower nitrate deliveries and NPK compound deliveries in line with 2013. The company has in 2014 sold its full fertilizer produc-tion capacity, and reductions of deliveries are mainly linked to reduced availability of joint-venture urea. This has partly been compensated by increased sales of third-party products.
Industrial sales volumes were 5% higher compared with 2013, with Air1 sales 31% ahead, and sales of technical urea, nitric acid and ammonia to the process industry up 8%. Feed phosphate and nitrates deliveries were up 2% while stationary NOx abatement products and CO2 sales were slightly below 2013. Technical ammonium nitrate (TAN) sales were down 10% due to unfavorable market conditions.
Yara’s ammonia production decreased 4% compared with full year 2013 mainly for three reasons. A fire in the Tertre plant in mid-January kept the plant out of production for 3 months, while the Lifeco plant in Libya also stopped production in mid-January due to a local militia group block-ade. Lifeco production gradually resumed during second quarter, and the plant produced at less than 50% capacity during second half of 2014. Ma-jor scheduled turnarounds with a longer duration than planned due to
unforeseen repairs also impacted the production volumes negatively. The production losses were partly compensated by increased production in other plants.
Finished fertilizer production increased 1% compared with a year earlier. CN and NPK production increased by 7% and 2%, respectively, mainly due to higher production in the Norwegian plants, but also as a result of the acquired Cartagena plant (OFD) included from fourth quarter. SSP production increased by 23% due to the former Bunge plants in Brazil. Despite the production losses in Tertre, nitrate production was in line with 2013, while urea production was 3% below mainly due to lower pro-duction in Lifeco. UAN production decreased 14% partly to enable more urea and nitrate production. Overall the finished fertilizer production was running well in 2014 with new production records in several plants.
Margin developmentYara’s average European gas and oil cost was 2.25 USD/MMBtu lower compared with 2013 due to lower spot gas prices. The 14% decrease in Yara’s global average oil and gas price reflects decreases in both European spot gas prices and ammonia-linked gas costs outside Europe, partly offset by increased North American gas prices.
Ammonia market prices were 4% higher compared with 2013, while Yara’s average realized urea prices were 5% lower. Realized nitrate prices were 2% lower and NPK compound prices decreased 4%. NPK premium above blend cost was in line with 2013. Blend margins in Brazil were slightly higher than 2013.
Industrial margins generally benefited from increased demand and lower raw material sourcing costs compared with 2013. Process chemical mar-gins increased compared with the previous year due to increased sales to export-based industries in Europe. Air1 margins increased as new heavy-duty trucks sales picked up this year in Europe and in the US accompa-nied by lower logistics costs. Margins for stationary NOx abatement prod-ucts improved as technology sales complemented reagent sales and higher sales of Yara’s SOx-scrubber technology. TAN margins were lower than in 2013 due to lower market demand.
Other ItemsTotal net special items for 2014 were a negative NOK 137 million, pri-marily related to integration and transaction costs in connection with the acquisition of OFD in Latin America, scrapping of production equipment following turnaround and the first-quarter production stop in Libya. Spe-cial items for 2013 were a net negative NOK 435 million. For further de-tails on special items see pages 10 and 11.
The major part of the “Other” variance is related to increased fixed costs, primarily due to the acquisitions of Bunge and OFD and other growth related activities.
The US dollar was on average approximately 7% stronger versus the Nor-wegian krone compared with full-year 2013, resulting in a positive trans-lation effect in Yara’s results.

7YARA FOURTH QUARTER 2014
FINANCIAL ITEMS
NOK millions 4Q 2014 4Q 2013 2014 2013
Interest income from customers 94 65 314 182 Interest income, other 77 42 170 225 Dividends and net gain/(loss) on securities - 7 66 7 Interest income and other financial income 171 113 550 414
Interest expense (223) (226) (756) (724)Net interest expense on net pension liability (19) (26) (69) (87)Net foreign exchange gain/(loss) (351) (252) (698) (949)Other - (14) (84) (92)Interest expense and foreign exchange gain/(loss) (594) (518) (1,606) (1,852)
Net financial income/(expense) (422) (405) (1,056) (1,439)
Fourth-quarter net financial expense was NOK 422 million compared with NOK 405 million previous year. Interest income from customers was NOK 29 million higher than in the same quarter previous year, while other interest income was NOK 35 million higher. Other interest income this quarter includes NOK 51 million interest on tax receivables. Average cash deposits, mostly bank deposits in Norwegian kroner, were NOK 2.7 billion below previous year.
Interest expense was NOK 223 million compared with NOK 226 million previous year. The effect of an average gross debt level this quarter around NOK 3.5 billion higher than previous year was offset by a NOK 50 million reduction in interest on tax provisions.
The net foreign exchange loss this quarter was NOK 351 million compared with NOK 252 million in the same quarter previous year. The losses generated by the US dollar appreciation of 15% against the Norwegian krone and 8% against the Brazilian real were largely balanced by gains on internal currency positions, mainly in euro vs. the Norwegian krone. Yara’s US dollar debt generating currency effects in the income statement was approximately USD 1,500 million at the start of the first quarter 2015, with the exposure mainly towards the Brazilian real and other emerging market currencies.
Full-year net financial expense was NOK 1,056 million compared with NOK 1,439 million previous year. The variance is primarily explained by a net foreign exchange loss this year of NOK 698 million compared with NOK 949 million previous year.
Interest income from customers increased by NOK 132 million compared with previous year, mainly reflecting increased sales in Brazil. Other interest income was NOK 55 million below previous year as the cash deposits were reduced throughout the year.
The financial income this year also includes NOK 66 million from gain on shares in Baltic distribution and trade companies and dividends from non-consolidated investees.
Interest expense was NOK 32 million higher than previous year, reflecting an average gross debt level around NOK 500 million higher and increased funding in high interest currencies like the BRL.
The net foreign exchange loss this year of NOK 698 million includes a NOK 523 million gain related to internal currency positions where offsetting translation effects have been booked directly to equity. The loss on Yara’s USD debt positions totaled NOK 1,027 million as the US dollar appreciated 22% against the Norwegian krone, 12% against the euro and 13% against the Brazilian real. The additional loss of NOK 194 million stems mainly from Yara’s USD exposure towards other emerging market currencies.
TaxFourth-quarter provisions for current and deferred taxes were NOK 503 million, approximately 20% of income before tax.
The average tax rate for 2014 was approximately 21%, in line with tax rate implied in previously published earnings scenarios.

8 YARA FOURTH QUARTER 2014
NET INTEREST-BEARING DEBT
NOK millions 4Q 2014 2014
Net interest-bearing debt at beginning of period (4,963) (3,333)Cash earnings 1) 3,957 12,382 Dividends received from equity-accounted investees 297 1,322 Net operating capital change (1,907) (3,774)OFD Holding (2,909) (2,909)Galvani (1,595) (1,595)Investments (net) (2,584) (7,796)Share buy backs/redemption of shares (193) (441)Yara dividend - (2,771)Foreign exchange gain/(loss) (351) (698)Other (1,561) (2,196)
of which foreign exchange adjustment 2) (1,035) (1,071)
Net interest-bearing debt at end of period (11,808) (11,808)
1) Operating income plus depreciation and amortization, minus tax paid, net gain/(loss) on disposals, net interest expense and bank charges.2) The currency effect included in «Other» is an adjustment from the currency gain/loss in the income statement to the currency impact on net interest bearing debt. The adjustment is mainly explained by applied hedge accounting for net investments in USD, the
translation effect when consolidating net interest bearing debt to the presentation currency NOK and internal currency positions that are not related to net interest bearing debt.
As a supplement to the consolidated statement of cash flows (page 18), this table highlights the key factors behind the development in net interest-bearing debt.
Net interest-bearing debt ended at NOK 11,808 million in the fourth quarter, compared with NOK 4,963 million at the end of third quarter 2014, following the acquisition of OFD (NOK 2,909 million effect on net debt) and Galvani (NOK 1,595 million). Investments, an increase in net operating capital and negative currency effects exceeded cash earnings in the period.
In addition to OFD and Galvani acquisitions, the investment activity for the quarter mainly reflects planned maintenance programs and smaller growth investments, in addition to NOK 262 million funding for the Yara Pilbara Nitrates joint venture TAN plant construction.
Yara received dividends from equity-accounted investees of NOK 297 million in fourth quarter, of which the dividend from GrowHow UK amounted to NOK 285 million. Net operating capital increased by NOK 1,907 million primarily reflecting a seasonal reduction in customer prepayments and higher inventories. Foreign exchange effects include significant currency impact from appreciation of US dollar towards Norwegian krone.
The debt/equity ratio at the end of fourth quarter 2014, calculated as net interest-bearing debt divided by shareholders’ equity plus non-controlling interests, was 0.17 compared with 0.06 at the end of fourth quarter 2013.
Net interest-bearing debt increased by NOK 8,475 million from the end of 2013, as cash earnings were more than consumed by significant investments, including OFD and Galvani, an increase in net operating capital and Yara dividend payment.
Dividend policyYara’s objective is to pay out an average 40-45% of net income in the form of dividends and share buy-backs. Within this objective, a minimum 30% of net income shall be paid in the form of dividends, while share buy-backs make up the balance and are deployed with greater flexibility.
Yara’s Board will propose to the Annual General Meeting a dividend payment of NOK 13 per share for 2014, which represents 47% of net income after non-controlling interests. An above-target dividend is proposed to improve Yara’s capital efficiency.
The Board intends to propose to the Annual General Meeting a new buy-back program along the lines of the existing one.

9YARA FOURTH QUARTER 2014
OutlookThe global farm margin outlook and incentives for fertilizer application remain supportive overall. With attention turning to the need for another record crop in 2015, the cereal price index increased during the fourth quarter ending 3% higher than a quarter ago. Furthermore, the recent strengthening of the US dollar has improved the competiveness of farmers in key producing regions like Europe and Brazil.
Global nitrogen demand remained strong during the fourth quarter and season to date deliveries are higher than the previous season both in Europe and the US. However, following a late 2014 application, a larger than usual share of third quarter US deliveries has already been consumed and market coverage in Europe is considered normal.
Demand for value-added fertilizers like nitrates and compound NPKs remains strong, particularly in cash crop sectors where prices have developed more positively than grains.
A substantial proportion of nitrogen capacity in Ukraine and other key export locations remains curtailed, increasing the need for Chinese urea exports, which reached a record 14 million tons in 2014. Planned capacity additions outside China over the next years are unlikely to fully displace Chinese urea exports, indicating that the latter will be key to global nitrogen pricing also going forward. Given the significant Chinese
curtailments in place today, current export prices for prilled urea fob China (USD 285-290 per ton) are believed to be close to break-even for swing producers. Going forward, global commodity nitrogen prices are therefore likely to be set by the cost of high-quality anthracite coal in China, export tariffs and the RMB-USD exchange rate. The anthracite coal price has so far not been negatively affected by the drop in global oil and gas prices, and the Chinese currency has strengthened in parallel with the US dollar.
A weaker euro and lower gas prices have improved the relative competitiveness of European fertilizer capacity, and Yara enters the first quarter with a strong European order book.
Growth in Latin America remains a key on-going focus area for Yara. The acquisitions of OFD and Galvani were completed during the quarter, providing Yara with significant new production capacity and further growth potential.
Based on current forward markets for oil products and natural gas (3 February) Yara’s first-quarter European energy costs are expected to be NOK 1,300 million lower than a year earlier. Second-quarter 2015 European energy costs are expected to be NOK 700 million lower than a year earlier. The estimates may change considerably depending on future energy prices.
The Board of Directors and Chief Executive OfficerYara International ASAOslo, 10 February 2015
Leif TeksumChairperson
Hilde Merete Aasheim Vice chair
Hilde Bakken Board member
Geir IsaksenBoard member
John ThuestadBoard member
Rune BrattebergBoard member
Guro Mauset Board member
Geir O. SundbøBoard member
Torgeir KvidalPresident and CEO (acting)

10 YARA FOURTH QUARTER 2014
Definitions and variance analysis
The fertilizer season in West Europe referred to in this discussion starts 1 July and ends 30 June.
Several of Yara’s purchase and sales contracts for commodities are, or have embedded terms and conditions which under IFRS are, accounted for as derivatives. The derivative elements of these contracts are presented under “Commodity-based derivatives gain/(loss)” in the condensed consolidated interim statement of income, and are referenced in the variance analysis (see below) as “Special items”.
“Other and eliminations” consists mainly of cross-segment elimina-tions, in addition to Yara’s headquarter costs. Profits on sales from Up-stream to Downstream and Industrial are not recognized in the consoli-dated Yara condensed consolidated interim statement of income before the products are sold to external customers. These internal profits are eliminated in “Other and eliminations”.
Changes in “Other and eliminations” EBITDA therefore usually reflect changes in Upstream-sourced stock (volumes) held by Downstream and Industrial, but can also be affected by changes in Upstream margins on products sold to Downstream and Industrial, as transfer prices move in line with arms-length market prices. With all other variables held constant, higher stocks would result in a higher (negative) elimination effect in Yara’s results, as would higher Upstream margins. Over time these effects tend to even out, to the extent that stock levels and margins normalize.
In the discussion of operating results, Yara refers to certain non-GAAP financial measures including EBITDA and CROGI. Yara’s management makes regular use of these measures to evaluate the performance, both in absolute terms and comparatively from period to period. These mea-sures are viewed by management as providing a better understanding - both for management and for investors – of the underlying operating results of the business segments for the period under evaluation. Yara manages long-term debt and taxes on a group basis. Therefore, net income is discussed only for the Group as a whole.
Yara’s management model, referred to as Value Based Management, reflects management’s focus on cash flow-based performance indicators. EBITDA, which Yara defines as income/(loss) before tax, interest ex-pense, foreign exchange gains/losses, depreciation, amortization and write-downs, is an approximation of cash flow from operating activities before tax and net operating capital changes. EBITDA is a measure that in addition to operating income, also includes interest income, other financial income, and results from equity-accounted investees. It ex-cludes depreciation, write-downs and amortization, as well as impair-ment and amortization of excess values in equity-accounted investees. Yara’s definition of EBITDA may differ from that of other companies.
EBITDA should not be considered as an alternative to operating income and income before tax as an indicator of the company’s operations in ac-cordance with generally accepted accounting principles. Nor is EBITDA an alternative to cash flow from operating activities in accordance with generally accepted accounting principles.
Yara management uses CROGI (Cash Return On Gross Investment) to measure performance. CROGI is defined as gross cash flow, divided by average gross investment and is calculated on a 12-month rolling basis. “Gross cash flow” is defined as EBITDA less total tax expense, exclud-ing tax on net foreign exchange gains/ losses. On Yara level, actual tax expense is used for the calculation while a standardized tax rate of 25% is used on segment level. “Gross Investment” is defined as total assets (exclusive of deferred tax assets, cash and cash equivalents, other liquid assets and fair value adjustment recognized in equity) plus accumulated depreciation and amortization, less all short-term interest-free liabili-ties, except deferred tax liabilities. On segment level, cash and other liq-uid assets are not excluded from “Gross Investment”.
ROCE (Return on capital employed) has been included as an additional performance measure to CROGI to simplify benchmarking with other companies. ROCE is defined as EBIT minus tax divided by average capital employed and is calculated on a 12-month rolling average basis. Capital employed is defined as total assets adjusted for deferred tax assets minus other current liabilities.
In order to track underlying business developments from period to period, Yara’s management also uses a variance analysis methodology, developed within the Company (“Variance Analysis”), that involves the extraction of financial information from the accounting system, as well as statistical and other data from internal management information sys-tems. Management considers the estimates produced by the Variance Analysis, and the identification of trends based on such analysis, suffi-ciently precise to provide useful data to monitor our business. However, these estimates should be understood to be less than an exact quantifica-tion of the changes and trends indicated by such analysis.
The variance analysis presented in Yara quarterly and annual financial reports is prepared on a Yara EBITDA basis including net income from equity-accounted investees. The volume, margin and other variances presented therefore include effects generated by performance in non-consolidated investees.
Yara defines “special items” as material items in the results which are not regarded as part of underlying business performance for the period. These fall into 2 categories, namely “non-recurring items” and “contract derivatives”. “Non-recurring items” comprise restructuring-related items and other gains or losses which are not primarily related to the period in which they are recognized, subject to a minimum value of NOK 20 million per item within a 12-month period. “Contract derivatives” are commodity-based derivatives gains or losses (see above) which are not the result of active exposure or position management by Yara.
Due to it being impractical to obtain financial reports at the same re-porting dates as Yara uses, the results for some of Yara’s equity-account-ed investees are included in Yara results with a one-month time lag.

11YARA FOURTH QUARTER 2014
EBITDA effect Operating income effect
NOK millions 4Q 2014 4Q 2013 2014 2013 4Q 2014 4Q 2013 2014 2013
Bunge intregation costs 26 (142) (26) (180) 26 (142) (26) (180)Partner settlement provision - - (46) - - - (46) - Sale of minority shares Baltic - - 56 - - - - - OFD integration costs (49) - (133) - (49) - (133) -Impairment/scrapping Brazil - (19) - (19) (102) (38) (102) (38)Impairment Australia - - - - (58) - (58) - 2005-2007 sales tax - - - (95) - - (95)Total Downstream (23) (161) (149) (294) (183) (180) (365) (313)
Impairment Pardies plant - - - - (62) - (62) - Industrial contract settlement (62) - (62) - (62) - (62) - Total Industrial (62) - (62) - (123) - (123) -
Lifeco results during shut-down - - (90) - - - - - Write-down Harjavalta - - - - (38) - Pension plan amendment 58 30 58 30 58 30 58 30Scrapping of production equipment (111) - (111) - (111) - (111) - Liquidated damages gas contract in Pilbara 151 - 151 - 151 - 151 - Impairment ammonia customer relationships - - - - (50) - (50) -
Pilbara transaction effects - - - (32) - - - (32)Write-down expansion project - - - - - (36) - (36)Disputed Lifeco utility costs - (138) - (138) - - - - Contract derivatives 85 62 68 294 85 62 68 294 Total Upstream 182 (45) 74 154 133 57 77 256
Corporate penalty and confiscation - (295) - (295) - (295) - (295)Total Other and eliminations - (295) - (295) - (295) - (295)Total Yara 97 (502) (137) (435) (174) (418) (412) (351)
Special items

12 YARA FOURTH QUARTER 2014

13YARA FOURTH QUARTER 2014
NOK millions, except share information Notes 4Q 20144Q 2013
Restated 3) 20142013
Restated 3)
Revenue 25,990 20,469 95,047 84,668 Other income 11 214 35 293 119 Commodity based derivatives gain/(loss) 26 69 2 305 Revenue and other income 26,230 20,573 95,343 85,092
Raw materials, energy costs and freight expenses (19,011) (16,047) (70,557) (64,786)Payroll and related costs (1,936) (1,502) (6,616) (5,454)Depreciation, amortization and impairment loss 10 (1,500) (1,115) (4,678) (3,743)Other operating expenses (1,095) (1,326) (3,186) (3,036)Operating costs and expenses (23,542) (19,990) (85,037) (77,018)
Operating income 2,688 583 10,305 8,074
Share of net income in equity-accounted investees 10 265 (41) 786 1,076 Interest income and other financial income 4 171 113 550 414 Earnings before interest expense and tax (EBIT) 3,124 656 11,642 9,563
Foreign exchange gain/(loss) (351) (252) (698) (949)Interest expense and other financial items (243) (266) (909) (904)Income before tax 2,530 138 10,035 7,711
Income tax expense (503) (31) (2,092) (1,602)Net income 2,028 107 7,944 6,108
Net income attributable toShareholders of the parent 1,860 63 7,625 5,759 Non-controlling interests 167 43 319 350 Net income 2,028 107 7,944 6,108
Earnings per share 1) 6.74 0.23 27.59 20.67Weighted average number of shares outstanding 2) 275,784,079 277,202,214 276,385,013 278,647,345
1) Yara currently has no share-based compensation that results in a dilutive effect on earnings per share.2) Weighted average number of shares outstanding was reduced in the second, third and fourth quarters of 2013 and second, third and fourth quarter of 2014 due to the share buy-back program.3) See note 12 for more information.
Condensed consolidated interim statement of income

14 YARA FOURTH QUARTER 2014
NOK millions Notes 4Q 20144Q 2013
Restated 1) 20142013
Restated 1)
Net income 2,028 107 7,944 6,108
Other comprehensive income that may be reclassified to profit or loss in subsequent periods:
Exchange differences on translation of foreign operations 6,952 660 8,057 4,851 Available-for-sale financial assets - change in fair value 9 (1) (12) 26 Cash flow hedges (20) - (20) - Hedge of net investments (480) (43) (682) (292)Share of other comprehensive income of equity-accounted investees, excluding remeasurements 21 25 52 70
Net other comprehensive income that may be reclassified to profit or loss in subse-quent periods 6,481 641 7,395 4,655
Other comprehensive income that will not be reclassified to profit or loss in subsequent periods:
Remeasurements of the net defined benefit pension liability 8 (455) 213 (1,026) 399 Remeasurements of the net defined benefit pension liability for equity-accounted investees (160) (74) (160) (90)
Net other comprehensive income that will not be reclassified to profit or loss in subsequent periods (615) 139 (1,186) 309
Reclassification adjustments of the period:
- cash flow hedges 3 3 13 15 - fair value adjustments on available-for-sale financial assets disposed of in the year 4 - - (16) - - exchange differences on foreign operations disposed of in the year 7 - 8 - Net reclassification adjustments of the period: 10 3 4 15
Total other comprehensive income, net of tax 5,876 784 6,214 4,979
Total comprehensive income 7,904 891 14,157 11,087
Total comprehensive income attributable to
Shareholders of the parent 7,352 821 13,325 10,572 Non-controlling interests 552 70 832 514 Total 7,904 891 14,157 11,087
1) See note 12 for more information.
Condensed consolidated interim statement of comprehensive income

15YARA FOURTH QUARTER 2014
NOK millionsShare
capital 1)
Premium paid-in capital
Translation of foreign
operations
Available- for-sale financial assets
Cash flow
hedges
Hedge of net
investments
Total other
reservesRetained earnings
Attributable to the
shareholdersof the parent
Non-controlling
interestsTotal
equity
Balance at 31 December 2012 as reported 2013 477 117 (2,805) 5 (255) 169 (2,886) 50,538 48,246 1,745 49,991
Implementation of revised IAS 28, restatement effect - - - - - - - (652) (652) - (652)
Balance at 1 January 2013 restated 4) 477 117 (2,805) 5 (255) 169 (2,886) 49,886 47,594 1,745 49,339
Net income - - - - - - - 5,759 5,759 349 6,108
Other comprehensive income, net of tax - - 4,686 26 15 (292) 4,435 399 4,834 165 4,999 Share of other comprehensive income of equity-accounted investees - - 6 - 63 - 69 (89) (20) - (20)
Total other comprehensive income, net of tax - - 4,692 26 78 (292) 4,504 310 4,814 165 4,979
Long term incentive plan - - - - - - - (5) (5) - (5)Transactions with non-controlling interests - - - - - - - 17 17 (6) 11 Treasury shares (2) - - - - - - (375) (377) - (377)Redeemed shares, Norwegian State 2) (4) - - - - - - (529) (533) - (533)Dividends distributed - - - - - - - (3,647) (3,647) (100) (3,748)Balance at 31 December 2013 restated 4) 471 117 1,887 30 (177) (122) 1,618 51,415 53,621 2,152 55,773
Net income - - - - - - - 7,625 7,625 319 7,944
Other comprehensive income, net of tax - - 7,551 (28) (7) (682) 6,834 (1,026) 5,808 514 6,322 Share of other comprehensive income of equity-accounted investees - - 8 - 39 - 47 (155) (108) - (108)
Total other comprehensive income, net of tax - - 7,558 (28) 32 (682) 6,881 (1,181) 5,700 514 6,214
Long term incentive plan - - - - - - - (2) (2) - (2)Transactions with non-controlling interests - - - - - - - 33 33 1,047 1,080 Treasury shares (1) - - - - - - (229) (230) - (230)Redeemed shares, Norwegian State 3) (1) - - - - - - (210) (211) - (211)Share capital increase in subsidiary, non-controlling interest - - - - - - - - - 180 180
Dividends distributed - - - - - - - (2,771) (2,771) (15) (2,786)Balance at 31 December 2014 468 117 9,445 3 (145) (804) 8,499 54,681 63,765 4,196 67,962
1) Par value 1.70.2) As approved by General Meeting 13 May 2013.3) As approved by General Meeting 5 May 2014.4) See note 12 for more information.
Condensed consolidated interim statement of changes in equity

16 YARA FOURTH QUARTER 2014
NOK millions Notes 31 Dec 201431 Dec 2013
Restated 1)1 Jan 2013Restated 1)
AssetsNon-current assetsDeferred tax assets 2,804 1,984 1,409 Intangible assets 12,008 8,419 7,512 Property, plant and equipment 44,584 34,611 28,594 Equity-accounted investees 9, 11 10,926 9,361 9,069 Other non-current assets 2,737 1,549 1,437Total non-current assets 73,059 55,923 48,022
Current assetsInventories 6 18,639 13,129 12,003 Trade receivables 12,100 9,339 8,086 Prepaid expenses and other current assets 4,196 3,378 2,635 Cash and cash equivalents 3,591 6,824 10,015 Non-current assets classified as held-for-sale 47 8 11 Total current assets 38,573 32,679 32,750
Total assets 3, 5 111,632 88,602 80,772
1) See note 12 for more information.
Condensed consolidated interim statement of financial position

17YARA FOURTH QUARTER 2014
NOK millions, except for number of shares Notes 31 Dec 201431 Dec 2013
Restated 1)1 Jan 2013Restated 1)
Equity and liabilitiesEquityShare capital reduced for treasury stock 468 471 477 Premium paid-in capital 117 117 117 Total paid-in capital 586 588 594
Other reserves 8,499 1,618 (2,886)Retained earnings 54,681 51,415 49,886 Total equity attributable to shareholders of the parent 8 63,765 53,621 47,594
Non-controlling interests 5 4,196 2,152 1,745 Total equity 67,962 55,773 49,339
Non-current liabilitiesEmployee benefits 3,897 2,339 2,427 Deferred tax liabilities 5,767 4,423 4,444 Other long-term liabilities 989 569 659 Long-term provisions 9 725 398 407 Long-term interest-bearing debt 7 10,609 5,833 9,287 Total non-current liabilities 5 21,987 13,562 17,224
Current liabilitiesTrade and other payables 14,628 11,961 9,838 Current tax liabilities 1,060 1,407 1,932 Short-term provisions 348 458 230 Other short-term liabilities 9 843 1,114 686 Bank loans and other interest-bearing short-term debt 4,460 500 520 Current portion of long-term debt 345 3,826 1,004 Total current liabilities 5 21,683 19,266 14,209
Total equity and liabilities 111,632 88,602 80,772
Number of shares outstanding 2) 2 275,497,775 277,050,910 280,567,264
1) See note 12 for more information.2) Weighted average number of shares outstanding was reduced in the second, third and fourth quarters of 2013 and second, third and fourth quarter 2014 due to the share buy-back program.
Condensed consolidated interim statement of financial position
The Board of Directors and Chief Executive OfficerYara International ASAOslo, 10 February 2015
Leif TeksumChairperson
Hilde Merete Aasheim Vice chair
Hilde Bakken Board member
Geir IsaksenBoard member
John ThuestadBoard member
Rune BrattebergBoard member
Guro Mauset Board member
Geir O. SundbøBoard member
Torgeir KvidalPresident and CEO (acting)

18 YARA FOURTH QUARTER 2014
NOK millions Notes 4Q 20144Q 2013
Restated 2) 2014 2013
Restated 2)
Operating activities Operating income 2,688 583 10,305 8,074
Adjustments to reconcile operating income to net cashprovided by operating activitiesDepreciation, amortization and impairment loss 10 1,500 1,115 4,678 3,743 Write-down and reversals, net 36 23 53 5 Tax paid (152) (740) (2,378) (3,881)Dividend from equity-accounted investees 297 26 1,322 1,862 Change in net operating capital 1) (1,943) 1,045 (3,827) 2,187 Other (773) (69) (1,546) 310 Net cash from operating activities 1,654 1,982 8,607 12,300
Investing activitiesPurchases of property, plant and equipment (2,324) (2,021) (7,020) (5,420)Cash outflow on business combinations 4, 5 (1,906) 19 (2,280) (4,319)Purchases of other long-term investments (273) (181) (524) (434)Net sales/(purchases) of short-term investments - - - (1)Proceeds from sales of property, plant and equipment 12 7 26 38 Proceeds from sales of other long-term investments 4 3 408 98 623 Net cash from/(used in) investing activities (4,489) (1,768) (9,700) (9,514)
Financing activitiesLoan proceeds/(repayments), net 7 1,211 (209) 662 (1,286)Purchase of treasury shares 2 (193) (63) (230) (377)Redeemed shares Norwegian State - - (211) (533)Dividend 2 - - (2,771) (3,647)Net cash transfers (to)/from non-controlling interests 180 (13) 163 (100)Net cash from/(used in) financing activities 1,199 (285) (2,387) (5,944)
Foreign currency effects on cash flows 200 5 246 (33)
Net increase (decrease) in cash and cash equivalents (1,436) (66) (3,233) (3,191)Cash and cash equivalents at beginning of period 5,027 6,889 6,824 10,015 Cash and cash equivalents at end of period 3,591 6,824 3,591 6,824
Bank deposits not available for the use of other group companies 463 383
1) Operating capital consists of trade receivable, inventories and trade payable.2) See note 12 for more information.
Condensed consolidated interim statement of cash flows

19YARA FOURTH QUARTER 2014
GENERAL AND ACCOUNTING POLICIESYara (the Group) consists of Yara International ASA (the Company) and its subsidiaries. Yara International ASA is a limited company incorpo-rated in Norway.
The condensed consolidated interim financial statements consist of the Group and the Group’s interests in equity-accounted investees. The consolidated financial statements of the Group as at and for the year ended 31 December 2013 are available upon request from the Com-pany’s registered office at Drammensveien 131, Oslo, Norway or at www.yara.com. These condensed consolidated interim financial state-ments have been prepared in accordance with International Financial Reporting Standard (IFRS) IAS 34 Interim Financial Reporting as ap-proved by EU and additional requirements in the Norwegian Securities Trading Act. They do not include all of the information required for full
annual consolidated financial statements, and should be read in con-junction with consolidated financial statements of the Group as at and for the year ended 31 December 2013. These condensed consolidated interim financial statements are unaudited.
The accounting policies applied by the Group in these condensed con-solidated interim financial statements are mainly the same as those ap-plied by the Group in its consolidated financial statements as at and for the year ended 31 December 2013, except for IFRS 10, 11 and 12 and revised IAS 27 and 28 which Yara implemented 1 January 2014. See note 12 for further information.
As a result of rounding differences numbers or percentages may not add up to the total.
Note 1
Judgments, estimates and assumptions
The preparation of condensed consolidated interim financial statements in accordance with IFRS and applying the chosen accounting policies requires management to make judgments, estimates and assumptions that affect the reported amounts of assets, liabilities, income and ex-penses. The estimates and associated assumptions are based on historical experience and various other factors that are believed to be reasonable under the circumstances. Actual results may differ from these estimates. The estimates and the underlying assumptions are reviewed on an ongo-ing basis. Revisions to accounting estimates are recognized in the period in which the estimate is revised if the revision affects only that period
or in the period of the revision and future periods if the revision affects both current and future periods. When preparing these condensed con-solidated interim financial statements, the significant judgments made by management in applying the Group’s accounting policies and the key sources of estimation uncertainty, were mainly the same as those that applied to the consolidated financial statements as of the period ended 31 December 2013. The implementation of new standards IFRS 10, 11 and the revised IAS 28 has however required management judgments, particularly when distinguishing between joint operations and joint ventures. See note 12 for more information.
Notes to the condensed consolidated interim financial statements
20 YARA FOURTH QUARTER 2014
Note 2
Shares, dividend and share buy-back program
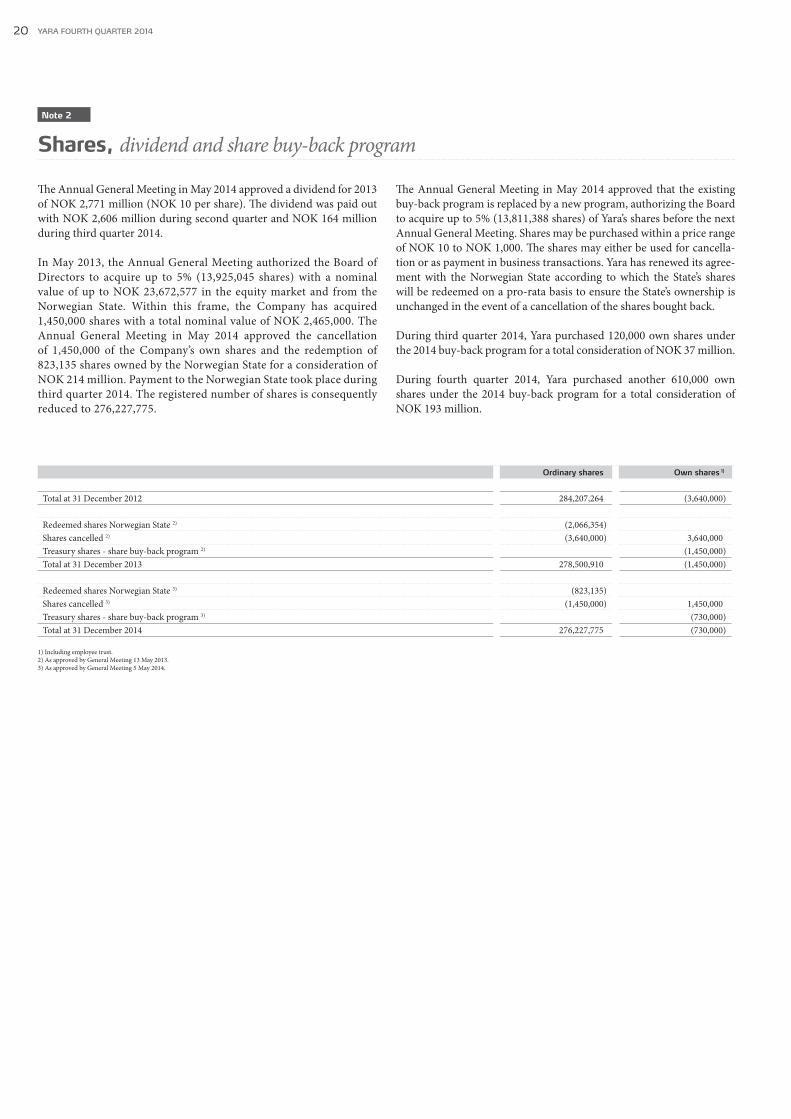
The Annual General Meeting in May 2014 approved a dividend for 2013 of NOK 2,771 million (NOK 10 per share). The dividend was paid out with NOK 2,606 million during second quarter and NOK 164 million during third quarter 2014. In May 2013, the Annual General Meeting authorized the Board of Directors to acquire up to 5% (13,925,045 shares) with a nominal value of up to NOK 23,672,577 in the equity market and from the Norwegian State. Within this frame, the Company has acquired 1,450,000 shares with a total nominal value of NOK 2,465,000. The Annual General Meeting in May 2014 approved the cancellation of 1,450,000 of the Company’s own shares and the redemption of 823,135 shares owned by the Norwegian State for a consideration of NOK 214 million. Payment to the Norwegian State took place during third quarter 2014. The registered number of shares is consequently reduced to 276,227,775.
The Annual General Meeting in May 2014 approved that the existing buy-back program is replaced by a new program, authorizing the Board to acquire up to 5% (13,811,388 shares) of Yara’s shares before the next Annual General Meeting. Shares may be purchased within a price range of NOK 10 to NOK 1,000. The shares may either be used for cancella-tion or as payment in business transactions. Yara has renewed its agree-ment with the Norwegian State according to which the State’s shares will be redeemed on a pro-rata basis to ensure the State’s ownership is unchanged in the event of a cancellation of the shares bought back. During third quarter 2014, Yara purchased 120,000 own shares under the 2014 buy-back program for a total consideration of NOK 37 million.
During fourth quarter 2014, Yara purchased another 610,000 own shares under the 2014 buy-back program for a total consideration of NOK 193 million.
Ordinary shares Own shares 1)
Total at 31 December 2012 284,207,264 (3,640,000)
Redeemed shares Norwegian State 2) (2,066,354)Shares cancelled 2) (3,640,000) 3,640,000 Treasury shares - share buy-back program 2) (1,450,000)Total at 31 December 2013 278,500,910 (1,450,000)
Redeemed shares Norwegian State 3) (823,135)Shares cancelled 3) (1,450,000) 1,450,000 Treasury shares - share buy-back program 3) (730,000)Total at 31 December 2014 276,227,775 (730,000)
1) Including employee trust. 2) As approved by General Meeting 13 May 2013.3) As approved by General Meeting 5 May 2014.

21YARA FOURTH QUARTER 2014
Note 3
Operating segment information
NOK millions 4Q 20144Q 2013
Restated 3) 20142013
Restated 3)
External revenue and other incomeDownstream 19,140 15,098 71,494 62,268 Industrial 4,234 3,502 14,928 13,693 Upstream 2,846 1,943 8,874 9,008 Other and eliminations 11 30 46 123 Total 26,230 20,573 95,343 85,092
Internal revenue and other income Downstream 509 371 1,724 1,592 Industrial 59 42 164 170 Upstream 8,978 7,012 31,976 30,487 Other and eliminations (9,546) (7,425) (33,864) (32,249)Total - - - -
Revenue and other incomeDownstream 19,649 15,468 73,219 63,860 Industrial 4,293 3,545 15,092 13,864 Upstream 11,824 8,955 40,850 39,495 Other and eliminations (9,535) (7,395) (33,819) (32,127)Total 26,230 20,573 95,343 85,092
Operating incomeDownstream 649 427 4,488 3,078 Industrial 75 199 973 841 Upstream 2,253 169 5,856 4,135 Other and eliminations (290) (212) (1,011) 20 Total 2,688 583 10,305 8,074
EBITDADownstream 1,211 718 5,991 4,013 Industrial 235 306 1,385 1,144 Upstream 3,434 1,002 9,871 8,004 Other and eliminations (254) (168) (840) 238 Total 4,625 1,858 16,407 13,399
Investments 1)
Downstream 2,004 418 3,143 3,515 Industrial 179 177 766 321 Upstream 6,111 1,501 9,326 3,941 Other and eliminations 32 60 176 206 Total 8,326 2,156 13,411 7,984 Total Assets 2)
Downstream 37,551 26,884 Industrial 6,860 5,125 Upstream 64,897 49,479 Other and eliminations 2,323 7,113 Total 111,632 88,602
1) Investments in property, plant and equipment, intangible assets, equity-accounted investees and other equity investments. 2) Assets exclude internal cash accounts and accounts receivables related to group relief. 3) See note 12 for more information.

22 YARA FOURTH QUARTER 2014
NOK millions, except percentages 4Q 20144Q 2013
Restated 3) 20142013
Restated 3)
CROGI (12-month rolling average)Yara 1) 13.3% 12.6%Downstream 18.1% 14.5%Industrial 16.9% 15.4%Upstream 11.5% 10.8%
ROCE (12-month rolling average)Yara 13.3% 12.6%Downstream 18.5% 15.2%Industrial 20.2% 19.5%Upstream 10.8% 9.7%
Reconciliation of EBITDA to Income before taxEBITDA 4,625 1,858 16,407 13,399 Depreciation, amortization and impairment loss 2) (1,501) (1,202) (4,766) (3,836)Foreign exchange gain/(loss) (351) (252) (698) (949)Interest expense and other financial items (243) (266) (909) (904)Income before tax 2,530 138 10,035 7,711
RECONCILIATION OF OPERATING INCOME TO EBITDA
NOK millions Operating incomeEquity-accounted
investees
Interest incomeand other
financial income EBIT
Depreciation, amortization and impairment loss 1) EBITDA
4Q 2014
Downstream 649 (8) 150 791 420 1,211 Industrial 75 27 3 105 130 235 Upstream 2,253 246 10 2,508 925 3,434 Other and eliminations (290) - 9 (281) 27 (254)Total 2,688 265 171 3,124 1,501 4,625
4Q 2013 2)
Downstream 427 (1) 85 511 208 718 Industrial 199 25 4 228 78 306 Upstream 169 (64) 2 107 895 1,002 Other and eliminations (212) - 22 (190) 21 (168)Total 583 (41) 113 656 1,202 1,858
2014Downstream 4,488 53 457 4,998 993 5,991 Industrial 973 96 8 1,076 309 1,385 Upstream 5,856 638 16 6,510 3,361 9,871 Other and eliminations (1,011) - 69 (942) 102 (840)Total 10,305 786 550 11,642 4,766 16,407
2013 2)
Downstream 3,078 40 259 3,376 637 4,013 Industrial 841 83 5 929 215 1,144 Upstream 4,135 954 7 5,096 2,908 8,004 Other and eliminations 20 - 143 162 76 238 Total 8,074 1,076 414 9,563 3,836 13,399
1) Including amortization of excess value in equity-accounted investees.2) See note 12 for more information

23YARA FOURTH QUARTER 2014
Note 4
Business initiatives
ACQUISITIONSOn 1 December 2014, Yara acquired a 60% stake in Galvani Indústria, Comércio e Serviços S/A (Galvani), for an enterprise value of USD 318 million. Galvani is an independent, privately held fertilizer company. The company is engaged in phosphate mining, Single Super Phosphate (SSP) production (approximately 1 million tons per annum) and distribution of fertilizers in the center and northeast of Brazil. Galvani also owns licenses for two greenfield phosphate mine projects in Brazil. The primary reason for the Galvani acquisition is to secure phosphate fertilizer capacity in the center of Brazil. Furthermore, Galvani brings industry competence with cost-effective solutions for mining, production, blending and warehous-ing facilities. The unit is included in the Upstream segment. More detailed information can be found in note 5.
On 1 October 2014, Yara closed the acquisition of OFD Holding Inc (OFD) with an enterprise value of USD 423 million. OFD owns and operates a fertilizer production facility in Cartagena with an annual ca-pacity of approximately 320 kilotons (kt) compound NPK, 100 kt cal-cium nitrate (CN) and 70 kt ammonium nitrate (AN), with integrated ammonia production. OFD also controls approximately 700 kt of NPK blending capacity across 12 sites and 100 kt liquid fertilizer capacity as part of its fertilizer distribution network across Colombia, Mexico, Peru, Bolivia, Costa Rica and Panama. The primary reason for the OFD acquisition is further development in Latin America, creating value for Yara’s shareholders and contributing to agricultural, industrial and min-ing sector growth in the region. The units are consolidated into Yara’s financial statements in fourth quarter, and are included in the Down-stream segment. More detailed information can be found in note 5.
In third quarter 2014, Yara acquired the flue gas cleaning division of Strabag SE after approval by all relevant regulatory bodies. The consideration was EUR 2 million. The assets are included in the company Yara Environmental Technologies GmbH, Austria, which is included in the Industrial segment.
During second quarter 2014, Yara acquired the Borealis’ 52.15% stake in Le Havre urea plant, situated on the northwest coast of France. Yara held 47.85% prior to the acquisition. The production facilities produce 320,000 metric tons urea and 400,000 metric tons ammonia per annum. The consideration was EUR 4 million. The Le Havre urea plant is included in the Upstream segment.
Yara acquired a majority 63.33% stake in Green Tech Marine (GTM), a sulphur oxide (SOx) scrubber supplier to the marine industry during second quarter 2014. Yara paid NOK 47.5 million for the shares. In ad-dition, there is an earn-out arrangement with a minimum amount of NOK 10 million. The company is included in the Industrial segment.
Yara acquired the Kynoch business in the Cape regions of South Africa on 1 March 2014. The business represents 140 kilotons of fertilizer sales, with a differentiated product portfolio offering crop nutrition solutions. The consideration was USD 31 million, and the unit is included in the Downstream segment.
On 29 January 2014, Yara acquired H+H Umwelt- und Industrietechnik GmbH. H+H specializes in Selective Catalytic Reduction (SCR) systems
for NOx abatement in ships and power plants. The company provides SCR systems to the shipping and industrial markets, with over 1,200 installed SCR units around the world. The consideration was EUR 15.4 million and the company is included in the Industrial segment.
Yara acquired the German water sensor company ZIM Plant Technol-ogy GmbH on 2 January 2014. The company has developed technology to monitor the water status of the crop. The consideration was EUR 3.5 million and the company is included in the Downstream segment.
Yara has consolidated the above mentioned acquisitions in 2014. See note 5 for further information.
OTHER BUSINESS INITIATIVES On 5 December 2014, the Board of Yara International ASA approved an investment of SEK 1,747 million (USD 220 million) to sustain and increase technical ammonium nitrate (TAN) capacity in the Köping site in Sweden. The investment includes the construction of a new nitric acid plant replacing an existing plant which is approaching the end of its operating life. The total TAN capacity after the upgrade will reach about 450 kt per annum. Construction will start in 2015, with completion ex-pected in second half 2017.
On 21 October 2014, the Board of Yara International ASA approved an investment of approximately NOK 2,250 million to expand annual NPK and Calcium Nitrate capacity by 50,000 tons and 200,000 tons respec-tively in Porsgrunn, Norway. The project is expected to be completed during first quarter 2017.
On 23 September 2014, Yara announced that it was in early-stage dis-cussions with CF Industries regarding a potential merger. It later be-came clear that the parties would not be able to agree on terms that would be acceptable to all stakeholders, and Yara announced on 17 Oc-tober 2014 that the discussions had been terminated.
On 17 July 2014, the Board of Yara International ASA approved an in-vestment of approximately EUR 50 million to expand annual NPK pro-duction capacity by 250 kilotons in Uusikaupunki, Finland. The project shall be completed by the end of 2015.
In May 2014, it was announced that BASF and Yara have made good progress with their plan to jointly build a world-scale ammonia plant on the U.S. Gulf Coast. The proposed plant would be located at the existing BASF site in Freeport, Texas, having an annual capacity of 750,000 metric tons, and be based on a hydrogen-synthesis process. Further details of the planned joint venture are currently under discussion between the parties.
DISPOSALSDuring second quarter 2014, Yara sold a 10% stake in three distribution and trading companies in the Baltic region for EUR 10 million. The transaction resulted in a gain of NOK 56 million recognized within “Interest income and other financial income” in Downstream segment. Fair value adjust-ments of NOK 16 million were recognized in other comprehensive income before the sale. The net effect on equity was therefore NOK 40 million.
24 YARA FOURTH QUARTER 2014
Note 5
Business combinations
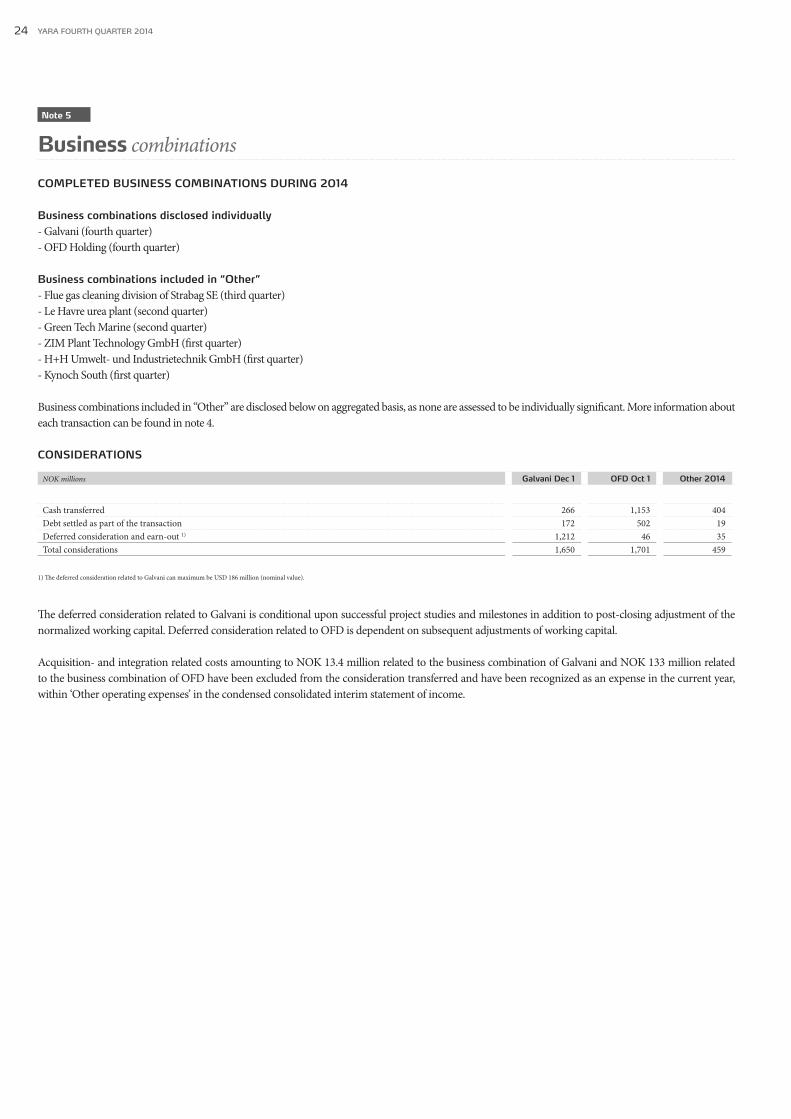
COMPLETED BUSINESS COMBINATIONS DURING 2014
Business combinations disclosed individually- Galvani (fourth quarter) - OFD Holding (fourth quarter)
Business combinations included in “Other” - Flue gas cleaning division of Strabag SE (third quarter) - Le Havre urea plant (second quarter) - Green Tech Marine (second quarter) - ZIM Plant Technology GmbH (first quarter) - H+H Umwelt- und Industrietechnik GmbH (first quarter) - Kynoch South (first quarter) Business combinations included in “Other” are disclosed below on aggregated basis, as none are assessed to be individually significant. More information about each transaction can be found in note 4. CONSIDERATIONS
NOK millions Galvani Dec 1 OFD Oct 1 Other 2014
Cash transferred 266 1,153 404Debt settled as part of the transaction 172 502 19Deferred consideration and earn-out 1) 1,212 46 35Total considerations 1,650 1,701 459
1) The deferred consideration related to Galvani can maximum be USD 186 million (nominal value).
The deferred consideration related to Galvani is conditional upon successful project studies and milestones in addition to post-closing adjustment of the normalized working capital. Deferred consideration related to OFD is dependent on subsequent adjustments of working capital. Acquisition- and integration related costs amounting to NOK 13.4 million related to the business combination of Galvani and NOK 133 million related to the business combination of OFD have been excluded from the consideration transferred and have been recognized as an expense in the current year, within ‘Other operating expenses’ in the condensed consolidated interim statement of income.

25YARA FOURTH QUARTER 2014
IDENTIFIABLE ASSETS ACQUIRED AND LIABILITIES RECOGNIZED AT THE DATE OF ACQUISITIONS (FAIR VALUE)
NOK millions Galvani Dec 1 OFD Oct 1 Other 2014
AssetsDeferred tax asset 55 54 1Exploration and evaluation assets, part of intangible assets 1,010 - - Trademarks, part of intangible assets 44 39 - Patents and technologies, part of intangible assets - - 43 Customer relationships, part of intangible assets 115 113 104 Other, part of intangible assets 12 - - Property, plant and equipment 1,352 1,181 66 Mineral rights, part of property, plant and equipment 456 - - Equity-accounted investees - 42 1 Other non-current assets 276 12 - Inventories 527 995 107Trade receivables 409 964 44 Prepaid expenses and other current assets 94 210 26 Cash and cash equivalents 27 162 28Total assets 4,376 3,773 420
LiabilitiesLong-term provisions 91 12 14 Deferred tax liabilities 620 144 39 Long-term interest-bearing debt 114 263 - Other long-term liabilities - 16 - Trade and other payables 650 507 86 Current tax liabilities - 2 1 Bank loans and other interest-bearing short-term debt 897 1,153 8Other short-term liabilities - 34 9 Total liabilities 2,372 2,130 157
Total identifiable net assets at fair value 2,004 1,643 264
The receivables (trade receivables and other non-current assets) acquired in the business combination of Galvani have a gross contractual amount of NOK 718 million compared to a fair value of NOK 685 million. The receivables acquired in the business combination of OFD have a gross contractual amount of NOK 1,047 million compared to a fair value of NOK 964 million. The fair value of the receivables is equal to the cash flow expected to be collected. For the other business combinations the gross contractual amount is equal to the fair value. The initial accounting for the acquisitions has only been provisionally determined at the end of the reporting period and will be subject to changes until the purchase price allocation has been concluded.
NON-CONTROLLING INTERESTS
NOK millions Galvani Dec 1 OFD Oct 1 Other 2014
Non-controlling interest 1) 40 % 5.2%Non-controlling interest’s share the fair value of identifiable assets and liabilities 985 66 30
1) The non-controlling interest in “Other” is mainly related to the 36.67% non-controlling interest in Green Tech Marine.
Yara has used the option to recognize the non-controlling interest in Galvani and OFD based on fair value. GOODWILL ARISING ON ACQUISITIONS
NOK millions Galvani Dec 1 OFD Oct 1 Other 2014
Cash transferred, deferred consideration and earn-out 1,478 1,200 440 Debt settled as part of the transaction 172 502 19 Non-controlling interest 985 66 30 Fair value of net identifiable assets acquired (2,004) (1,643) (264)Goodwill arising on acquisition 632 124 225

26 YARA FOURTH QUARTER 2014
The goodwill arising from the Galvani acquisition reflects plans for increased upgrading capacity for phosphate fertilizer, the value on assembled workforce and Yara specific synergies from balancing its Upstream and Downstream positions in Brazil. The goodwill arising from the OFD acquisition reflects syner-gies through increased presence and growth in Latin America. None of the goodwill arising on the acquisitions is deductible for tax purposes.
Total goodwill has increased with NOK 1,661 million through the year to a carrying amount of NOK 6,894 million at year-end 2014. The change is ex-plained by new business combinations in 2014 with a total goodwill of NOK 981 million (as explained above), a reduction due to impairment of NOK 58 million (see note 10) and the remaining being explained by currency translation gain on foreign investments.
NET CASH OUTFLOW ON BUSINESS COMBINATIONS
NOK millions Galvani Dec 1 OFD Oct 1 Other 2014
Consideration paid in cash at date of acquisition 266 1,153 380 Deferred consideration paid in cash - - 25 Debt settled as part of the transaction 172 502 -Cash and cash equivalent balances acquired (27) (162) (30)Net cash outflow on business combinations 412 1,493 375
Net cash outflow is presented as a part of “investing activities” in the condensed consolidated interim statement of cash flows.
IMPACT OF THE ACQUISITIONS ON THE TOTAL ASSETS OF THE GROUP
NOK millions Galvani Dec 1 OFD Oct 1 Other 2014
Consolidated identifiable assets 4,376 3,773 420Goodwill arising on the acquisition 632 124 225Consideration paid for shares and debt settled as part of the transaction (438) (1,655) (380)Total impact on the total assets of the group 4,569 2,242 266
IMPACT OF ACQUISITIONS ON THE RESULTS OF THE GROUP
NOK millions Galvani Dec 1 OFD Oct 1 Other 2014
Included in year-to-date consolidated figuresRevenues 47 1,109 650Net income before tax and non-controlling interests (loss) (36) (114) (60)
PRO FORMA FIGURES
NOK millions Galvani Dec 1 OFD Oct 1 Other 2014
Yara has reported a consolidated income before tax of NOK 10,035 million. If the combinations had individually taken place at the beginning of the year, Yara’s pro-forma year-to-date consolidated income before tax would have been 1)
9,822 10,091 10,029
1) The pro forma figures are preliminary determined.
In determining the pro forma net income before tax the following adjustments have been made:
• calculated depreciation of tangible and intangible assets acquired on the basis of fair values arising in the initial accounting for the business combination rather than the carrying amounts recognized in the pre-acquisition financial statements.• calculated reduced interest income on funds used for acquiring the shares.• calculated reduced interest expense on debt settled as part of the transaction.• calculated interest expense on deferred consideration related to Galvani.

27YARA FOURTH QUARTER 2014
Note 6
Inventory
NOK millions 31 Dec 2014 31 Dec 2013
Finished goods 10,085 7,164 Work in progress 707 633 Raw materials 7,847 5,332 Total 18,639 13,129
Write-downBalance at 1 January (103) (96)Reversal/(write-down), net 18 2 Foreign currency translation (7) (9)Closing balance (92) (103)
Note 7
Long-term debt
An updated overview of the contractual payments on long-term debt is provided in the table below:
NOK millions Debentures Bank LoansCapital lease and
other long-term loans Total
2016 1,033 244 786 2,0632017 0 201 55 2572018 0 154 44 1982019 5,872 127 41 6,040Thereafter 1,293 460 299 2,052Total 8,198 1,186 1,226 10,609
Yara International ASA repaid USD 500 million of its bond debt upon maturity in December. Also in December, Yara International ASA issued new NOK denominated bonds totaling NOK 3,500 million, whereof NOK 2,200 million matures in 2019, NOK 700 million matures in 2021 and NOK 600 million matures in 2024. The 2021 and 2024 bonds were issued at fixed rates, but have been converted to floating rate using interest rate deriva-tives. The 2019 bonds were issued at floating interest rate.
In January 2015, Yara International ASA signed a new USD 500 million term loan facility with maturity in 2017.
Note 8
Employee benefitsBy the end of fourth quarter, the defined benefit obligations have been remeasured following full actuarial valuations of all defined benefit plans, using revised financial and demographic assumptions. Plan asset values have also been remeasured to reflect market value at the end of the quarter.
Net remeasurement loss of the quarter is recognized as an increase in net defined benefit liability of NOK 603 million (before tax) and a decrease of the carrying value of equity-accounted investees of NOK 160 million (after tax), with a negative effect in other comprehensive income of NOK 615 million (after tax).
Net remeasurement loss of the year is NOK 1,345 million (before tax) on the net defined benefit liability and a decrease of the carrying value of equity-accounted investees of NOK 160 million (after tax), with a negative effect in other comprehensive income of NOK 1,186 million (after tax).
The remeasurement loss reflects the substantial decline in yield on high quality corporate bonds in Europe during 2014. Yield on high quality corporate bonds is used as reference to determine the discount rate, which is used for calculating the present value of future pension benefit payments. The remeasurement loss from changes in financial assumptions is partly offset by actual return on plan assets in excess of what has been recognized in Statement of income during the year.

28 YARA FOURTH QUARTER 2014
Note 9
Provisions and contingencies
Yara is party to a number of lawsuits, environmental laws and regula-tions in various jurisdictions arising out of the conduct of its business. There are no significant changes to the provisions disclosed in the an-nual report 2013. Unrecognized contingent assets related to external insurance claims have however increased, mainly following the Tertre Ammonia fire in January 2014. Yara has recovered NOK 42 million
which is recognized in the statement of income in the third and fourth quarter and Yara estimates a further recovery of around NOK 200 mil-lion for incidents in 2013 and 2014. This amount may change, and Yara will not recognize any receivables until the claims are virtually certain. If confirmed, Yara expects that majority will be recognized in the state-ment of income.
Note 10
Impairment write-down
During the fourth quarter, Yara has performed mandatory impairment testing of all cash generating units with recognized goodwill or recog-nized assets with indefinite useful life. Plants and other assets that dis-played impairment indicators were also tested. Yara made impairment write-down of property, plant and equipment of NOK 170 million in the fourth quarter, of which NOK 102 million is related to blending units in Brazil (Downstream) and NOK 62 million is related to the Pardies plant in France (Industrial). The impairment in Brazil was triggered by a deci-sion to optimize volumes towards more efficient sites, while the Pardies impairment reflects lower TAN profitability. Yara also recognized impair-ment write-down of goodwill in Australia of NOK 58 million (Down-stream), reflecting lower than expected returns from its liquid fertilizer business, and NOK 50 million of customer relationships related to am-monia trade in Switzerland (Upstream).
During the third quarter 2014, Yara made an impairment write-down of the associate IC Potash (Upstream), a listed company in Canada, of NOK 85 million. The write-down was presented within “Share of net income in equity-accounted investees” in the statement of income. The main reason for the revised value was a lower estimated probability of realizing the underlying SOP (Sulphate of Potash) mining project in New Mexico. Also in third quarter, Yara initiated an employee consul-tation process in Harjavalta and recognized a write-down of property, plant and equipment of NOK 38 million (Upstream). The consultation was concluded in January 2015 and it was announced that fertilizer pro-duction in Harjavalta will stop at the end of first quarter 2015.
Note 11
Other income
During fourth quarter, Yara recognized a positive effect of NOK 150 million from liquidated damages related to a gas contract in Pilbara (Upstream), presented as part of “other income” in the statement of income.

29YARA FOURTH QUARTER 2014
Note 12
Restatement effects
Effective 1 January 2014, Yara adopted the new standards IFRS 10, 11, 12 and revised IAS 27 and 28 with retrospective application.
IMPACT OF IMPLEMENTATION OF IFRS 10 CONSOLIDATED FINANCIAL STATEMENTS AND REVISED IAS 27 SEPARATE FINANCIAL STATEMENTSThe Group adopted IFRS 10 in the current year. IFRS 10 changes the definition of control and Yara has assessed whether or not the Group has control over some of the associates or joint ventures (under the pre-viously existing IAS 28 and the old IAS 31). At the date of initial appli-cation of IFRS 10, the Group assessed that it did not control any of the equity-accounted investees.
IMPACT OF IMPLEMENTATION OF IFRS 11 JOINT ARRANGEMENTSIFRS 11 replaces IAS 31 Interests in Joint Ventures. IFRS 11 deals with how a joint arrangement of which two or more parties have joint control should be classified and accounted for. The classification should be joint operation or joint venture. Investments in joint ventures are accounted for using the equity method and joint operations are accounted for by each joint operator accounting for its share of assets, liabilities, revenues and expenses. Yara’s management assessed the classification of the Group’s investments in joint arrangements in accordance with IFRS 11. Manage-ment concluded that two joint arrangements should be classified as joint operations and thus changing the accounting from equity method to the Group’s share of assets, liabilities, revenues and expenses. The companies
are Trinidad Nitrogen Company Ltd., where Yara owns 49%, and Yara Pil-bara Nitrates, where Yara consolidates 55% (owned directly 35% by Yara and 20% through Yara Pilbara Holding, where Yara has an ownership of 51%). The main reason why Tringen is classified as a joint operation is that Yara buys all products produced by the plant. Yara Pilbara Nitrates is classified as a joint operation as the products produced by the plant will be sold solely to the parties of the joint operation.
IMPACT OF IMPLEMENTATION OF IFRS 12 DISCLOSURE OF INTERESTS IN OTHER ENTITIESMore extensive disclosure is required by IFRS 12 for entities having in-terests in subsidiaries, joint arrangements and associates. These require-ments are not included in the interim consolidated financial statements, but will be assessed for the annual report 2014.
IMPACT OF IMPLEMENTATION OF REVISED IAS 28 INVESTMENTS IN ASSOCIATES AND JOINT VENTURESYara sold 16% in Yara Praxair Holding AS in 2011 and joint control ceased over this entity. This transaction gave a remeasurement gain of remaining 34% ownership in the associate of NOK 661 million. Under the revised IAS 28, remeasurement of remaining ownership is not re-quired. The effect has been restated. The restatement reduces the carry-ing value of the investment and Yara’s equity. Also, the restatement gave a NOK 7 million positive impact on operating income due to reversal of amortization of excess values.

30 YARA FOURTH QUARTER 2014
1 JANUARY 2013 - IMPLEMENTATION EFFECTS
1 Jan 2013 IFRS 11 IAS 28 1 Jan 2013
NOK millions As reported Derecognized Recognized Change Restated
AssetsNon-current assetsDeferred tax assets 1,376 - 37 (4) 1,409 Intangible assets 7,512 - - - 7,512 Property, plant and equipment 27,893 - 701 - 28,594 Equity-accounted investees 10,501 (784) - (648) 9,069 Other non-current assets 1,437 - - - 1,437 Total non-current assets 48,719 (784) 738 (652) 48,022
Current assetsInventories 11,927 - 76 - 12,003 Trade receivables 8,045 - 41 - 8,086 Prepaid expenses and other current assets 2,607 - 28 - 2,635 Cash and cash equivalents 9,941 - 74 - 10,015 Non-current assets classified as held-for-sale 11 - - - 11 Total current assets 32,530 - 220 - 32,750
Total assets 81,249 (784) 957 (652) 80,772
Equity and liabilitiesEquityShare capital reduced for treasury stock 477 - - - 477 Premium paid-in capital 117 - - - 117 Total paid-in capital 594 - - - 594
Other reserves (2,886) - - - (2,886)Retained earnings 50,538 (784) 784 (652) 49,886Total equity attributable to shareholders of the parent 48,246 (784) 784 (652) 47,594
Non-controlling interests 1,745 - - - 1,745 Total equity 49,991 (784) 784 (652) 49,339
Non-current liabilitiesEmployee benefits 2,350 - 78 - 2,427 Deferred tax liabilities 4,442 - 1 - 4,444 Other long-term liabilities 658 - - - 659 Long-term provisions 407 - - - 407 Long-term interest-bearing debt 9,287 - - - 9,287 Total non-current liabilities 17,144 - 80 - 17,224
Current liabilitiesTrade and other payables 9,665 - 172 - 9,838 Current tax liabilities 1,932 - - - 1,932 Short-term provisions 230 - - - 230 Other short-term liabilities 680 - 6 - 686 Bank loans and other interest-bearing short-term debt 604 - (84) - 520 Current portion of long-term debt 1,004 - - - 1,004 Total current liabilities 14,115 - 94 - 14,209
Total equity and liabilities 81,249 (784) 957 (652) 80,772

31YARA FOURTH QUARTER 2014
2013 - IFRS 11 AND IAS 28 RESTATEMENTS
4Q 2013 2013
NOK millions, except percentages and per share informationAs
reported
Restate-ment
effects RestatedAs
reported
Restate-ment
effects Restated
YARACondensed consolidated statement of incomeRevenue and other income 20,566 7 20,573 85,052 40 85,092 Operating income 544 39 583 7,791 283 8,074 Share of net income equity-accounted investees (18) (23) (41) 1,250 (174) 1,076 Income taxes (19) (11) (31) (1,506) (97) (1,602)Net Income 102 5 107 6,097 11 6,108 Earnings per share 0.21 0.02 0.23 20.63 0.04 20.67
Condensed consolidated statement of comprehensive incomeExchange differences on translation of foreign operations 665 (5) 660 4,856 (5) 4,851 Remeasurements of the net defined benefit pension liability 224 (10) 213 409 (10) 399 Remeasurements of the net defined benefit pension liability for equity-accounted investees
(85) 10 (74) (101) 10 (90)
Total other comprehensive income, net of tax 789 (5) 784 4,984 (5) 4,979 Total comprehensive income 891 - 891 11,081 6 11,087 Total comprehensive income attributable to: Shareholders of the parent" 820 1 821 10,567 6 10,572
Condensed consolidated statement of financial positionTotal non-current assets 56,459 (536) 55,923 Total current assets 32,521 158 32,679
Total equity 56,419 (646) 55,773 Total non-current liabilities 13,444 119 13,562 Total current liabilities 19,118 149 19,266
Condensed consolidated statement of cash flowsNet cash from operating activities 1,941 41 1,982 12,174 126 12,300 Net cash from/ (used in ) investing activities (1,630) (137) (1,768) (9,259) (254) (9,514)Net cash from/ (used in ) financing activities (355) 70 (285) (5,989) 45 (5,944)Foreign currency effects on cash flows 5 1 5 (48) 14 (33)
Net increase (decrease) in cash and cash equivalents (41) (25) (66) (3,122) (69) (3,191)Cash and cash equivalents at beginning of period 6,859 31 6,889 9,941 75 10,015 Cash and cash equivalents at end of period 6,819 5 6,824 6,819 5 6,824
Other key figuresEBITDA 1,835 24 1,858 13,266 133 13,399 CROGI - - - 12.6% 12.6%ROCE - - - 12.4% 12.6%

32 YARA FOURTH QUARTER 2014
2013 - SEGMENT RESTATEMENTS
The restatement following the new and revised standards presented above impacted the Upstream and Industrial segments. In addition, Yara made changes to the segment structure effective from 1 January 2014. Comparative figures for 2013 are restated. The change in reporting structure is related to:
- Transfer of business unit Feed Phosphates from Upstream to Industrial- Transfer of unit Yara Pilbara Nitrates, which is currently constructing a TAN plant in Australia, from Industrial to Upstream.
The table below provides the restatement effects on segment level, both for the change in accounting standards and for the change in segment structure.
4Q 2013 2013
NOK millions, except percentagesAs
reported
Effects of new and
revised standards
Effects of change in segment structure Restated
As reported
Effects of new and
revised standards
Effects of change in segment structure Restated
Upstream segmentRevenue and other income 9,208 7 (260) 8,955 40,267 40 (812) 39,495 Operating income 153 39 (24) 169 3,886 283 (34) 4,135 EBITDA 1,002 24 (24) 1,002 7,919 133 (48) 8,004 Total Assets 1) - - - - 48,246 262 971 49,479 CROGI 11.0% 10.8%ROCE 9.8% 9.7%
Industrial segmentRevenue and other income 3,138 - 407 3,545 12,397 - 1,466 13,864 Operating income 175 - 24 199 807 - 34 841 EBITDA 282 - 24 306 1,096 - 48 1,144 Total Assets 1) - - - - 6,692 (640) (926) 5,125 CROGI 12.2% 15.4%ROCE 13.7% 19.5%
Other and eliminationsRevenue and other income (7,249) - (147) (7,395) (31,472) - (655) (32,127)Total Assets 1) - - - - 7,159 - (45) 7,113
1) Assets exclude internal cash accounts and accounts receivables related to group relief.
Note 13
Post balance sheet eventsYara Board will propose to the Annual General Meeting a dividend of NOK 13 per share for 2014.
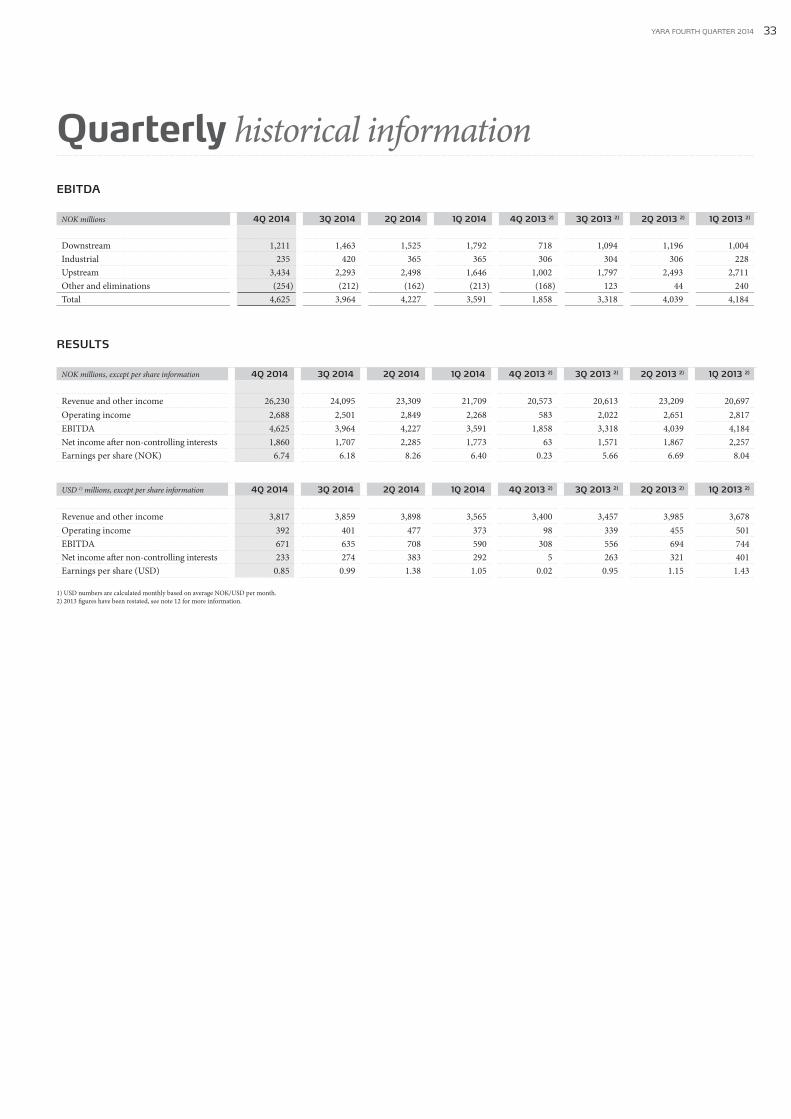
33YARA FOURTH QUARTER 2014
Quarterly historical information
EBITDA
NOK millions 4Q 2014 3Q 2014 2Q 2014 1Q 2014 4Q 2013 2) 3Q 2013 2) 2Q 2013 2) 1Q 2013 2)
Downstream 1,211 1,463 1,525 1,792 718 1,094 1,196 1,004Industrial 235 420 365 365 306 304 306 228Upstream 3,434 2,293 2,498 1,646 1,002 1,797 2,493 2,711Other and eliminations (254) (212) (162) (213) (168) 123 44 240Total 4,625 3,964 4,227 3,591 1,858 3,318 4,039 4,184
RESULTS
NOK millions, except per share information 4Q 2014 3Q 2014 2Q 2014 1Q 2014 4Q 2013 2) 3Q 2013 2) 2Q 2013 2) 1Q 2013 2)
Revenue and other income 26,230 24,095 23,309 21,709 20,573 20,613 23,209 20,697 Operating income 2,688 2,501 2,849 2,268 583 2,022 2,651 2,817 EBITDA 4,625 3,964 4,227 3,591 1,858 3,318 4,039 4,184 Net income after non-controlling interests 1,860 1,707 2,285 1,773 63 1,571 1,867 2,257 Earnings per share (NOK) 6.74 6.18 8.26 6.40 0.23 5.66 6.69 8.04
USD 1) millions, except per share information 4Q 2014 3Q 2014 2Q 2014 1Q 2014 4Q 2013 2) 3Q 2013 2) 2Q 2013 2) 1Q 2013 2)
Revenue and other income 3,817 3,859 3,898 3,565 3,400 3,457 3,985 3,678 Operating income 392 401 477 373 98 339 455 501 EBITDA 671 635 708 590 308 556 694 744 Net income after non-controlling interests 233 274 383 292 5 263 321 401 Earnings per share (USD) 0.85 0.99 1.38 1.05 0.02 0.95 1.15 1.43
1) USD numbers are calculated monthly based on average NOK/USD per month.2) 2013 figures have been restated, see note 12 for more information.

34 YARA FOURTH QUARTER 2014
Notes

35YARA FOURTH QUARTER 2014
Notes
Yara International ASADrammensveien 131 P.O. Box 343, Skøyen N-0213 Oslo NorwayTel: +47 24 15 70 00Fax: +47 24 15 70 01
www.yara.com
Global #1 in ammonia
LEADERSHIP position in the ammonia value chain, producing ammonia/urea at scales from base in low-cost natural gas regions.
Global #1 in nitrates
LEADERSHIP position in nitrate markets, benefiting from a favorable cost position in the European market.
Global #1 in NPK
LEADING position in production and application of NPK, adding value to farmers through balanced fertilization.
Global #1 in specialty fertilizers
LEADING position in specialty fertilizers, targeting high-margin cash crop segments in fast growing markets.
European #1 in nitrogen applications
LEADING position in nitrogen applications, developing higher margin industrial applications from existing production base.
Global #1 in marketing and distribution
LEADING position in global marketing and distribution, delivering expertise on all continents through network offering economies of scale.
PILLARS OF STRENGTH
VALUE CHAIN PRESENCE
MARKET PRESENCE
UNIQUEFLEXIBILITY
SCALEADVANTAGES
Upstream Downstream
Industrial
SUPPLY & TRADE
Upstream
Downstream
Industrial
SUPPLY & TRADE
MARKET PRESENCE
VALUE CHAINPRESENCE
UNIQUEFLEXIBILITY
SCALEADVANTAGES
YARA HAS A STRONG platform building on its global presence, its vast knowledge base and unique business model. With a presence from sourcing of resources to dissemination of knowledge in the field, Yara is positioned to yield margins throughout the value chain.
YARA ACTIVELY RESPONDS to global challenges – and is positioned to make a difference. We succeed by pursuing a strategy that creates value for owners, customers and society at large – Creating Impact by using economic success as a lever for change, positioning the company.