© 2006 mcgraw-hill companies, inc., mcgraw-hill/irwinslide 13-2 building the price foundation c...
TRANSCRIPT
© 2006 McGraw-Hill Companies, Inc., McGraw-Hill/Irwin Slide 13-2
BUILDINGTHE PRICE
FOUNDATION
CHAPTER
© 2006 McGraw-Hill Companies, Inc., McGraw-Hill/Irwin Slide 13-5
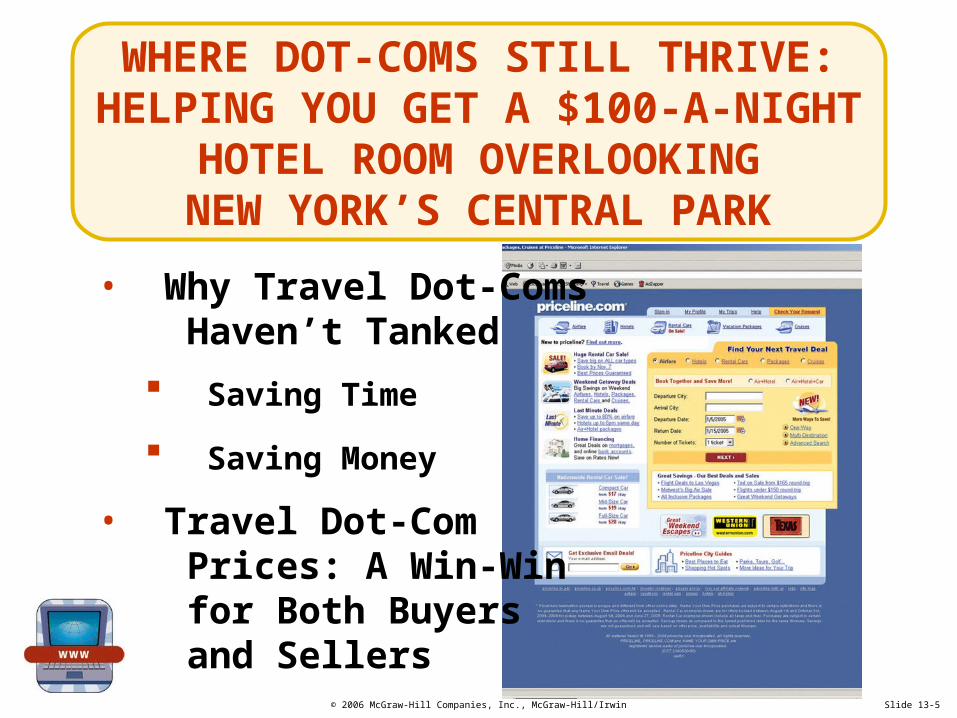
WHERE DOT-COMS STILL THRIVE: HELPING YOU GET A $100-A-NIGHT
HOTEL ROOM OVERLOOKINGNEW YORK’S CENTRAL PARK
• Why Travel Dot-Coms Haven’t Tanked
• Travel Dot-Com Prices: A Win-Win for Both Buyers and Sellers
Saving Time
Saving Money
© 2006 McGraw-Hill Companies, Inc., McGraw-Hill/Irwin
NATURE AND IMPORTANCEOF PRICE
Slide 13-7
• The Many Names of Price
Price
• What Is a Price?
Barter
Price Equation
© 2006 McGraw-Hill Companies, Inc., McGraw-Hill/Irwin Slide 13-8
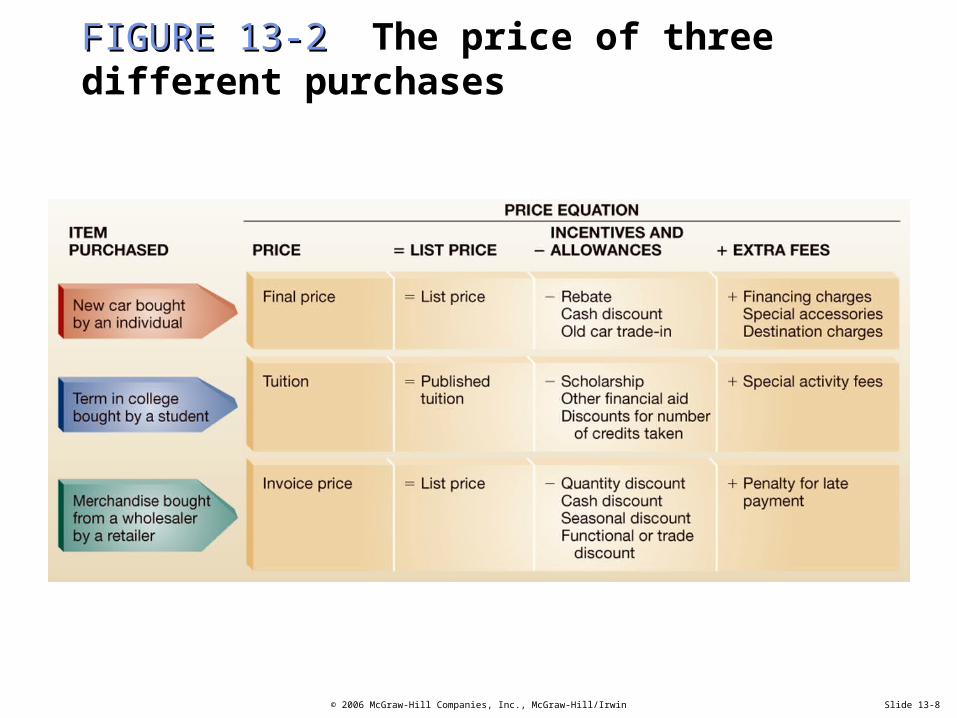
FIGURE 13-2 FIGURE 13-2 The price of three different purchases
© 2006 McGraw-Hill Companies, Inc., McGraw-Hill/Irwin Slide 13-9
Bugatti Veyron What is its price equation?

© 2006 McGraw-Hill Companies, Inc., McGraw-Hill/Irwin Slide 13-10
ETHICS AND SOCIAL RESPONSIBILITY ALERT
Student Credit Cards—What Is the Real Price?
Lower MyBills
NellieMae
© 2006 McGraw-Hill Companies, Inc., McGraw-Hill/Irwin
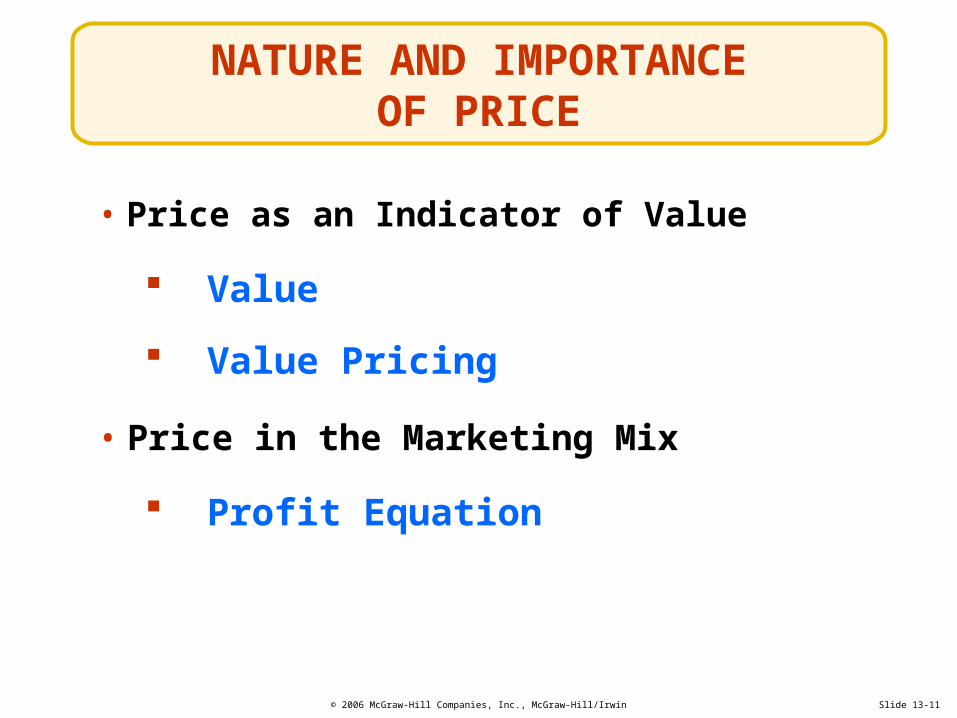
NATURE AND IMPORTANCEOF PRICE
Slide 13-11
• Price as an Indicator of Value
Value
Value Pricing
Profit Equation
• Price in the Marketing Mix
© 2006 McGraw-Hill Companies, Inc., McGraw-Hill/Irwin
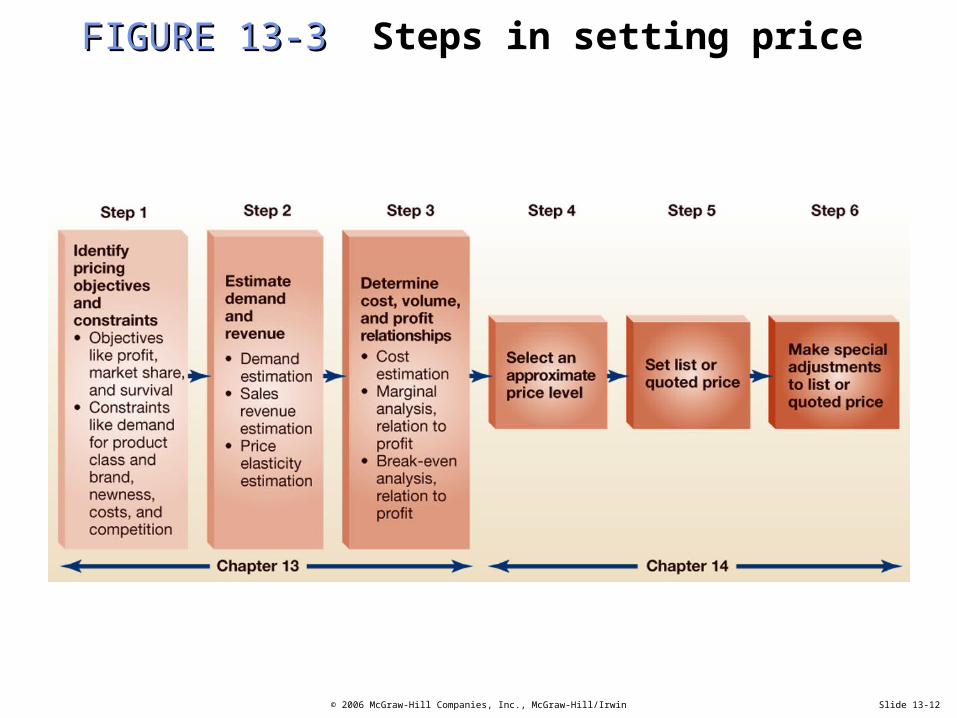
FIGURE 13-3 FIGURE 13-3 Steps in setting price
Slide 13-12
© 2006 McGraw-Hill Companies, Inc., McGraw-Hill/Irwin
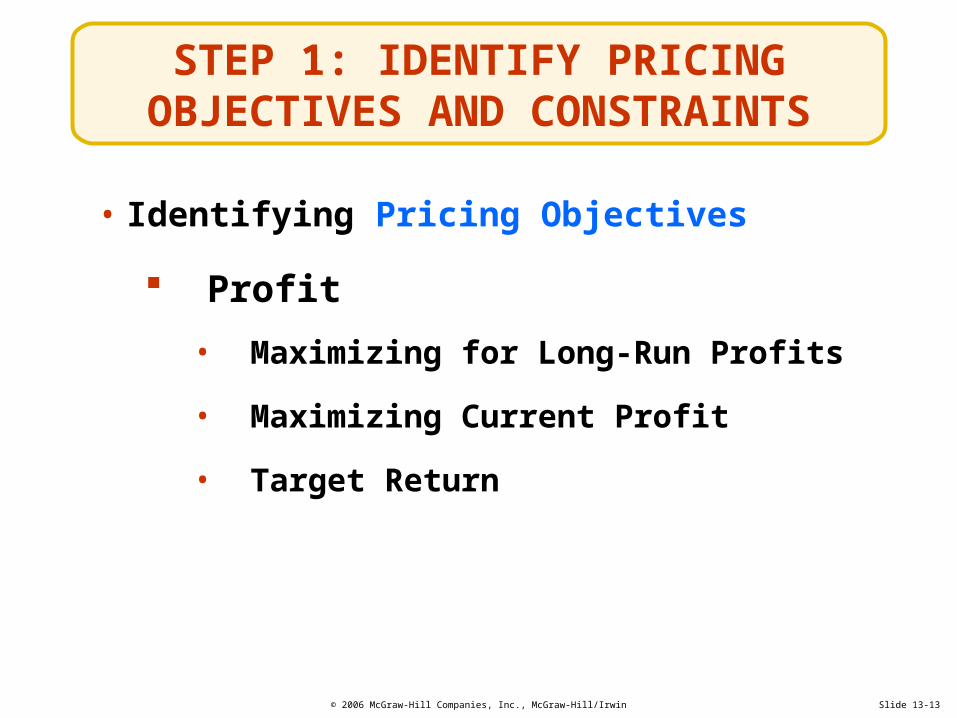
STEP 1: IDENTIFY PRICING OBJECTIVES AND CONSTRAINTS
Slide 13-13
• Identifying Pricing Objectives
Profit
• Maximizing for Long-Run Profits
• Maximizing Current Profit
• Target Return
© 2006 McGraw-Hill Companies, Inc., McGraw-Hill/Irwin Slide 13-14
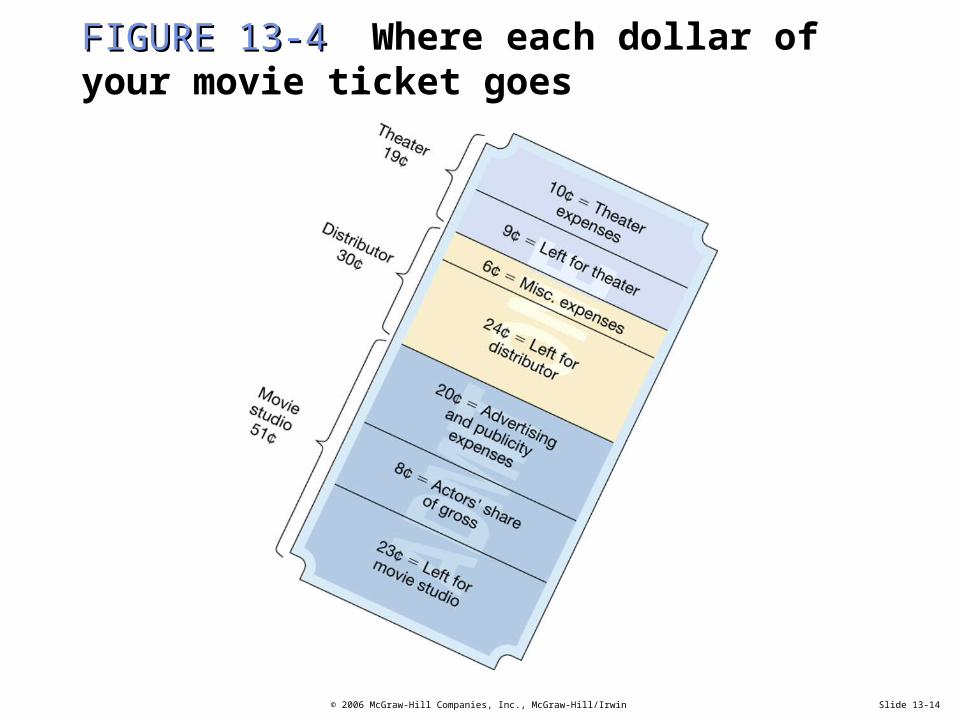
FIGURE 13-4 FIGURE 13-4 Where each dollar of your movie ticket goes
© 2006 McGraw-Hill Companies, Inc., McGraw-Hill/Irwin
STEP 1: IDENTIFY PRICING OBJECTIVES AND CONSTRAINTS
Slide 13-15
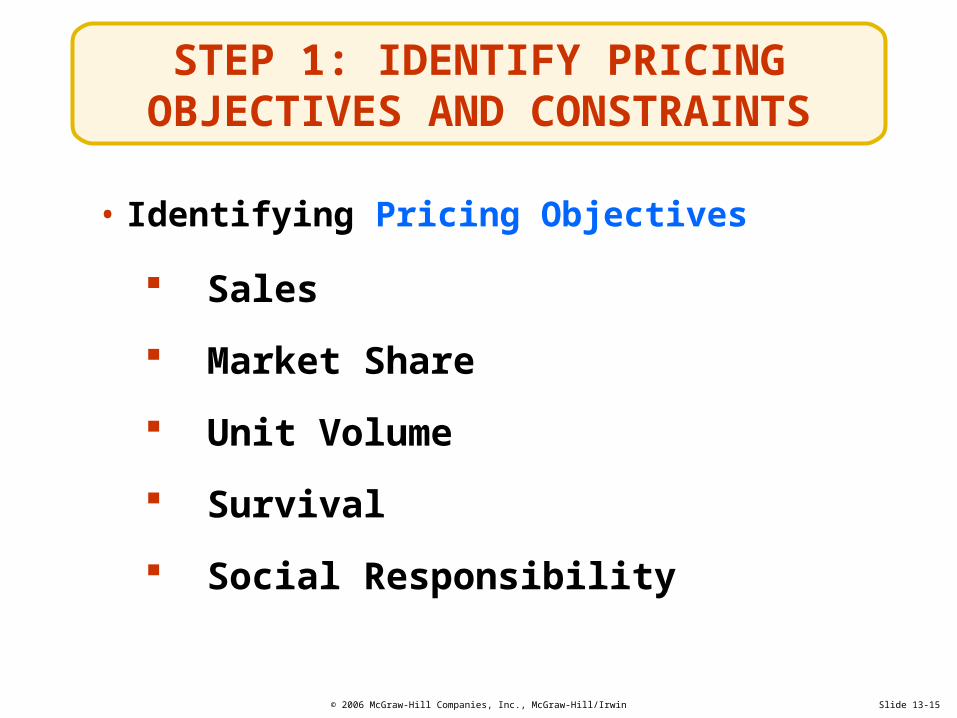
• Identifying Pricing Objectives
Sales
Market Share
Unit Volume
Survival
Social Responsibility

© 2006 McGraw-Hill Companies, Inc., McGraw-Hill/Irwin
STEP 1: IDENTIFY PRICING OBJECTIVES AND CONSTRAINTS
Slide 13-17
• Identifying Pricing Constraints
Demand for the Product Class, Product, and Brand
Single Product versus a Product Line
Newness of the Product: Stage in the Product Life Cycle

© 2006 McGraw-Hill Companies, Inc., McGraw-Hill/Irwin
STEP 1: IDENTIFY PRICING OBJECTIVES AND CONSTRAINTS
Slide 13-19
• Identifying Pricing Constraints
Cost of Changing Prices and Time Period They Apply
Cost of Producing and Marketing the Product
© 2006 McGraw-Hill Companies, Inc., McGraw-Hill/Irwin
STEP 1: IDENTIFY PRICING OBJECTIVES AND CONSTRAINTS
Slide 13-21
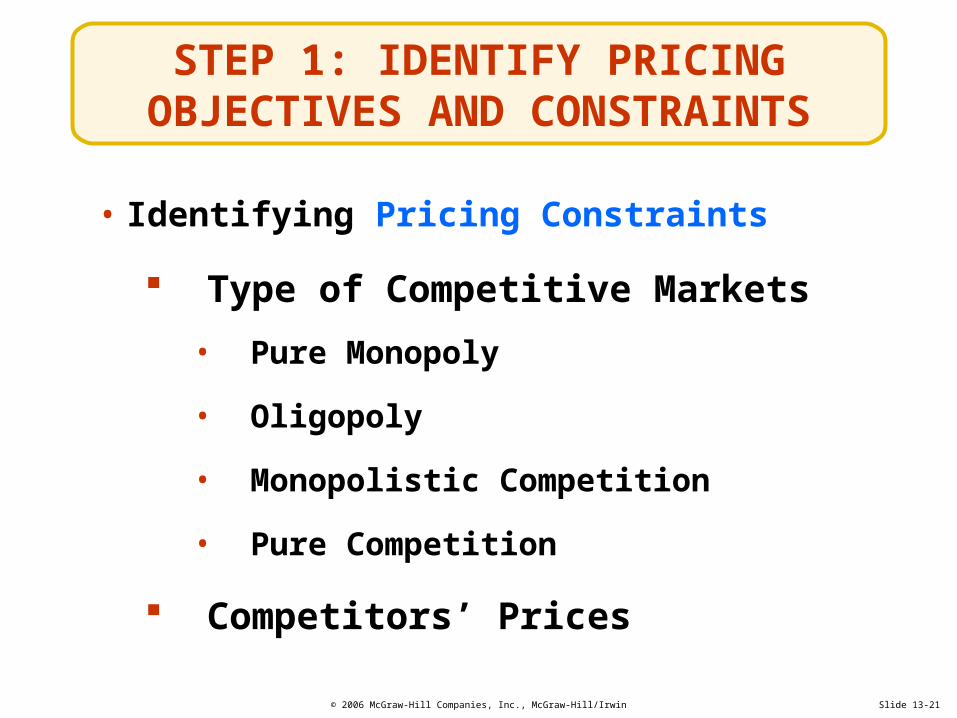
• Identifying Pricing Constraints
Type of Competitive Markets
• Pure Monopoly
• Oligopoly
• Monopolistic Competition
• Pure Competition
Competitors’ Prices

© 2006 McGraw-Hill Companies, Inc., McGraw-Hill/Irwin Slide 13-22
FIGURE 13-5FIGURE 13-5 Pricing, product, and advertising strategies available to firms in four types of competitive markets

© 2006 McGraw-Hill Companies, Inc., McGraw-Hill/Irwin Slide 13-23
Concept Check
1. What factors impact the list price to determine the final price?
A: discounts, allowances, rebates, and extra fees or surcharges
© 2006 McGraw-Hill Companies, Inc., McGraw-Hill/Irwin Slide 13-24
Concept Check
2. What is the difference between pricing objectives and pricing constraints?
A: Pricing objectives involve specifying the role of price in an organization’s marketing and strategic plans whereas pricing constraints are factors that limit the range of prices a firm may set.
© 2006 McGraw-Hill Companies, Inc., McGraw-Hill/Irwin Slide 13-25
Concept Check
3. How does the type of competitive market a firm is in affect its range in setting price?
A: Different competitive markets have differences in price competition and, in turn, the nature of product differentiation and extent of advertising.
© 2006 McGraw-Hill Companies, Inc., McGraw-Hill/Irwin
STEP 2: ESTIMATE DEMANDAND REVENUE
Slide 13-26
• Fundamentals of Estimating Demand
The Demand Curve
• Consumer Tastes
• Price and Availability of Similar Products
• Consumer Income
• Demand Factors
Movement Along versus Shift of a Demand Curve

© 2006 McGraw-Hill Companies, Inc., McGraw-Hill/Irwin Slide 13-27
Newsweek How do you estimate demand and set a price?
© 2006 McGraw-Hill Companies, Inc., McGraw-Hill/Irwin Slide 13-28
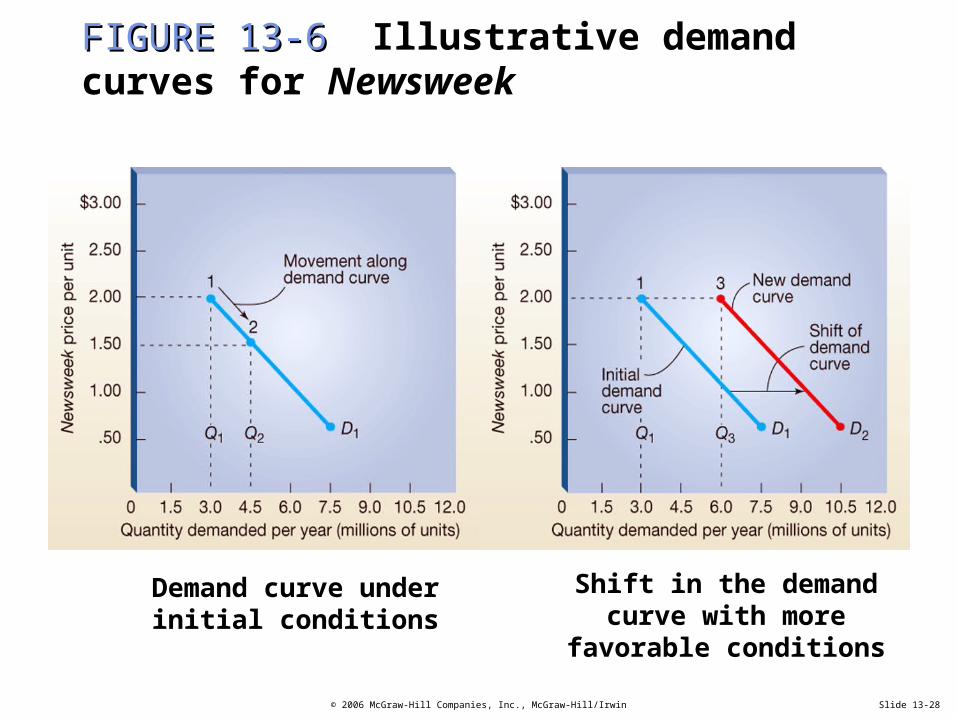
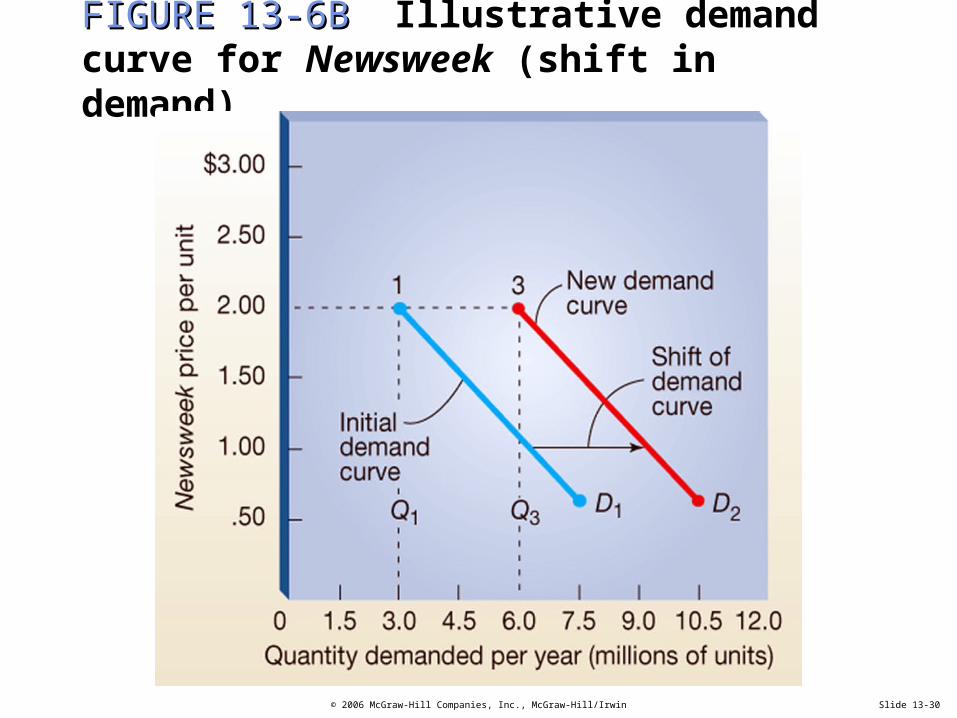
FIGURE 13-6 FIGURE 13-6 Illustrative demand curves for Newsweek
Demand curve underinitial conditions
Shift in the demandcurve with more
favorable conditions
© 2006 McGraw-Hill Companies, Inc., McGraw-Hill/Irwin Slide 13-29
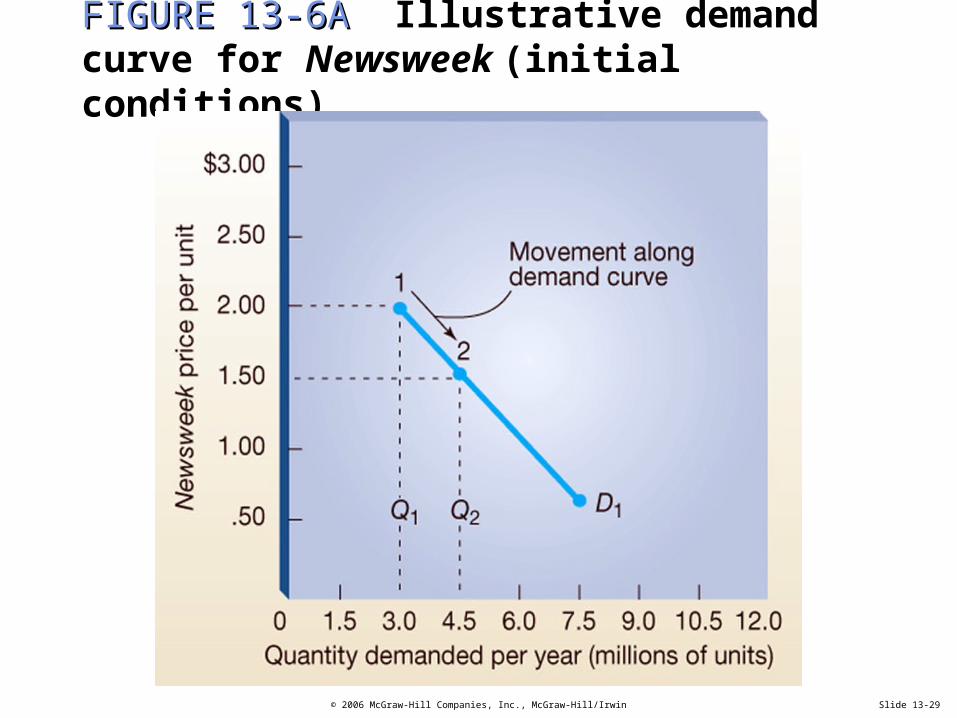
FIGURE 13-6A FIGURE 13-6A Illustrative demand curve for Newsweek (initial conditions)
© 2006 McGraw-Hill Companies, Inc., McGraw-Hill/Irwin Slide 13-30
FIGURE 13-6B FIGURE 13-6B Illustrative demand curve for Newsweek (shift in demand)
© 2006 McGraw-Hill Companies, Inc., McGraw-Hill/Irwin
STEP 2: ESTIMATE DEMANDAND REVENUE
Slide 13-31
• Fundamentals of Estimating Revenue
Total Revenue (TR)
Demand Curves and Revenue
Average Revenue (AR)
Marginal Revenue (MR)

© 2006 McGraw-Hill Companies, Inc., McGraw-Hill/Irwin
FIGURE 13-7 FIGURE 13-7 Fundamental revenue concepts
Slide 13-32
© 2006 McGraw-Hill Companies, Inc., McGraw-Hill/Irwin Slide 13-33
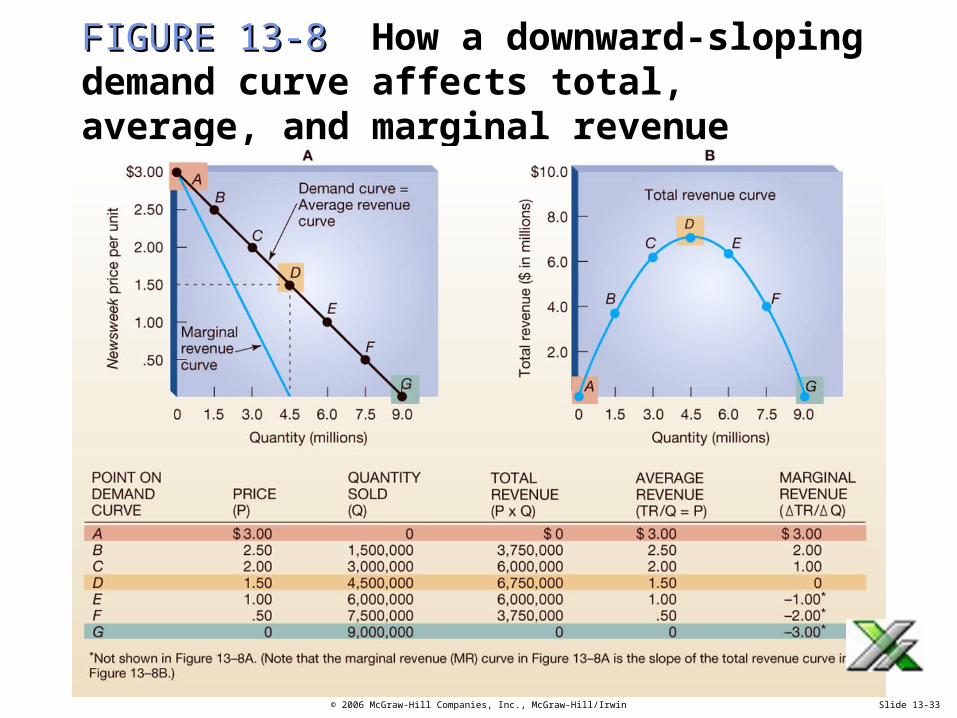
FIGURE 13-8FIGURE 13-8 How a downward-sloping demand curve affects total, average, and marginal revenue
© 2006 McGraw-Hill Companies, Inc., McGraw-Hill/Irwin
STEP 2: ESTIMATE DEMANDAND REVENUE
Slide 13-35
• Fundamentals of Estimating Revenue
Price Elasticity of Demand
• Elastic Demand
• Inelastic Demand
• Unitary Demand
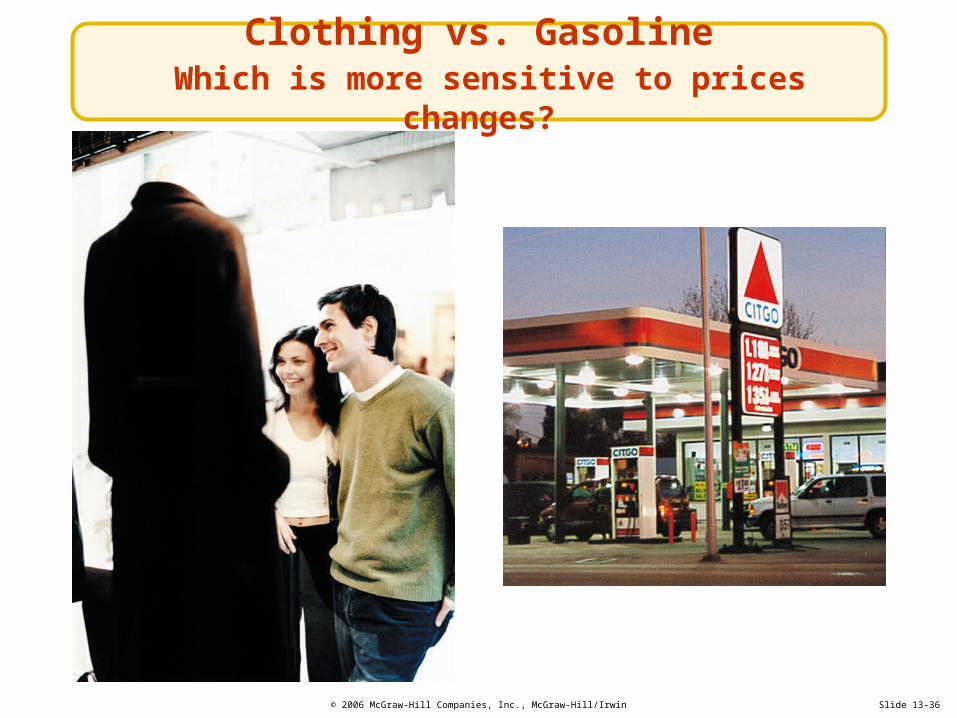
© 2006 McGraw-Hill Companies, Inc., McGraw-Hill/Irwin Slide 13-36
Clothing vs. Gasoline Which is more sensitive to prices changes?
© 2006 McGraw-Hill Companies, Inc., McGraw-Hill/Irwin
STEP 3: DETERMINE COST, VOLUME, AND PROFIT RELATIONSHIPS
Slide 13-40
• Importance of Controlling Costs
Total Cost (TC)
Fixed Cost (FC)
Variable Cost (VC)
Unit Variable Cost (UVC)
Marginal Cost (MC)

© 2006 McGraw-Hill Companies, Inc., McGraw-Hill/Irwin
FIGURE 13-9 FIGURE 13-9 Fundamental cost concepts
Slide 13-41
© 2006 McGraw-Hill Companies, Inc., McGraw-Hill/Irwin Slide 13-42
MARKETING NEWSNET
Pricing Lessons from the Dot-Coms—Understanding Revenues and Expenses
• Brick-and-Mortar Dot-Com Failures
• Travel Dot-Com Successes (So Far)
© 2006 McGraw-Hill Companies, Inc., McGraw-Hill/Irwin
STEP 3: DETERMINE COST, VOLUME, AND PROFIT RELATIONSHIPS
Slide 13-43
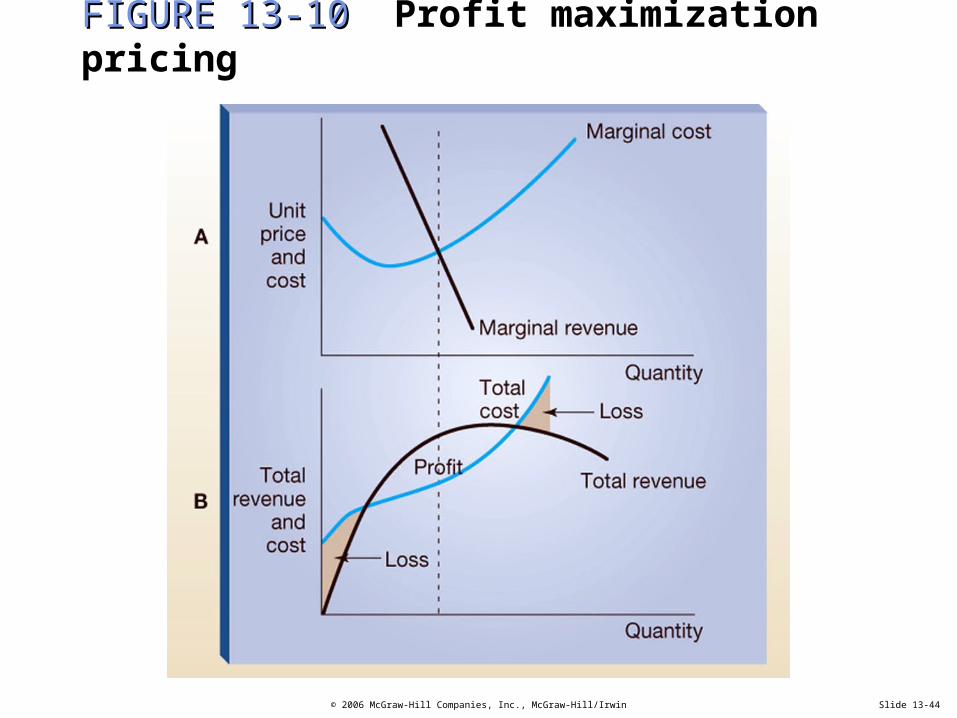
• Marginal Analysis and Profit Maximization
Break-Even Point (BEP)
Calculating a Break-Even Point
• Break-Even Analysis
Break-Even Chart
Applications of Break-Even Analysis
© 2006 McGraw-Hill Companies, Inc., McGraw-Hill/Irwin
FIGURE 13-10 FIGURE 13-10 Profit maximization pricing
Slide 13-44

© 2006 McGraw-Hill Companies, Inc., McGraw-Hill/Irwin Slide 13-45
FIGURE 13-11 FIGURE 13-11 Calculating a break-even point for a picture frame store

© 2006 McGraw-Hill Companies, Inc., McGraw-Hill/Irwin Slide 13-46
FIGURE 13-12 FIGURE 13-12 Break-even analysis chart for a picture frame store
© 2006 McGraw-Hill Companies, Inc., McGraw-Hill/Irwin Slide 13-47
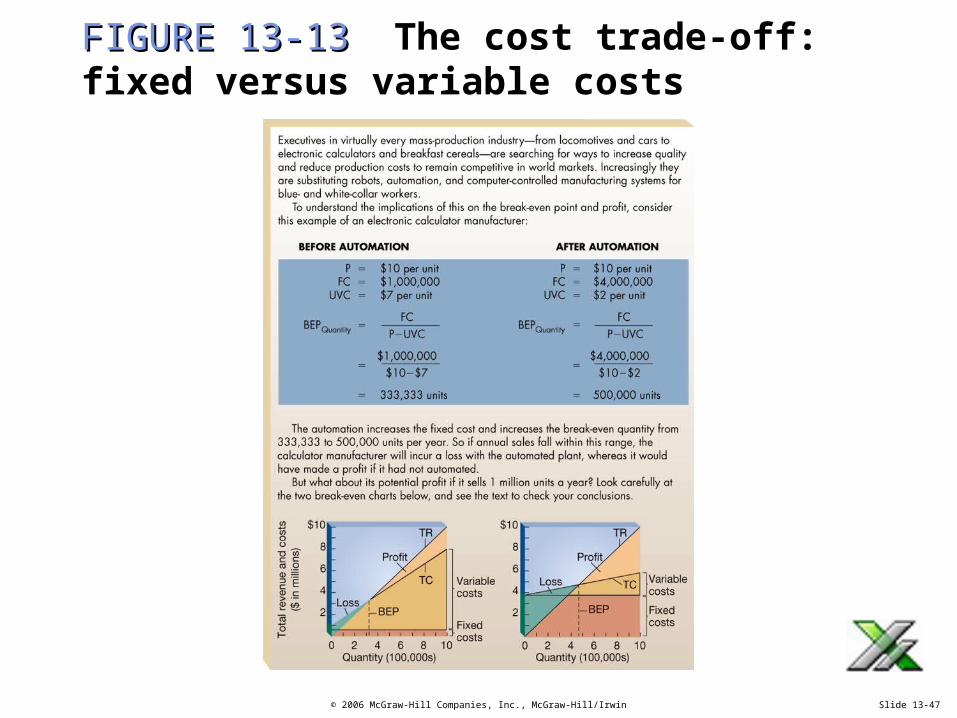
FIGURE 13-13 FIGURE 13-13 The cost trade-off: fixed versus variable costs

© 2006 McGraw-Hill Companies, Inc., McGraw-Hill/Irwin Slide 13-66
Price (P)
Price (P) is the money or other considerations (including other goods and services) exchanged for the ownership or use of a good or service.
Price (P) is the money or other considerations (including other goods and services) exchanged for the ownership or use of a good or service.
© 2006 McGraw-Hill Companies, Inc., McGraw-Hill/Irwin Slide 13-67
Barter
Barter is the practice of exchanging goods and services for other goods and services rather than for money.
Barter is the practice of exchanging goods and services for other goods and services rather than for money.
© 2006 McGraw-Hill Companies, Inc., McGraw-Hill/Irwin Slide 13-68
Value
Value is the ratio of perceived benefitsto price; or Value = (Perceived benefits divided by Price).
Value is the ratio of perceived benefitsto price; or Value = (Perceived benefits divided by Price).

© 2006 McGraw-Hill Companies, Inc., McGraw-Hill/Irwin Slide 13-69
Value-Pricing
Value-pricing is the practice of simultaneously increasing product and service benefits while maintaining or decreasing price.
Value-pricing is the practice of simultaneously increasing product and service benefits while maintaining or decreasing price.
© 2006 McGraw-Hill Companies, Inc., McGraw-Hill/Irwin Slide 13-70
Profit Equation
A firm’s profit equation is as follows: Profit = Total revenue − Total cost; or Profit = (Unit price × Quantity sold)− Total cost.
A firm’s profit equation is as follows: Profit = Total revenue − Total cost; or Profit = (Unit price × Quantity sold)− Total cost.
© 2006 McGraw-Hill Companies, Inc., McGraw-Hill/Irwin Slide 13-71
Pricing Objectives
Pricing objectives involve specifyingthe role of price in an organization’s marketing and strategic plans.
Pricing objectives involve specifyingthe role of price in an organization’s marketing and strategic plans.

© 2006 McGraw-Hill Companies, Inc., McGraw-Hill/Irwin Slide 13-72
Pricing Constraints
Pricing constraints involve factors that limit the range of prices a firm may set.Pricing constraints involve factors that limit the range of prices a firm may set.
© 2006 McGraw-Hill Companies, Inc., McGraw-Hill/Irwin Slide 13-73
Demand Curve
A demand curve is a graph relating the quantity sold and price, which shows the maximum number of units that will be sold at a given price.
A demand curve is a graph relating the quantity sold and price, which shows the maximum number of units that will be sold at a given price.
© 2006 McGraw-Hill Companies, Inc., McGraw-Hill/Irwin Slide 13-74
Demand Factors
Demand factors are factors that determine consumers’ willingness and ability to pay for goods and services.
Demand factors are factors that determine consumers’ willingness and ability to pay for goods and services.

© 2006 McGraw-Hill Companies, Inc., McGraw-Hill/Irwin Slide 13-75
Total Revenue (TR)
Total revenue (TR) is the total money received from the sale of a product.Total revenue (TR) = unit price (P)× the quantity sold (Q) or TR = P × Q.
Total revenue (TR) is the total money received from the sale of a product.Total revenue (TR) = unit price (P)× the quantity sold (Q) or TR = P × Q.
© 2006 McGraw-Hill Companies, Inc., McGraw-Hill/Irwin Slide 13-76
Average Revenue (AR)
Average revenue (AR) is the average amount of money received for sellingone unit of a product, or simply theprice of that unit.
Average revenue (AR) is the average amount of money received for sellingone unit of a product, or simply theprice of that unit.
© 2006 McGraw-Hill Companies, Inc., McGraw-Hill/Irwin Slide 13-77
Marginal Revenue (MR)
Marginal revenue (MR) is the change in total revenue that results from producing and marketing one additional unit.
Marginal revenue (MR) is the change in total revenue that results from producing and marketing one additional unit.
© 2006 McGraw-Hill Companies, Inc., McGraw-Hill/Irwin Slide 13-78
Price Elasticity of Demand
Price elasticity of demand is the percentage change in quantity demanded relative to a percentage change in price.
Price elasticity of demand is the percentage change in quantity demanded relative to a percentage change in price.
© 2006 McGraw-Hill Companies, Inc., McGraw-Hill/Irwin Slide 13-79
Total Cost (TC)
Total cost (TC) is the total expense incurred by a firm in producing and marketing a product. Total cost (TC) equals the sum of fixed cost (FC) and variable cost (VC) or TC = FC + VC.
Total cost (TC) is the total expense incurred by a firm in producing and marketing a product. Total cost (TC) equals the sum of fixed cost (FC) and variable cost (VC) or TC = FC + VC.
© 2006 McGraw-Hill Companies, Inc., McGraw-Hill/Irwin Slide 13-80
Fixed Cost (FC)
Fixed cost (FC) is the sum of the expenses of the firm that are stableand do not change with the quantityof a product that is produced and sold.
Fixed cost (FC) is the sum of the expenses of the firm that are stableand do not change with the quantityof a product that is produced and sold.

© 2006 McGraw-Hill Companies, Inc., McGraw-Hill/Irwin Slide 13-81
Variable Cost (VC)
Variable cost (VC) is the sum of the expenses of the firm that vary directly with the quantity of a product that is produced and sold.
Variable cost (VC) is the sum of the expenses of the firm that vary directly with the quantity of a product that is produced and sold.
© 2006 McGraw-Hill Companies, Inc., McGraw-Hill/Irwin Slide 13-82
Unit Variable Cost (UVC)
Unit variable cost (UVC) is variable cost expressed on a per unit basis.Unit variable cost (UVC) is variable cost expressed on a per unit basis.

© 2006 McGraw-Hill Companies, Inc., McGraw-Hill/Irwin Slide 13-83
Marginal Cost (MC)
Marginal cost (MC) is the change in total cost that results from producingand marketing one additional unit of a product.
Marginal cost (MC) is the change in total cost that results from producingand marketing one additional unit of a product.

© 2006 McGraw-Hill Companies, Inc., McGraw-Hill/Irwin Slide 13-84
Marginal Analysis
Marginal analysis is a continuing, concise trade-off of incremental costs against incremental revenues.
Marginal analysis is a continuing, concise trade-off of incremental costs against incremental revenues.
© 2006 McGraw-Hill Companies, Inc., McGraw-Hill/Irwin Slide 13-85
Break-Even Analysis
Break-even analysis is a technique that analyzes the relationship between total revenue and total cost to determine profitability at various levels of output.
Break-even analysis is a technique that analyzes the relationship between total revenue and total cost to determine profitability at various levels of output.

© 2006 McGraw-Hill Companies, Inc., McGraw-Hill/Irwin Slide 13-86
Break-Even Point (BEP)
Break-even point (BEP) is the quantity at which total revenue and total cost are equal or BEP = (FC ÷ (P−UVC)).
Break-even point (BEP) is the quantity at which total revenue and total cost are equal or BEP = (FC ÷ (P−UVC)).
© 2006 McGraw-Hill Companies, Inc., McGraw-Hill/Irwin Slide 13-87
Break-Even Chart
Break-even chart is a graphic presentation of the break-even analysis that shows when total revenue and total cost intersect to identify profit or lossfor a given quantity sold.
Break-even chart is a graphic presentation of the break-even analysis that shows when total revenue and total cost intersect to identify profit or lossfor a given quantity sold.