ifdcorg.files.wordpress.com · coversalmost80 %oftheagriculturalland.boro,ordry season, rice is the...
TRANSCRIPT
1 23
Nutrient Cycling in Agroecosystems(formerly Fertilizer Research) ISSN 1385-1314Volume 104Number 1 Nutr Cycl Agroecosyst (2016) 104:53-66DOI 10.1007/s10705-015-9758-6
Floodwater ammonium, nitrogen useefficiency and rice yields with fertilizerdeep placement and alternate wetting anddrying under triple rice cropping systems
Azmul Huda, Yam Kanta Gaihre,M. R. Islam, Upendra Singh,Md. R. Islam, Joaquin Sanabria,M. Abdus Satter, Hasina Afroz, et al.

1 23
Your article is protected by copyright and all
rights are held exclusively by Springer Science
+Business Media Dordrecht. This e-offprint
is for personal use only and shall not be self-
archived in electronic repositories. If you wish
to self-archive your article, please use the
accepted manuscript version for posting on
your own website. You may further deposit
the accepted manuscript version in any
repository, provided it is only made publicly
available 12 months after official publication
or later and provided acknowledgement is
given to the original source of publication
and a link is inserted to the published article
on Springer's website. The link must be
accompanied by the following text: "The final
publication is available at link.springer.com”.

ORIGINAL ARTICLE
Floodwater ammonium, nitrogen use efficiency and riceyields with fertilizer deep placement and alternate wettingand drying under triple rice cropping systems
Azmul Huda . Yam Kanta Gaihre . M. R. Islam . Upendra Singh .
Md. R. Islam . Joaquin Sanabria . M. Abdus Satter . Hasina Afroz .
Alee Halder . M. Jahiruddin
Received: 11 August 2015 / Accepted: 31 December 2015 / Published online: 8 January 2016
� Springer Science+Business Media Dordrecht 2016
Abstract Fertilizer management should consider
optimum time, rates and methods of application to
increase use efficiency and crop yield. We conducted
field experiments at Bangladesh Agricultural Univer-
sity, Bangladesh, to investigate the effects of deep
placement of urea briquettes (UB) and NPK briquettes
(NPK) compared to broadcast prilled urea (PU) at
different N rates on dynamics of floodwater NH4?-N,
ammonia (NH3) volatilization, rice yield and nitrogen
use efficiency (NUE) during four consecutive
rice-growing seasons in 2012–2013. The floodwater
NH4?-N and NH3 volatilization in broadcast PU
increased with N rates, while in deep-placed treat-
ments irrespective of N rates it was similar to the
control. Across seasons and water regime, UB or NPK
significantly (P\ 0.05) increased grain yield and
nitrogen recovery compared to broadcast PU. During
the Boro season (across water regime), UB78 and
NPK78 increased grain yield by 40 and 29 %, respec-
tively, compared to broadcast PU78, while N recovery
increased from 35 % of PU to 63–67 % in deep
placement. Deep placement of UB52 or NPK52 during
Aus–Aman and UB78 or NPK78 during Boro can be
one of the best N management options for increasing
NUE and crop yield. Alternate wetting and drying
irrigation, though, had no significant effect on grain
yield or on NUE. Its adoption could save irrigation
water without any yield reduction during the Boro
season. However, more studies across different soils,
climate and management practices are needed for
further understanding the interactive effects of fertilizer
and water management on yield, NUE and soil fertility.
Keywords Best nitrogen management � Fertilizerdeep placement � Nitrogen use efficiency �Lowland rice
Introduction
Nitrogen (N) use efficiency (NUE) of broadcast
applied prilled urea (PU) in lowland rice field is only
30–45 % due to the losses from ammonia (NH3)
volatilization, surface runoff, nitrification–denitrifica-
tion and leaching (Dong et al. 2012; Hayashi et al.
2008; Savant and Stangel 1990; Singh et al. 1995;
Sommer et al. 2004; Watanabe et al. 2009; Zhao et al.
2009). Broadcast application of PU results in higher
A. Huda � M. R. Islam � Md. R. Islam � H. Afroz �A. Halder � M. Jahiruddin
Department of Soil Science, Bangladesh Agricultural
University, Mymensingh, Bangladesh
Y. K. Gaihre (&) � M. A. Satter
EurAsia Division, International Fertilizer Development
Center (IFDC), House 4B, Road 62, Gulshan 2, Dhaka,
Bangladesh
e-mail: [email protected];
U. Singh � J. SanabriaInternational Fertilizer Development Center,
Muscle Shoals, AL, USA
123
Nutr Cycl Agroecosyst (2016) 104:53–66
DOI 10.1007/s10705-015-9758-6
Author's personal copy

amounts of ammonium (NH4?) N in floodwater
compared with deep placement of urea (Kapoor et al.
2008) that increases NH3 volatilization. Fertilizer-N
that escapes NH3 volatilization is also susceptible to
losses through nitrification and subsequent denitrifica-
tion because much of the N remains near the soil
surface—a partially aerobic zone (Buresh et al. 2008;
Freney et al. 1990; Singh et al. 1995). Nitrification and
denitrification cause atmospheric pollution due to
emissions of nitrous oxide and nitric oxide. Moreover,
after broadcast application of fertilizer, the high
percentage of applied nutrients present in floodwater
(Singh et al. 1995; Kapoor et al. 2008) increases the
chance of runoff losses particularly in the situation
where water flows from field to field without any
drainage systems. The nutrient-enriched runoff water
has the potential for environmental pollution such as
eutrophication (Savant and Stangel 1990) and ground-
water nitrate (NO3-) pollution (leaching loss). There-
fore, fertilizer broadcast not only causes substantial
monetary losses to farmers, but also causes a high
environmental cost to the society (Mohanty et al. 1999).
In addition to N, broadcast applied P and K
fertilizer could be lost via surface runoff and cause
eutrophication in water bodies, particularly in rainfed
rice during periods of high rainfall. There is an urgent
need for alternative fertilizer management strategies
that increase crop yield and maximize nutrient use
efficiency. Fertilizer deep placement (FDP) of urea
briquettes (UB) and N, P, K briquettes (NPK) is an
effective management practice for increasing grain
yield and nutrient use efficiency in lowland rice fields
(Savant and Stangel 1990; Kapoor et al. 2008;
Bandaogo et al. 2014) and for reducing nutrient
losses, particularly from NH3 volatilization, surface
runoff of N and P (Rochette et al. 2013; Sommer et al.
2004) and from nitrification and denitrification (Chien
et al. 2009) leading to reduced nitrous oxide and nitric
oxide emissions (Gaihre et al. 2015). Deep-placed
fertilizer remains in a reduced soil layer for a longer
time, and its movement to soil surface/floodwater is
negligible. Due to reduced nutrient concentration in
floodwater, any water runoff from rice paddies reduces
nutrient loss and the potential eutrophication problem
(Chien et al. 2009; Kapoor et al. 2008; Singh et al.
1995). The deep placement of NPK through balanced
fertilization also increases fertilizer use efficiency and
crop production and reduces negative environmental
consequences. FDP, in addition to performing well
with lowland rice, also performed better in aerobic rice
(Xiang et al. 2013) and upland crops such as potato
(Azam et al. 2012) and cabbage (Hussain et al. 2010),
showing the potential for its adoption on upland crops.
Limited evaluation of FDP with NPK has taken place
in India (Daftardar et al. 1997; Kapoor et al. 2008),
Cambodia (Bhattarai et al. 2010) and Bangladesh
(Islam al. 2011). In addition to increasing yields and
improving soil fertility, it reduces labor cost because
all three nutrients can be applied at the same time.
In Bangladesh, rice is grown two to three seasons per
year in about 11 million hectares (ha) of land, which
covers almost 80 %of the agricultural land.Boro, or dry
season, rice is the main rice crop, and it is completely
dependent upon irrigation. The need for water-saving
irrigation practices such as alternate wetting and drying
(AWD) is increasing in Bangladesh (Price et al. 2013;
Lampayan et al. 2015) due to groundwater depletion. It
is reported that AWD can reduce water use by up to
38 % while maintaining rice yield (Lampayan et al.
2015) and is expected tobewidely adoptedby farmers in
the country. However, the effect of AWD on soil C and
N dynamics and nutrient use efficiency is not well
quantified, particularly with FDP. Most of the previous
studies on FDP were conducted under continuously
standingwater (CSW) conditions.Moreover, studies on
the effects of deep placement of NPKon rice cultivation
are still limited under both CSW and AWD conditions.
Therefore, field experiments were conducted to deter-
mine the effects of FDP and water management (AWD
vsCSW) on rice yield andNUE. The specific objectives
of this study were:
• To determine the effects of FDP and broadcast PU
at different N rates on dynamics of floodwater
NH4-N and NH3 volatilization.
• To assess the effects of FDP and AWD on rice
yield and NUE in different rice-growing seasons.
• To determine season-specific optimum N rates for
broadcast PU and FDP.
Materials and methods
Experimental site and weather conditions
The field experiments were conducted at Bangladesh
Agricultural University (BAU), Mymensingh, Ban-
gladesh (latitude: 24� 420 5500, longitude: 90� 250 4700),
54 Nutr Cycl Agroecosyst (2016) 104:53–66
123
Author's personal copy

during four rice-growing seasons in January 2012–May
2013. There are three rice-growing seasons in a year, i.e.,
Boro (Dec/Jan–April/May), Aus (May/June–Aug/Sep)
and Aman (Aug/Sep–Nov/Dec). The climate is humid
subtropical monsoon. Average annual rainfall is ca.
1500 mm, primarily received from June to October.
Daily rainfall and mean temperature for the experiment
period are shown in Fig. 1. The physicochemical prop-
erties of the soil fromboth experiments (CSWandAWD)
before start of the experiment are shown in Table 1.
Experimental design and treatments
The eight treatments with different sources and rates of N
fertilizer were tested (Table 2). The sources of N
fertilizer were PU, UB and NPK. PU was applied as a
conventional broadcast method, while UB and NPK
were deep placed as described later. Treatments were
arranged in a randomized complete block design with
three replications. Each experimental plot (6 m 9 4 m)
was separated by 50 cm wide bund. Experiments were
conducted under CSW condition in 2012 (all three rice
growing seasons). But in Boro 2013, experiment was
conducted under two water regimes—CSW and
AWD—following the same treatments. There were
slight variations in soil physicochemical properties,
particularly organic carbon between CSW and AWD
experiments (Table 1).
Size and numbers of briquette per placement site
were determined based on the N rates. The N rates were
fixed at 52, 78, 104, and 156 kg ha-1 for deep
placement of N. The N rates for broadcast and deep
placed treatments increased from the existing recom-
mended rate. The recommended N rate for UB or NPK
is 30 % less than broadcast PU, i.e., 52 and 78 kg ha-1,
respectively for Aus–Aman and Boro seasons. This is
because deep placement saves 30–35 % urea compared
with surface broadcast and increases yield by 15–20 %
(FRG 2012; Miah et al. 2015). On the other hand,
higher N rate during dry (Boro) season than during wet
(Aus and Aman) season was due to the higher rice yield
potential. N rates for NPK varied ±3 kg ha-1 com-
pared with N rates of UB due to mixing ratio of three
fertilizers, i.e., PU, di-ammonium phosphate (DAP) and
muriate of potash (MOP). One or two briquettes of
either 1.8 or 2.7 g were deep-placed at 40 cm by 40 cm
spacing (62,500 placement sites per ha) (Table 2). The
dice (briquetting rolls) in briquetting machine used to
produce 1.8 and 2.7 g UB produced NPK of 2.4 and
3.4 g, respectively. While preparing NPK, the recom-
mended rate of P and K were maintained.
Crop management
P (triple super phosphate, TSP) and K (MOP) fertil-
izers were applied basally in all the plots (except plots
receiving NPK) during final land preparation at 16 kg
and 25 kg P ha-1 and 42 kg and 64 kg K ha-1 in
Aus–Aman and Boro seasons, respectively. P and K in
NPK treatments were applied along with briquette. PU
was applied as broadcast in three splits at 7–10 days
after transplanting (DAT), at maximum tillering and at
panicle initiation stages while urea, and NPK bri-
quettes were applied at one time during the first
broadcast application of PU. The briquettes were
deep-placed at a depth of 7–10 cm between four hills
Table 1 Physicochemical properties of soil before start of the
experiments
Soil property CSW AWD
pH–H2O 5.37 5.44
Organic carbon (%) 1.76 1.28
Total N (%) 0.17 0.14
Available P (mg kg-1) 2.88 3.04
Available K (cmolc kg-1) 0.09 0.08
Available S (mg kg-1) 12.66 11.07
Particle size (%)
Sand 11.44 29.96
Silt 72.4 40.10
Clay 16.16 29.94
0
10
20
30
40
50
60
70
80
90
0
10
20
30
40
1/1 3/1 4/30 6/29 8/28 10/27 12/26 2/24 4/25
Rai
nfal
l (m
m d
-1)
Air
tem
pera
ture
(°C
)
Date (Month/Day, 2012-13)
Rainfall Temp
Fig. 1 Daily average of rainfall and air temperature during
experiment period (Jan 2012–April 2013) (data source Depart-
ment of Irrigation and Water Management, Bangladesh
Agricultural University)
Nutr Cycl Agroecosyst (2016) 104:53–66 55
123
Author's personal copy
of rice at the alternate rows. In addition, sulfur (S) and
zinc (Zn) were applied to all plots at the rate of
20 kg S ha-1 as gypsum and 3 kg Zn ha-1 as zinc
oxide. Rice seedlings (two to three per hill) were
transplanted at a spacing of 20 cm 9 20 cm. Rice
varieties grown in Boro, Aus and Aman seasons were
BRRI dhan 28, BRRI dhan 27 and BR 22, respectively.
All the plots under CSW conditions were continu-
ously flooded until 2 weeks before harvesting, while
plots under AWD conditions (Boro 2013) were irrigated
following safe AWD principle, i.e., plots were irrigated
when water depth in AWD pipes was 12–15 cm below
soil surface. However, plots were maintained continu-
ously flooded for a week after topdressing of PU for the
purpose of floodwater ammonium dynamics.
Floodwater ammonium-N (NH4?-N)
and ammonia volatilization measurement
Floodwater samples were collected every day from
each experimental plot for a week after topdressing of
PU as described by Kapoor et al. (2008). After
topdressing of PU, floodwater sampling was collected
2 h after application of fertilizers and then once a day
from 0800 to 1000H for six consecutive days. Samples
were collected in acid-washed plastic bottles and
brought to the laboratory. Ammonium-N was mea-
sured with Phenol-hypochlorite method (Solorzano
et al. 1969). The concentration of floodwater NH4-N
(mg L-1) is converted to kg ha-1 after adjusting
with floodwater depth. The modified ammonia
volatilization equation (Freney et al. 1983) was used
to determine NH3 loss from floodwater using NH4-N,
floodwater pH and wind speed.
Rice growth, yield and nitrogen recovery
Plant samples for total dry biomass were collected two
times from 1.2 m2 (3 hills 9 10 hills), first at panicle
initiation (PI) stage and then at heading stage. Grain and
straw yield were recorded at final harvest of the crop
from 5 m2 in each plot. In addition to the biomass, plant
N content was determined at each growth stage. The
total nitrogen uptake was determined at PI, heading and
maturity stages to determine the N recovery by plants.
Agronomic efficiency (AEN) and recovery efficiency
(REN) were calculated from total N uptake at harvest
using following formula (Singh et al. 1999).
AEN ¼ kg grain increase kg�1 N applied
¼ YN � Y0ð Þ=FN
where YN is rice grain yield (kg ha-1) at a certain level
of applied fertilizer N (FN, kg ha-1), and Y0 is the rice
grain yield (kg ha-1) measured in a control plot with
no N application.
REN kg N taken up kg�1 N applied� �
¼ UN � U0ð Þ=FN
where UN is the total N in aboveground plant biomass
(grain plus straw) at physiological maturity (kg ha-1)
in a plot receiving N at the rate of FN (kg ha-1), and U0
is the total plant N without N addition.
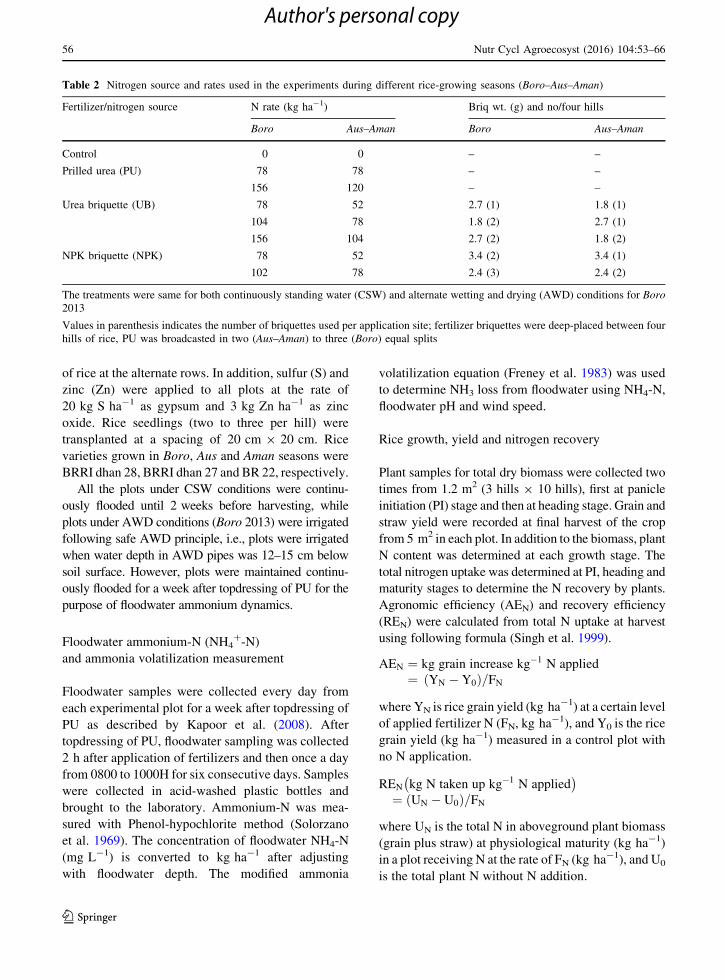
Table 2 Nitrogen source and rates used in the experiments during different rice-growing seasons (Boro–Aus–Aman)
Fertilizer/nitrogen source N rate (kg ha-1) Briq wt. (g) and no/four hills
Boro Aus–Aman Boro Aus–Aman
Control 0 0 – –
Prilled urea (PU) 78 78 – –
156 120 – –
Urea briquette (UB) 78 52 2.7 (1) 1.8 (1)
104 78 1.8 (2) 2.7 (1)
156 104 2.7 (2) 1.8 (2)
NPK briquette (NPK) 78 52 3.4 (2) 3.4 (1)
102 78 2.4 (3) 2.4 (2)
The treatments were same for both continuously standing water (CSW) and alternate wetting and drying (AWD) conditions for Boro
2013
Values in parenthesis indicates the number of briquettes used per application site; fertilizer briquettes were deep-placed between four
hills of rice, PU was broadcasted in two (Aus–Aman) to three (Boro) equal splits
56 Nutr Cycl Agroecosyst (2016) 104:53–66
123
Author's personal copy

Data analysis
ANOVA of different response variables within a
season in 2012 was done using SAS mixed procedure.
While ANOVA for the combination of the two
experiments (AWD and CSW) in Boro 2013 were
conducted with a split-plot generalized linear mixed
model where the water regime was used as the main
plot and the treatments as sub-plots. After testing
errors for normality and variance homogeneity, it was
decided to use the normal distribution as the proba-
bility distribution for the model, and a non-homoge-
nous variance–covariance matrix for calculation of
standard errors. Treatment, water regime, and water
regime 9 treatment were handled as fixed effects;
and replication together with the residual were han-
dled as random effects. The effect water 9 treatment
was tested with the residual as error term. The residual
denominator degrees of freedom were used for
calculations of the F statistic. Pairwise mean compar-
isons of interaction (water 9 treatment) or within
water regime were done using Tukey–Kramer method.
Results
Dynamics of floodwater NH4?-N and ammonia
volatilization
Floodwater NH4?-N was measured in all rice-growing
seasons in 2012 and showed a similar pattern to Boro
2013. Magnitudes of floodwater NH4?-N in deep-
placed treatments were negligible irrespective of N
rates and growing season. Therefore, ammonium
dynamics during Boro, Aus and Aman in 2012 is
combined (Fig. 2a), but it was not combined with
Boro 2013 because it was measured under two water
regimes unlike one water regime in 2012. To syn-
chronize N rate variations across seasons in 2012, they
were categorized as low, medium and high for
particular fertilizer.
The dynamics in floodwater NH4?-N during 2012
(average across seasons) and Boro 2013 under CSW
and AWD conditions are shown in Fig. 2. The results
clearly show that the deep placement of fertilizer N
either as UB or NPK resulted in significantly lower
amounts of floodwater NH4?-N. Even though the
amount of broadcast PU was only one-third (3 split
application) the rate of UB and NPK, it resulted in
significantly higher amounts of NH4?-N in floodwa-
ter. Floodwater NH4?-N in broadcast PU treatments
reached its peak (5–8 kg N ha-1) at 2–3 days after its
broadcast and then showed sharp decline, becoming
similar to the level in the N0 treatment after 5–6 days.
The amount of floodwater NH4?-N in PU increased
with N rates. But for UB and NPK treatments, the
amount of NH4?-N in floodwater remained negligible
and was similar to the control (N0) plot throughout the
7 days of measurement period irrespective of the N
rates. The magnitudes and pattern of NH4?-N was
0
2
4
6
8
10
NH
4-N
(kg/
ha)
Control-N0 PU-L PU-H UB-LUB-M UB-H NPK-L NPK-H
0
2
4
6
8
10
NH
4-N
(kg/
ha)
Control-N0 PU-N78 PU-N156 UB-N78UB-N104 UB-N156 NPK-N78 NPK-N102
(b) Boro 2013 (CSW)
TD-1 TD-2 TD-3
(a) 2012 (Average across seasons)
0
2
4
6
8
10
1 3 5 7 1 3 5 7 1 3 5 7
NH
4-N
(kg/
ha)
Days after fertilizer application
(c) Boro 2013 (AWD)
Fig. 2 Dynamics of floodwater NH4?-N under different N rates
and application methods—broadcast PU versus deep placement
of urea and NPK briquettes in 2012–2013; TD-1, TD-2 and TD-
3 represent first, second and third topdressing of PU, respec-
tively. Vertical bars indicate standard error of mean (n = 3).
CSW continuous standing water, AWD alternate wetting and
drying. PU, UB and NPK represent broadcast prilled urea, urea
briquette deep placement and NPK briquette deep placement,
respectively. L, M and H in 2012 represent low, medium and
high N rates, respectively. Experiments in 2012 were conducted
only under CSW condition
Nutr Cycl Agroecosyst (2016) 104:53–66 57
123
Author's personal copy
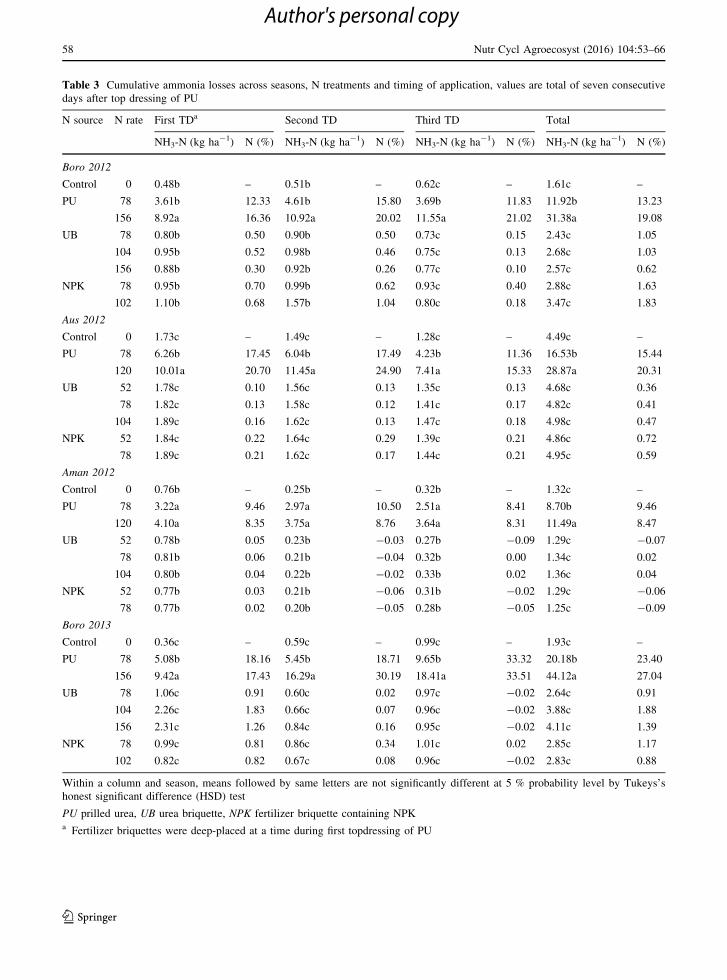
Table 3 Cumulative ammonia losses across seasons, N treatments and timing of application, values are total of seven consecutive
days after top dressing of PU
N source N rate First TDa Second TD Third TD Total
NH3-N (kg ha-1) N (%) NH3-N (kg ha-1) N (%) NH3-N (kg ha-1) N (%) NH3-N (kg ha-1) N (%)
Boro 2012
Control 0 0.48b – 0.51b – 0.62c – 1.61c –
PU 78 3.61b 12.33 4.61b 15.80 3.69b 11.83 11.92b 13.23
156 8.92a 16.36 10.92a 20.02 11.55a 21.02 31.38a 19.08
UB 78 0.80b 0.50 0.90b 0.50 0.73c 0.15 2.43c 1.05
104 0.95b 0.52 0.98b 0.46 0.75c 0.13 2.68c 1.03
156 0.88b 0.30 0.92b 0.26 0.77c 0.10 2.57c 0.62
NPK 78 0.95b 0.70 0.99b 0.62 0.93c 0.40 2.88c 1.63
102 1.10b 0.68 1.57b 1.04 0.80c 0.18 3.47c 1.83
Aus 2012
Control 0 1.73c – 1.49c – 1.28c – 4.49c –
PU 78 6.26b 17.45 6.04b 17.49 4.23b 11.36 16.53b 15.44
120 10.01a 20.70 11.45a 24.90 7.41a 15.33 28.87a 20.31
UB 52 1.78c 0.10 1.56c 0.13 1.35c 0.13 4.68c 0.36
78 1.82c 0.13 1.58c 0.12 1.41c 0.17 4.82c 0.41
104 1.89c 0.16 1.62c 0.13 1.47c 0.18 4.98c 0.47
NPK 52 1.84c 0.22 1.64c 0.29 1.39c 0.21 4.86c 0.72
78 1.89c 0.21 1.62c 0.17 1.44c 0.21 4.95c 0.59
Aman 2012
Control 0 0.76b – 0.25b – 0.32b – 1.32c –
PU 78 3.22a 9.46 2.97a 10.50 2.51a 8.41 8.70b 9.46
120 4.10a 8.35 3.75a 8.76 3.64a 8.31 11.49a 8.47
UB 52 0.78b 0.05 0.23b -0.03 0.27b -0.09 1.29c -0.07
78 0.81b 0.06 0.21b -0.04 0.32b 0.00 1.34c 0.02
104 0.80b 0.04 0.22b -0.02 0.33b 0.02 1.36c 0.04
NPK 52 0.77b 0.03 0.21b -0.06 0.31b -0.02 1.29c -0.06
78 0.77b 0.02 0.20b -0.05 0.28b -0.05 1.25c -0.09
Boro 2013
Control 0 0.36c – 0.59c – 0.99c – 1.93c –
PU 78 5.08b 18.16 5.45b 18.71 9.65b 33.32 20.18b 23.40
156 9.42a 17.43 16.29a 30.19 18.41a 33.51 44.12a 27.04
UB 78 1.06c 0.91 0.60c 0.02 0.97c -0.02 2.64c 0.91
104 2.26c 1.83 0.66c 0.07 0.96c -0.02 3.88c 1.88
156 2.31c 1.26 0.84c 0.16 0.95c -0.02 4.11c 1.39
NPK 78 0.99c 0.81 0.86c 0.34 1.01c 0.02 2.85c 1.17
102 0.82c 0.82 0.67c 0.08 0.96c -0.02 2.83c 0.88
Within a column and season, means followed by same letters are not significantly different at 5 % probability level by Tukeys’s
honest significant difference (HSD) test
PU prilled urea, UB urea briquette, NPK fertilizer briquette containing NPKa Fertilizer briquettes were deep-placed at a time during first topdressing of PU
58 Nutr Cycl Agroecosyst (2016) 104:53–66
123
Author's personal copy

similar in all three split measurements. Similarly,
magnitudes and pattern of the NH4?-N in floodwater
were similar between CSW and AWD conditions
during Boro 2013.
Ammonia volatilization was calculated using flood-
water ammonium, temperature and wind speed. As
with floodwater ammonium, magnitudes of ammonia
loss from deep-placed treatments were negligible.
They were significantly higher from broadcast treat-
ments compared with deep-placed treatments, which
increased with increasing N rates (Table 3).
Rice growth, yield and agronomic efficiency
Biomass accumulation at panicle initiation (PI),
heading and maturity stages during different rice-
growing seasons are shown in Figs. 3 and 4. In
general, total biomass accumulation at all growth
stages increased with N rate irrespective of method of
application. At each growth stage, response of
increasing N rate on biomass accumulation was more
distinct at PU treatments (except during Aus 2012)
compared with deep-placed treatments. In deep-
placed treatments, increase in total biomass accumu-
lation was higher at lower N rates; therefore, increas-
ing N rates had lower response, indicating more
efficient use of N at lower rate.
The ANOVA of grain yield and yield components
and their mean comparison is shown in Table 4.
Response of N rates on grain yield was not consistent
among the seasons. Generally, grain yield increased
with N rate in PU during Aman and Boro seasons but
not during the Aus season; while for FDP treatments,
increasing N rate did not have significant effects on
grain yield in any season. Nevertheless, in Aman
season, deep placement of UB52 and NPK 52
significantly increased grain yield by 8–15 % com-
pared to PU78. However, during the Aus season, a
grain yield increase of 5–12 % was not significantly
different for UB52 and NPK52 versus PU78.
During the Boro season, UB78 or NPK78 increased
grain yield by 40–46 % in 2012 and by 29–39 % in
2013 over PU78. Deep placement of UB156 increased
yield by only 11 % over PU156. Though the NPK
deep placement increased grain yields significantly
over broadcast PU, it did not have significant yield
Dry matter accumulation N uptake
048
1216
N0 N78 N156 N78 N104 N156 N78 N102
Control PU UB NPK
Dry
mat
ter (
t ha
-1) PI Maturity
20
60
100
140
N0 N78 N156 N78 N104 N156 N78 N102
Control PU UB NPK
N u
ptak
e (k
g ha
-1) PI Maturity
0
4
8
12
N0 N78 N120 N52 N78 N104 N51 N78
Control PU UB NPK
Dry
mat
ter (
t ha-1
)
PI Heading Maturity
0
40
80
120
N0 N78 N120 N52 N78 N104 N51 N78
Control PU UB NPK
N u
ptak
e (k
g ha
-1) PI Heading Maturity
0
4
8
12
N0 N78 N120 N52 N78 N104 N51 N78
Control PU UB NPK
Dry
mat
ter (
t ha-1
)
PI Heading Maturity
0
40
80
120
N0 N78 N120 N52 N78 N104 N51 N78
Control PU UB NPK
N u
ptak
e (k
g ha
-1) PI Heading Maturity
Boro 2012
Aus 2012
Aman 2012
cb ab ab ab a ab ab
cb
a a a a a a
ba
a a aa
aba
d
c
b bab
a
bab
c ab aabcbc aabc abb b ba a a a a
c
b baa
ba
b
c b b a a a a ad cd cb b ab ab a
d
c bc abc ab a abcc
d c bc ab abc a abc abce
cd d bc ab acd ab
d
cab bc ab a bc ab
bab
a a aba aabd
c bc bc aba
c
ab
c
bab ab ab
ab ab
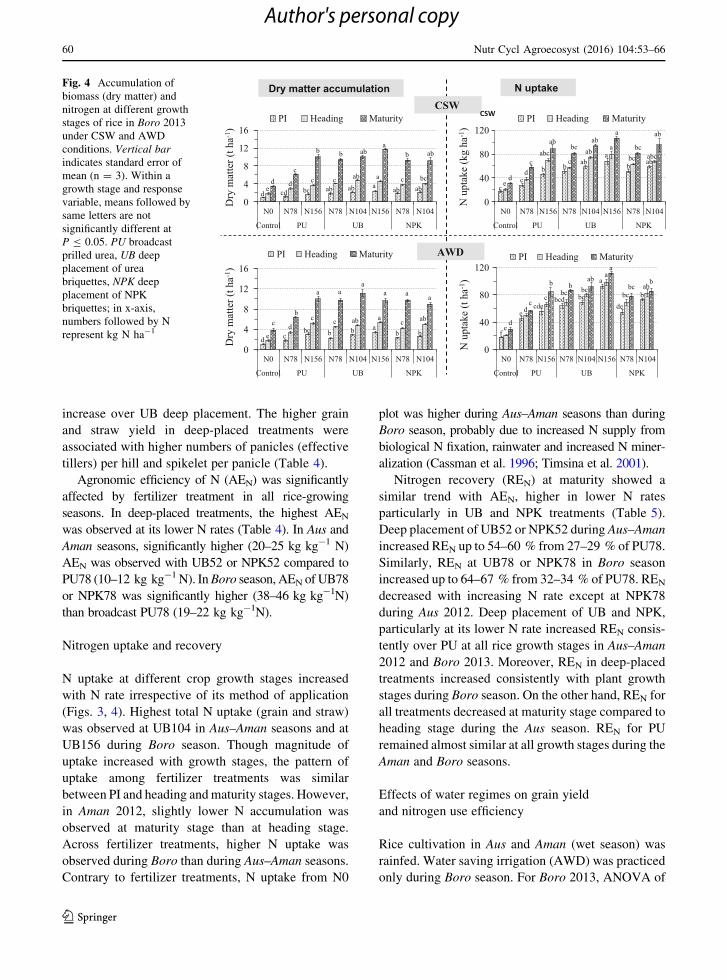
Fig. 3 Accumulation of
biomass (dry matter) and
nitrogen at different growth
stages of rice in Boro, Aus
and Aman seasons in 2012.
Vertical bar indicates
standard error of mean
(n = 3). Within a growth
stage and response variable,
means followed by same
letters are not significantly
different at P B 0.05. All
experiments were conducted
under CSW conditions. PU
broadcast prilled urea, UB
deep placement of urea
briquettes, NPK deep
placement of NPK
briquettes; in x-axis,
numbers followed by N
represent kg N ha-1
Nutr Cycl Agroecosyst (2016) 104:53–66 59
123
Author's personal copy
increase over UB deep placement. The higher grain
and straw yield in deep-placed treatments were
associated with higher numbers of panicles (effective
tillers) per hill and spikelet per panicle (Table 4).
Agronomic efficiency of N (AEN) was significantly
affected by fertilizer treatment in all rice-growing
seasons. In deep-placed treatments, the highest AEN
was observed at its lower N rates (Table 4). In Aus and
Aman seasons, significantly higher (20–25 kg kg-1 N)
AEN was observed with UB52 or NPK52 compared to
PU78 (10–12 kg kg-1 N). InBoro season, AEN of UB78
or NPK78 was significantly higher (38–46 kg kg-1N)
than broadcast PU78 (19–22 kg kg-1N).
Nitrogen uptake and recovery
N uptake at different crop growth stages increased
with N rate irrespective of its method of application
(Figs. 3, 4). Highest total N uptake (grain and straw)
was observed at UB104 in Aus–Aman seasons and at
UB156 during Boro season. Though magnitude of
uptake increased with growth stages, the pattern of
uptake among fertilizer treatments was similar
between PI and heading andmaturity stages. However,
in Aman 2012, slightly lower N accumulation was
observed at maturity stage than at heading stage.
Across fertilizer treatments, higher N uptake was
observed during Boro than during Aus–Aman seasons.
Contrary to fertilizer treatments, N uptake from N0
plot was higher during Aus–Aman seasons than during
Boro season, probably due to increased N supply from
biological N fixation, rainwater and increased N miner-
alization (Cassman et al. 1996; Timsina et al. 2001).
Nitrogen recovery (REN) at maturity showed a
similar trend with AEN, higher in lower N rates
particularly in UB and NPK treatments (Table 5).
Deep placement of UB52 or NPK52 during Aus–Aman
increased REN up to 54–60 % from 27–29 % of PU78.
Similarly, REN at UB78 or NPK78 in Boro season
increased up to 64–67 % from 32–34 % of PU78. REN
decreased with increasing N rate except at NPK78
during Aus 2012. Deep placement of UB and NPK,
particularly at its lower N rate increased REN consis-
tently over PU at all rice growth stages in Aus–Aman
2012 and Boro 2013. Moreover, REN in deep-placed
treatments increased consistently with plant growth
stages during Boro season. On the other hand, REN for
all treatments decreased at maturity stage compared to
heading stage during the Aus season. REN for PU
remained almost similar at all growth stages during the
Aman and Boro seasons.
Effects of water regimes on grain yield
and nitrogen use efficiency
Rice cultivation in Aus and Aman (wet season) was
rainfed. Water saving irrigation (AWD) was practiced
only during Boro season. For Boro 2013, ANOVA of
Dry matter accumulation N uptakeCSW
AWD
0
4
8
12
16
N0 N78 N156 N78 N104 N156 N78 N104
Control PU UB NPKD
ry m
atte
r (t h
a-1)
PI Heading Maturity
0
4
8
12
16
N0 N78 N156 N78 N104 N156 N78 N104
Control PU UB NPK
Dry
mat
ter (
t ha-1
)
PI Heading Maturity
0
40
80
120
N0 N78 N156 N78 N104 N156 N78 N104
Control PU UB NPK
N u
ptak
e (k
g ha
-1)
CSW PI Heading Maturity
0
40
80
120
N0 N78 N156 N78 N104 N156 N78 N104
Control PU UB NPK
N u
ptak
e (t
ha-1
)
PI Heading Maturity
d cbc b b a
b b
d cd bc ab ab a ab ab
ed
c ab a c ab
ed c c ab a c bc
cb
a aa
a a a
dc
b b aba
b ab
f
ecde
bcd bc
a
deb
cc
b bab
ab ab
e
d
cbc bc
a
bcab
ed
abcc
ab abc abc
d
c
b bab
a
bcb
c
d
c
abbc
aba
bc
ab
Fig. 4 Accumulation of
biomass (dry matter) and
nitrogen at different growth
stages of rice in Boro 2013
under CSW and AWD
conditions. Vertical bar
indicates standard error of
mean (n = 3). Within a
growth stage and response
variable, means followed by
same letters are not
significantly different at
P B 0.05. PU broadcast
prilled urea, UB deep
placement of urea
briquettes, NPK deep
placement of NPK
briquettes; in x-axis,
numbers followed by N
represent kg N ha-1
60 Nutr Cycl Agroecosyst (2016) 104:53–66
123
Author's personal copy

Table 4 Grain yield, yield components and agronomic efficiency (AEN) in different fertilizer treatments in Boro, Aus and Aman
2012 and Boro 2013
N source N rate Grain yield
(t ha-1)aEffective
tillers hill-2Spikelets
panicle-11000 grain
weight (g)
Agronomic
efficiency (AEN)
Boro 2012
Control 0 3.03c 8.2d 96c 23.7a –
PU 78 4.57b 13.2b 140ab 24.3a 19.7c
156 6.04a 13.2b 147ab 23.4a 19.3c
UB 78 6.66a 9.7cd 120bc 23.9a 46.5a
104 6.75a 11.6bc 142ab 23.6a 35.7b
156 6.68a 13.0b 138ab 23.6a 23.4c
NPK 78 6.41a 14.2ab 135ab 23.9a 43.3ab
102 6.69a 16.0a 159a 23.8a 35.9b
Aus 2012
Control 0 3.50c 7.5b 77a 22.8b –
PU 78 4.37ab 8.9ab 84a 23.5ab 11.1ab
120 4.13b 9.8a 81a 23.8a 5.3b
UB 52 4.73ab 10.0a 91a 23.5a 23.7a
78 4.63ab 9.8a 87a 23.4ab 14.4ab
104 4.57ab 10.0a 88a 23.9a 10.3ab
NPK 52 4.57ab 10.0a 92a 23.5a 21.0a
78 4.93a 9.7a 93a 23.7a 18.4ab
Aman 2012
Control 0 2.12c 6.6d 56c 25.9a –
PU 78 2.97b 7.2cd 59bc 29.4a 10.8b
120 3.71a 8.5a 71a 25.9a 13.2ab
UB 52 3.42ab 7.5abcd 69ab 28.1a 25.0a
78 3.58ab 8.0abc 71a 27.4a 18.8ab
104 3.95a 7.7abcd 74a 29.3a 17.5ab
NPK 52 3.34ab 7.3bcd 67ab 28.8a 23.9a
78 3.80a 8.3ab 76a 26.6a 21.5ab
Boro 2013 (Averageof CSW and AWD)
Control 0 2.37d 7.3d 66d 22.0b –
PU 78 4.07c 9.3c 91c 22.4ab 21.9c
156 5.55ab 10.5bc 97bc 23.0ab 20.4c
UB 78 5.68ab 11.7ab 111a 22.5ab 42.4a
104 6.00a 12.2a 107a 22.3ab 34.9b
156 6.14a 12.1ab 105ab 23.6a 24.2c
NPK 78 5.24b 11.8ab 105ab 23.0ab 36.8ab
102 5.55ab 11.8ab 102ab 23.1ab 31.2b
ANOVA (Boro 2013)
Water regime (W) NS NS NS NS NS
Fertilizer treatment (T) * * * * *
W 9 T NS NS NS NS NS
Within a column and season, means followed by same letters are not significantly different at 5 % probability level by Tukeys’s
honest significant difference (HSD) test
AEN agronomic efficiency (kg grain/kg N), CSW continuous standing water, AWD alternate wetting and drying, PU prilled urea, UB
urea briquette, NPK fertilizer briquette containing NPK
* Significant difference at P B 0.05a Grain yield is at 14 % moisture content
Nutr Cycl Agroecosyst (2016) 104:53–66 61
123
Author's personal copy

biomass yield, N uptake and AEN was done separately
to see the effect of water management and its
interaction with fertilizer treatments (Table 4).
Though all the parameters were affected by fertilizer
treatments, none of them was affected by water
management. However, significant interaction was
observed between fertilizer treatment and water
regime on aboveground biomass (Fig. 4). Straw yield
and total aboveground biomass were significantly
higher in UB N156 under CSW condition.
Discussion
Dynamics of ammonium in floodwater
and ammonia volatilization
Deep placement of UB and NPK significantly reduced
the amount of NH4?-N in floodwater (Fig. 2). When
fertilizer briquettes were deep-placed, the movement
of NH4? from the deep soil layer to the soil’s surface
or floodwater was very slow (Fig. 2; Rochette et al.
2013). Therefore, a very low to negligible amount of
floodwater NH4?-N was observed in UB and NPK. On
the other hand, in broadcast PU, a significant amount
of NH4? from urea hydrolysis was present in flood-
water and could be lost via NH3 volatilization and
surface run off. The amount of floodwater NH4?-N
could be a good indicator to estimate potential NH3
volatilization loss (Hayashi et al. 2006; Rochette et al.
2013). This was evident from estimated NH3
volatilization which showed a similar trend with
floodwater ammonium, i.e., significantly higher emis-
sions from PU treatments compared to deep-placed
treatments (Table 3). This trend was consistent across
all rice-growing seasons. However, in addition to
floodwater NH4-N, the NH3 volatilization can be
affected by other factors including pH, water temper-
ature, water depth and wind speed (Hayashi et al.
2008). Since these factors changes with season (and
site), the magnitudes of NH3 volatilization may vary
across seasons.
The sharp decline in the amount of floodwater
NH4?-N from 2 to 3 days after urea broadcast may be
attributed to volatilization loss, diffusion of NH4?-N
into soil, and/or nitrification in the oxidized soil layer
(Kapoor et al. 2008). Watanabe et al. (2009) observed
similar results, peaks in the ammonia flux at 1–3 days
of urea application followed by a sharp decline. This
clearly suggests that the NH4?-N present in floodwater
is volatilized, nitrified to nitrate, and plant uptake
(Figs. 3, 4); thus, its magnitude decreased sharply
after its peak at 2–3 days of application. Since there is
negligible floodwater NH4?-N in UB and NPK
Table 5 Changes in recovery efficiency of fertilizer N over
crop growth stages, N treatments and seasons
N source N rate Recovery efficiency (REN)
PI Heading Maturity
Boro 2012
PU 78 0.40a – 0.32bc
156 0.31a – 0.31c
UB 78 0.21a – 0.67a
104 0.22a – 0.57ab
156 0.23a – 0.52abc
NPK 78 0.31a – 0.65a
102 0.34a – 0.67a
Aus 2012
PU 78 0.18d – 0.27bc
120 0.20 cd – 0.21c
UB 52 0.37ab – 0.54a
78 0.25bcd – 0.53a
104 0.24 cd – 0.42ab
NPK 52 0.38a – 0.37abc
78 0.30abc – 0.45ab
Aman 2012
PU 78 0.37a 0.35bc 0.29c
120 0.33a 0.27c 0.26c
UB 52 0.42a 0.70a 0.60a
78 0.17a 0.56a 0.46ab
104 0.21a 0.53ab 0.42abc
NPK 52 0.29a 0.51ab 0.55ab
78 0.26a 0.57a 0.41bc
Boro 2013 (CSW)
PU 78 0.20b 0.22d 0.34b
156 0.27ab 0.31 cd 0.37b
UB 78 0.43a 0.46ab 0.64a
104 0.40a 0.51a 0.60a
156 0.32ab 0.37bc 0.48ab
NPK 78 0.43a 0.56a 0.63a
102 0.40a 0.45ab 0.63a
Within a column and season, means followed by same letters
are not significantly different at 5 % probability level by
Tukeys’s honest significant difference (HSD) test
REN recovery efficiency (kg N uptake/kg N), PU prilled urea,
UB urea briquette, NPK fertilizer briquette containing NPK
62 Nutr Cycl Agroecosyst (2016) 104:53–66
123
Author's personal copy

treatments irrespective of N rates and seasons, deep
placement can significantly reduce potential N losses
from ammonia volatilization and surface run off over
broadcast PU.
Effects of FDP on rice growth and yield
The benefits of UB deep placement (commonly called
urea deep placement, UDP)—increased NUE, 30 %
urea-savings and increased grain yield compared to
broadcast application in lowland rice fields—are well
documented. In this study, deep placement of either
UB or NPK significantly (P\ 0.05) increased the
grain yield at 52 kg N ha-1 during Aus–Aman and at
78 kg N ha-1 duringBoro comparedwith broadcast PU.
These results are in close agreement with previous
studies (Kapoor et al. 2008;Mohanty et al. 1999) that UB
deep placement saves urea by up to 50 % compared to
broadcast PU without significant yield loss. The yield
advantage, particularly at lower N rate, could be
attributed to increased plant uptake or doubling of the
fertilizer N recovery (Table 4). There was a significant
positive correlation between grain yield and N recovery
(R2 = 0.52, P\0.001), particularly during Boro sea-
son. Several field research conducted in Bangladesh
showed that UB deep placement with 30 % less urea
produced up to 20 % higher yield (Savant and Stangel
1990; Gregory et al. 2010; IFDC 2013). Therefore,
recommendedN rate for rice in this region, based on past
fertilizer trials, was adjusted to 30 % less at 52 and
78 kg N ha-1 for UB deep placement, compared to 78
and 112 kg N ha-1 of broadcast PU, for Aus–Aman and
Boro seasons, respectively (FRG 2012). Our results
confirm that the UB52 and UB78 recommendations
could continue for increasing grain yields and NUE in
Aus–Aman and Boro, respectively, in areas with climate,
soils and management similar to this experimental site.
Though UB deep placement has been practiced for
a long time in Bangladesh, the deep placement of NPK
briquettes to farmers has recently been introduced.
One of the major benefits of NPK deep placement over
UB deep placement is to ensure balanced fertilization.
Apart from the agronomic and environmental benefits
that are achieved with UB, NPK deep placement
eliminates the need for multiple fertilizer applications,
as is the standard practice, and consolidates the labor
requirement compared to UB deep placement and
broadcast incorporation of P and K. Deep placement of
NPK in Bangladesh is being practiced not only in rice,
but also in upland crops (Azam et al. 2012; Islam et al.
2011; IFDC 2015; Miah et al. 2015). Moreover, its
application is expanding in other south-east Asian
countries such as Cambodia (Bhattarai et al. 2010).
The use of multi-nutrient fertilizer briquettes is also
reported in India where deep placement of urea-DAP
briquettes increased grain yield by 45–89 % over
farmers’ practice and by 27–52 % over recommended
management practice (Daftardar et al. 1997). Simi-
larly, Kapoor et al. (2008) observed increased grain
yields and NUE by NPK deep placement over UDP in
eastern India. Contrary to their study, NPK response
was similar to UDP in this study, probably because the
soil had low available P (3 mg kg-1), which might
have affected plant P uptake due to the time lag for the
roots to access deep-placed P versus uniformly-
broadcast P, particularly during early plant establish-
ment. This may result in poor crop growth and affect
yields. Such an effect will be crucial for soils with low
to very low P status (Kapoor et al. 2008). Thus, the
deep placement of P and K should be site specific and
generally not recommended for soils with very low P
and K status in terms of rice yield response. In spite of
low P status, our results showed that the deep
placement of NPK did not have any significant
negative effects on the yields compared with UB deep
placement and significantly increased rice yields over
broadcast PU. Nevertheless, NPK may have signifi-
cant effects over UB in farmers’ fields because farmers
use more N and less P and K fertilizers. Use of NPK
ensures a balanced supply of nutrients and increased
yields as well as soil fertility. Miah et al. (2015)
evaluated UB and NPK across different districts in
southern Bangladesh where NPK increased grain yield
and economic returns compared to UB.
Comparison of NUE between broadcast and deep
placement
Across all the seasons, total N uptake was higher with
FDP (UB and NPK) at each application rate compared
with broadcast PU following the same trend with total
biomass. Higher N uptake in deep-placed treatments
might be due to increased availability of applied N
(lower N losses) for plant growth resulting in
increased N content of straw and grain (data not
shown) and increased aboveground biomass (Figs. 3,
4). The total N uptake (including straw) in this study
ranged from 13 to 18 kg per ton of rough rice similar
Nutr Cycl Agroecosyst (2016) 104:53–66 63
123
Author's personal copy

with the ranges reported in previous studies (Choud-
hury and Kennedy 2005; Kapoor et al. 2008; Dong
et al. 2012).
UB and NPK increased N recovery efficiency by
almost double and agronomic N efficiency by up to
29 % (kg grain kg-1 N) over broadcast PU. At
78 kg N ha-1 (Boro), UDP increased N recovery up
to 64–67 % from 35 % of broadcast PU. Even with a
single fertilizer application, N recovery consistently
increased up to heading to maturity stages (Table 4)
suggesting that deep placement supplied N continu-
ously throughout the growing period. These results
also confirmed that deep placement of NPK is equally
effective as UB for increasing fertilizer N use
efficiency in lowland rice fields as compared with
the broadcast PU. The increase in NUE could be
mainly due to reduction of losses from NH3 volatiliza-
tion, surface run off, nitrification and denitrification
(Savant and Stangel 1990; Mohanty et al. 1999),
which was evident from negligible amount of NH4? in
floodwater (Fig. 2), estimated NH3 volatilization loss
and increased plant uptake and N recovery (Table 3).
When N is deep-placed in a reduced zone (anaerobic
zone), most of the N is retained in soil as NH4?-N for a
longer time, ensuring continuous availability of N for
the rice crop (Kapoor et al. 2008). Increased NUEwith
UB was also reported in West Africa (Bandaogo et al.
2014). In general, decreased AEN and REN are
expected when N rate is increased beyond the
recommended rates with greater opportunities for N
losses. Generally, losses increase when N is applied in
excess of plant uptake (Liang et al. 2013).
Effects of water regimes
Most previous studies have shown that the water-
saving AWD irrigation practice has no significant
effect on grain yield compared to farmer practice, i.e.,
continuous flooding. In a recent review study, Lam-
payan et al. (2015) reported that AWD saves irrigation
water by up to 38 % without reducing grain yields. In
this study, water regime had no significant effect on
grain yields in any fertilizer treatments because soil
drying in AWD plots was very mild, which did not
affect rice growth. However, only one season of data
would not be sufficient to see the long-term effects of
AWD on rice production as well as changes in soil
fertility status such as organic C and N. More studies
are needed to understand the interaction effect of
AWD and FDP for sustainable rice production while
coping with water scarcity.
Conclusions
Deep placement of UB and NPK significantly reduced
floodwater NH4-N and NH3 volatilization compared
with broadcast PU. Across seasons and years, UB and
NPK increased grain yields and NUE (AEN and REN)
over broadcast PU. The effect of deep placement on
grain yield was distinct and significant at lower N rates
than that of higher rates and in Boro season than in
Aus–Aman. Among all rice-growing seasons (except
Aus 2012), increase N rate in PU increased yields
significantly. But in deep-placed treatments, the
effects of increasing N rates on grain yields were not
significant, confirming the current N recommendation
rate for FDP as used in this study is appropriate.
Significantly higher N recovery efficiency (P\ 0.05)
was observed in deep-placed treatment at its recom-
mended N rates (52 kg N ha-1 in Aus–Aman and
N78 kg N ha-1 in Boro) than broadcast PU (64–72 vs
32–35 %). Since grain yield at UB or NPK at 52 kg or
78 kg N ha-1 was not significantly different com-
pared with PU120 or PU156, deep placement may
save up to 50 % urea without any yield penalty.
The difference in grain yields and NUE between
UB and NPK were not significant. However, deep
placement of NPK in farmers’ fields increased grain
yield and nutrient use efficiency and net economic
returns (Miah et al. 2015). Based on grain yield and
NUE, the existing recommended N rate 52 kg N ha-1
for Aus and Aman seasons and 78 kg N ha-1 for Boro
as UB or NPK could be continued for rice production
in the areas with soils, climate and management
similar to this study site. On the other hand, AWD did
not have significant effects on grain yields and NUE,
suggesting that deep placement is equally effective
under AWD conditions. Combination of both FDP and
AWD technologies in rice cultivation could increase
fertilizer use efficiency, save water (Boro season) and
increase grain yields. However, these results were
from the experiment conducted in one location, more
studies across different soils, climate and management
practices are needed to understand the site and season
specific response of fertilizer and water management
and their possible interaction effects on yields, NUE
and soil fertility.
64 Nutr Cycl Agroecosyst (2016) 104:53–66
123
Author's personal copy

Acknowledgments The United States Agency for
International Development (USAID) provided support for this
research through the project ‘‘Accelerating Agriculture
Productivity Improvement-Integrating Greenhouse Gas
Emissions Mitigation into the Feed the Future Bangladesh
Fertilizer Deep Placement Rice Intensification (cooperative
agreement number AID-388-A-10-00002).’’
References
Azam MG, Mahmud JA, Ahammad KU, Gulandaz MA, Islam
M (2012) Proficiency and profitability of potato as affected
by urea super granule (USG) as a source of nitrogen in high
Ganges river floodplain of Bangladesh. Int J Sustain Crop
Prod 7:28–30
Bandaogo A, Bidjokazo F, Youl S, Safo E, Abaidoo R, Andrews
O (2014) Effect of fertilizer deep placement with urea
supergranule on nitrogen use efficiency in Sourou Valley
(Burkina Faso). Nutr Cycl Agroecosyst. doi:10.1007/
s10705-014-9653-6
Bhattarai SP, Palada MC, Midmore DJ, Wu D, Salas R (2010)
On-farm evaluation of fertilizer briquettes and low-cost
drip irrigation for smallholder vegetable production in
Cambodia. Irrig Drain 60:318–329. doi:10.1002/ird.571
Buresh RJ, Reddy KR, van Kessel C (2008) Nitrogen transfor-
mation in submerged soils. In: Schepers JS, RaunWR (eds)
Nitrogen in agricultural systems. Agronomy monograph
49, ASA, CSSA, and SSSA, Madison, p 401
Cassman KG, Dobermann A, Sta Cruz PC, Gines GC, Samson
MI, Descalsota JP, Alcantara JM, Dizon MA, Olk DC
(1996) Soil organic matter and the indigenous nitrogen
supply of intensive irrigated rice systems in the tropics.
Plant Soil 182:267–278
Chien SH, Prochnow LI, Cantarella H (2009) Recent develop-
ment of fertilizer production and use to improve nutrient
efficiency and minimize environmental impacts. Adv
Agron 102:267–322. doi:10.1016/S0065-2113(09)01008-6
Choudhury ATMA, Kennedy IR (2005) Nitrogen fertilizer
losses from rice soils and control of environmental pollu-
tion problems. Commun Soil Sci Plant Anal 36:1625–1639
Daftardar SY, Wagle SM, Savant NK (1997) Agronomic per-
formance of urea briquettes containing diammonium
phosphage in rainfed transplanted rice on farmers’ fields.
J Agric Sci 128:291–297
Dong NM, Brandt KK, Sorenson J, Hung NN, Hach CV, Tan PS,
Dalsgaard T (2012) Effects of alternate wetting and drying
versus continuous flooding on fertilizer nitrogen fate in rice
fields in the Mekong Delta, Vietnam. Soil Biol Biochem
47:166–174
Freney JR, Simpson JR, Denmead OT (1983) Volatilization of
ammonia. In: Freney JR, Simpson JR (eds) Gasesous losses
of nitrogen from plant-soil systems. Martinuss Nijhoff, The
Hague, pp 1–52
Freney JR, Trevitt ACF, De Datta SK, Obcemea WN, Real JG
(1990) The interdependence of ammonia volatilization and
denitrification as nitrogen loss processes in flooded rice
fields in the Philippines. Biol Fertil Soils 9:31–36
FRG (2012) Fertilizer recommendation guide. Bangladesh Agri-
cultural Research Council (BARC), Farmgate, Dhaka 1215
Gaihre YK, Singh U, Islam SMM, Huda A, Islam MR, Satter
MA, Sanabria J, Islam Md R, Shah AL (2015) Impacts of
urea deep placement on nitrous oxide and nitric oxide
emissions from rice fields in Bangladesh. Geoderma
259–260:370–379
Gregory DI, Haefele SM, Buresh RJ, Singh U (2010) Fertilizer
use, markets, and management. In: Pandey S et al (eds)
Rice in the global economy: strategic research and policy
issues for food security. International Rice Research
Institute, Los Banos, pp 231–263
Hayashi K, Nishimura S, Yagi K (2006) Ammonia volatilization
from the surface of a Japanese paddy fields during rice
cultivation. Soil Sci Plant Nutr 52:545–555
Hayashi K, Nishimura S, Yagi K (2008) Ammonia volatilization
from a paddy field following applications of urea: rice
plants are both an absorber and an emitter for atmospheric
ammonia. Sci Total Environ 390:486–495
Hussain MJ, Ali MY, Rahman MA, Quayyum MA, Choudury
DA (2010) Effect of urea super granule on the performance
of cabbage in young Jamuna and Brahmaputra floodplain
soils of Tangail. Bangladesh J Agric Res 35:267–272
IFDC (International Fertilizer Development Center) (2013)
Fertilizer deep placement. IFDC solutions. IFDC, muscle
shoals, AL 35662 USA, p 6. http://issuu.com/ifdcinfo/
docs/fdp_8pg_final_web?e=1773260/1756718
IFDC (International Fertilizer Development Center) (2015) IFDC
Quarterly Magazine 40(4). http://ifdc.org/ifdc-magazine/
Islam MS, Rahman F, Hossain ATMS (2011) Effects of NPK
briquettes on rice (Oryza sativa) in tidal flooded ecosystem.
Agriculturists 9:37–43
Kapoor V, Singh U, Patil SK, Magre H, Shrivastava LK, Mishra
VN, Das RO, Samadhiya VK, Sanbria J, Diamond R (2008)
Rice growth, grain yield, and floodwater nutrient dynamics
as affected by nutrient placement method and rate. Agron J
100:526–536
Lampayan RM, Rejesus RM, Singleton RR, Bouman BAM
(2015) Adoption and economics of alternate wetting and
drying water management for irrigated lowland rice. Field
Crops Res 170:95–108
Liang XQ, Li H, Wang SX, Ye YS, Ji YJ, Tian GM, van Kessel
C, Linquist BA (2013) Nitrogen management to reduce
yield-scaled global warming potential in rice. Field Crops
Res 146:66–74
Miah Md AM, Gaihre YK, Hunter G, Singh U, Hossain SA
(2015) Fertilizer deep placement increases rice production
and economic returns in southern Bangladesh. Agron. J.
12:12. doi:10.2134/agronj2015.0170
Mohanty SK, Singh U, Balasubramanian V, Jha KP (1999)
Nitrogen deep-placement technologies for productivity,
profitability, and environmental quality of rainfed lowland
rice systems. Nutr Cycl Agroecosyst 53:43–57
Price AH, Norton GJ, Salt DE, Ebenhoeh O, Meharg AA,
Meharg C, Islam MR, Sarma RN, Dasgupta T, Ismail AM,
McNally KL, Zhang H, Dodd IC, Davies WJ (2013)
Alternate wetting and drying irrigation for rice in Bangla-
desh: is it sustainable and has plant breeding something to
offer? Food Energy Secur 2:120–129. doi:10.1002/fes3.29
Rochette P, Angers DA, Chantigny MH, Gasser MO,
MacDonald JD, Pelster DE, Bertrand N (2013) Ammonia
volatilization and nitrogen retention: how deep to incor-
porate urea? J Environ Qual 42:1635–1642
Nutr Cycl Agroecosyst (2016) 104:53–66 65
123
Author's personal copy
Savant NK, Stangel PJ (1990) Deep placement of urea super-
granules in transplanted rice: principles and practices.
Fertil Res 25:1–83
Singh U, Cassman KG, Ladha JK, Bronson KF (1995) Innova-
tive nitrogen management strategies for lowland rice sys-
tems. In: Fragile lives in fragile ecosystems. Proceedings of
the international rice research conference, 13–17 Feb 1995.
International Rice Research Institute, P.O. Box 933,
Manila, Philippines, pp 229–254
Singh U, Patil SK, Das RO, Padilla JL, Singh VP, Pal AR (1999)
Nitrogen dynamics and crop growth on an alfisol and a
vertisol under rainfed lowland rice-based cropping system.
Field Crop Res 61:237–252
SolorzanoL (1969)Determination of ammonia in natural waters by
phenolhypochloride method. Linnol Oceanogr 14:799–801
Sommer SG, Schjoerring JK, Denmead OT (2004) Ammonia
emission from mineral fertilizers and fertilized crops. Adv
Agron 82:557–622. doi:10.1016/S0065-2113(03)82008-4
Timsina J, Singh U, Badaruddin M, Meisner C, Amin MR
(2001) Cultivar, nitrogen, and water effects on productiv-
ity, and nitrogen-use efficiency and balance for rice-wheat
sequence of Bangladesh. Field Crop Res 72:143–161
Watanabe T, Son TT, Hung NN, Van Truong N, Giau TQ,
Hayashi K, Ito O (2009) Measurement of ammonia
volatilization from flooded paddy fields in Vietnam. Soil
Sci Plant Nutr 55:793–799. doi:10.1111/j.1747-0765.2009.
00419.x
Xiang J, Haden VR, Peng S, Bouman BAM, Huang J, Cui K,
Visperas RM, Zhu D, Zhang Y, Chen H (2013) Effect of
deep placement of nitrogen fertilizer on growth, yield, and
nitrogen uptake of aerobic rice. Aust J Crop Sci 7:870–877
Zhao X, Xie YX, Xiong ZQ, Yan XY, Xing GX, Zhu ZL (2009)
Nitrogen fate and environmental consequence in paddy soil
under rice-wheat rotation in the Taihu lake region, China.
Plant Soil 319:225–234. doi:10.1007/s11104-008-0865-0
66 Nutr Cycl Agroecosyst (2016) 104:53–66
123
Author's personal copy