0 pension plan risk management phil kivarkis, fsa, ea, cfa, director of investment policy services...
TRANSCRIPT

1
Pension Plan Risk Management
Phil Kivarkis, FSA, EA, CFA, Director of Investment Policy Services
Hewitt EnnisKnupp

2
Pension Funded Status – A Wild Ride
2008 Credit Crisis
US Debt Rating Downgrade
S&P 500 aggregate pension funded status shows considerable volatility, and two extreme events in three years

3
U.S. Equities Global Equities Bonds Alternatives Buy ProtectionAgainst Equity
Downside
Dynamic AssetAllocationStrategy
Our Survey Shows Broad Risk Management Focus
What changes have you made to your target investment strategy?
Source – Aon Hewitt Pension Risk Survey
38%
58%
4%
13%
68%
20%
65%
31%
10%
69%
21%
84%
14%
78%
21%
■ Reduce
■ No Change
■ Increase
3% 2% 0%
4
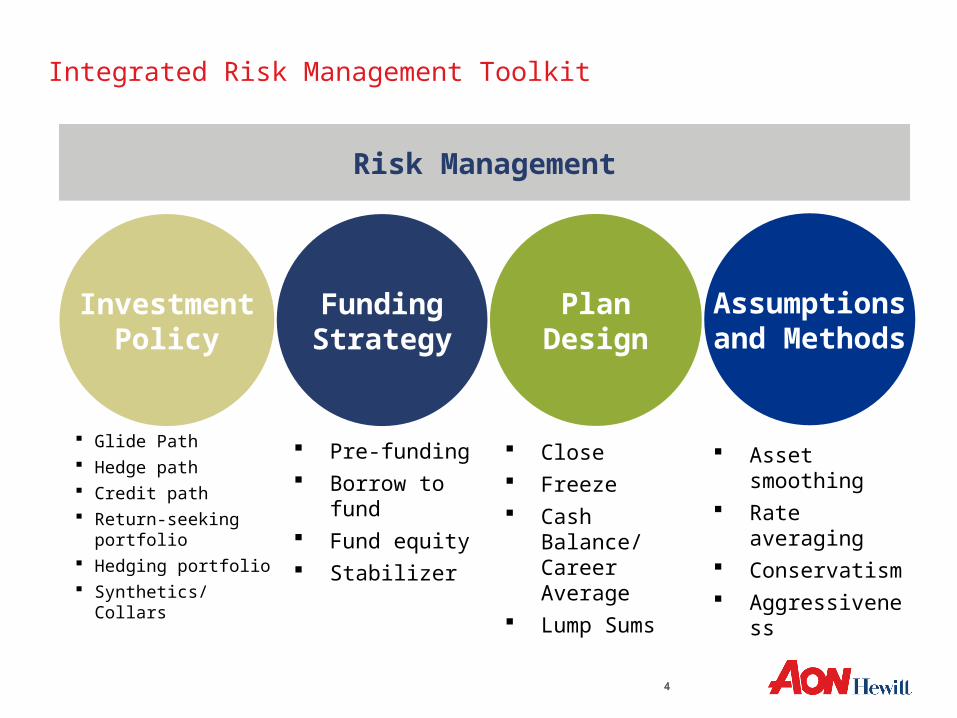
Integrated Risk Management Toolkit
Glide Path Hedge path Credit path Return-seeking
portfolio Hedging portfolio Synthetics/Collars
FundingStrategy
Assumptionsand Methods
InvestmentPolicy
PlanDesign
Risk Management
4
Pre-funding Borrow to fund Fund equity Stabilizer
Close Freeze Cash Balance/
Career Average Lump Sums
Asset smoothing Rate averaging Conservatism Aggressiveness
5
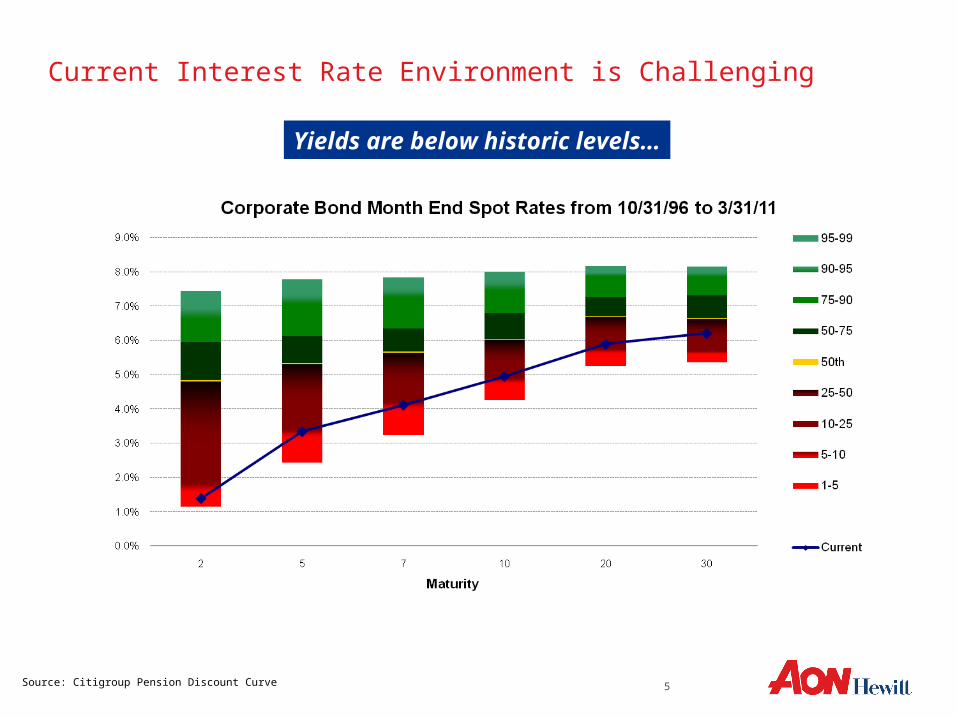
Current Interest Rate Environment is Challenging
Source: Citigroup Pension Discount Curve
Maturity
Yields are below historic levels…

6
Some Opportunities Exist
-4.0%
-3.0%
-2.0%
-1.0%
0.0%
1.0%
2.0%
3.0%
4.0%
5.0%
Feb
-77
Feb
-79
Feb
-81
Feb
-83
Feb
-85
Feb
-87
Feb
-89
Feb
-91
Feb
-93
Feb
-95
Feb
-97
Feb
-99
Feb
-01
Feb
-03
Feb
-05
Feb
-07
Feb
-09
Feb
-11
U.S. 30Y CMT less 2Y CMT
CMT = Constant Maturity Treasury
Very steep yield curve…
Favorable credit spreads…
Source: Barclays Capital

7
Pension Plans Have Already Begun to De-RiskAs Seen in Actual Allocations
Note: S&P 500, US plans only. Source: Goldman Sachs Global Markets Institute; Capital IQ; company reports.
5963
6463 62
56
45 4845
3127 28 28 28
32
41
35
35
6 6 5 6 68 9
14 16
4 4 3 3 4 4 53
4
0
10
20
30
40
50
60
70
2002 2003 2004 2005 2006 2007 2008 2009 2010(P)
In p
erce
nt
Equity
Debt
Other
Real Estate
Targets at 2010 year-end:Equity: 44%Debt: 36%Other: 14%Real Estate: 6%
Funded % 84% 90% 92% 101% 108% 79%93% 82% 86%
Stable allocation to equities took a sharp step down in 2007 despite rising share prices at that time.

8
Dynamic Investment Policy Components
Glide Path Dynamic
0
10
20
30
40
50
60
70
80
90
100
Funded Ratio
As
se
t A
llo
ca
tio
n,
%
Liability Matching Rebalancing Tolerance Return seeking Glide Path
Liability Matching
Return Seeking
Current State
End State

9
Probability of Outperforming Liabilities Over Three-Year Time Horizon
60%
64%
67%
69%
54%
56%
58%
60%
62%
64%
66%
68%
70%
Typical Return-Seeking Portfolio
Diversify Globally IncreasedActive/Credit Risk
Add Alternatives
Improving Your Odds
Source: Hewitt EnnisKnupp capital markets expectations

10
Why Customize?
Long Gov't / Credit
Core Bonds
Custom MandateLiabilities
0%
1%
2%
3%
4%
5%
6%
7%
0% 2% 4% 6% 8% 10%
Surplus Risk
Yie
ld t
o W
ors
t
More Effective HedgeStructural
Surplus Risk
Source: Hewitt EnnisKnupp
Illustrative Example
Improved Performance and More Effective Risk Management.
Custom MandateLong Credit – 80%
STRIPS 20+ yrs – 20%

11
Alternative to Immediate Extension: Two-Dimensional Glide Paths
Funded Ratio
ReturnNeeds
Return-SeekingAllocation
Hedge RatioInterest
Rate LevelDesiredDuration
First Dimension
Second Dimension
Two-Dimensional Glide Paths offer a way to manage a pension plan out of the current low interest rate environment.
12
0%
20%
40%
60%
80%
100%
120%
80% 85% 90% 95% 100%
Funded Ratio
Hed
ge
Rat
io
Glide Path Implied
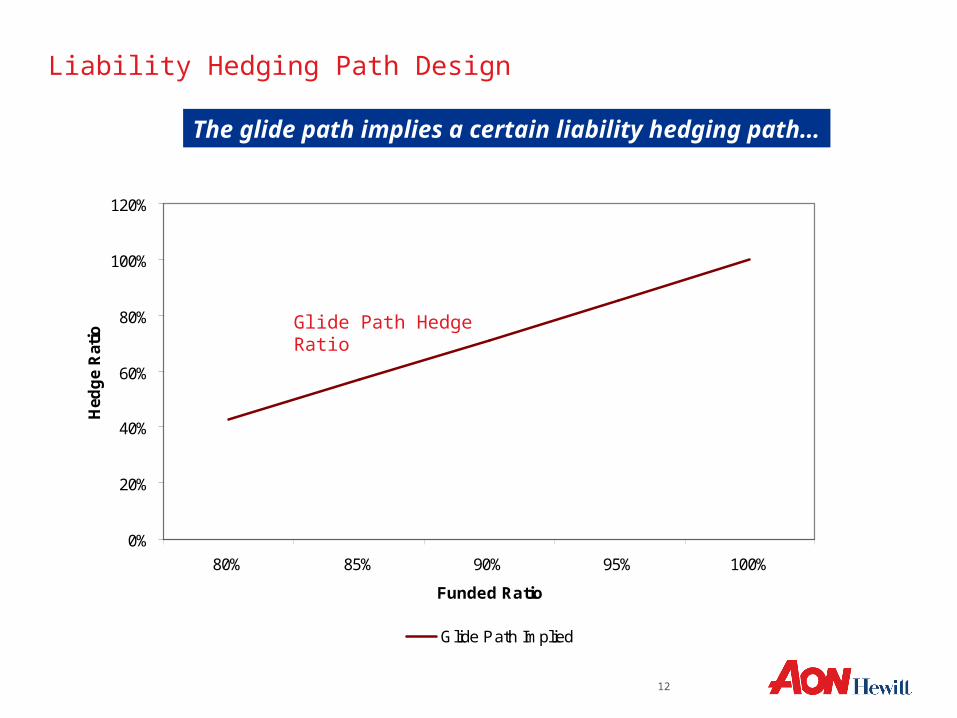
Liability Hedging Path Design
The glide path implies a certain liability hedging path…
Glide Path Hedge Ratio
13
0%
20%
40%
60%
80%
100%
120%
80% 85% 90% 95% 100%
Funded Ratio
Hed
ge
Rat
io
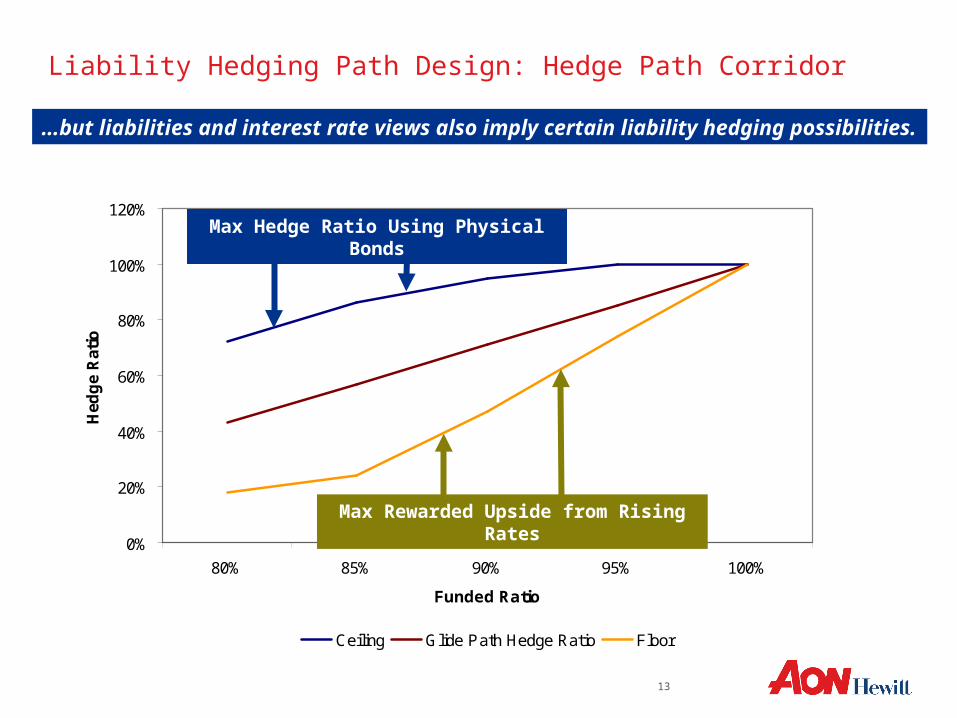
Ceiling Glide Path Hedge Ratio Floor
Liability Hedging Path Design: Hedge Path Corridor
Max Rewarded Upside from Rising Rates
Max Hedge Ratio Using Physical Bonds
…but liabilities and interest rate views also imply certain liability hedging possibilities.

14
Integration of Hedge Path and the Glide Path - Illustrative
Funded Ratio 80% 85% 90% 95% 100%
Discount Rate Level LHP % 53% 67% 79% 90% 100%
Significantly High (+200 bps) 72% 86% 95% 100% 100%
High (+100 bps) 58% 72% 83% 93% 100%
Fair Value 43% 57% 71% 85% 100%
Moderately Low (-50 bps) 35% 48% 65% 82% 100%
Low (-100 bps) 27% 38% 59% 80% 100%
Very Low (-150 bps) 19% 29% 53% 77% 100%
Significantly Low (-200 bps) 18% 24% 47% 74% 100%
Key Characteristics • Tailored to Plan glide path and funded ratio goals• Incorporates Client’s interest rate views (and ours)• Provides guidance while leaving flexibility to execute
• Market opportunities (medium term views)• Available instruments
15
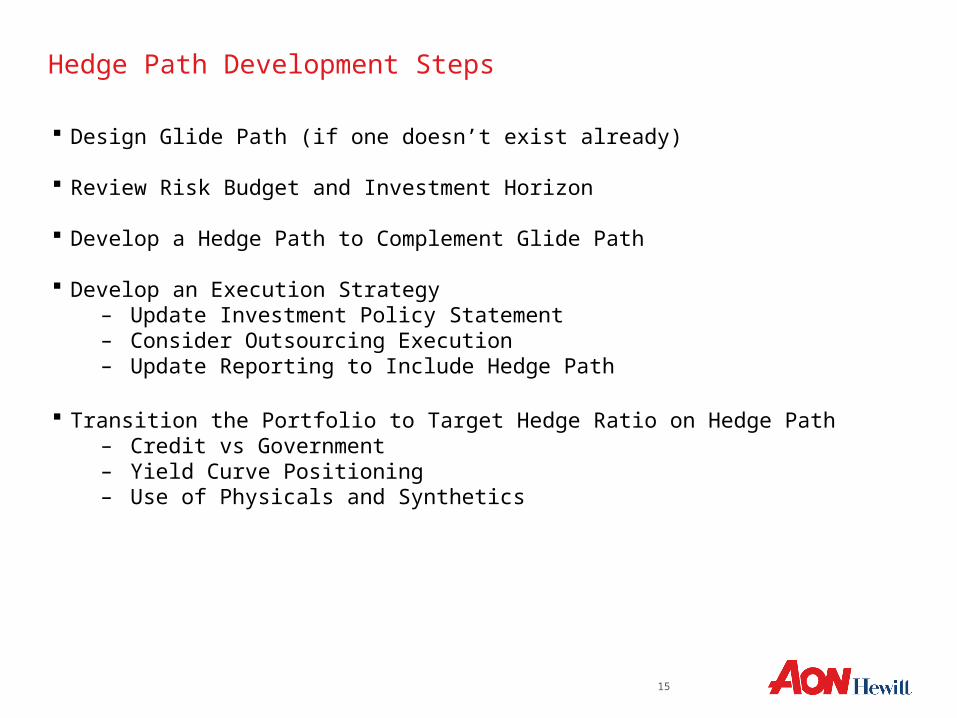
Hedge Path Development Steps
Design Glide Path (if one doesn’t exist already)
Review Risk Budget and Investment Horizon
Develop a Hedge Path to Complement Glide Path
Develop an Execution Strategy– Update Investment Policy Statement– Consider Outsourcing Execution– Update Reporting to Include Hedge Path
Transition the Portfolio to Target Hedge Ratio on Hedge Path– Credit vs Government– Yield Curve Positioning– Use of Physicals and Synthetics
16
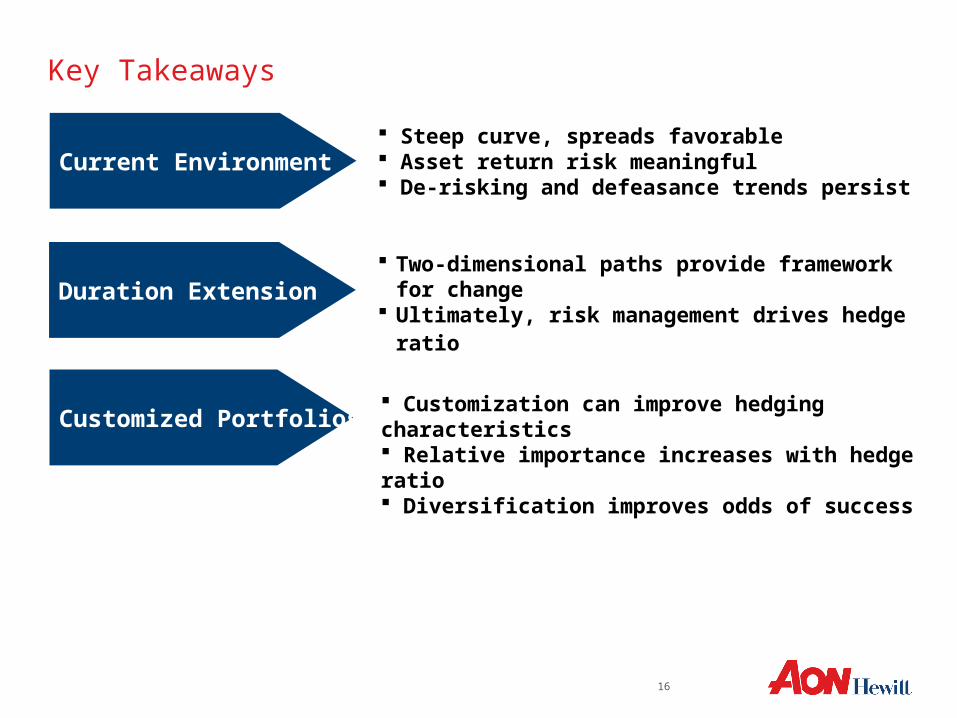
Key Takeaways
Current Environment
Duration Extension
Customized Portfolios
Steep curve, spreads favorable Asset return risk meaningful De-risking and defeasance trends persist
Two-dimensional paths provide framework for change
Ultimately, risk management drives hedge ratio
Customization can improve hedging characteristics Relative importance increases with hedge ratio Diversification improves odds of success