1 sdss-ii supernova survey josh frieman leopoldina dark energy conference october 8, 2008 see also:...
Post on 21-Dec-2015
214 views
TRANSCRIPT
1
SDSS-II Supernova Survey
Josh FriemanLeopoldina Dark Energy Conference
October 8, 2008
See also: poster by Hubert Lampeitl, talk by Bob Nichol
2
SN Models and Observations•SN cosmology based on a purely empirical approach (Phillips)
•SN observations over the last decade have strengthened evidence for cosmic acceleration, but dark energy constraints now dominated by systematic errors
•SNe will be one of 3 dark energy probes pursued by JDEM
•Reaching JDEM level of precision for SNe will require improved control of systematics
•Improved SN modeling, better empirical approaches to estimating SN distances, and better data are all important weapons in the arsenal to reduce systematics
•Current empirical distance estimators are limited by the paucity of high-quality input/training data. The situation is improving (CfA, CSP, KAIT, SNF, SDSS), but we need better, homogeneous data at low/intermediate redshifts and a systematic approach to ingesting them to build better empirical estimators. Will current ground-based SN surveys deliver what we need for JDEM?
4
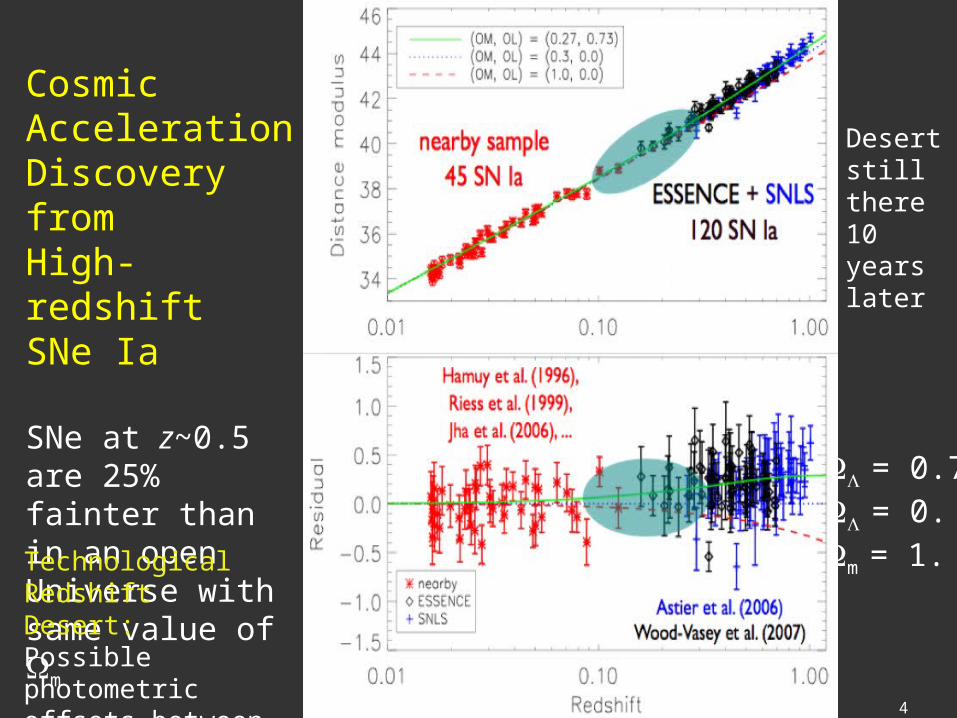
Cosmic AccelerationDiscovery from High-redshiftSNe Ia
SNe at z~0.5 are 25% fainter than in an open Universe with same value of m
= 0.7 = 0.m = 1.Technological Redshift
Desert:Possible photometric offsets between low- and high-redshift data
Desert still there 10 years later
5
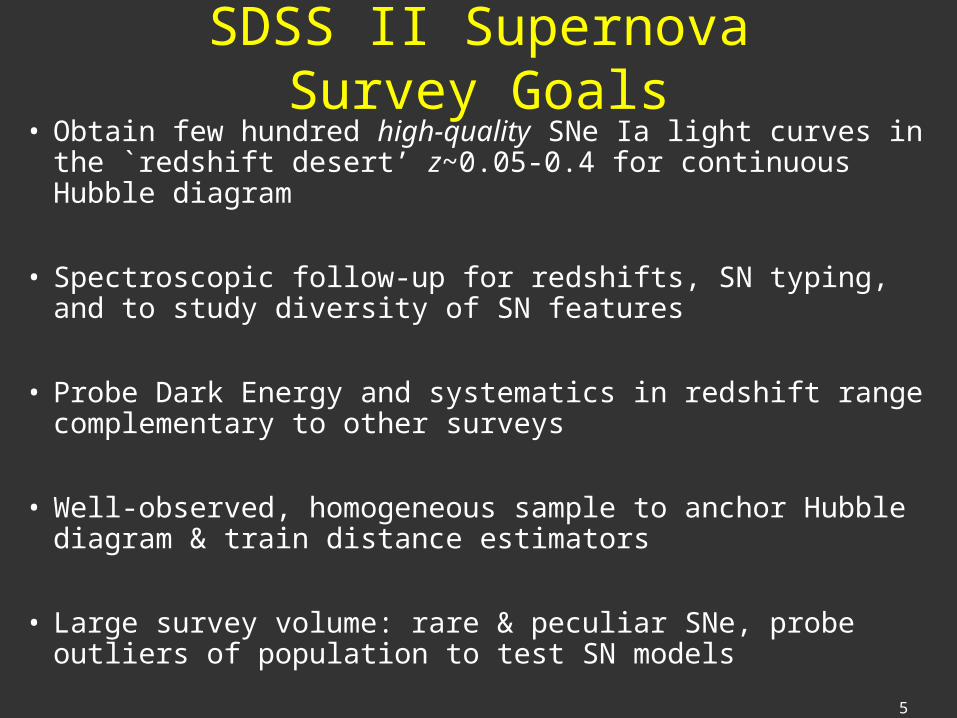
SDSS II Supernova Survey Goals• Obtain few hundred high-quality SNe Ia light curves in the
`redshift desert’ z~0.05-0.4 for continuous Hubble diagram
• Spectroscopic follow-up for redshifts, SN typing, and to study diversity of SN features
• Probe Dark Energy and systematics in redshift range complementary to other surveys
• Well-observed, homogeneous sample to anchor Hubble diagram & train distance estimators
• Large survey volume: rare & peculiar SNe, probe outliers of population to test SN models
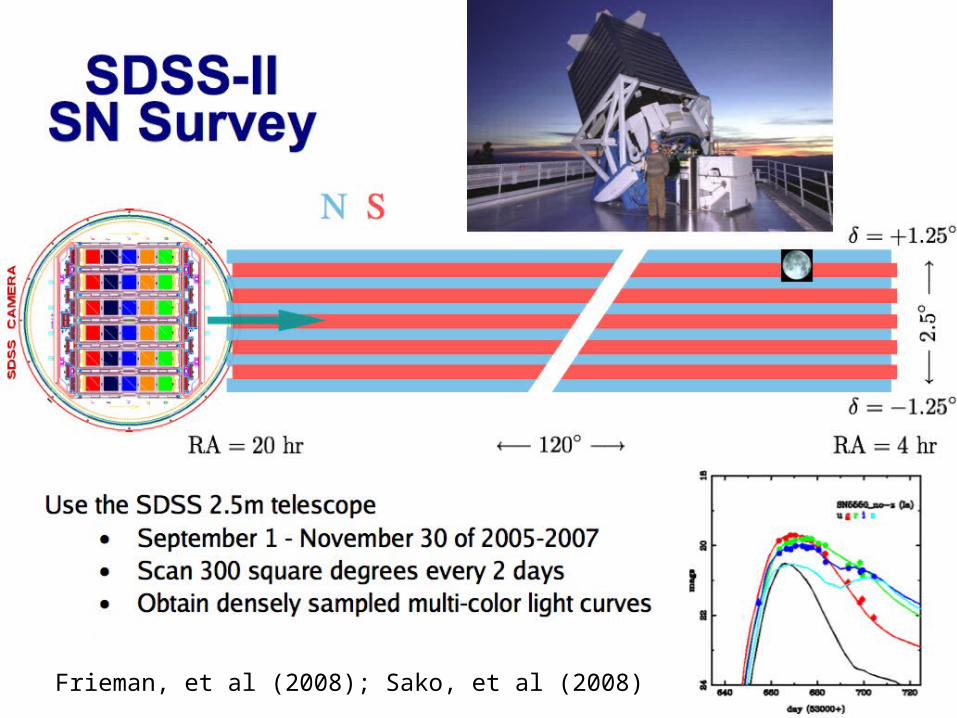
Frieman, et al (2008); Sako, et al (2008)
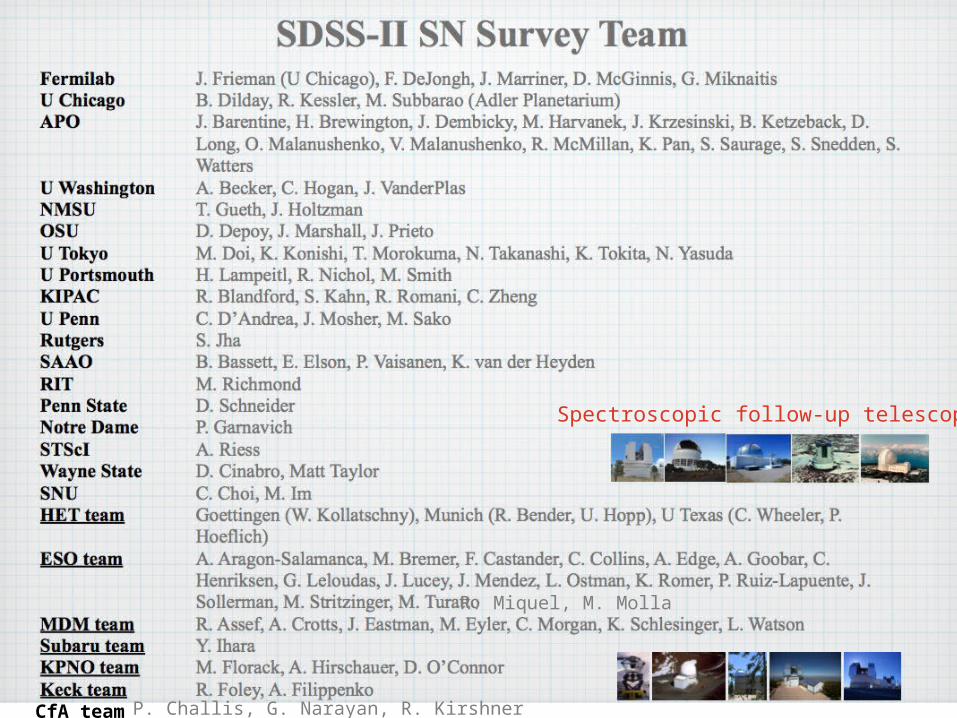
Spectroscopic follow-up telescopes
R. Miquel, M. Molla
CfA team P. Challis, G. Narayan, R. Kirshner
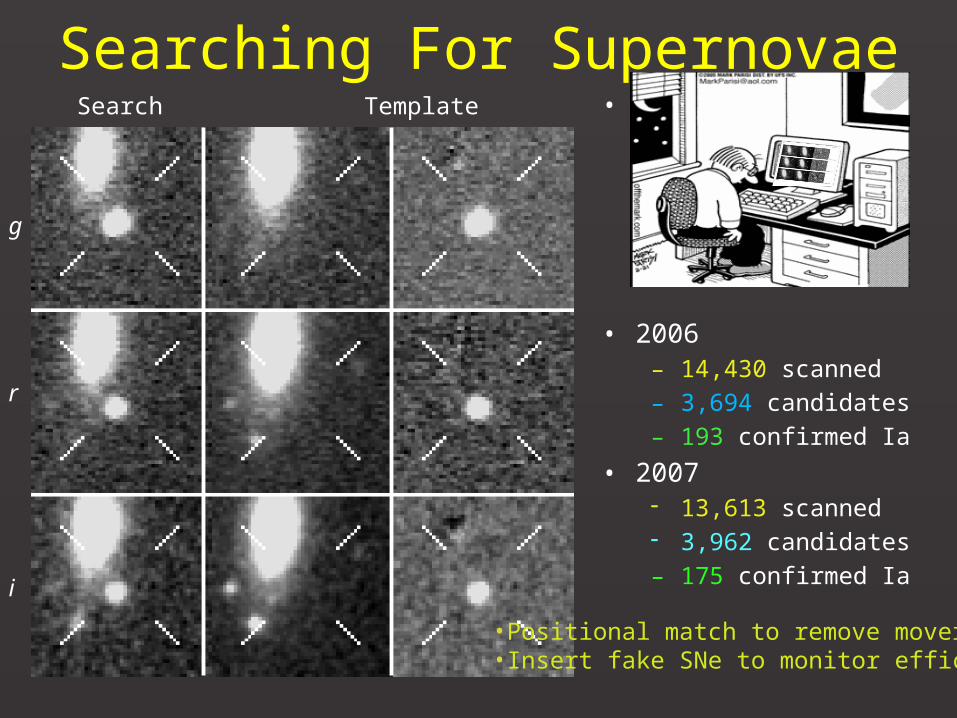
Search Template Difference
g
r
i
Searching For Supernovae• 2005
– 118,693 objects scanned
– 10,937 unique candidates
– 130 confirmed Ia
• 2006– 14,430 scanned
– 3,694 candidates
– 193 confirmed Ia
• 2007 13,613 scanned 3,962 candidates
– 175 confirmed Ia
•Positional match to remove movers•Insert fake SNe to monitor efficiency
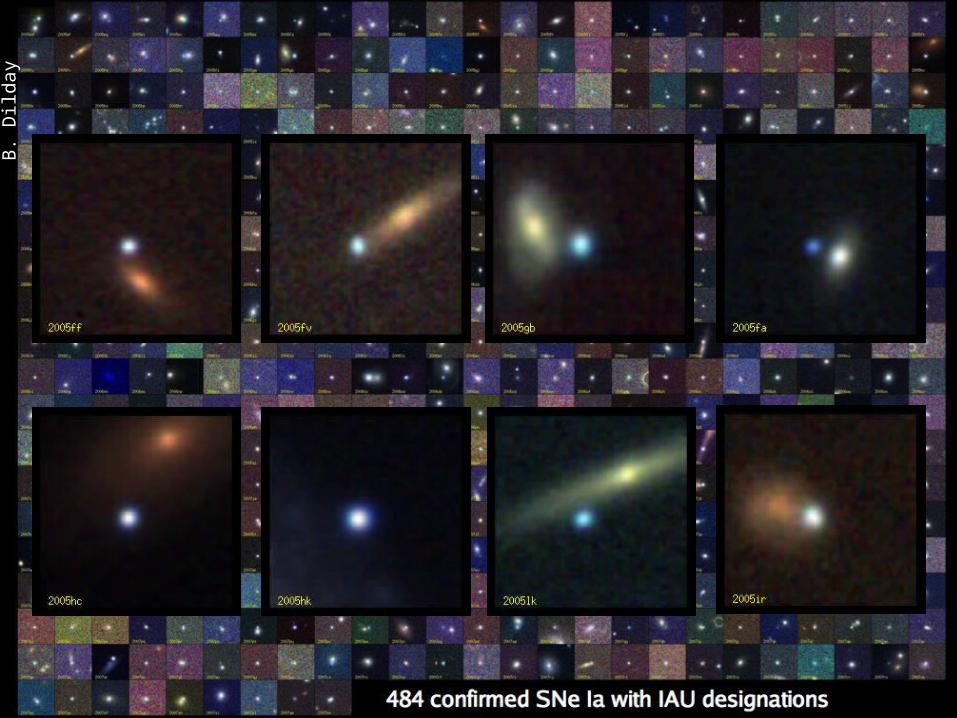
B.
Dild
ay
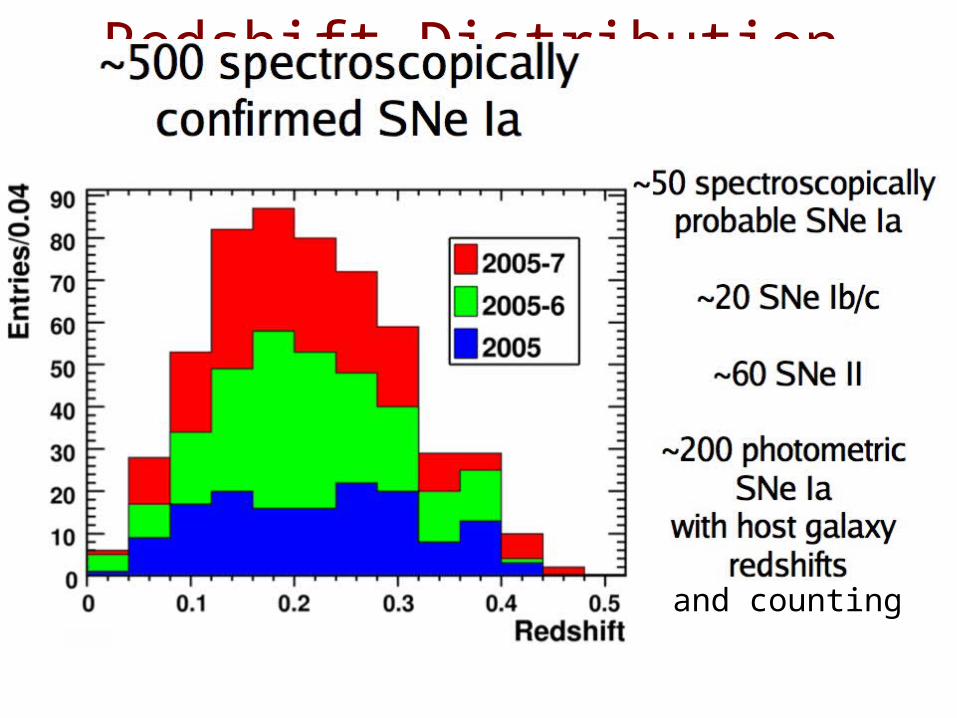
Redshift Distribution for SNe Ia
and counting
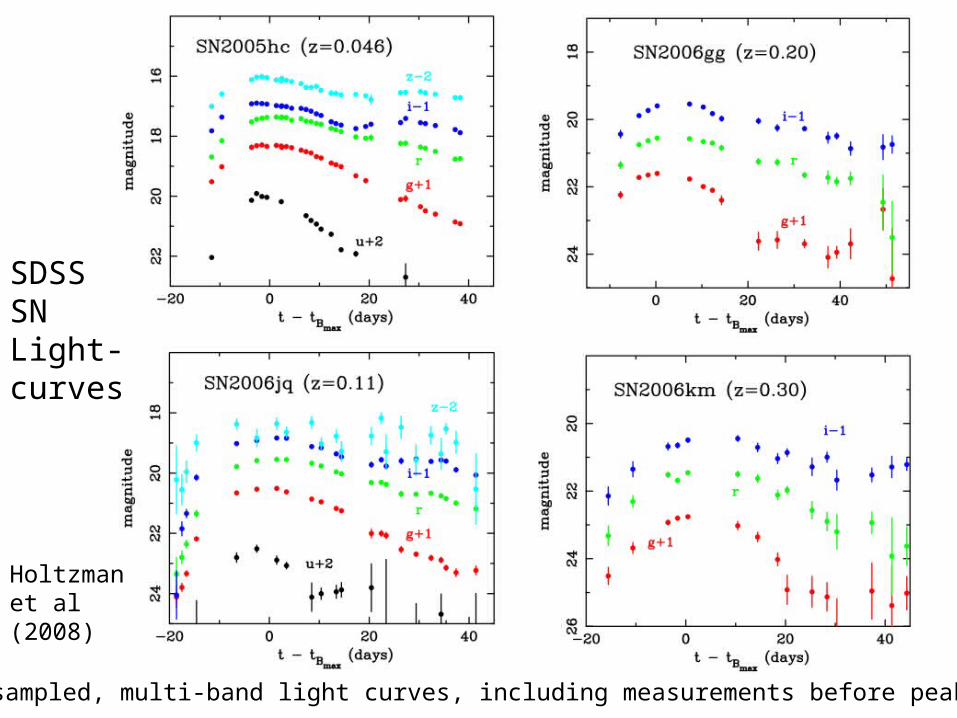
Well-sampled, multi-band light curves, including measurements before peak light
SDSSSNLight-curves
Holtzman et al (2008)
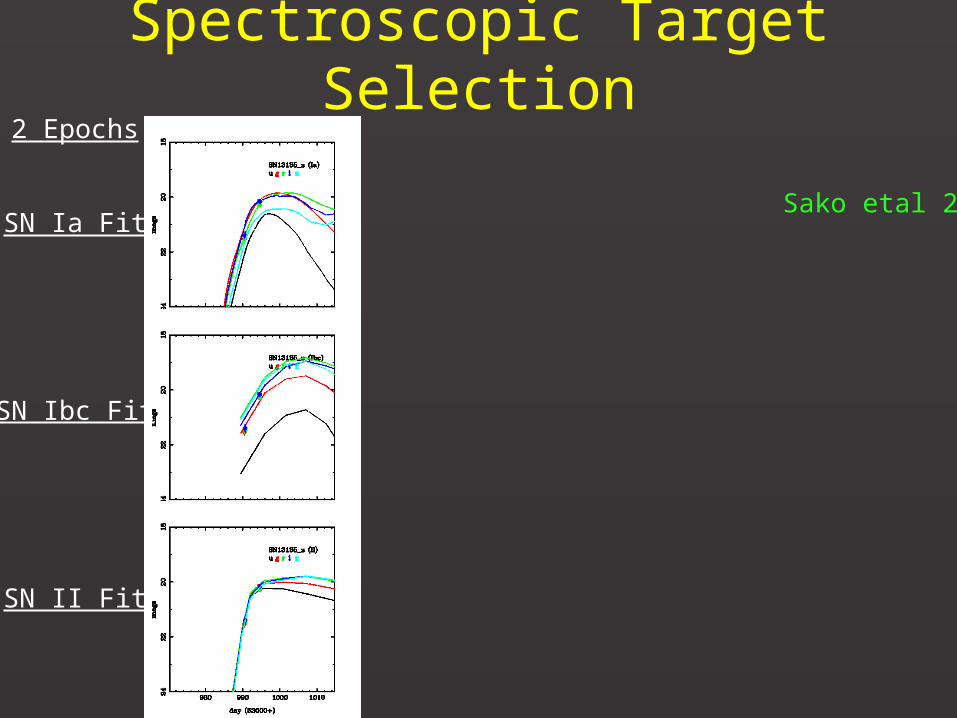
Spectroscopic Target Selection2 Epochs
SN Ia Fit
SN Ibc Fit
SN II Fit
Sako etal 2008
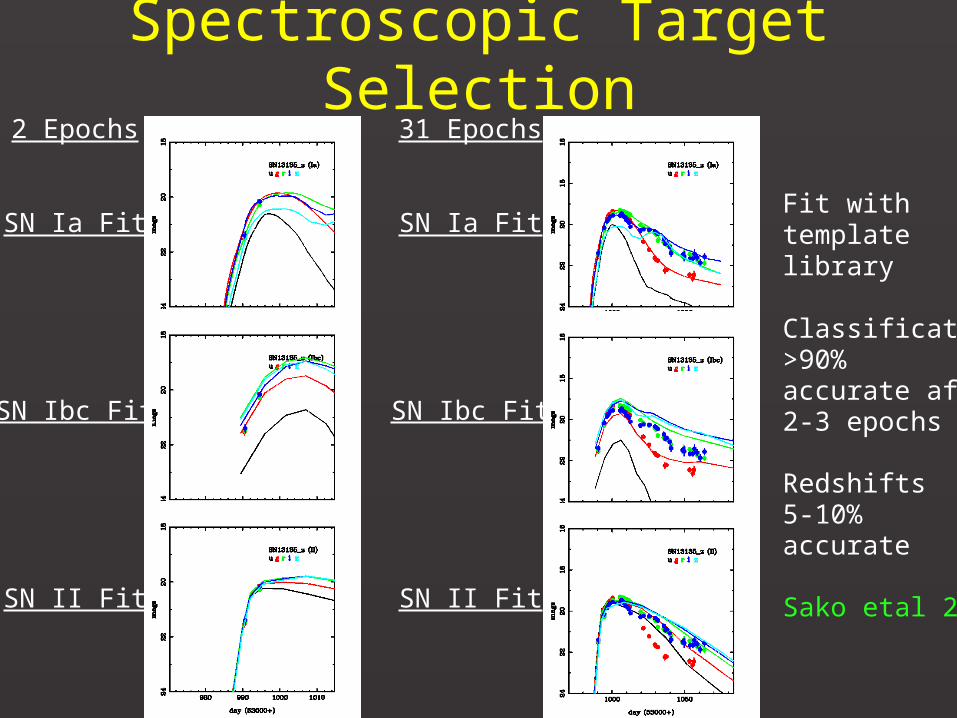
Spectroscopic Target Selection2 Epochs
SN Ia Fit
SN Ibc Fit
SN II Fit
31 Epochs
SN Ia Fit
SN Ibc Fit
SN II Fit
Fit with template library
Classification>90%accurate after 2-3 epochs
Redshifts 5-10% accurate
Sako etal 2008
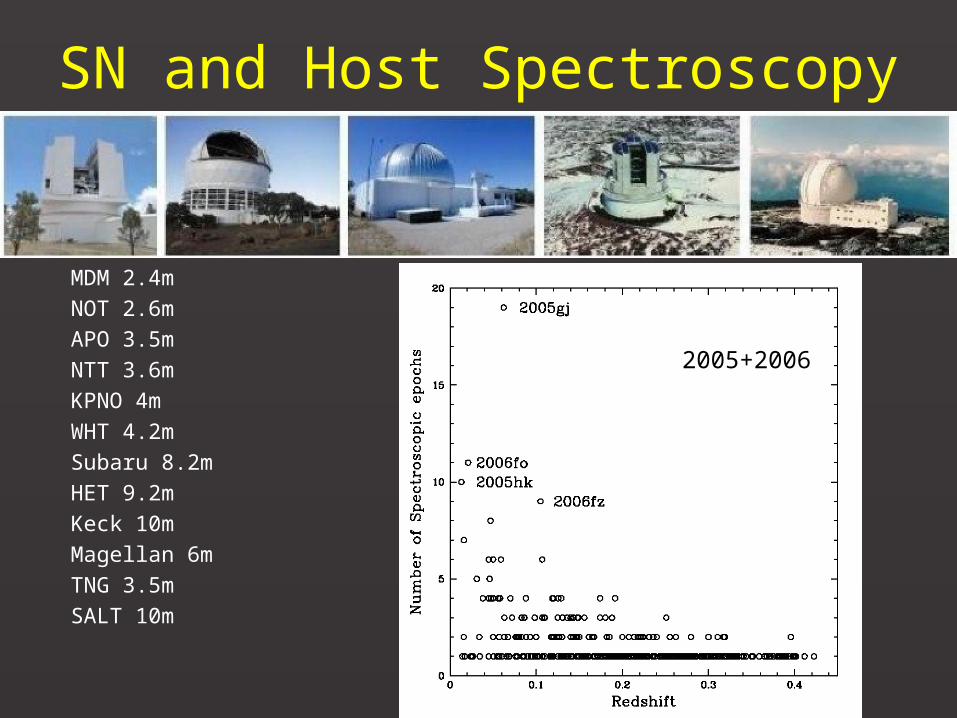
SN and Host Spectroscopy
MDM 2.4m
NOT 2.6m
APO 3.5m
NTT 3.6m
KPNO 4m
WHT 4.2m
Subaru 8.2m
HET 9.2m
Keck 10m
Magellan 6m
TNG 3.5m
SALT 10m
2005+2006

SDSS SN Ia Spectra
~1000 spectra taken over 3 seasonsZheng et al (2008)
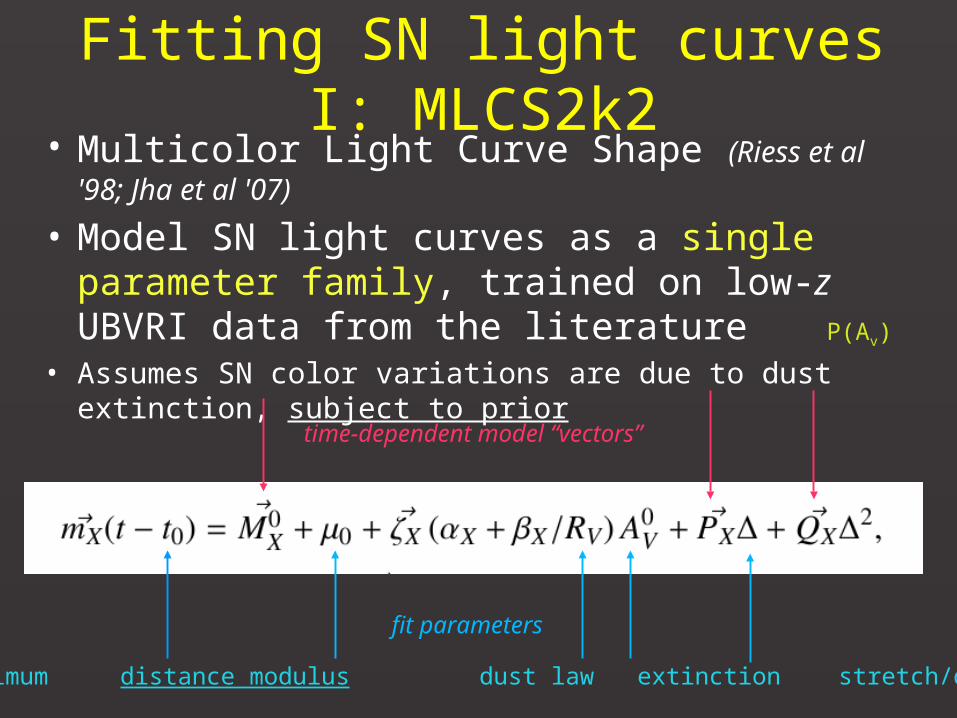
Fitting SN light curves I: MLCS2k2• Multicolor Light Curve Shape (Riess et al '98; Jha et al '07)
• Model SN light curves as a single parameter family, trained on low-z UBVRI data from the literature
• Assumes SN color variations are due to dust extinction, subject to prior
fit parameters
time-dependent model “vectors”
Time of maximum distance modulus dust law extinction stretch/decline rate
P(Av)

MLCS2k2 model templates
∆ = -0.3: bright, broad
∆ = +1.2: faint, narrow
Jha et al, 2007
18
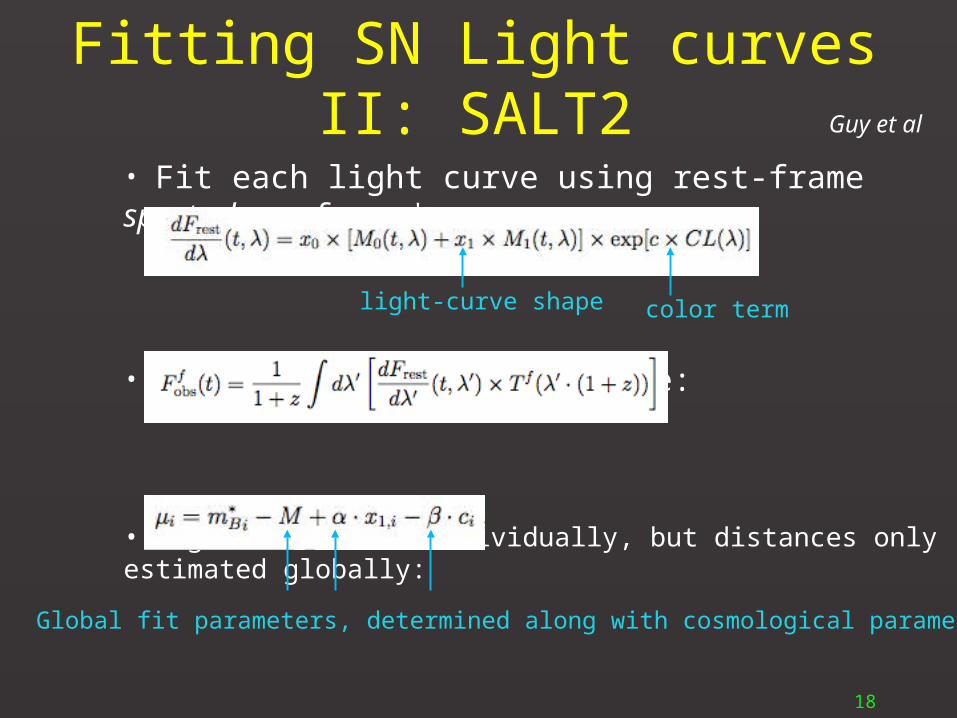
Fitting SN Light curves II: SALT2
• Fit each light curve using rest-frame spectral surfaces*:
• Transform to observer frame:
• Light curves fit individually, but distances only estimated globally:
*Not trained just on low-redshift data; distances are cosmology-dependent, flat priors on model parameters
Global fit parameters, determined along with cosmological parameters
color term
Guy et al
light-curve shape
19
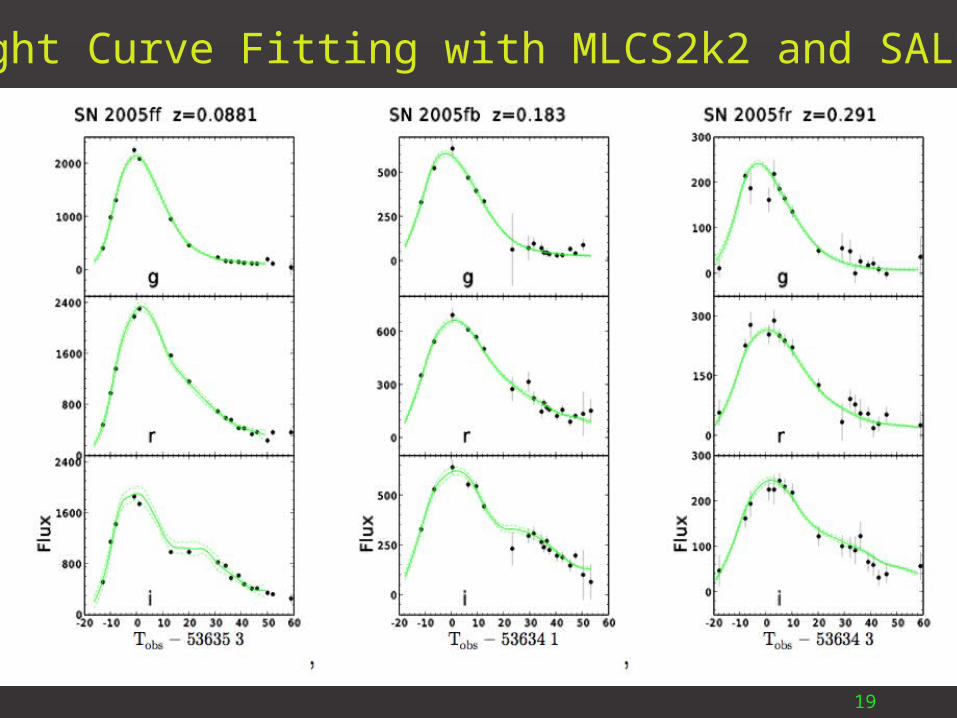
Light Curve Fitting with MLCS2k2 and SALT2
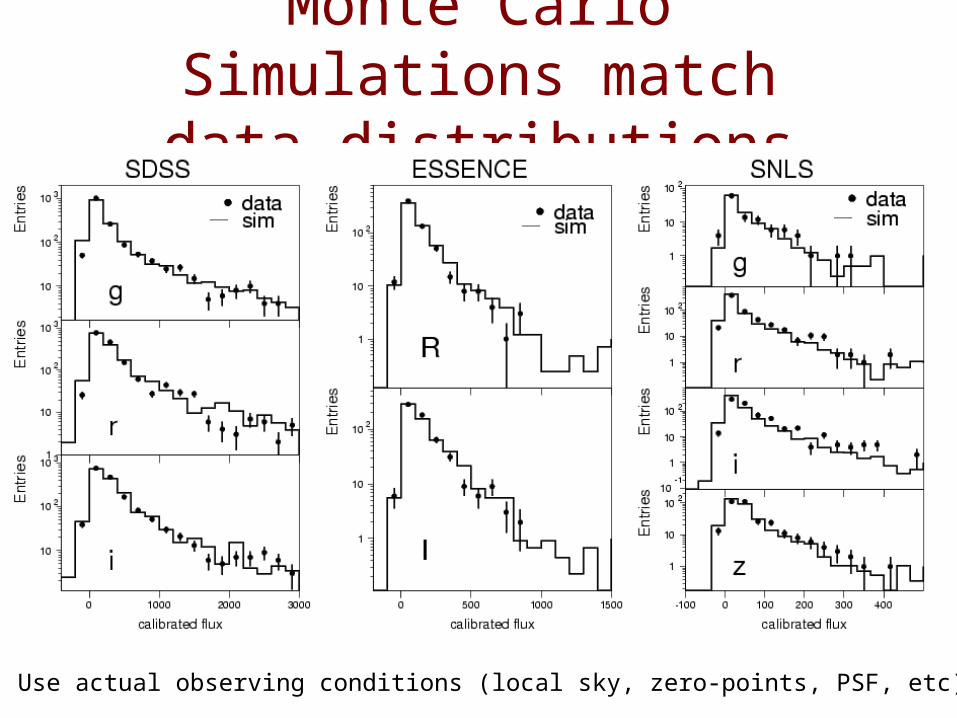
Monte Carlo Simulations match data distributions
Use actual observing conditions (local sky, zero-points, PSF, etc)
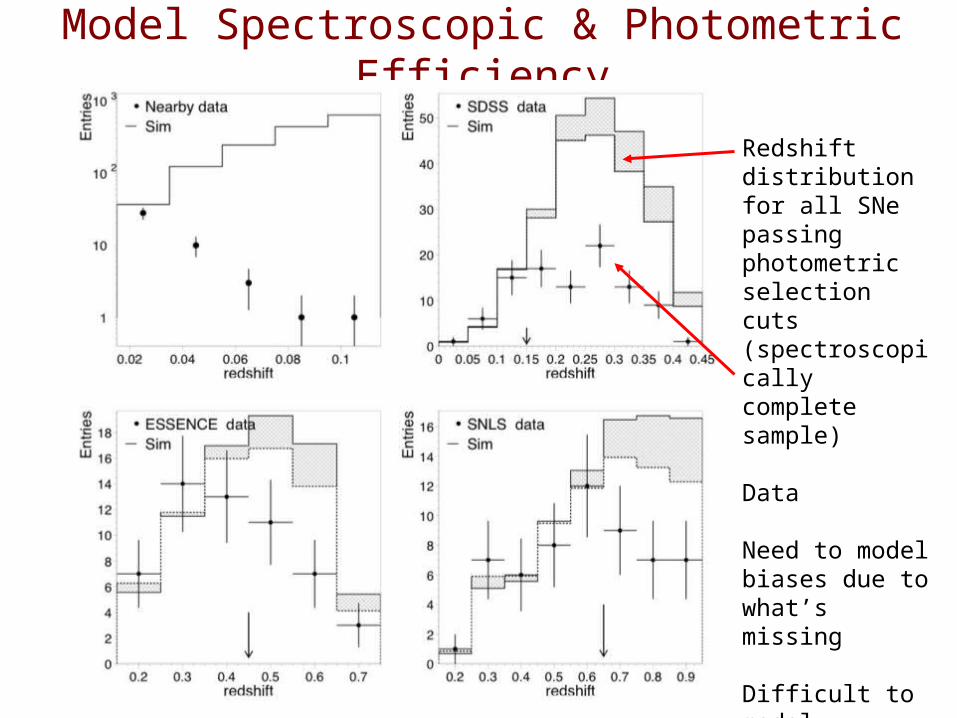
Model Spectroscopic & Photometric Efficiency
Redshift distribution for all SNe passing photometric selection cuts (spectroscopically complete sample)
Data
Need to model biases due to what’s missing
Difficult to model spectroscopic selection
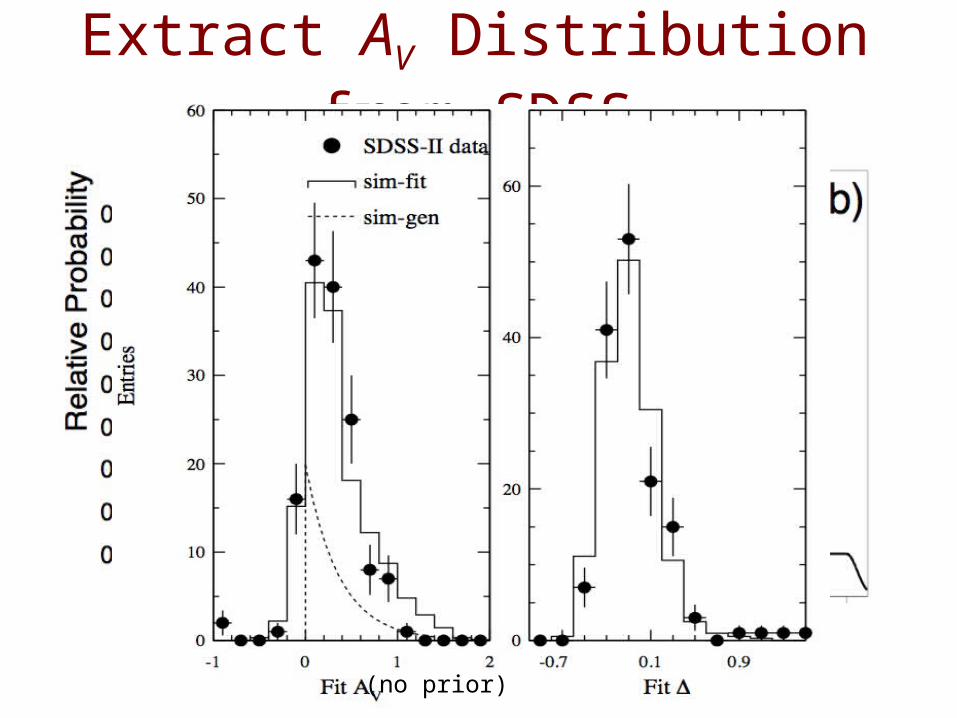
Extract AV Distribution from SDSS
(no prior)
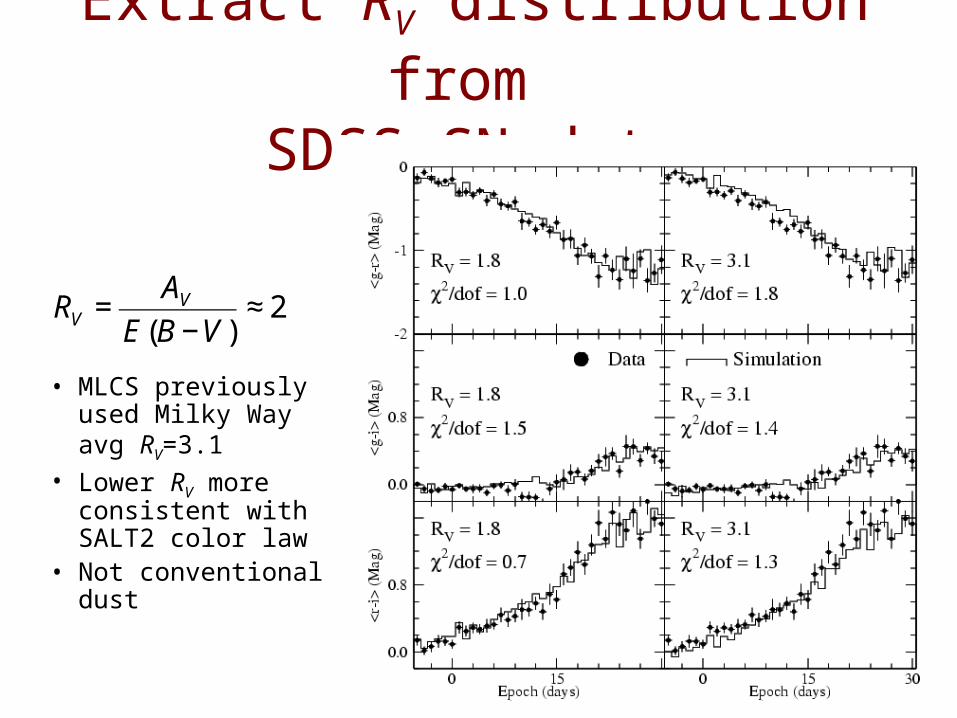
Extract RV distribution from SDSS SN data
• MLCS previously used Milky Way avg RV=3.1
• Lower RV more consistent with SALT2 color law
• Not conventional dust
€
RV =AV
E(B −V )≈ 2
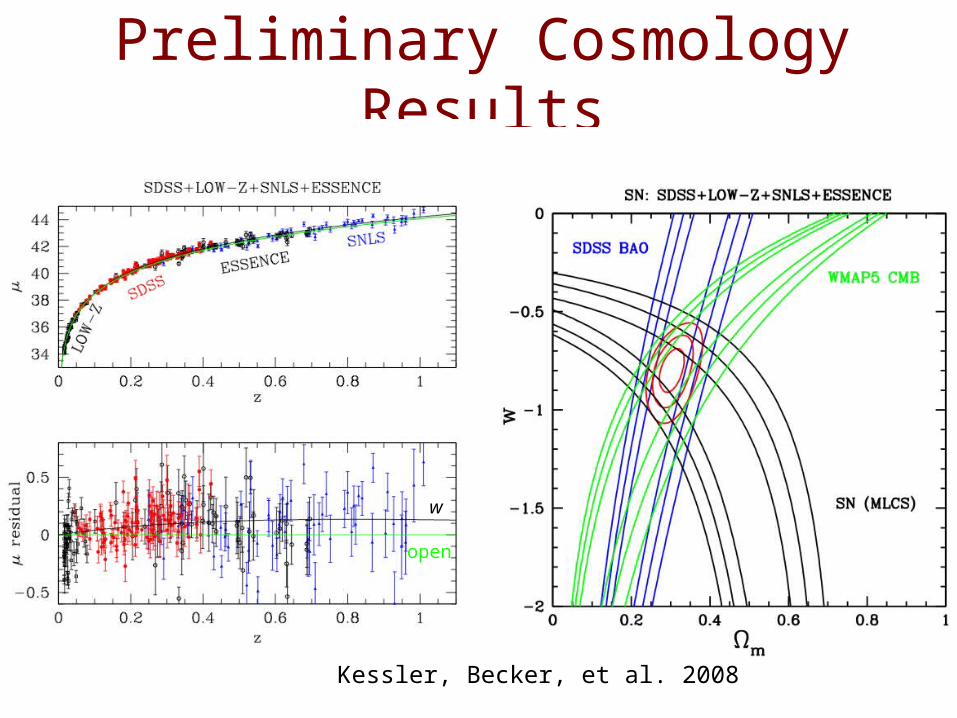
Preliminary Cosmology Results
Kessler, Becker, et al. 2008
w
open
25
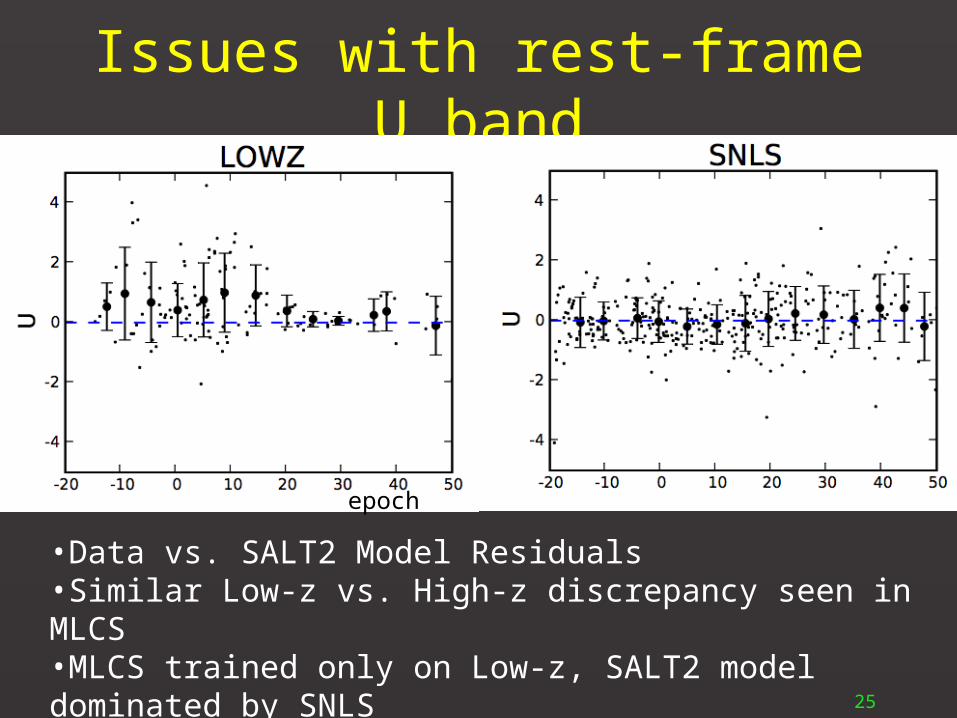
Issues with rest-frame U band
•Data vs. SALT2 Model Residuals•Similar Low-z vs. High-z discrepancy seen in MLCS•MLCS trained only on Low-z, SALT2 model dominated by SNLS•Similar differences seen in rest-frame UV spectra (Foley et al)
epoch
26
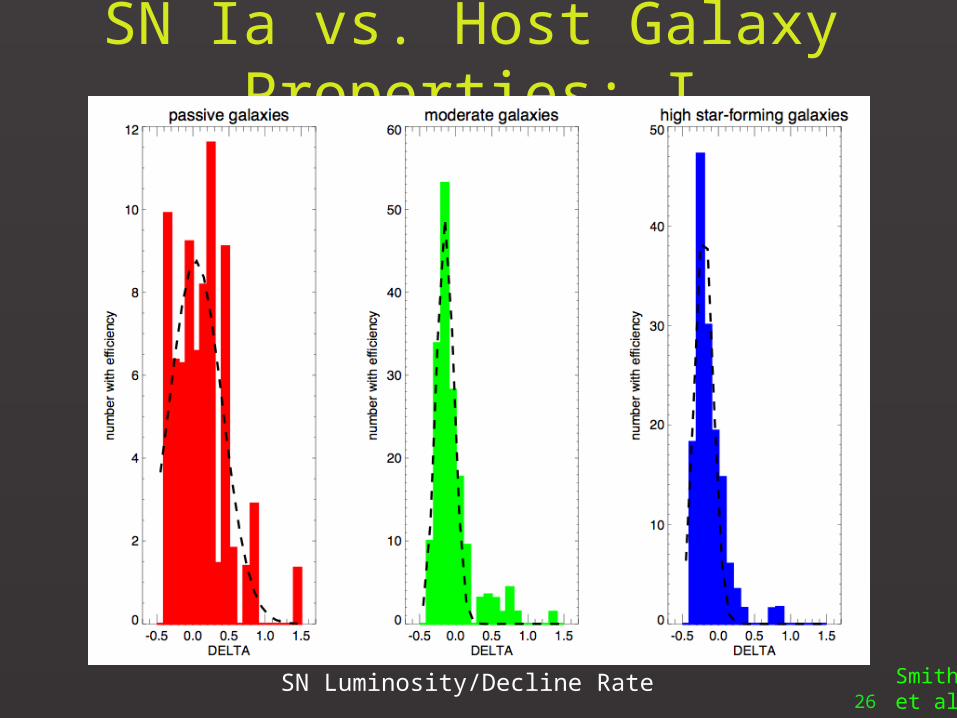
SN Ia vs. Host Galaxy Properties: I
Smith et al
Bright SN Luminosity/Decline Rate Faint

27
SN Ia vs. Host Galaxy Properties: II
Smith et al
Color/reddening
Is reddening local to the SN environment?
28
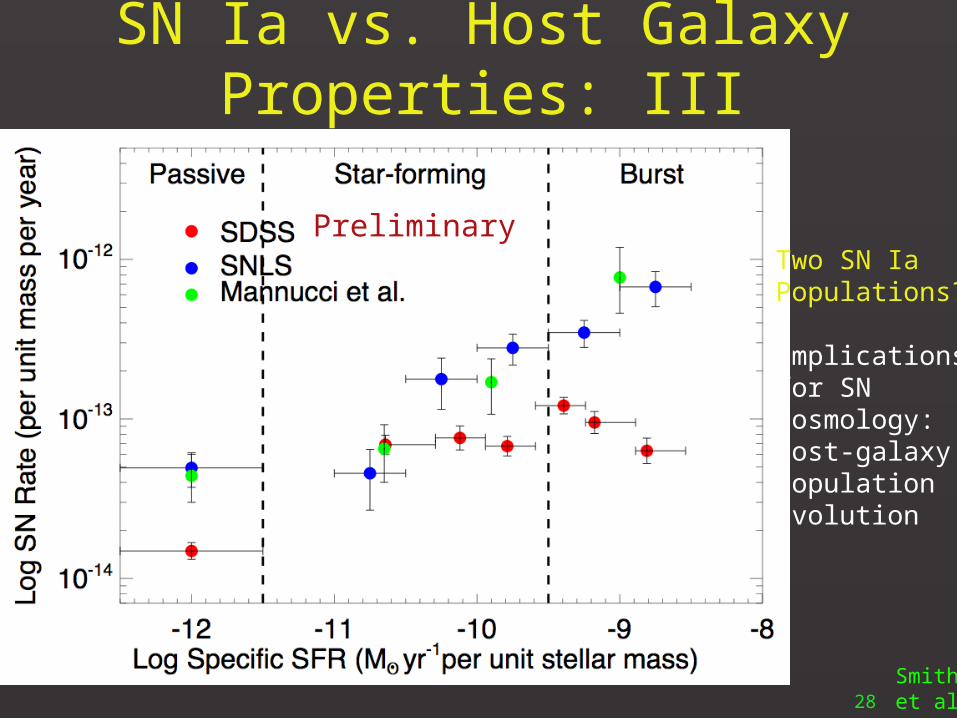
SN Ia vs. Host Galaxy Properties: III
Smith et al
PreliminaryTwo SN IaPopulations?
Implications for SNcosmology:host-galaxypopulationevolution
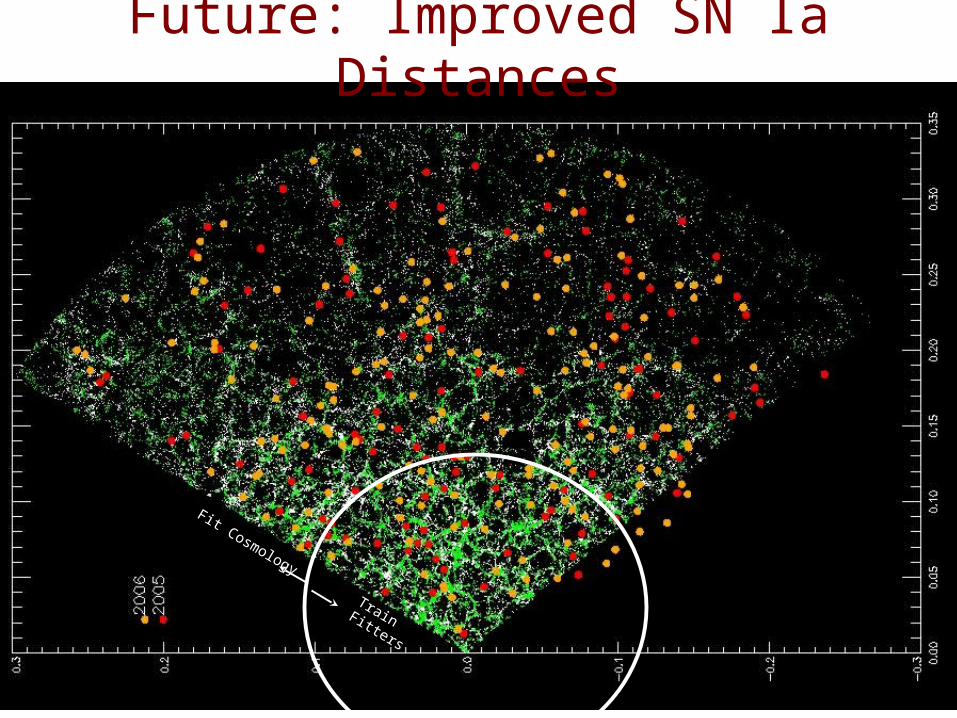
Future: Improved SN Ia Distances
TrainFitters
Fit Cosmology