1 skj©dnv cost effectiveness of hull girder safety rolf skjong & em bitner-gregersen det norske...
TRANSCRIPT
1 SKJ©DNV
Cost Effectiveness of Hull Girder Safety
Rolf Skjong & EM Bitner-GregersenDet Norske Veritas
OMAE, Oslo, June 24-28, 2002

2 SKJ©DNV
Content
Acceptance criteria in Structural Reliability Analysis
Acceptance Criteria in Formal Safety Assessment
Common Criteria? Application to Hull Girder Strength Conclusion

3 SKJ©DNV
Traditional Approach - SRA
Typical Example:DNV Classification Note 30.6 (1992) on Structural Reliability Analysis of Maritime Structures
SRA is Bayesian theory Explains why SRA does not produce Probabilities with
a frequency interpretation– No gross error– Epistemic uncertainty & model uncertainties
included– SRA talk of “notional” reliabilities

4 SKJ©DNV
Traditional Approach - SRA
Target should depend on consequence Calibration against known cases (that are acceptable
good/best practices in the industry) Calibration against similar cases with similar
consequences Based on accepted decision analysis techniques Based on tabular values (presented as a last resort)

5 SKJ©DNV
Traditional Approach - SRA
Based on tabular values (presented as a last resort)
Annual Target Probabilities (and Target βT) from DNV Classification Note 30.6Consequence of FailureClass of Failure
Less serious SeriousI- Redundant Structure PF = 10-3, βT = 3.09 PF = 10-4, βT = 3.71II - Significant warning before the occurrence offailure in a non-redundant structure
PF = 10-4, βT = 3.71 PF = 10-5, βT = 4.26
III - No warning before the occurrence of failure ina non-redundant structure
PF = 10-5, β T = 4.26 PF = 10-6, β T = 4.75
6 SKJ©DNV
Traditional Approach - RA
Quantitative risk assessment is the basis for regulations in many industries– PSA/PRA - Nuclear– Hazardous Industries (Seveso I/II)– Offshore (Safety Case)– Shipping (FSA)– Etc.
8 SKJ©DNV
Traditional Approach - QRA
Present Risk Results in terms of– Individual Risk (Fatalities)– Individual Risk (Health and Injuries)– Societal Risk (Group Risk)– Environmental Risk– Economic risk (not necessarily a regulatory issue)

9 SKJ©DNV
Traditional Approach - RA
Example Individual risk
1.00E-07
1.00E-06
1.00E-05
1.00E-04
1.00E-03
1.00E-02
Ind
ivid
ual
risk Intolerable Risk
ALARP
Negligible Risk

10 SKJ©DNV
Traditional Approach - QRA
Example Societal Risk
1.0E-06
1.0E-05
1.0E-04
1.0E-03
1.0E-02
1 10 100
Fatalities (N)
Fre
qu
en
cy
of
N o
r m
ore
fa
taliti
es
(p
er
sh
ip
ye
ar)
Oil tankers
Chem. tankers
Oil/Chemicaltankers
Gas tanker
Negligible
Intolerable
ALARP

11 SKJ©DNV
Traditional Approach - QRA
Low Risk
High Risk Intolerable
ALARP
Negligible
Not acceptable
Acceptable
Acceptable if made ALARP
12 SKJ©DNV
Traditional Approach - QRA
The As Low As Reasonably Practicable Area implies that cost effectiveness assessment may be used
Risk is made As Low As Reasonably Practicable, when all cost effective safety measures have been implemented
Implies that a decision criteria for cost effectiveness will be required
It seems to be accepted at IMO that most ship types are in the ALARP area but not ALARP
Cost Effectiveness will be the only criteria

13 SKJ©DNV
Common Criteria
Cost effectiveness criteria is easy to use, both for SRA and FSA studies
Advantage to SRA: Only change in risk is used in the decision process, not the absolute numbers
Criteria to use: $ 1.5 - $ 3.0 million Decision at MSC 76 in December 2002

14 SKJ©DNV
Previous IMO decisions
Example from IMO: UN Organisation for maritime safety and environmental protection regulations
Cost of averting fatalities in actual decisions
Decision DecisionMaker
Value
Strengthening Bulkheads on Existing BulkCarriers
IACS andIMO (1)
> $ 1.5 million
Helicopter Landing Area on non-Ro/RoPassenger Ships
IMO(2) < $ 37 million
3 bulkheads on car deck Passenger Ro/Ro IMO(3) < $ 5 million3 bulkheads + sponsons IMO(3) < 7.8 millionExtended sponsons only IMO(3) < $ 11 millionExtra Deck Officer IMO(3) < $ 5.5 millionTwo conventional lifeboats BC IMO(4) > $ 1 millionThrow overboard life-raft on BC IMO (4) > $ 3 millionRe: (1) Mathisen et al.(1997), (2) Skjong et al.(1997), (3) DNV(1997), (4) Skjong andWenthworth,

16 SKJ©DNV
Girder Collapse/Sagging

17 SKJ©DNV
PROCODE
Use limit states formulation with target beta– Optimisation of partial safety factors– Control Variables: Partial Safety Factors– Minimum Scatter around a target reliability by
minimising the penalty function– Target to vary to produce cost effectiveness ratios

18 SKJ©DNV
PROCODE
)),,,((min ,1
,mode,
kTijjik
M
kk pw
ij
DEX
},...1,,...1,0),,,,( ,, kjijink NnMkh dexSubjected to:
With one of the inequalities turning into equality
One design Case:
This is generalised to Multiple design cases in PROCODE

19 SKJ©DNV
PROCODE
Programmable functions– Limit States– Code Checks– Penalty functions
Defined by Data (additional to PROBAN)– Scope – Safety Factor – Design Parameter

20 SKJ©DNV
PROCODE RESULTS
Code Evaluation (before optimisation starts) Optimised partial safety factors Resulting reliabilities Resulting design parameters (input to cost analysis)
21 SKJ©DNV
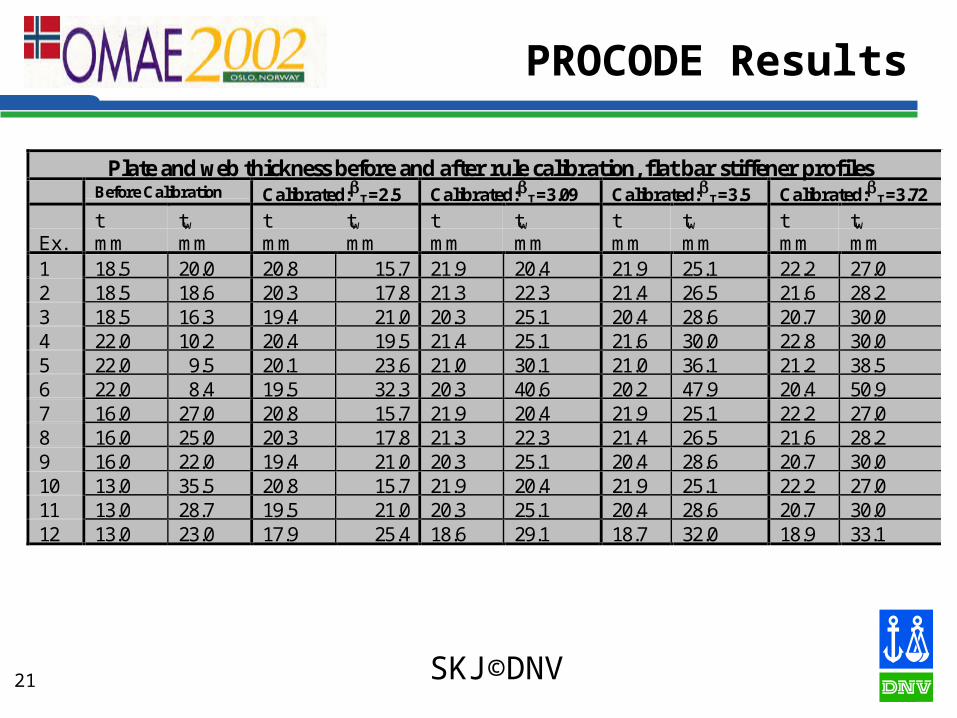
PROCODE Results
Plate and web thickness before and after rule calibration, flat bar stiffener profilesBefore Calibration Calibrated:T=2.5 Calibrated:T=3.09 Calibrated:T=3.5 Calibrated:T=3.72
Ex.tmm
tw
mmtmm
tw
mmtmm
tw
mmtmm
tw
mmtmm
tw
mm1 18.5 20.0 20.8 15.7 21.9 20.4 21.9 25.1 22.2 27.02 18.5 18.6 20.3 17.8 21.3 22.3 21.4 26.5 21.6 28.23 18.5 16.3 19.4 21.0 20.3 25.1 20.4 28.6 20.7 30.04 22.0 10.2 20.4 19.5 21.4 25.1 21.6 30.0 22.8 30.05 22.0 9.5 20.1 23.6 21.0 30.1 21.0 36.1 21.2 38.56 22.0 8.4 19.5 32.3 20.3 40.6 20.2 47.9 20.4 50.97 16.0 27.0 20.8 15.7 21.9 20.4 21.9 25.1 22.2 27.08 16.0 25.0 20.3 17.8 21.3 22.3 21.4 26.5 21.6 28.29 16.0 22.0 19.4 21.0 20.3 25.1 20.4 28.6 20.7 30.010 13.0 35.5 20.8 15.7 21.9 20.4 21.9 25.1 22.2 27.011 13.0 28.7 19.5 21.0 20.3 25.1 20.4 28.6 20.7 30.012 13.0 23.0 17.9 25.4 18.6 29.1 18.7 32.0 18.9 33.1

22 SKJ©DNV
PROCODE Results
Plate and web thickness before and after rule calibration, L-stiffener profilesBefore Calibration Calibrated:T=2.5 Calibrated:T=3.09 Calibrated:T=3.5 Calibrated:T=3.72
Ex.tmm
tw
mmtmm
tw
mmtmm
tw
mmtmm
tw
mmtmm
tw
mm1 18.5 14.0 17.0 7.2 17.4 11.9 18.3 16.5 19.6 19.52 18.5 14.0 17.0 8.4 17.5 12.1 18.3 16.1 19.7 17.83 18.5 13.0 17.0 9.3 17.3 13.0 18.4 16.2 19.4 18.24 21.5 7.5 16.9 10.6 17.4 14.8 18.2 18.8 19.5 21.55 21.5 7.0 17.1 8.5 17.5 12.3 18.3 16.5 19.8 18.16 21.5 5.0 16.7 9.2 17.1 12.8 17.9 16.2 19.3 17.77 16.0 18.7 16.8 8.0 17.3 11.4 18.2 15.1 19.6 16.78 16.0 20.5 16.9 7.2 17.5 10.0 18.3 15.0 19.7 18.09 16.0 17.7 16.9 9.2 17.2 12.8 17.9 16.3 19.3 17.810 13.0 24.5 16.9 9.2 17.2 12.8 17.9 16.3 19.3 17.811 13.0 21.5 17.2 9.9 17.5 13.0 17.8 16.3 19.2 17.512 13.0 19.0 17.6 10.5 18.1 13.2 18.3 16.0 19.3 17.3

23 SKJ©DNV
Resulting Steel Weight
Cross section area and weight of ship decks per meter length and per stiffer before and after rule calibration, flatbar profiles.
BeforeCalibration
Calibrated:T=2.5 Calibrated:T=3.09 Calibrated:T=3.5 Calibrated:T=3.72
Ex.Area
( 2mm)
Weight(t)
Area
( 2mm)
Weight(t)
=3.09( 2mm)
Weight(t)
Area
( 2mm)
Weight(t)
Area
( 2mm)
Weight(t)
MeanValue
23301 0.1829 25875 0.2031 28546 0.2241 30230 0.2373 31086 0.2440
Cross section area and weight of ship decks per meter length and per stiffer before and after rule calibration, L-profiles.
Before Calibration Calibrated:T=2.5 Calibrated:T=3.09 Calibrated:T=3.5 Calibrated:T=3.72
Ex.Area
( 2mm)
Weight(t)
Area
( 2mm)
Weight(t)
=3.09( 2mm)
Weight(t)
Area
( 2mm)
Weight(t)
Area
( 2mm)
Weight(t)
MeanValue
23355 0.1833 21281 0.1671 22143 0.1738 24481 0.1922 26399 0.2072

24 SKJ©DNV
Costs
Total weight and cost for the average ship deck before and after Calibration, Flat bar and L- stiffener profiles.Stiffener profile Before
CalibrationAfter=2.50
After.=3.09
After=3.50
After=3.72
Flatbar Weight (T) 1,829 2,031 2,241 2,373 2,440
FlatbarCost (US$) 3,658,000 4,062,000 4,482,000 4,746,000 4,880,000L-profileWeight (T) 1,833 1,671 1,738 1,922 2,072L-profileCost (US$) 3,812,640 3,475,680 3,615,040 3,997,760 4,309,760

25 SKJ©DNV
Costs
Increase of the ship deck cost for different target beta,
Flat bar stiffener profiles.Cost increase relativeto
=2.50 =3.09 =3.50 =3.72
=2.50 - 10.3% 16.8% 20.1%
Past practice* =2.40
11.0% 22.5% 29.7% 33.4%
* before calibration
Increase of the ship deck cost for different target beta,
L-stiffener profiles.Cost increase relative to =2.50 =3.09 =3.50 =3.72
=2.50 - 4.0% 15.0% 24.0%
Past practice* =3.40
-8.5% -5.5% 4.9% 13.0%
26 SKJ©DNV
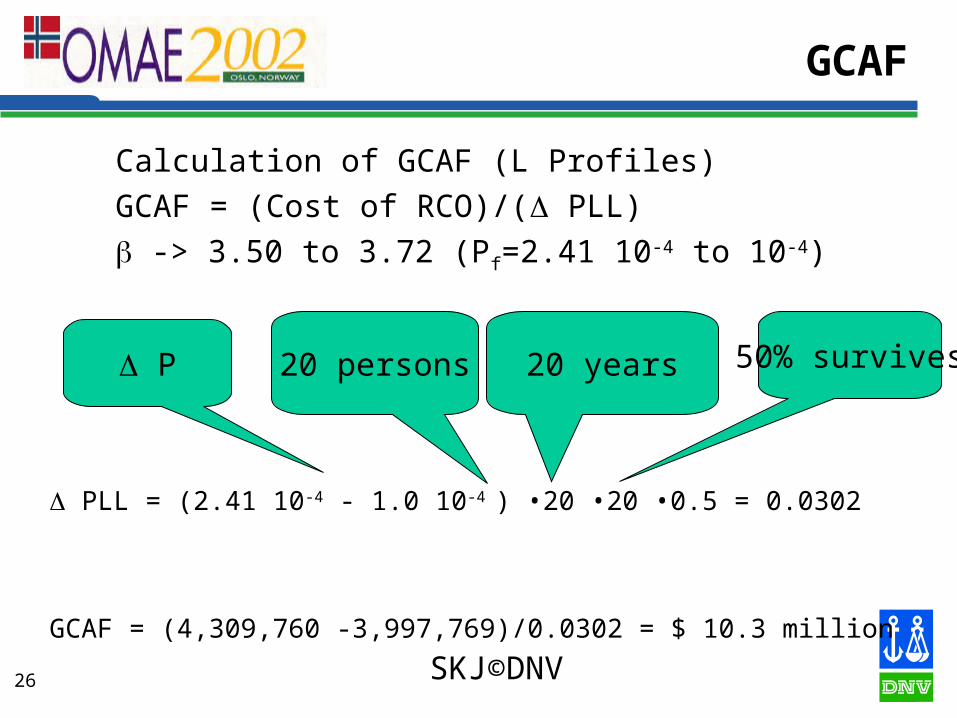
GCAF
Calculation of GCAF (L Profiles)
GCAF = (Cost of RCO)/( PLL)
-> 3.50 to 3.72 (Pf=2.41 10-4 to 10-4)
P 20 persons 20 years
PLL = (2.41 10-4 - 1.0 10-4 ) •20 •20 •0.5 = 0.0302
50% survives
GCAF = (4,309,760 -3,997,769)/0.0302 = $ 10.3 million
27 SKJ©DNV
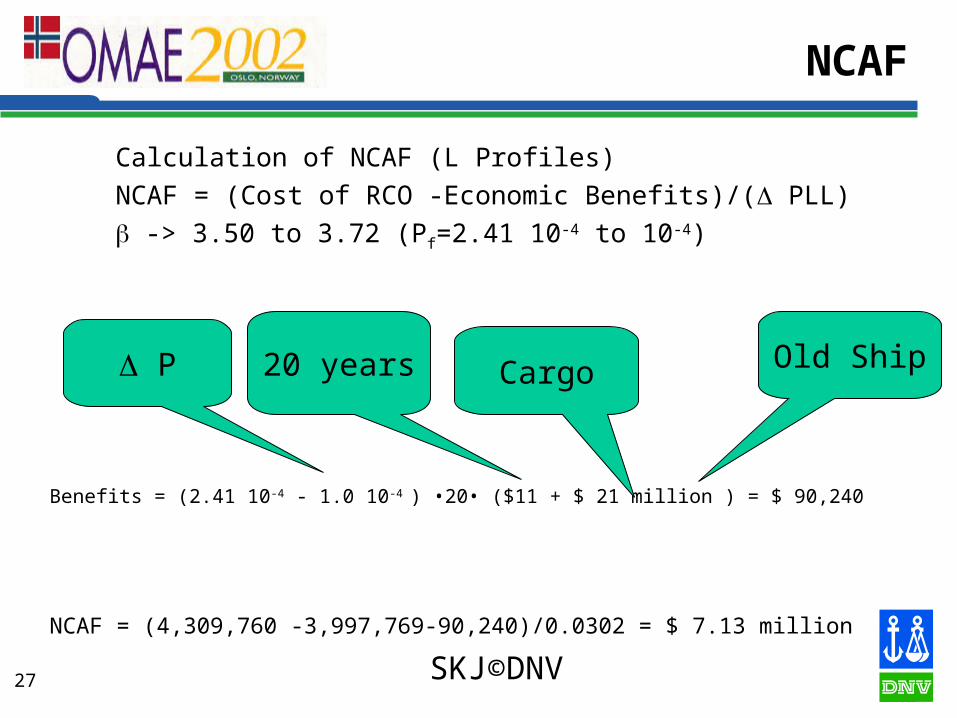
NCAF
Calculation of NCAF (L Profiles)
NCAF = (Cost of RCO -Economic Benefits)/( PLL)
-> 3.50 to 3.72 (Pf=2.41 10-4 to 10-4)
P 20 years
Benefits = (2.41 10-4 - 1.0 10-4 ) •20• ($11 + $ 21 million ) = $ 90,240
Old Ship
NCAF = (4,309,760 -3,997,769-90,240)/0.0302 = $ 7.13 million
Cargo

28 SKJ©DNV
Results
CAF in US$ million for increases of the reliability index Flat Bar L-Profile
GCAF NCAF GCAF NCAF2.53.09 0.402 -2.80 0.133 -3.073.093.50 1.76 -1.74 2.55 -0.6453.503.72 4.44 1.24 10.3 7.13

29 SKJ©DNV
Conclusion
In reliability based code calibration CEA (NCAF) may be used as an alternative to target
Consistency with RA The decision is based on the derivative of PF with
respect to design variables only Not reliant on probability (the absolute number) Mid ship bending moment (ship deck/sagging)
– NCAF at about $ 3 million corresponds to 10-4 target– Compares well to last line of defence, lifeboats at $
1 million More studies necessary for other limit states

30 SKJ©DNV
One criteria HE, QRA, SRA
Human error, navigation
Collision
Flooding
Evacuation Failure
Fire
?
Risk
Cost ?
Risk
Cost?
Risk
Cost?
Risk
Cost
Optimising risk control options according to their cost effectiveness: