14 - 1 © 2000 prentice-hall, inc. statistics nonparametric statistics chapter 14
TRANSCRIPT
14 - 14 - 11
© 2000 Prentice-Hall, Inc.© 2000 Prentice-Hall, Inc.
StatisticsStatistics
Nonparametric StatisticsNonparametric StatisticsChapter 14Chapter 14
14 - 14 - 22
© 2000 Prentice-Hall, Inc.© 2000 Prentice-Hall, Inc.
Learning ObjectivesLearning Objectives
1.1. Distinguish Parametric & Nonparametric Distinguish Parametric & Nonparametric Test Procedures Test Procedures
2.2. Explain a Variety of Nonparametric Test Explain a Variety of Nonparametric Test ProceduresProcedures
3.3. Solve Hypothesis Testing Problems Solve Hypothesis Testing Problems Using Nonparametric TestsUsing Nonparametric Tests
4.4. Compute Spearman’s Rank CorrelationCompute Spearman’s Rank Correlation
14 - 14 - 33
© 2000 Prentice-Hall, Inc.© 2000 Prentice-Hall, Inc.
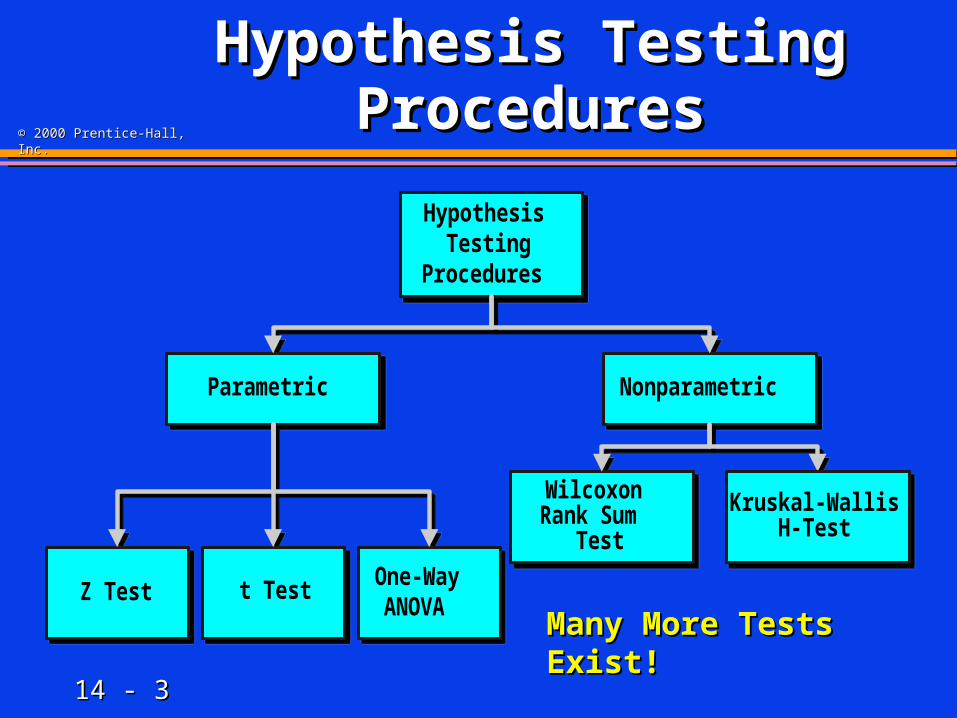
Hypothesis Testing Hypothesis Testing ProceduresProcedures
HypothesisTesting
Procedures
NonparametricParametric
Z Test
Kruskal-WallisH-Test
WilcoxonRank Sum
Test
t Test One-WayANOVA
HypothesisTesting
Procedures
NonparametricParametric
Z Test
Kruskal-WallisH-Test
WilcoxonRank Sum
Test
t Test One-WayANOVA
Many More Tests Exist!Many More Tests Exist!
14 - 14 - 44
© 2000 Prentice-Hall, Inc.© 2000 Prentice-Hall, Inc.
Parametric Test Parametric Test ProceduresProcedures
1.1. Involve Population ParametersInvolve Population Parameters Example: Population MeanExample: Population Mean
2.2. Require Interval Scale or Ratio ScaleRequire Interval Scale or Ratio Scale Whole Numbers or FractionsWhole Numbers or Fractions Example: Height in Inches (72, 60.5, 54.7)Example: Height in Inches (72, 60.5, 54.7)
3.3. Have Stringent AssumptionsHave Stringent Assumptions Example: Normal DistributionExample: Normal Distribution
4.4. Examples: Z Test, t Test, Examples: Z Test, t Test, 22 Test Test
14 - 14 - 55
© 2000 Prentice-Hall, Inc.© 2000 Prentice-Hall, Inc.
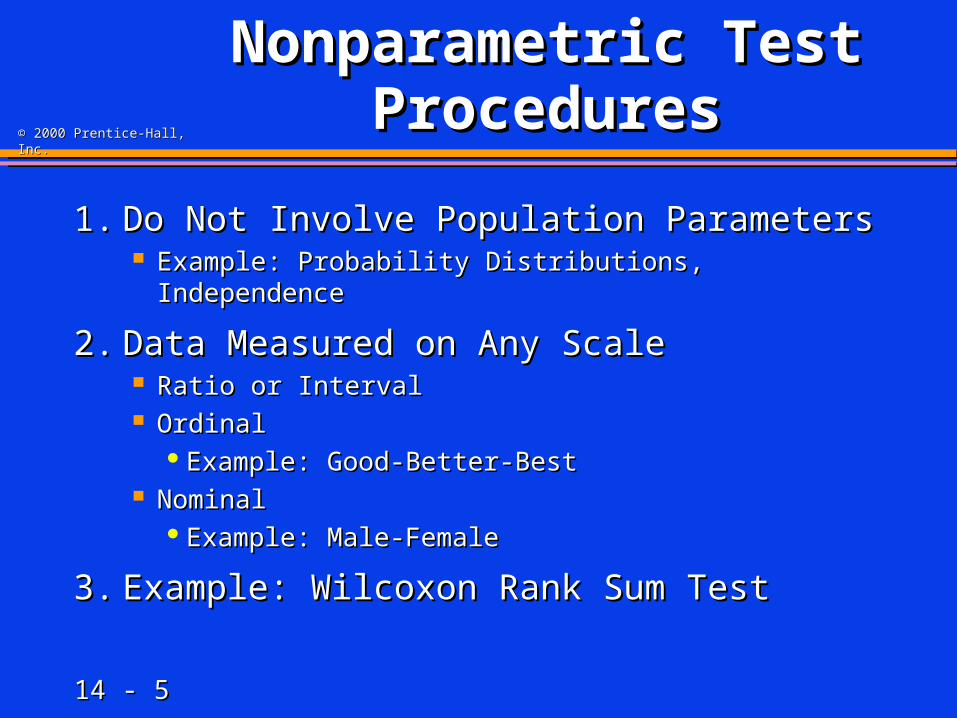
Nonparametric Test Nonparametric Test ProceduresProcedures
1.1. Do Not Involve Population ParametersDo Not Involve Population Parameters Example: Probability Distributions, IndependenceExample: Probability Distributions, Independence
2.2. Data Measured on Any ScaleData Measured on Any Scale Ratio or IntervalRatio or Interval OrdinalOrdinal
Example: Good-Better-BestExample: Good-Better-Best NominalNominal
Example: Male-FemaleExample: Male-Female
3.3. Example: Wilcoxon Rank Sum TestExample: Wilcoxon Rank Sum Test
14 - 14 - 66
© 2000 Prentice-Hall, Inc.© 2000 Prentice-Hall, Inc.
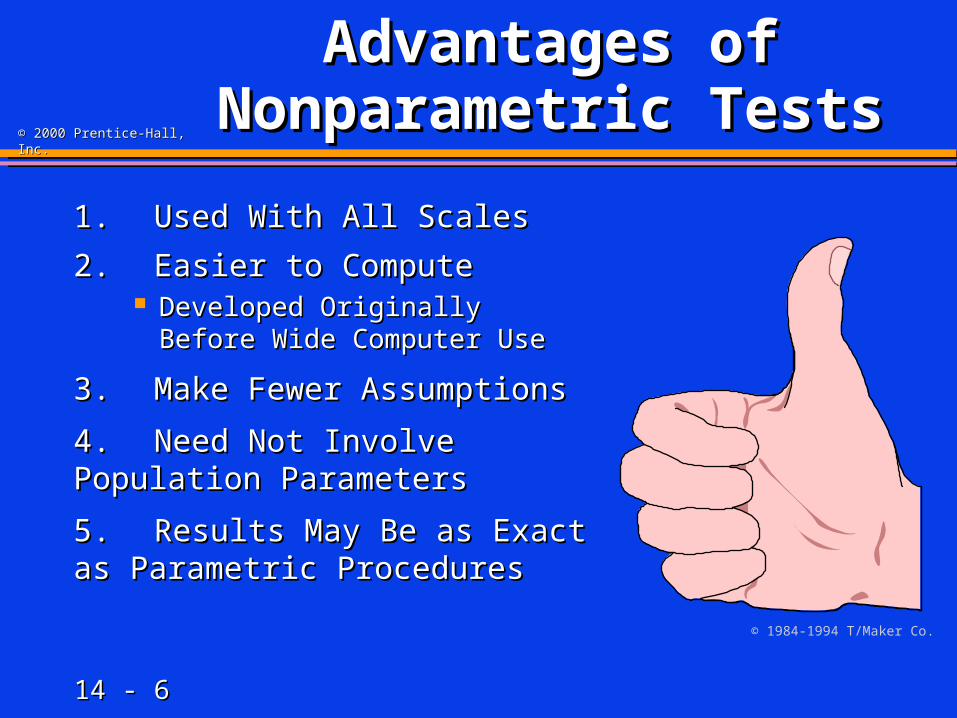
Advantages of Advantages of Nonparametric TestsNonparametric Tests
1.1. Used With All ScalesUsed With All Scales
2.2. Easier to ComputeEasier to Compute Developed Originally Before Developed Originally Before
Wide Computer UseWide Computer Use
3.3. Make Fewer AssumptionsMake Fewer Assumptions
4.4. Need Not Involve Need Not Involve Population ParametersPopulation Parameters
5.5. Results May Be as Exact as Results May Be as Exact as Parametric ProceduresParametric Procedures
© 1984-1994 T/Maker Co.
14 - 14 - 77
© 2000 Prentice-Hall, Inc.© 2000 Prentice-Hall, Inc.
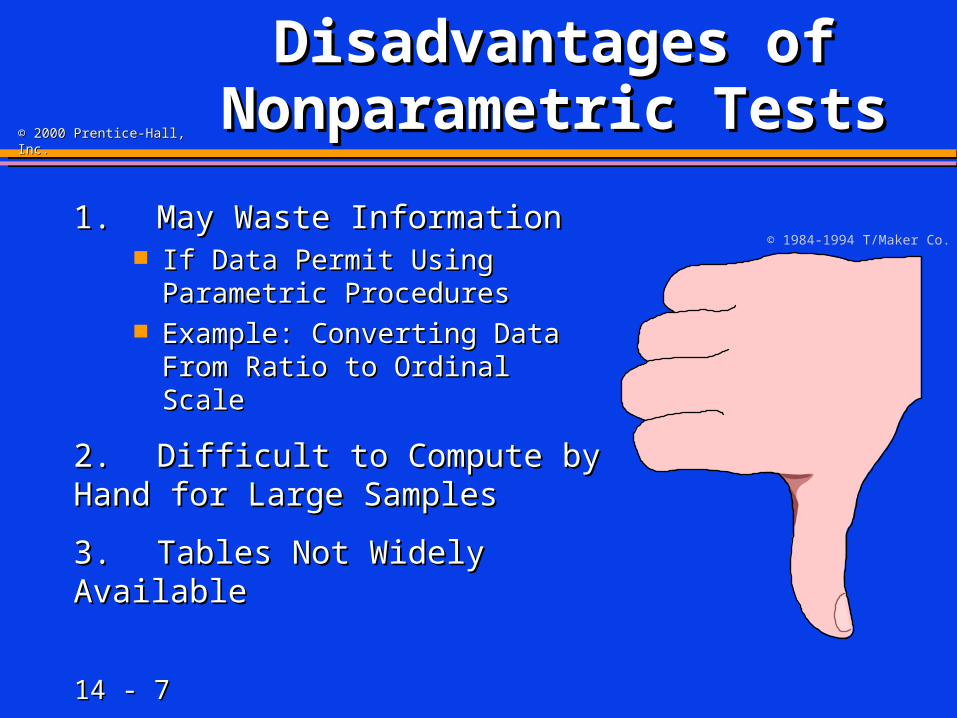
Disadvantages of Disadvantages of Nonparametric TestsNonparametric Tests
1.1. May Waste Information May Waste Information If Data Permit Using If Data Permit Using
Parametric ProceduresParametric Procedures Example: Converting Data Example: Converting Data
From Ratio to Ordinal ScaleFrom Ratio to Ordinal Scale
2.2. Difficult to Compute by Difficult to Compute by Hand for Large SamplesHand for Large Samples
3.3. Tables Not Widely Tables Not Widely AvailableAvailable
© 1984-1994 T/Maker Co.

14 - 14 - 88
© 2000 Prentice-Hall, Inc.© 2000 Prentice-Hall, Inc.
Frequently Used Frequently Used Nonparametric TestsNonparametric Tests
1.1. Sign Test Sign Test
2.2. Wilcoxon Rank Sum TestWilcoxon Rank Sum Test
3.3. Wilcoxon Signed Rank TestWilcoxon Signed Rank Test
4.4. Kruskal Wallis Kruskal Wallis HH-Test-Test
5.5. Friedman Friedman FFrr-Test-Test

14 - 14 - 99
© 2000 Prentice-Hall, Inc.© 2000 Prentice-Hall, Inc.
Sign Test Sign Test
14 - 14 - 1010
© 2000 Prentice-Hall, Inc.© 2000 Prentice-Hall, Inc.
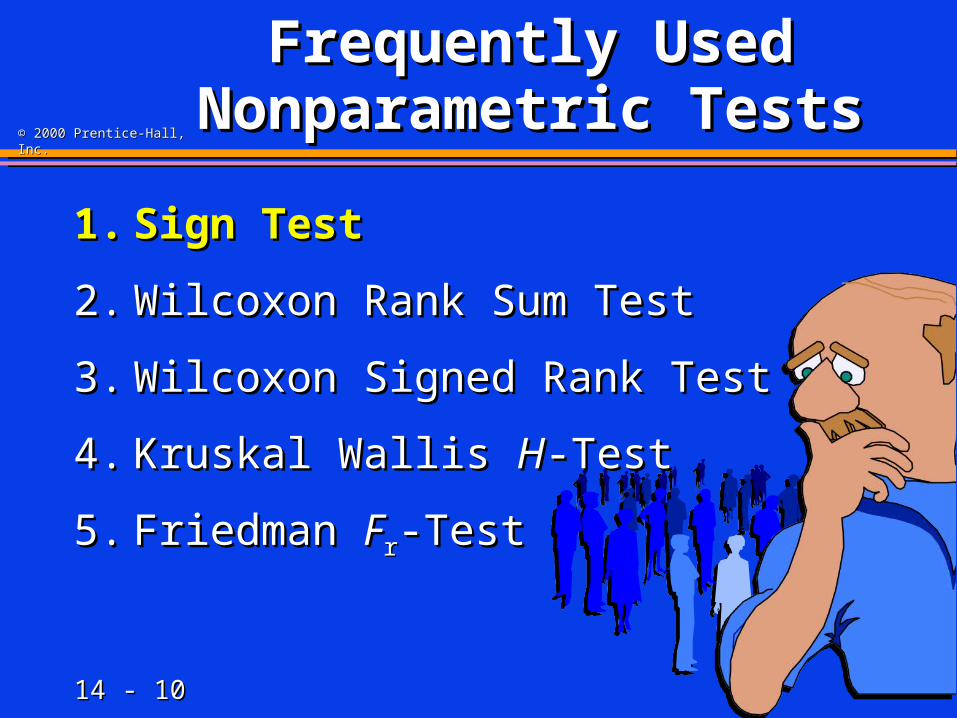
Frequently Used Frequently Used Nonparametric TestsNonparametric Tests
1.1. Sign Test Sign Test
2.2. Wilcoxon Rank Sum TestWilcoxon Rank Sum Test
3.3. Wilcoxon Signed Rank TestWilcoxon Signed Rank Test
4.4. Kruskal Wallis Kruskal Wallis HH-Test-Test
5.5. Friedman Friedman FFrr-Test-Test
14 - 14 - 1111
© 2000 Prentice-Hall, Inc.© 2000 Prentice-Hall, Inc.
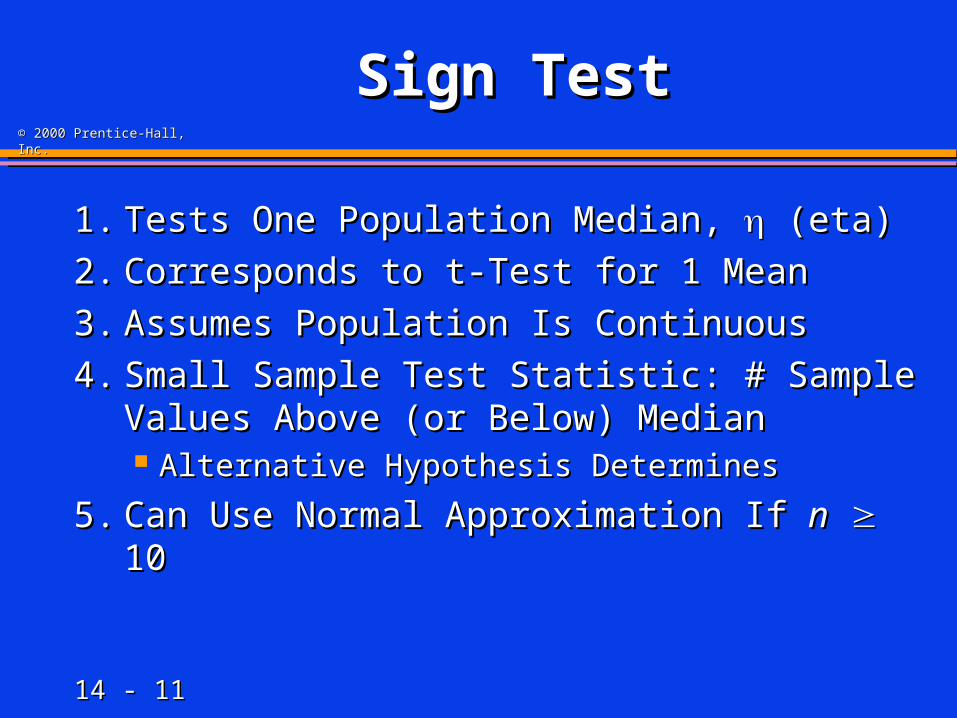
Sign Test Sign Test
1.1. Tests One Population Median, Tests One Population Median, (eta) (eta)
2.2. Corresponds to t-Test for 1 MeanCorresponds to t-Test for 1 Mean
3.3. Assumes Population Is ContinuousAssumes Population Is Continuous
4.4. Small Sample Test Statistic: # Sample Small Sample Test Statistic: # Sample Values Above (or Below) MedianValues Above (or Below) Median Alternative Hypothesis DeterminesAlternative Hypothesis Determines
5.5. Can Use Normal Approximation If Can Use Normal Approximation If nn 10 10
14 - 14 - 1212
© 2000 Prentice-Hall, Inc.© 2000 Prentice-Hall, Inc.
Sign Test Uses P-Sign Test Uses P-Value Value
to Make Decisionto Make Decision
.031.109
.219.273
.219
.109.031.004 .004
0%
10%
20%
30%
0 1 2 3 4 5 6 7 8 X
P(X)
.031.109
.219.273
.219
.109.031.004 .004
0%
10%
20%
30%
0 1 2 3 4 5 6 7 8 X
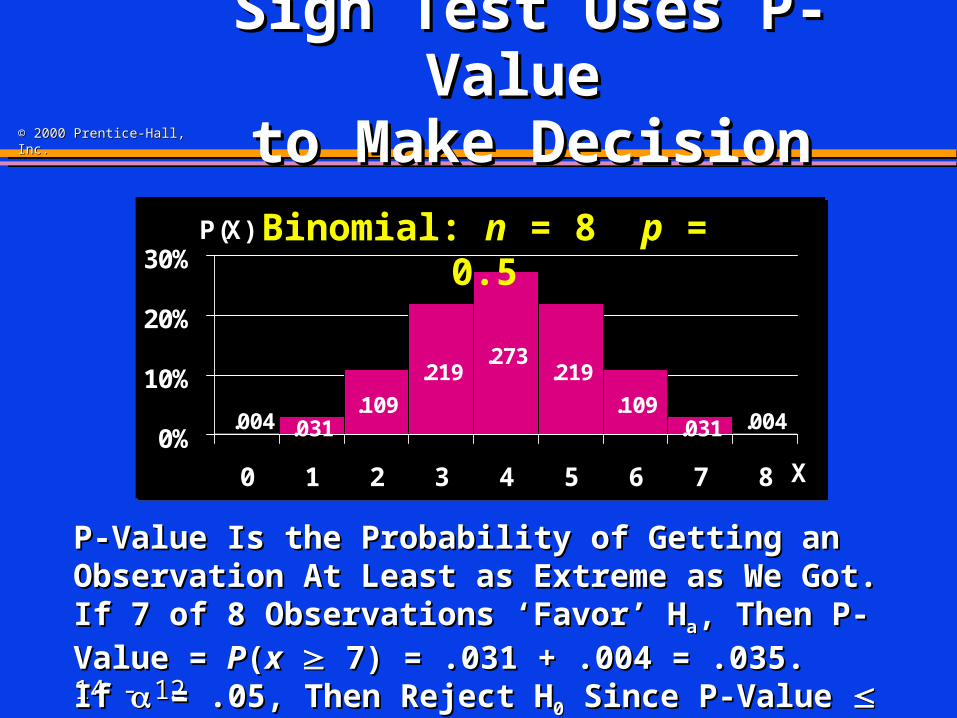
P(X) Binomial: n = 8 p = 0.5
P-Value Is the Probability of Getting an Observation At P-Value Is the Probability of Getting an Observation At Least as Extreme as We Got. If 7 of 8 Observations Least as Extreme as We Got. If 7 of 8 Observations ‘Favor’ H‘Favor’ Haa, Then P-Value = , Then P-Value = PP((xx 7) = .031 + .004 = .035. 7) = .031 + .004 = .035.
If If = .05, Then Reject H = .05, Then Reject H00 Since P-Value Since P-Value ..
14 - 14 - 1313
© 2000 Prentice-Hall, Inc.© 2000 Prentice-Hall, Inc.
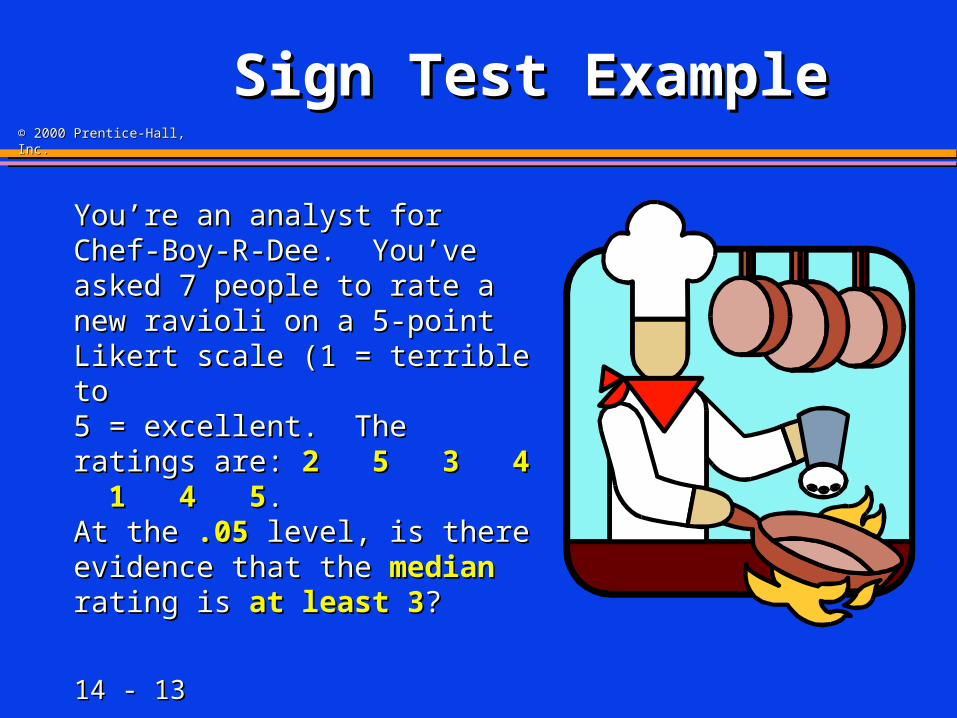
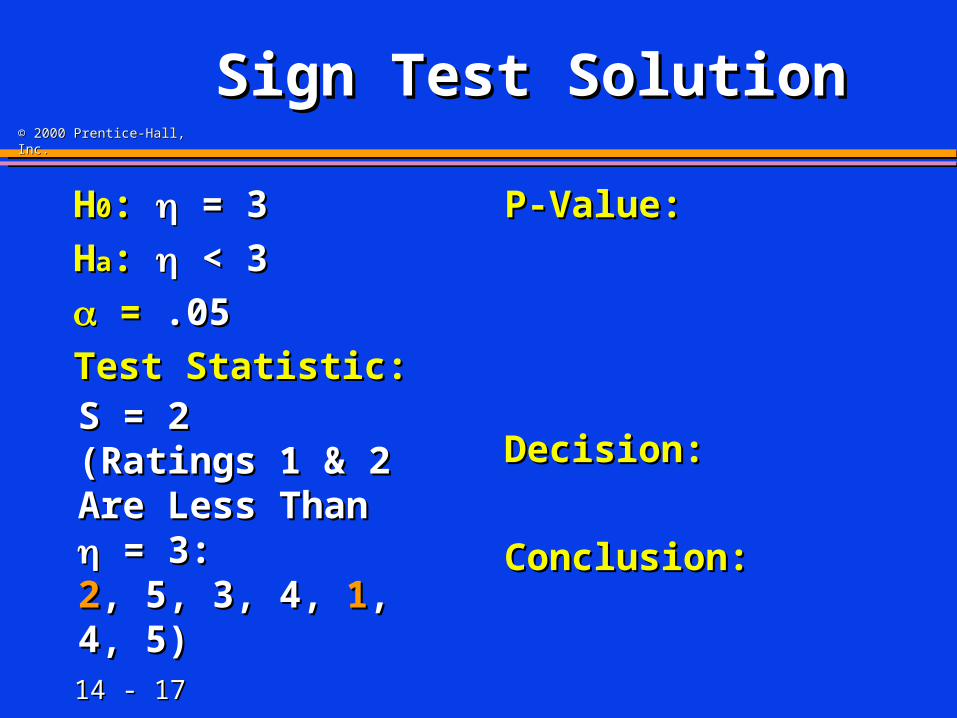
Sign Test ExampleSign Test Example
You’re an analyst for Chef-You’re an analyst for Chef-Boy-R-Dee. You’ve asked Boy-R-Dee. You’ve asked 7 people to rate a new 7 people to rate a new ravioli on a 5-point Likert ravioli on a 5-point Likert scale (1 = terrible to scale (1 = terrible to 5 = excellent. The ratings 5 = excellent. The ratings are: are: 2 5 3 4 1 4 52 5 3 4 1 4 5. . At the At the .05.05 level, is there level, is there evidence that the evidence that the medianmedian rating is rating is at least 3at least 3??

14 - 14 - 1414
© 2000 Prentice-Hall, Inc.© 2000 Prentice-Hall, Inc.
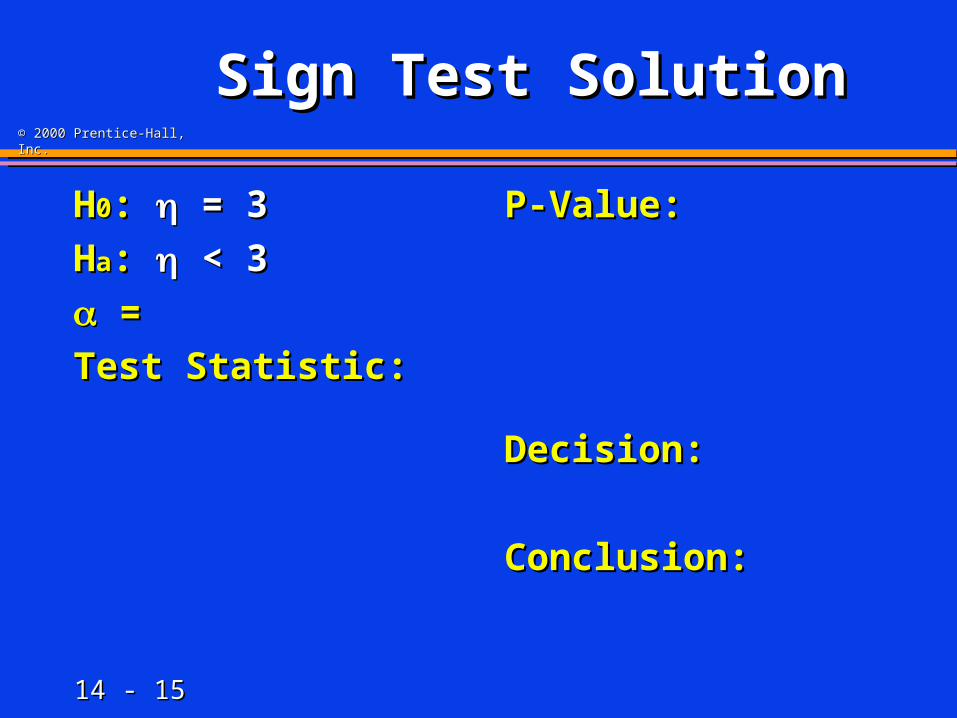
Sign Test SolutionSign Test Solution
HH00: :
HHaa: :
= =
Test Statistic:Test Statistic:
P-Value: P-Value:
Decision:Decision:
Conclusion:Conclusion:
14 - 14 - 1515
© 2000 Prentice-Hall, Inc.© 2000 Prentice-Hall, Inc.
Sign Test SolutionSign Test Solution
HH00: : = = 33
HHaa: : < 3 < 3
= =
Test Statistic:Test Statistic:
P-Value: P-Value:
Decision:Decision:
Conclusion:Conclusion:

14 - 14 - 1616
© 2000 Prentice-Hall, Inc.© 2000 Prentice-Hall, Inc.
Sign Test SolutionSign Test Solution
HH00: : = = 33
HHaa: : < 3 < 3
= = .05.05
Test Statistic:Test Statistic:
P-Value: P-Value:
Decision:Decision:
Conclusion:Conclusion:
14 - 14 - 1717
© 2000 Prentice-Hall, Inc.© 2000 Prentice-Hall, Inc.
Sign Test SolutionSign Test Solution
HH00: : = = 33
HHaa: : < 3 < 3
= = .05.05
Test Statistic:Test Statistic:
P-Value: P-Value:
Decision:Decision:
Conclusion:Conclusion:
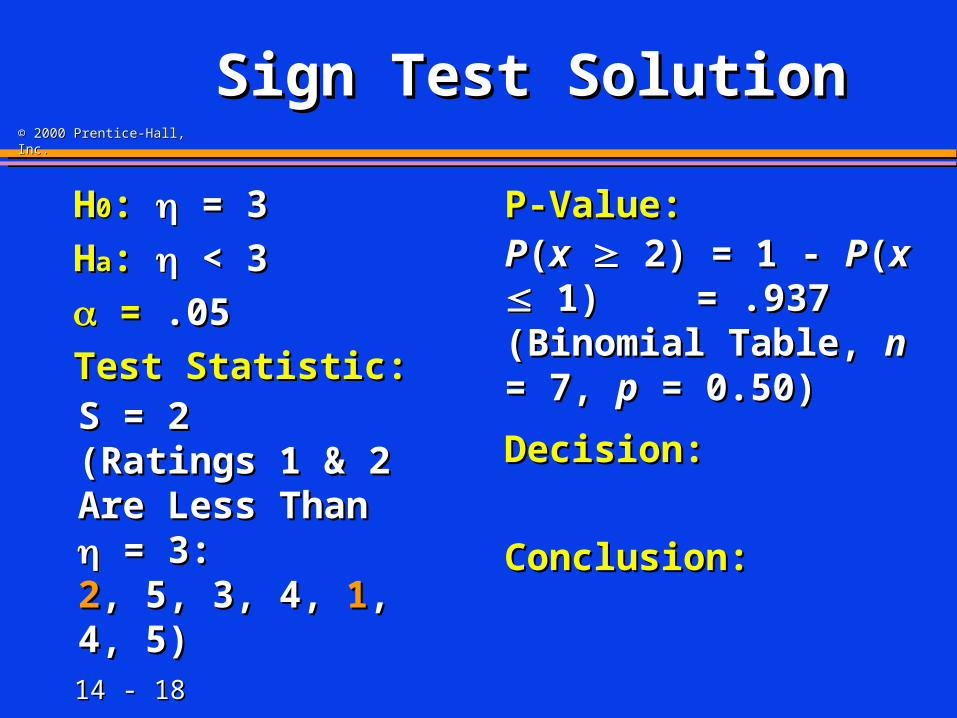
S = 2 S = 2 (Ratings 1 & 2 Are (Ratings 1 & 2 Are Less Than Less Than = = 3:3:22, 5, 3, 4, , 5, 3, 4, 11, 4, 5), 4, 5)
14 - 14 - 1818
© 2000 Prentice-Hall, Inc.© 2000 Prentice-Hall, Inc.
Sign Test SolutionSign Test Solution
HH00: : = = 33
HHaa: : < 3 < 3
= = .05.05
Test Statistic:Test Statistic:
P-Value: P-Value:
Decision:Decision:
Conclusion:Conclusion:
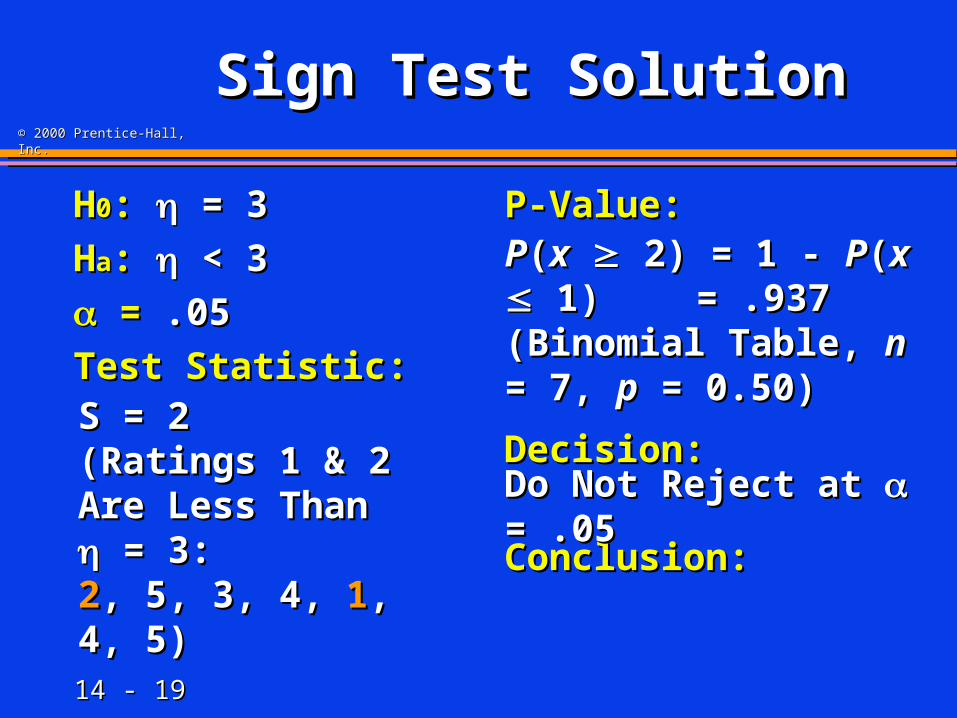
PP((xx 2) = 1 - 2) = 1 - PP((xx 1) 1) = .937= .937
(Binomial Table, (Binomial Table, nn = 7, = 7, pp = 0.50) = 0.50)
S = 2 S = 2 (Ratings 1 & 2 Are (Ratings 1 & 2 Are Less Than Less Than = = 3:3:22, 5, 3, 4, , 5, 3, 4, 11, 4, 5), 4, 5)
14 - 14 - 1919
© 2000 Prentice-Hall, Inc.© 2000 Prentice-Hall, Inc.
Sign Test SolutionSign Test Solution
HH00: : = = 33
HHaa: : < 3 < 3
= = .05.05
Test Statistic:Test Statistic:
P-Value: P-Value:
Decision:Decision:
Conclusion:Conclusion:
Do Not Reject at Do Not Reject at = .05 = .05
PP((xx 2) = 1 - 2) = 1 - PP((xx 1) 1) = .937= .937
(Binomial Table, (Binomial Table, nn = 7, = 7, pp = 0.50) = 0.50)
S = 2 S = 2 (Ratings 1 & 2 Are (Ratings 1 & 2 Are Less Than Less Than = = 3:3:22, 5, 3, 4, , 5, 3, 4, 11, 4, 5), 4, 5)
14 - 14 - 2020
© 2000 Prentice-Hall, Inc.© 2000 Prentice-Hall, Inc.
Sign Test SolutionSign Test Solution
HH00: : = = 33
HHaa: : < 3 < 3
= = .05.05
Test Statistic:Test Statistic:
P-Value: P-Value:
Decision:Decision:
Conclusion:Conclusion:
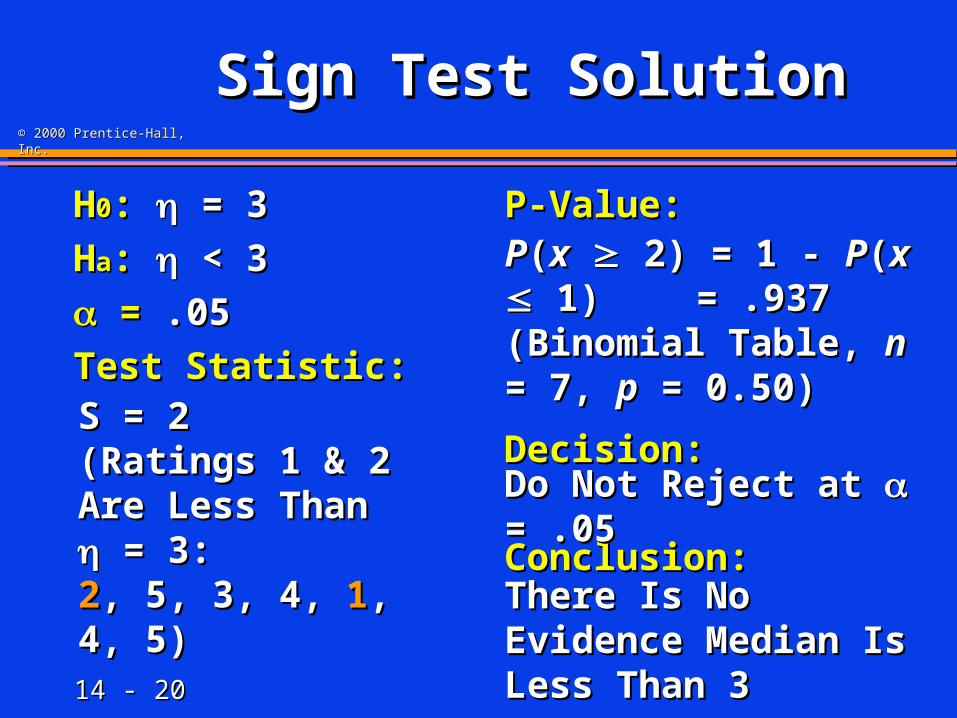
Do Not Reject at Do Not Reject at = .05 = .05
There Is No Evidence There Is No Evidence Median Is Less Than 3Median Is Less Than 3
PP((xx 2) = 1 - 2) = 1 - PP((xx 1) 1) = .937= .937
(Binomial Table, (Binomial Table, nn = 7, = 7, pp = 0.50) = 0.50)
S = 2 S = 2 (Ratings 1 & 2 Are (Ratings 1 & 2 Are Less Than Less Than = = 3:3:22, 5, 3, 4, , 5, 3, 4, 11, 4, 5), 4, 5)

14 - 14 - 2121
© 2000 Prentice-Hall, Inc.© 2000 Prentice-Hall, Inc.
Wilcoxon Rank Sum Wilcoxon Rank Sum Test Test

14 - 14 - 2222
© 2000 Prentice-Hall, Inc.© 2000 Prentice-Hall, Inc.
Frequently Used Frequently Used Nonparametric TestsNonparametric Tests
1.1. Sign Test Sign Test
2.2. Wilcoxon Rank Sum TestWilcoxon Rank Sum Test
3.3. Wilcoxon Signed Rank TestWilcoxon Signed Rank Test
4.4. Kruskal Wallis Kruskal Wallis HH-Test-Test
5.5. Friedman Friedman FFrr-Test-Test
14 - 14 - 2323
© 2000 Prentice-Hall, Inc.© 2000 Prentice-Hall, Inc.
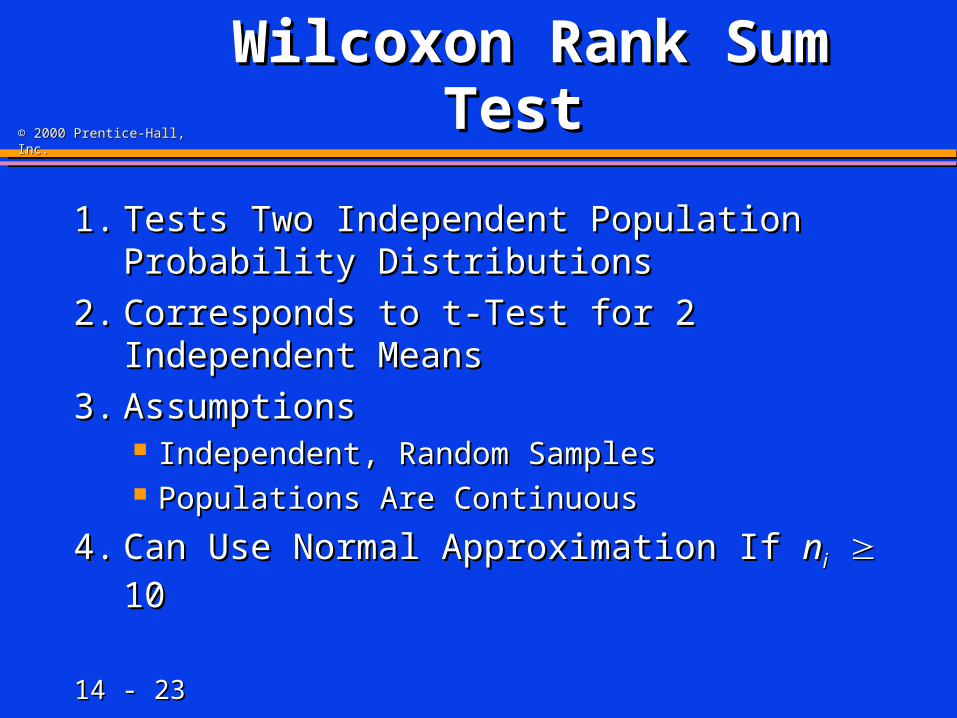
Wilcoxon Rank Sum Wilcoxon Rank Sum Test Test
1.1. Tests Two Independent Population Tests Two Independent Population Probability DistributionsProbability Distributions
2.2. Corresponds to t-Test for 2 Independent Corresponds to t-Test for 2 Independent MeansMeans
3.3. AssumptionsAssumptions Independent, Random SamplesIndependent, Random Samples Populations Are ContinuousPopulations Are Continuous
4.4. Can Use Normal Approximation If Can Use Normal Approximation If nnii 10 10
14 - 14 - 2424
© 2000 Prentice-Hall, Inc.© 2000 Prentice-Hall, Inc.
Wilcoxon Rank Sum Wilcoxon Rank Sum Test Test
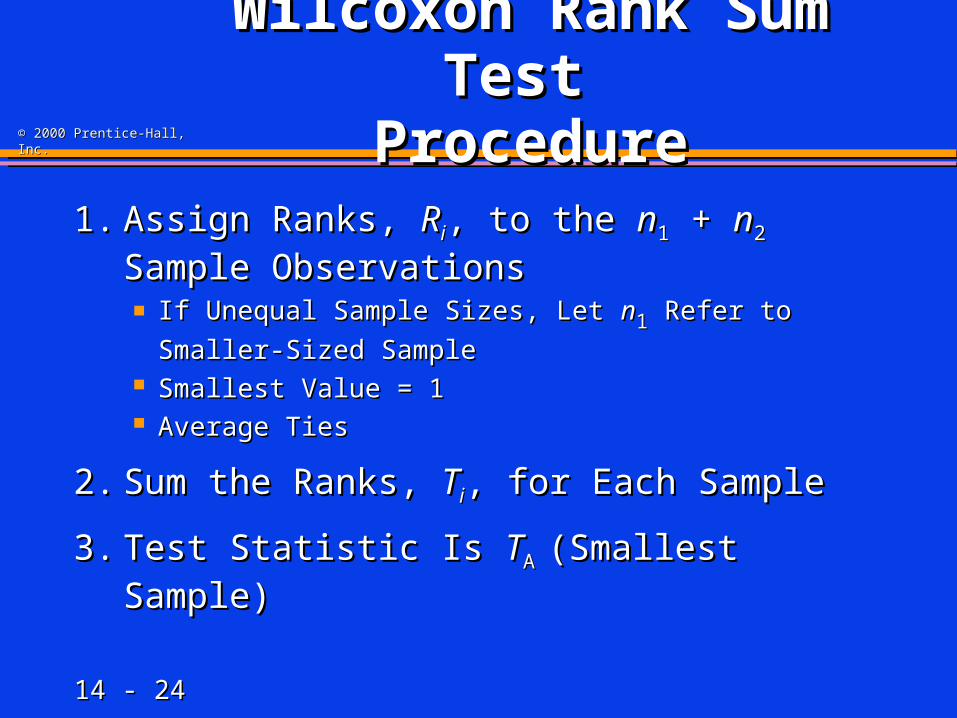
ProcedureProcedure1.1. Assign Ranks, Assign Ranks, RRii, to the , to the nn11 + + nn22 Sample Sample
ObservationsObservations If Unequal Sample Sizes, Let If Unequal Sample Sizes, Let nn11 Refer to Smaller- Refer to Smaller-
Sized SampleSized Sample Smallest Value = 1Smallest Value = 1 Average TiesAverage Ties
2.2. Sum the Ranks, Sum the Ranks, TTii, for Each Sample, for Each Sample
3.3. Test Statistic Is Test Statistic Is TTA A (Smallest Sample)(Smallest Sample)
14 - 14 - 2525
© 2000 Prentice-Hall, Inc.© 2000 Prentice-Hall, Inc.
Wilcoxon Rank Sum Wilcoxon Rank Sum Test Test
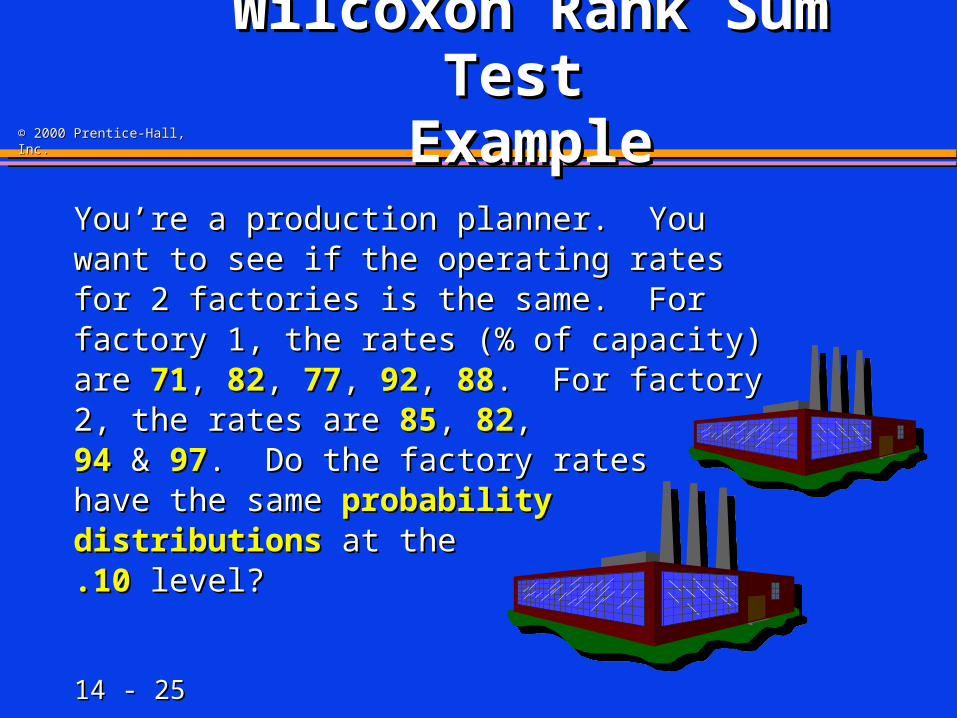
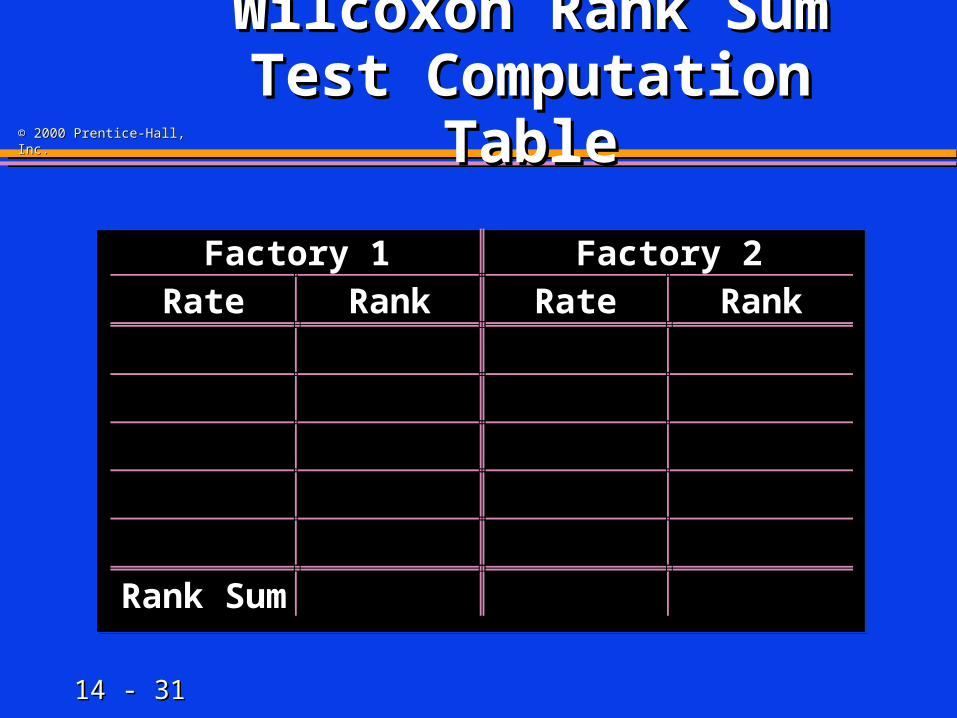
ExampleExampleYou’re a production planner. You want to You’re a production planner. You want to see if the operating rates for 2 factories is see if the operating rates for 2 factories is the same. For factory 1, the rates (% of the same. For factory 1, the rates (% of capacity) are capacity) are 7171, , 8282, , 7777, , 9292, , 8888. For . For factory 2, the rates are factory 2, the rates are 8585, , 8282, , 9494 & & 9797. Do the factory rates . Do the factory rates have the same have the same probability probability distributionsdistributions at the at the .10.10 level? level?
14 - 14 - 2626
© 2000 Prentice-Hall, Inc.© 2000 Prentice-Hall, Inc.
Wilcoxon Rank Sum Wilcoxon Rank Sum Test Test
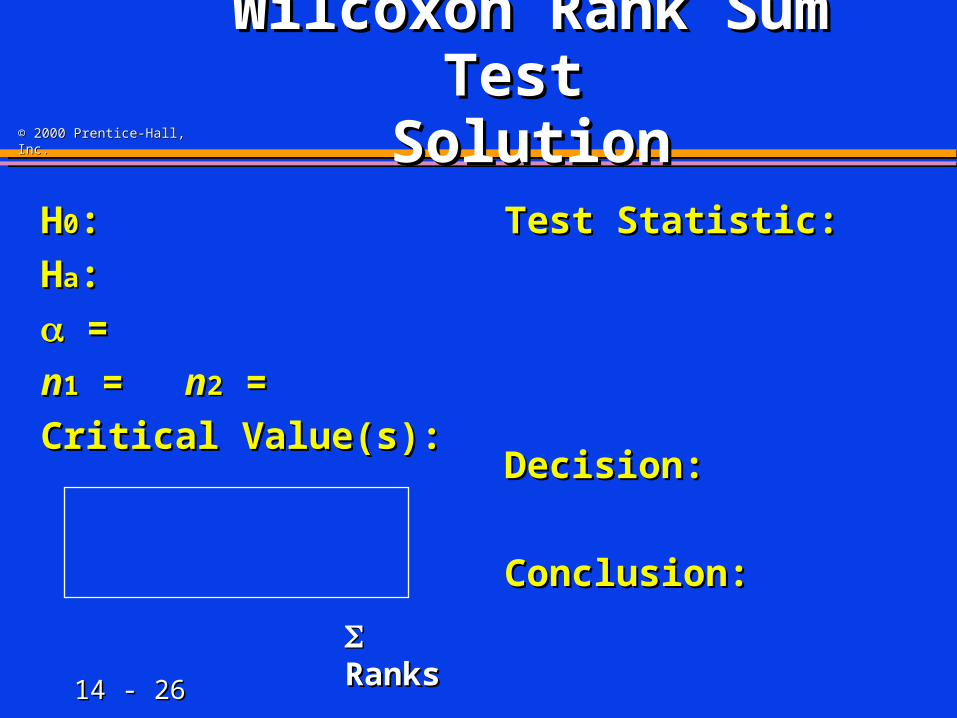
SolutionSolutionHH00::
HHaa::
==
nn11 = = nn22 = =
Critical Value(s):Critical Value(s):
Test Statistic: Test Statistic:
Decision:Decision:
Conclusion:Conclusion:
RanksRanks
14 - 14 - 2727
© 2000 Prentice-Hall, Inc.© 2000 Prentice-Hall, Inc.
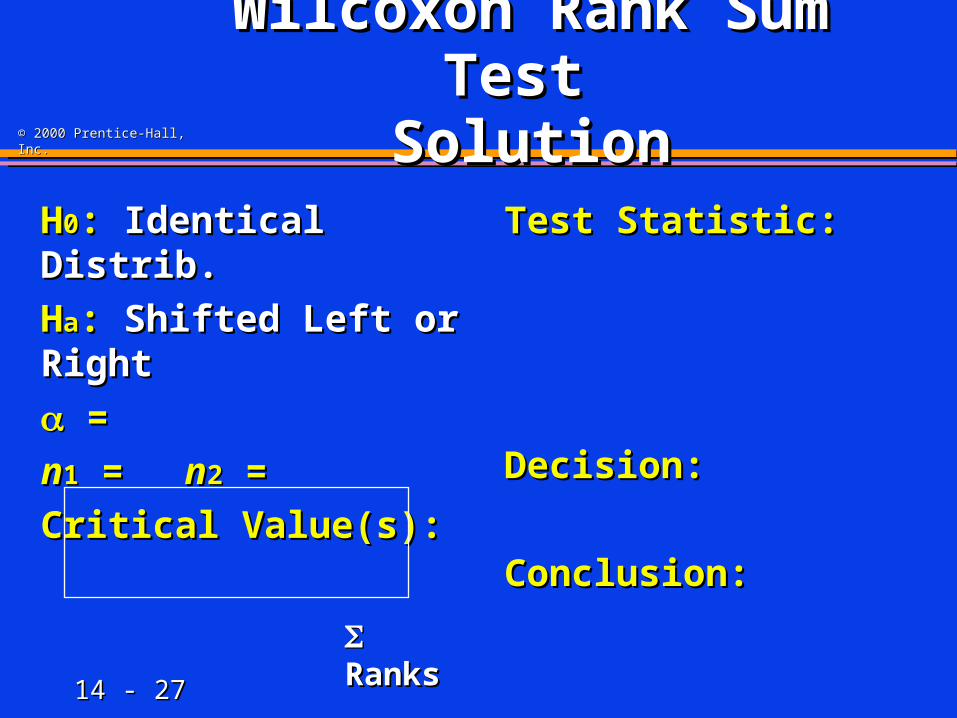
Wilcoxon Rank Sum Wilcoxon Rank Sum Test Test
SolutionSolutionHH00: : Identical Distrib.Identical Distrib.
HHaa: : Shifted Left or RightShifted Left or Right
==
nn11 = = nn22 = =
Critical Value(s):Critical Value(s):
Test Statistic: Test Statistic:
Decision:Decision:
Conclusion:Conclusion:
RanksRanks
14 - 14 - 2828
© 2000 Prentice-Hall, Inc.© 2000 Prentice-Hall, Inc.
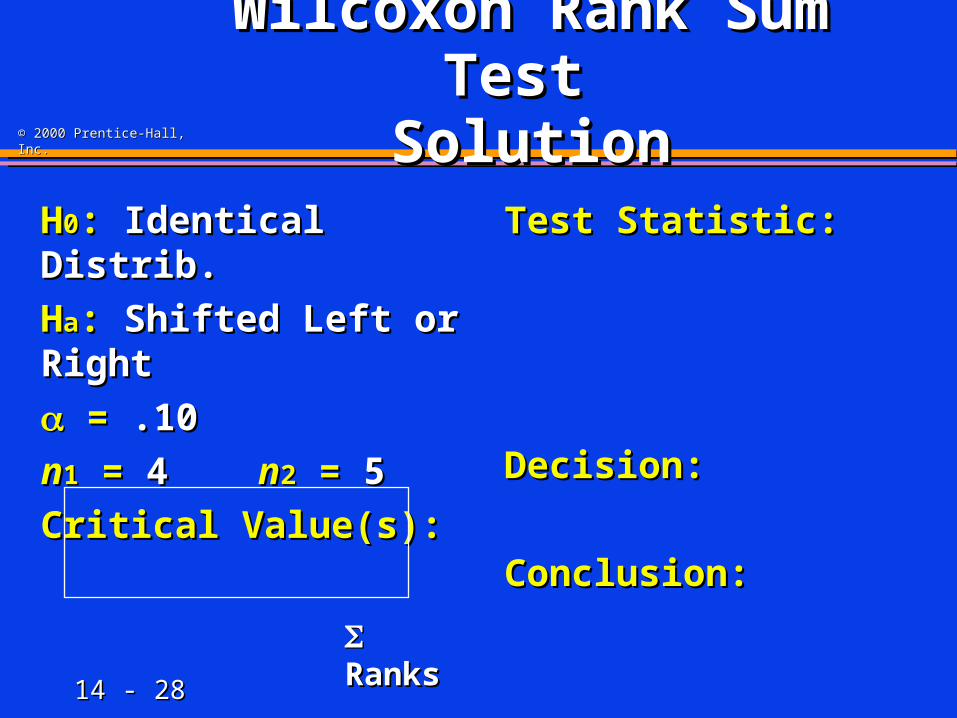
Wilcoxon Rank Sum Wilcoxon Rank Sum Test Test
SolutionSolutionHH00: : Identical Distrib.Identical Distrib.
HHaa: : Shifted Left or RightShifted Left or Right
= = .10.10
nn11 = = 4 4 nn22 = = 5 5
Critical Value(s):Critical Value(s):
Test Statistic: Test Statistic:
Decision:Decision:
Conclusion:Conclusion:
RanksRanks
14 - 14 - 2929
© 2000 Prentice-Hall, Inc.© 2000 Prentice-Hall, Inc.
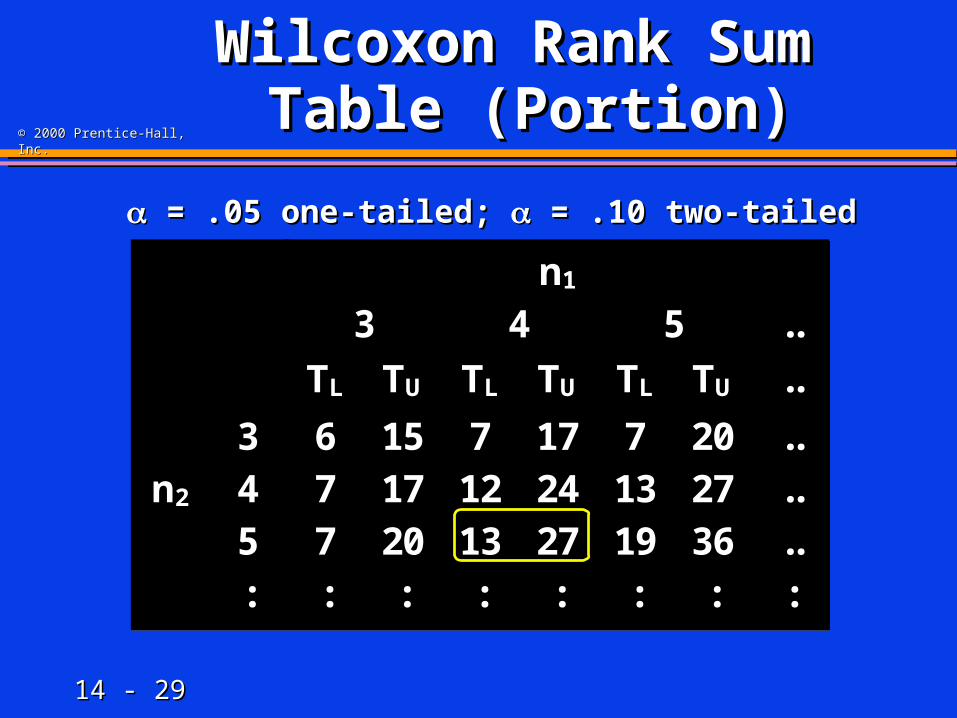
Wilcoxon Rank Sum Wilcoxon Rank Sum Table (Portion)Table (Portion)
n1
3 4 5 ..
TL TU TL TU TL TU ..
3 6 15 7 17 7 20 ..n2 4 7 17 12 24 13 27 ..
5 7 20 13 27 19 36 ..: : : : : : : :
n1
3 4 5 ..
TL TU TL TU TL TU ..
3 6 15 7 17 7 20 ..n2 4 7 17 12 24 13 27 ..
5 7 20 13 27 19 36 ..: : : : : : : :
= .05 one-tailed; = .05 one-tailed; = .10 two-tailed = .10 two-tailed
14 - 14 - 3030
© 2000 Prentice-Hall, Inc.© 2000 Prentice-Hall, Inc.
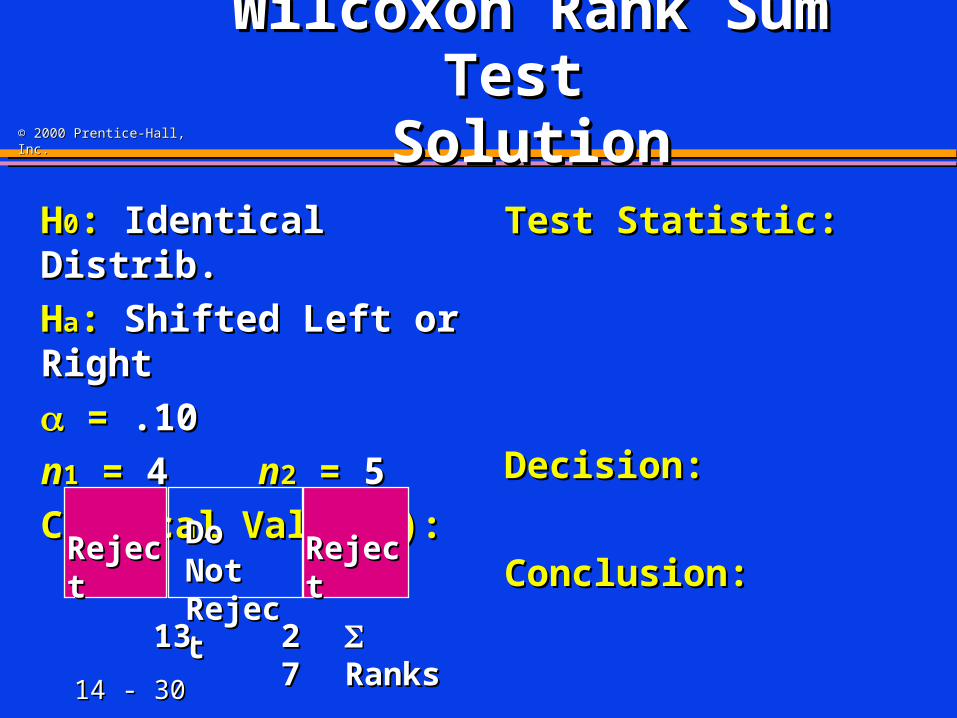
Wilcoxon Rank Sum Wilcoxon Rank Sum Test Test
SolutionSolutionHH00: : Identical Distrib.Identical Distrib.
HHaa: : Shifted Left or RightShifted Left or Right
= = .10.10
nn11 = = 4 4 nn22 = = 5 5
Critical Value(s):Critical Value(s):
Test Statistic: Test Statistic:
Decision:Decision:
Conclusion:Conclusion:RejectReject RejectRejectDo Not Do Not
RejectReject
1313 2727 RanksRanks
14 - 14 - 3131
© 2000 Prentice-Hall, Inc.© 2000 Prentice-Hall, Inc.
Wilcoxon Rank Sum Wilcoxon Rank Sum Test Computation Test Computation
TableTable
Factory 1 Factory 2Rate Rank Rate Rank
Rank Sum
14 - 14 - 3232
© 2000 Prentice-Hall, Inc.© 2000 Prentice-Hall, Inc.
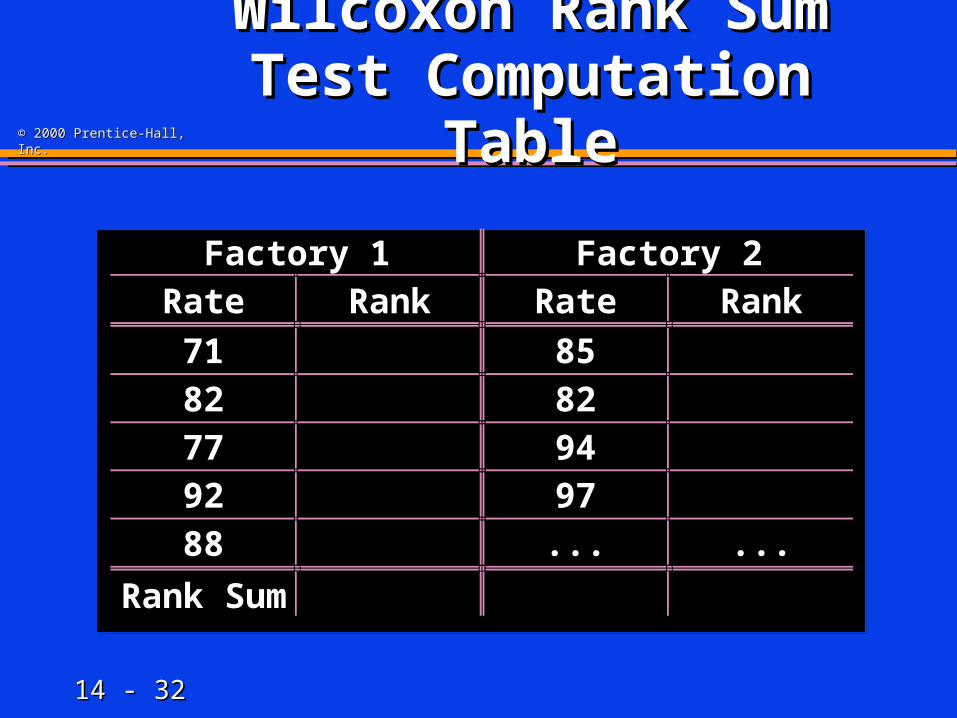
Wilcoxon Rank Sum Wilcoxon Rank Sum Test Computation Test Computation
TableTable
Factory 1 Factory 2Rate Rank Rate Rank
71 8582 8277 9492 9788 ... ...
Rank Sum
14 - 14 - 3333
© 2000 Prentice-Hall, Inc.© 2000 Prentice-Hall, Inc.
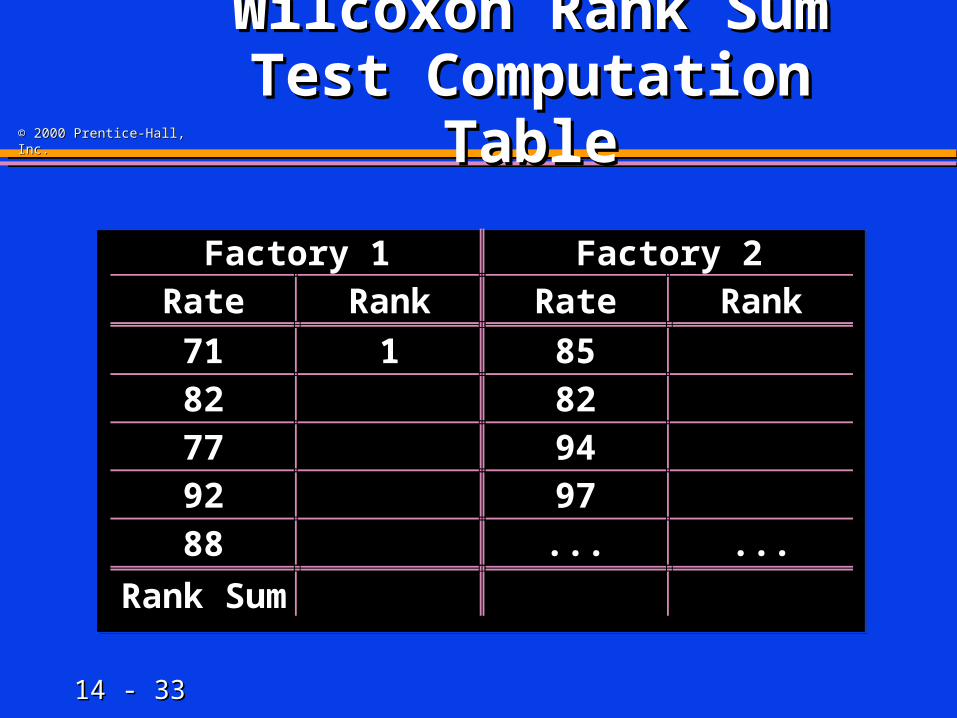
Wilcoxon Rank Sum Wilcoxon Rank Sum Test Computation Test Computation
TableTable
Factory 1 Factory 2Rate Rank Rate Rank
71 1 8582 8277 9492 9788 ... ...
Rank Sum

14 - 14 - 3434
© 2000 Prentice-Hall, Inc.© 2000 Prentice-Hall, Inc.
Wilcoxon Rank Sum Wilcoxon Rank Sum Test Computation Test Computation
TableTable
Factory 1 Factory 2Rate Rank Rate Rank
71 1 8582 8277 2 9492 9788 ... ...
Rank Sum

14 - 14 - 3535
© 2000 Prentice-Hall, Inc.© 2000 Prentice-Hall, Inc.
Wilcoxon Rank Sum Wilcoxon Rank Sum Test Computation Test Computation
TableTable
Factory 1 Factory 2Rate Rank Rate Rank
71 1 8582 3 82 477 2 9492 9788 ... ...
Rank Sum

14 - 14 - 3636
© 2000 Prentice-Hall, Inc.© 2000 Prentice-Hall, Inc.
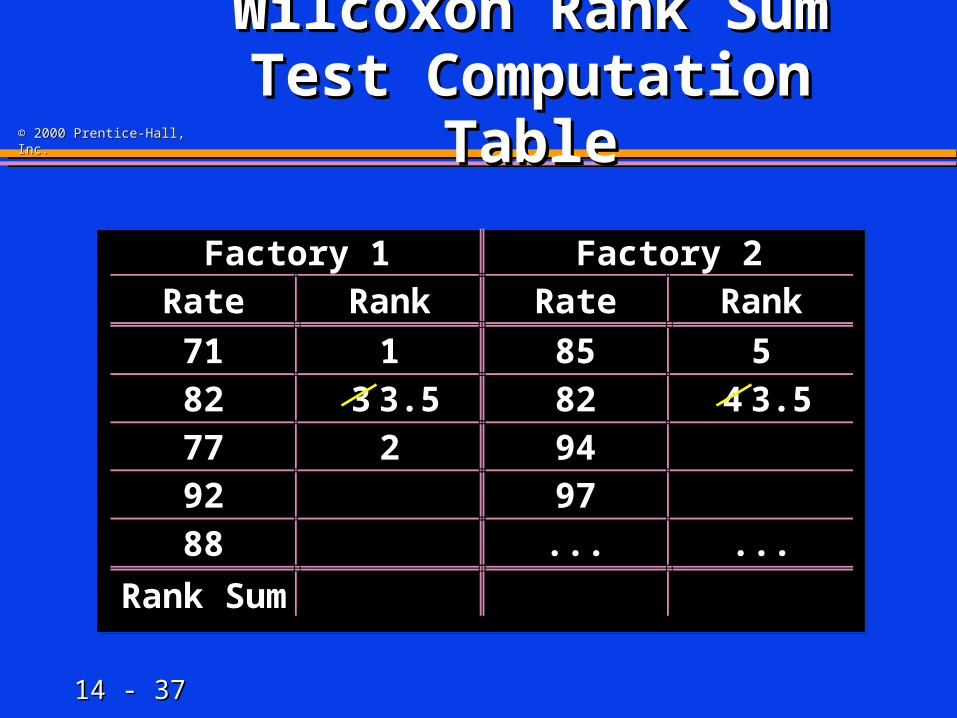
Wilcoxon Rank Sum Wilcoxon Rank Sum Test Computation Test Computation
TableTable
Factory 1 Factory 2Rate Rank Rate Rank
71 1 8582 3 3.5 82 4 3.577 2 9492 9788 ... ...
Rank Sum
14 - 14 - 3737
© 2000 Prentice-Hall, Inc.© 2000 Prentice-Hall, Inc.
Wilcoxon Rank Sum Wilcoxon Rank Sum Test Computation Test Computation
TableTable
Factory 1 Factory 2Rate Rank Rate Rank
71 1 85 582 3 3.5 82 4 3.577 2 9492 9788 ... ...
Rank Sum
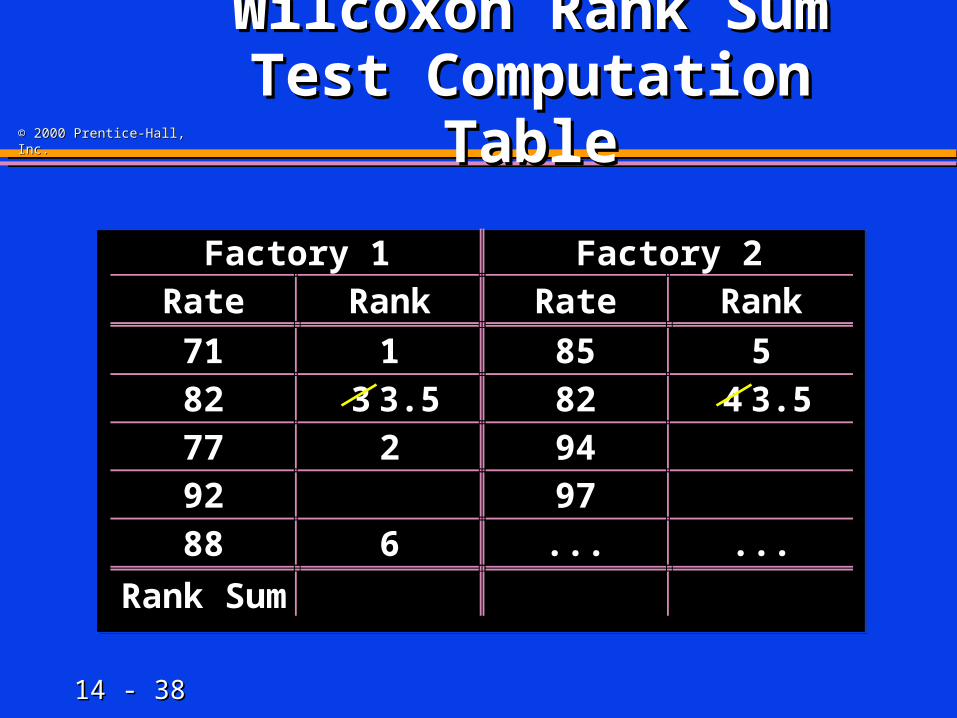
14 - 14 - 3838
© 2000 Prentice-Hall, Inc.© 2000 Prentice-Hall, Inc.
Wilcoxon Rank Sum Wilcoxon Rank Sum Test Computation Test Computation
TableTable
Factory 1 Factory 2Rate Rank Rate Rank
71 1 85 582 3 3.5 82 4 3.577 2 9492 9788 6 ... ...
Rank Sum

14 - 14 - 3939
© 2000 Prentice-Hall, Inc.© 2000 Prentice-Hall, Inc.
Wilcoxon Rank Sum Wilcoxon Rank Sum Test Computation Test Computation
TableTable
Factory 1 Factory 2Rate Rank Rate Rank
71 1 85 582 3 3.5 82 4 3.577 2 9492 7 9788 6 ... ...
Rank Sum
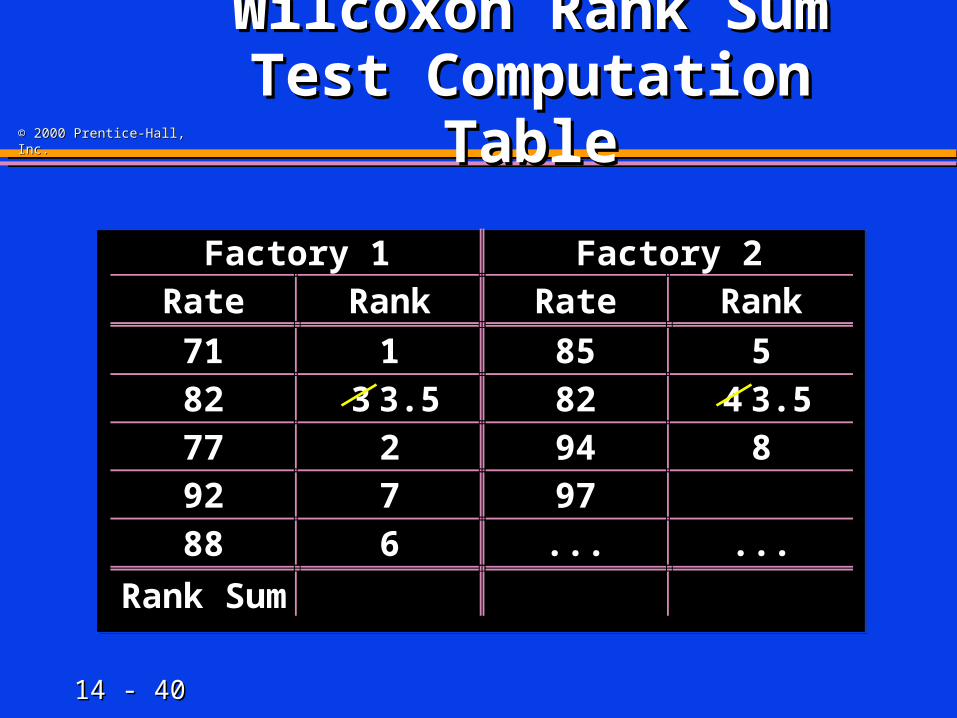
14 - 14 - 4040
© 2000 Prentice-Hall, Inc.© 2000 Prentice-Hall, Inc.
Wilcoxon Rank Sum Wilcoxon Rank Sum Test Computation Test Computation
TableTable
Factory 1 Factory 2Rate Rank Rate Rank
71 1 85 582 3 3.5 82 4 3.577 2 94 892 7 9788 6 ... ...
Rank Sum

14 - 14 - 4141
© 2000 Prentice-Hall, Inc.© 2000 Prentice-Hall, Inc.
Wilcoxon Rank Sum Wilcoxon Rank Sum Test Computation Test Computation
TableTable
Factory 1 Factory 2Rate Rank Rate Rank
71 1 85 582 3 3.5 82 4 3.577 2 94 892 7 97 988 6 ... ...
Rank Sum

14 - 14 - 4242
© 2000 Prentice-Hall, Inc.© 2000 Prentice-Hall, Inc.
Wilcoxon Rank Sum Wilcoxon Rank Sum Test Computation Test Computation
TableTable
Factory 1 Factory 2Rate Rank Rate Rank
71 1 85 582 3 3.5 82 4 3.577 2 94 892 7 97 988 6 ... ...
Rank Sum 19.5 25.5
14 - 14 - 4343
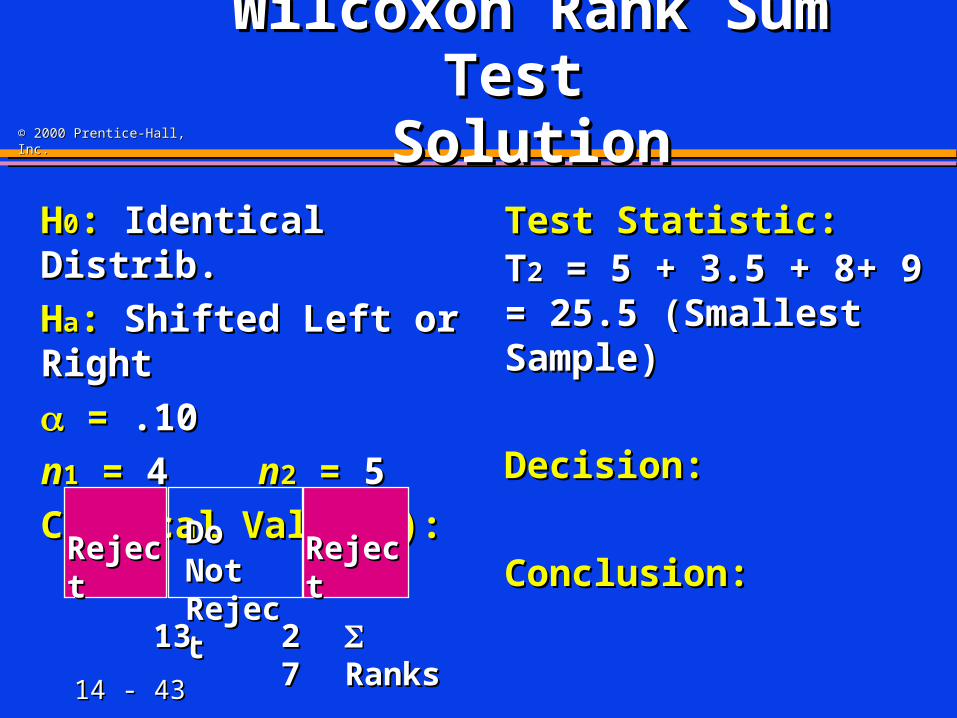
© 2000 Prentice-Hall, Inc.© 2000 Prentice-Hall, Inc.
Wilcoxon Rank Sum Wilcoxon Rank Sum Test Test
SolutionSolutionHH00: : Identical Distrib.Identical Distrib.
HHaa: : Shifted Left or RightShifted Left or Right
= = .10.10
nn11 = = 4 4 nn22 = = 5 5
Critical Value(s):Critical Value(s):
Test Statistic: Test Statistic:
Decision:Decision:
Conclusion:Conclusion:RejectReject RejectRejectDo Not Do Not
RejectReject
1313 2727 RanksRanks
TT22 = 5 + 3.5 + 8+ 9 = 25.5 = 5 + 3.5 + 8+ 9 = 25.5 (Smallest Sample)(Smallest Sample)

14 - 14 - 4444
© 2000 Prentice-Hall, Inc.© 2000 Prentice-Hall, Inc.
Wilcoxon Rank Sum Wilcoxon Rank Sum Test Test
SolutionSolutionHH00: : Identical Distrib.Identical Distrib.
HHaa: : Shifted Left or RightShifted Left or Right
= = .10.10
nn11 = = 4 4 nn22 = = 5 5
Critical Value(s):Critical Value(s):
Test Statistic: Test Statistic:
Decision:Decision:
Conclusion:Conclusion:
Do Not Reject at Do Not Reject at = .10 = .10RejectReject RejectRejectDo Not Do Not
RejectReject
1313 2727 RanksRanks
TT22 = 5 + 3.5 + 8+ 9 = 25.5 = 5 + 3.5 + 8+ 9 = 25.5 (Smallest Sample)(Smallest Sample)
14 - 14 - 4545
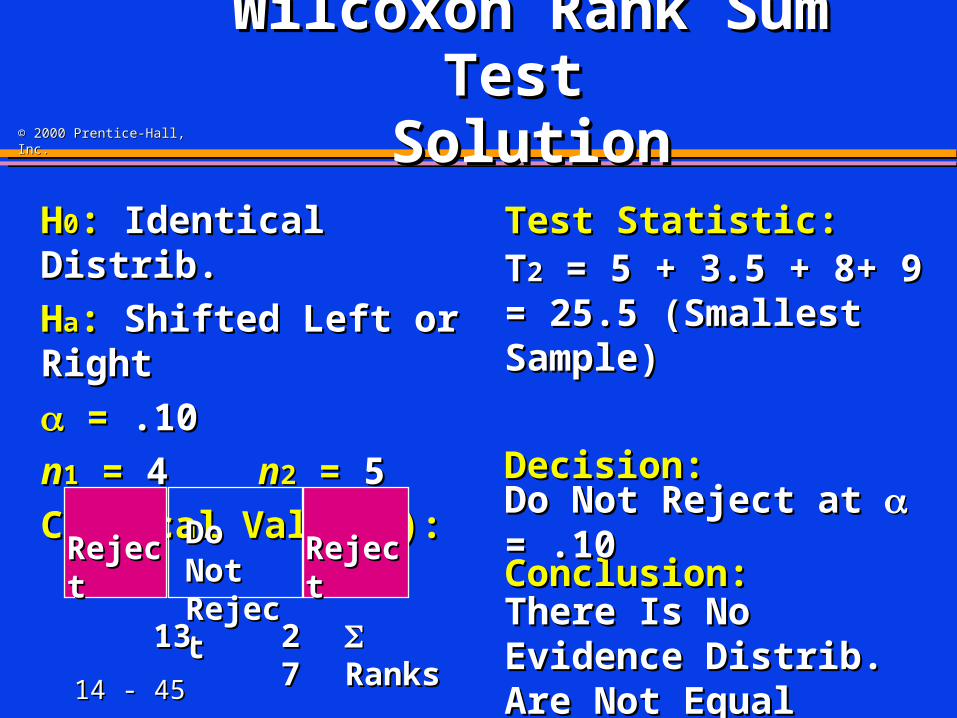
© 2000 Prentice-Hall, Inc.© 2000 Prentice-Hall, Inc.
Wilcoxon Rank Sum Wilcoxon Rank Sum Test Test
SolutionSolutionHH00: : Identical Distrib.Identical Distrib.
HHaa: : Shifted Left or RightShifted Left or Right
= = .10.10
nn11 = = 4 4 nn22 = = 5 5
Critical Value(s):Critical Value(s):
Test Statistic: Test Statistic:
Decision:Decision:
Conclusion:Conclusion:
Do Not Reject at Do Not Reject at = .10 = .10
There Is No Evidence There Is No Evidence Distrib. Are Not EqualDistrib. Are Not Equal
RejectReject RejectRejectDo Not Do Not RejectReject
1313 2727 RanksRanks
TT22 = 5 + 3.5 + 8+ 9 = 25.5 = 5 + 3.5 + 8+ 9 = 25.5 (Smallest Sample)(Smallest Sample)

14 - 14 - 4646
© 2000 Prentice-Hall, Inc.© 2000 Prentice-Hall, Inc.
Wilcoxon Signed Rank Wilcoxon Signed Rank Test Test

14 - 14 - 4747
© 2000 Prentice-Hall, Inc.© 2000 Prentice-Hall, Inc.
Frequently Used Frequently Used Nonparametric TestsNonparametric Tests
1.1. Sign Test Sign Test
2.2. Wilcoxon Rank Sum TestWilcoxon Rank Sum Test
3.3. Wilcoxon Signed Rank TestWilcoxon Signed Rank Test
4.4. Kruskal Wallis Kruskal Wallis HH-Test-Test
5.5. Friedman Friedman FFrr-Test-Test
14 - 14 - 4848
© 2000 Prentice-Hall, Inc.© 2000 Prentice-Hall, Inc.
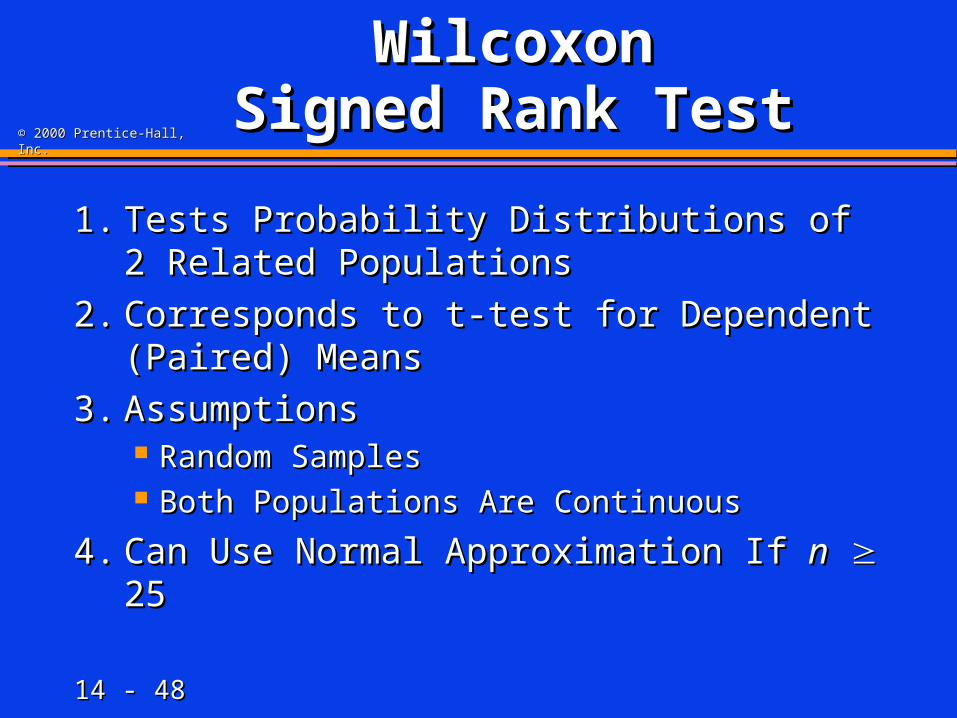
Wilcoxon Wilcoxon Signed Rank Test Signed Rank Test
1.1. Tests Probability Distributions of Tests Probability Distributions of 2 Related Populations2 Related Populations
2.2. Corresponds to t-test for Dependent Corresponds to t-test for Dependent (Paired) Means(Paired) Means
3.3. AssumptionsAssumptions Random SamplesRandom Samples Both Populations Are ContinuousBoth Populations Are Continuous
4.4. Can Use Normal Approximation If Can Use Normal Approximation If nn 25 25
14 - 14 - 4949
© 2000 Prentice-Hall, Inc.© 2000 Prentice-Hall, Inc.
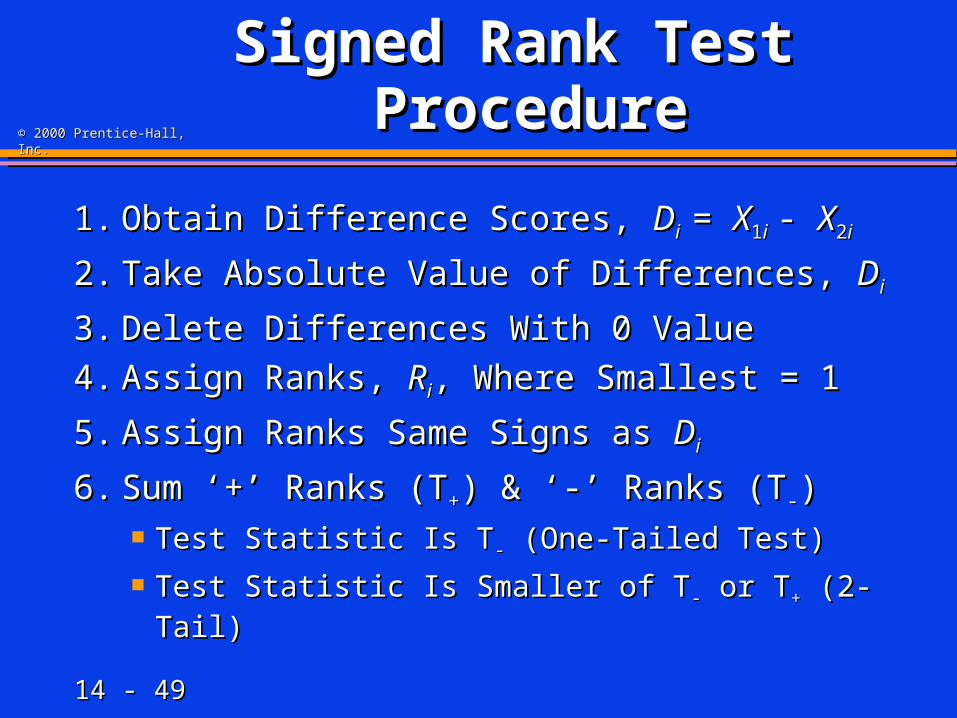
Signed Rank Test Signed Rank Test ProcedureProcedure
1.1. Obtain Difference Scores, Obtain Difference Scores, DDii = = XX11ii - - XX22ii
2.2. Take Absolute Value of Differences, Take Absolute Value of Differences, DDii
3.3. Delete Differences With 0 ValueDelete Differences With 0 Value
4.4. Assign Ranks, Assign Ranks, RRii, Where Smallest = 1, Where Smallest = 1
5.5. Assign Ranks Same Signs as Assign Ranks Same Signs as DDii
6.6. Sum ‘+’ Ranks (TSum ‘+’ Ranks (T++) & ‘-’ Ranks (T) & ‘-’ Ranks (T--)) Test Statistic Is TTest Statistic Is T-- (One-Tailed Test) (One-Tailed Test)
Test Statistic Is Smaller of TTest Statistic Is Smaller of T-- or T or T++ (2-Tail) (2-Tail)
14 - 14 - 5050
© 2000 Prentice-Hall, Inc.© 2000 Prentice-Hall, Inc.
Signed Rank Test Signed Rank Test Computation TableComputation Table
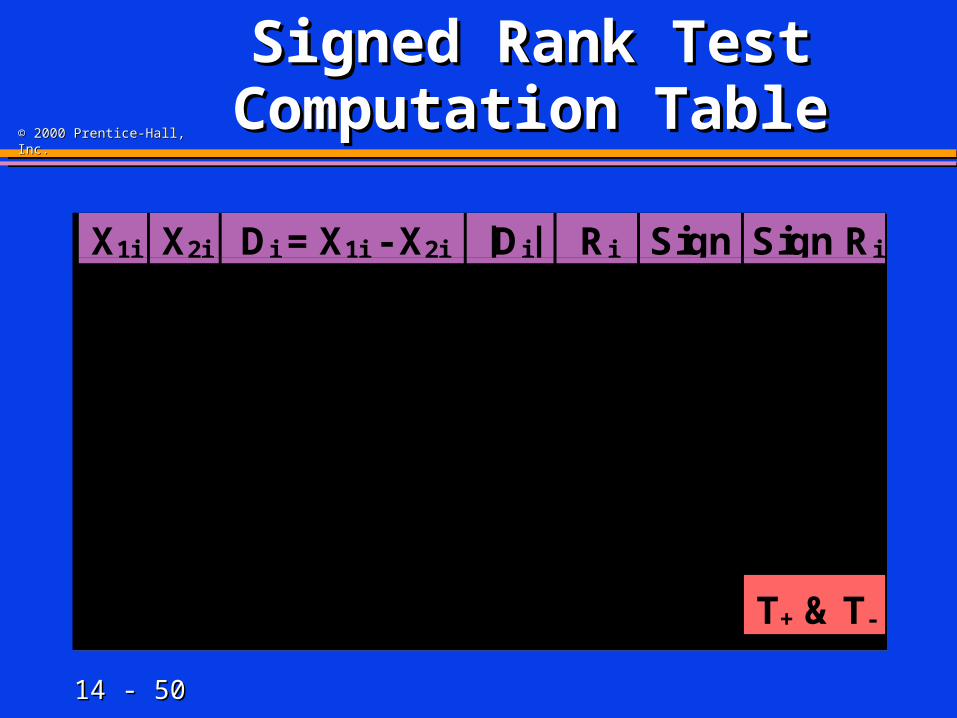
X1i X2i Di = X1i - X2i |Di| Ri Sign Sign Ri
X11 X21 D1 = X11 - X21 |D1| R1 ± ± R1
X12 X22 D2 = X12 - X22 |D2| R2 ± ± R2
X13 X23 D3 = X13 - X23 |D3| R3 ± ± R3
: : : : : : :
X1n X2n Dn = X1n - X2n |Dn| Rn ± ± Rn
Total T+ & T-
X1i X2i Di = X1i - X2i |Di| Ri Sign Sign Ri
X11 X21 D1 = X11 - X21 |D1| R1 ± ± R1
X12 X22 D2 = X12 - X22 |D2| R2 ± ± R2
X13 X23 D3 = X13 - X23 |D3| R3 ± ± R3
: : : : : : :
X1n X2n Dn = X1n - X2n |Dn| Rn ± ± Rn
Total T+ & T-
14 - 14 - 5151
© 2000 Prentice-Hall, Inc.© 2000 Prentice-Hall, Inc.
Signed Rank TestSigned Rank TestExampleExample
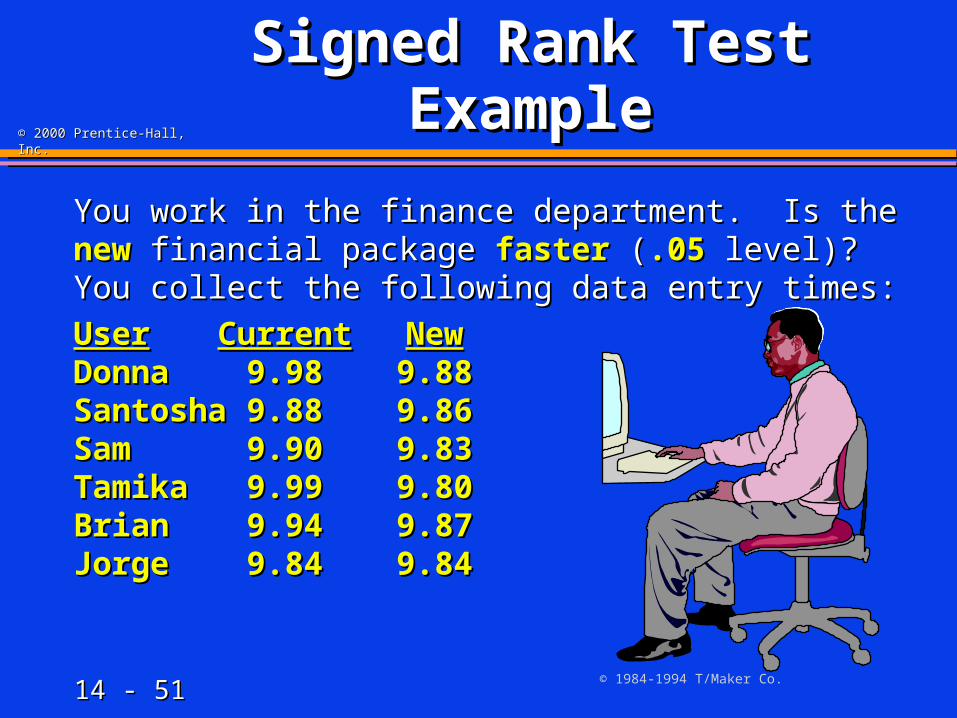
You work in the finance department. Is the You work in the finance department. Is the newnew financial package financial package fasterfaster ( (.05.05 level)? You collect the level)? You collect the following data entry times:following data entry times:
UserUser CurrentCurrent NewNewDonnaDonna 9.989.98 9.889.88SantoshaSantosha 9.889.88 9.869.86SamSam 9.909.90 9.839.83TamikaTamika 9.999.99 9.809.80BrianBrian 9.949.94 9.879.87JorgeJorge 9.849.84 9.849.84
© 1984-1994 T/Maker Co.
14 - 14 - 5252
© 2000 Prentice-Hall, Inc.© 2000 Prentice-Hall, Inc.
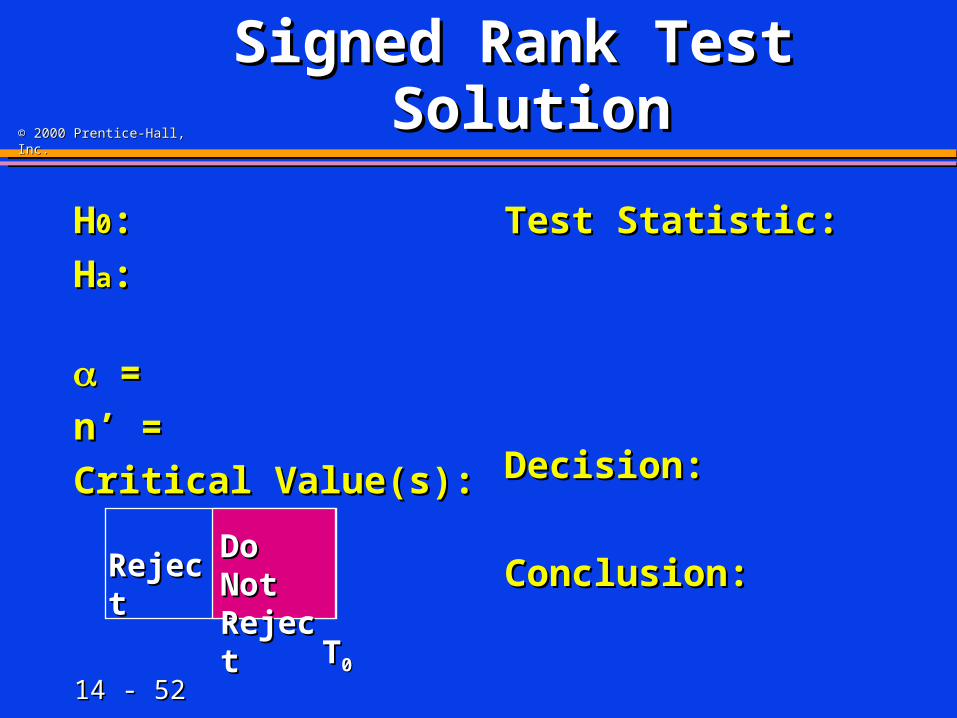
Signed Rank Test Signed Rank Test SolutionSolution
HH00::
HHaa::
= =
n’ =n’ =
Critical Value(s):Critical Value(s):
Test Statistic: Test Statistic:
Decision:Decision:
Conclusion:Conclusion:
TT00
RejectReject Do Not Do Not RejectReject

14 - 14 - 5353
© 2000 Prentice-Hall, Inc.© 2000 Prentice-Hall, Inc.
Signed Rank Test Signed Rank Test SolutionSolution
HH00: : Identical Distrib.Identical Distrib.
HHaa: : Current Shifted Current Shifted Right Right
= =
n’ =n’ =
Critical Value(s):Critical Value(s):
Test Statistic: Test Statistic:
Decision:Decision:
Conclusion:Conclusion:
TT00
RejectReject Do Not Do Not RejectReject

14 - 14 - 5454
© 2000 Prentice-Hall, Inc.© 2000 Prentice-Hall, Inc.
Signed Rank Test Signed Rank Test Computation TableComputation Table
X1i X2i Di |Di| Ri Sign Sign Ri
9.98 9.88 +0.10 0.10 4 + +4
9.88 9.86 +0.02 0.02 1 + +1
9.90 9.83 +0.07 0.07 2 2.5 + +2.5
9.99 9.80 +0.19 0.19 5 + +5
9.94 9.87 +0.07 0.07 3 2.5 + +2.5
9.84 9.84 0.00 0.00 ... ... Discard
Total T+ = 15, T- = 0
X1i X2i Di |Di| Ri Sign Sign Ri
9.98 9.88 +0.10 0.10 4 + +4
9.88 9.86 +0.02 0.02 1 + +1
9.90 9.83 +0.07 0.07 2 2.5 + +2.5
9.99 9.80 +0.19 0.19 5 + +5
9.94 9.87 +0.07 0.07 3 2.5 + +2.5
9.84 9.84 0.00 0.00 ... ... Discard
Total T+ = 15, T- = 0

14 - 14 - 5555
© 2000 Prentice-Hall, Inc.© 2000 Prentice-Hall, Inc.
Signed Rank Test Signed Rank Test SolutionSolution
HH00: : Identical Distrib.Identical Distrib.
HHaa: : Current Shifted Current Shifted Right Right
= = .05.05
n’ = n’ = 5 (not 6; 1 elim.)5 (not 6; 1 elim.)
Critical Value(s):Critical Value(s):
Test Statistic: Test Statistic:
Decision:Decision:
Conclusion:Conclusion:RejectReject Do Not Do Not RejectReject
TT00

14 - 14 - 5656
© 2000 Prentice-Hall, Inc.© 2000 Prentice-Hall, Inc.
Wilcoxon Signed Wilcoxon Signed Rank Rank
Table (Portion)Table (Portion)
One-Tailed Two-Tailed n = 5 n = 6 n = 7 .. = .05 = .10 1 2 4 .. = .025 = .05 1 2 .. = .01 = .02 0 .. = .005 = .01 ..
n = 11 n = 12 n = 13
: : : :
One-Tailed Two-Tailed n = 5 n = 6 n = 7 .. = .05 = .10 1 2 4 .. = .025 = .05 1 2 .. = .01 = .02 0 .. = .005 = .01 ..
n = 11 n = 12 n = 13
: : : :
14 - 14 - 5757
© 2000 Prentice-Hall, Inc.© 2000 Prentice-Hall, Inc.
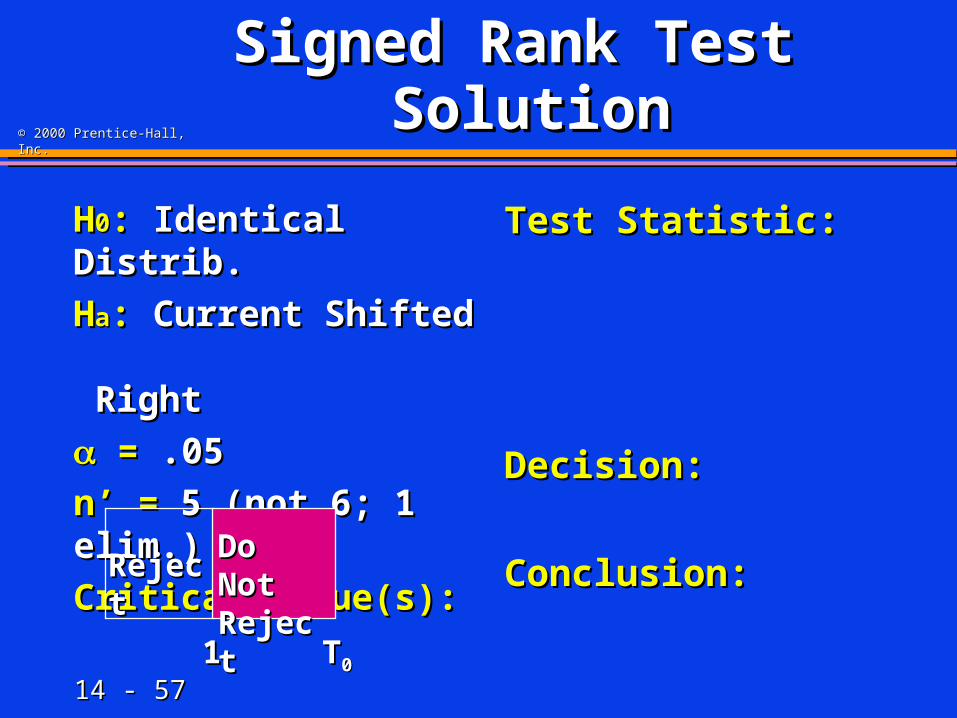
Signed Rank Test Signed Rank Test SolutionSolution
HH00: : Identical Distrib.Identical Distrib.
HHaa: : Current Shifted Current Shifted Right Right
= = .05.05
n’ = n’ = 5 (not 6; 1 elim.)5 (not 6; 1 elim.)
Critical Value(s):Critical Value(s):
Test Statistic: Test Statistic:
Decision:Decision:
Conclusion:Conclusion:RejectReject Do Not Do Not RejectReject
11 TT00
14 - 14 - 5858
© 2000 Prentice-Hall, Inc.© 2000 Prentice-Hall, Inc.
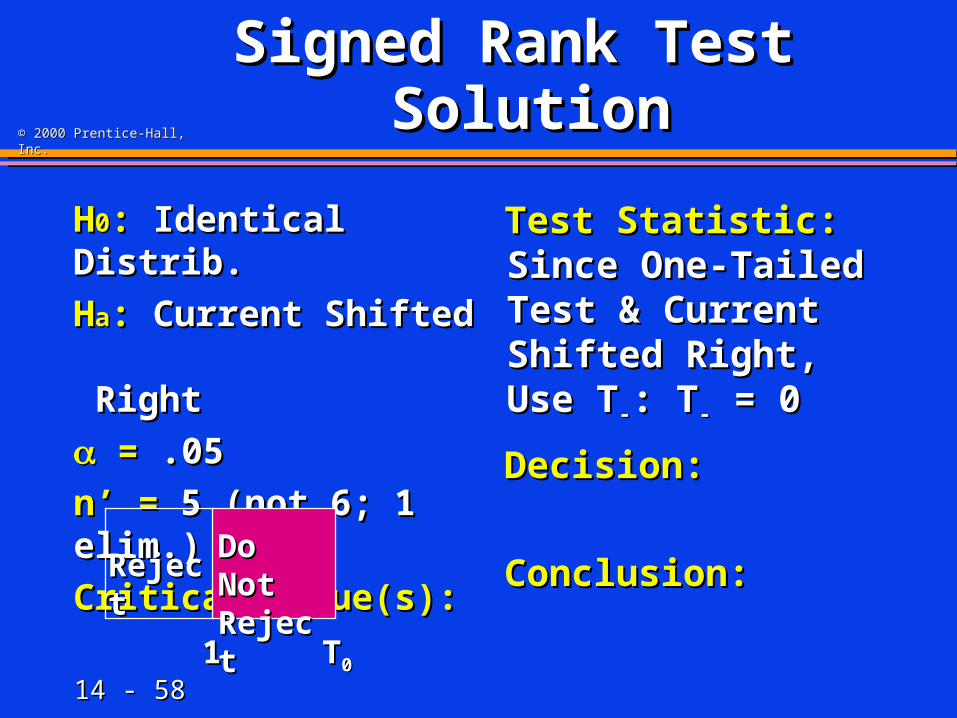
Signed Rank Test Signed Rank Test SolutionSolution
HH00: : Identical Distrib.Identical Distrib.
HHaa: : Current Shifted Current Shifted Right Right
= = .05.05
n’ = n’ = 5 (not 6; 1 elim.)5 (not 6; 1 elim.)
Critical Value(s):Critical Value(s):
Test Statistic: Test Statistic:
Decision:Decision:
Conclusion:Conclusion:RejectReject Do Not Do Not RejectReject
11 TT00
Since One-Tailed Since One-Tailed Test & Current Test & Current Shifted Right, Use TShifted Right, Use T--: :
TT-- = 0 = 0
14 - 14 - 5959
© 2000 Prentice-Hall, Inc.© 2000 Prentice-Hall, Inc.
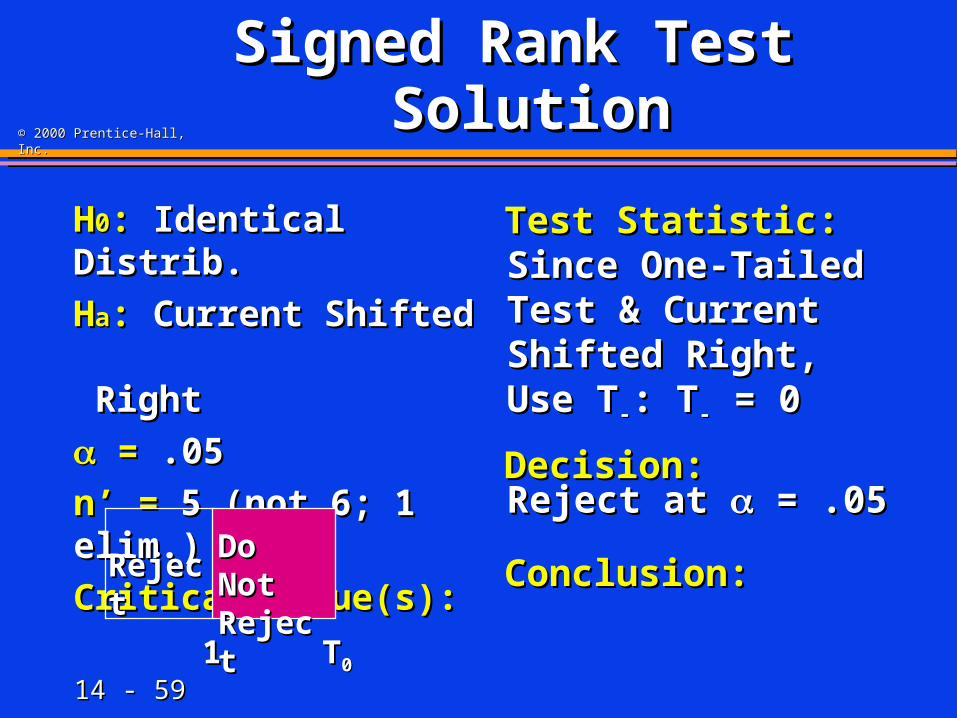
Signed Rank Test Signed Rank Test SolutionSolution
HH00: : Identical Distrib.Identical Distrib.
HHaa: : Current Shifted Current Shifted Right Right
= = .05.05
n’ = n’ = 5 (not 6; 1 elim.)5 (not 6; 1 elim.)
Critical Value(s):Critical Value(s):
Test Statistic: Test Statistic:
Decision:Decision:
Conclusion:Conclusion:
Reject at Reject at = .05 = .05
RejectReject Do Not Do Not RejectReject
11 TT00
Since One-Tailed Since One-Tailed Test & Current Test & Current Shifted Right, Use TShifted Right, Use T--: :
TT-- = 0 = 0
14 - 14 - 6060
© 2000 Prentice-Hall, Inc.© 2000 Prentice-Hall, Inc.
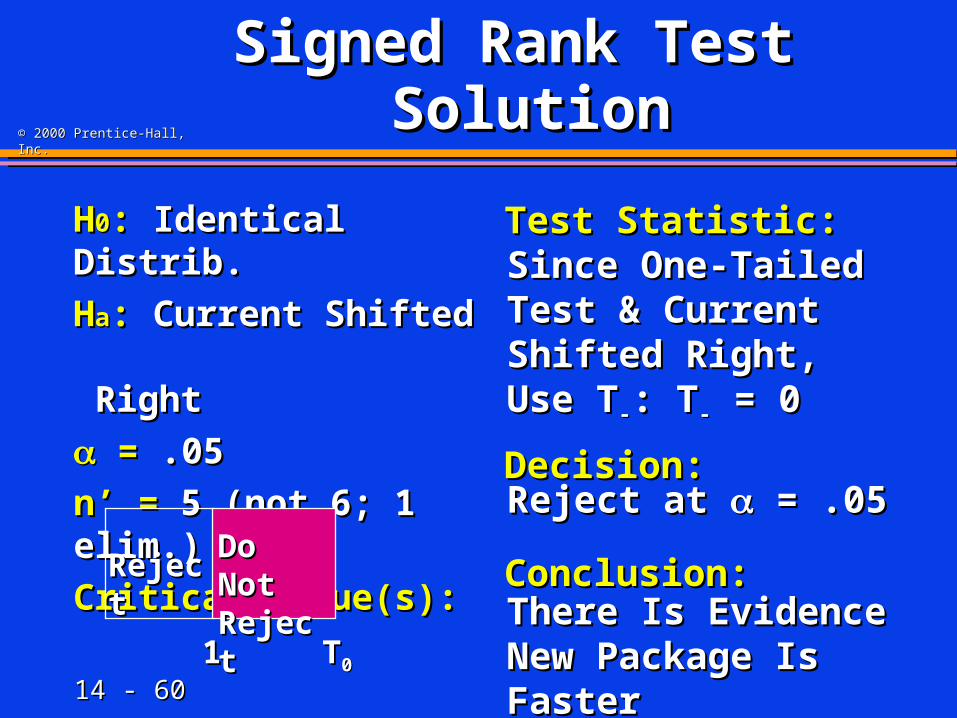
Signed Rank Test Signed Rank Test SolutionSolution
HH00: : Identical Distrib.Identical Distrib.
HHaa: : Current Shifted Current Shifted Right Right
= = .05.05
n’ = n’ = 5 (not 6; 1 elim.)5 (not 6; 1 elim.)
Critical Value(s):Critical Value(s):
Test Statistic: Test Statistic:
Decision:Decision:
Conclusion:Conclusion:
Reject at Reject at = .05 = .05
There Is Evidence New There Is Evidence New Package Is FasterPackage Is Faster
RejectReject Do Not Do Not RejectReject
11 TT00
Since One-Tailed Since One-Tailed Test & Current Test & Current Shifted Right, Use TShifted Right, Use T--: :
TT-- = 0 = 0

14 - 14 - 6161
© 2000 Prentice-Hall, Inc.© 2000 Prentice-Hall, Inc.
Kruskal-Wallis H-TestKruskal-Wallis H-Test
14 - 14 - 6262
© 2000 Prentice-Hall, Inc.© 2000 Prentice-Hall, Inc.
Frequently Used Frequently Used Nonparametric TestsNonparametric Tests
1.1. Sign Test Sign Test
2.2. Wilcoxon Rank Sum TestWilcoxon Rank Sum Test
3.3. Wilcoxon Signed Rank TestWilcoxon Signed Rank Test
4.4. Kruskal Wallis Kruskal Wallis HH-Test-Test
5.5. Friedman Friedman FFrr-Test-Test
14 - 14 - 6363
© 2000 Prentice-Hall, Inc.© 2000 Prentice-Hall, Inc.
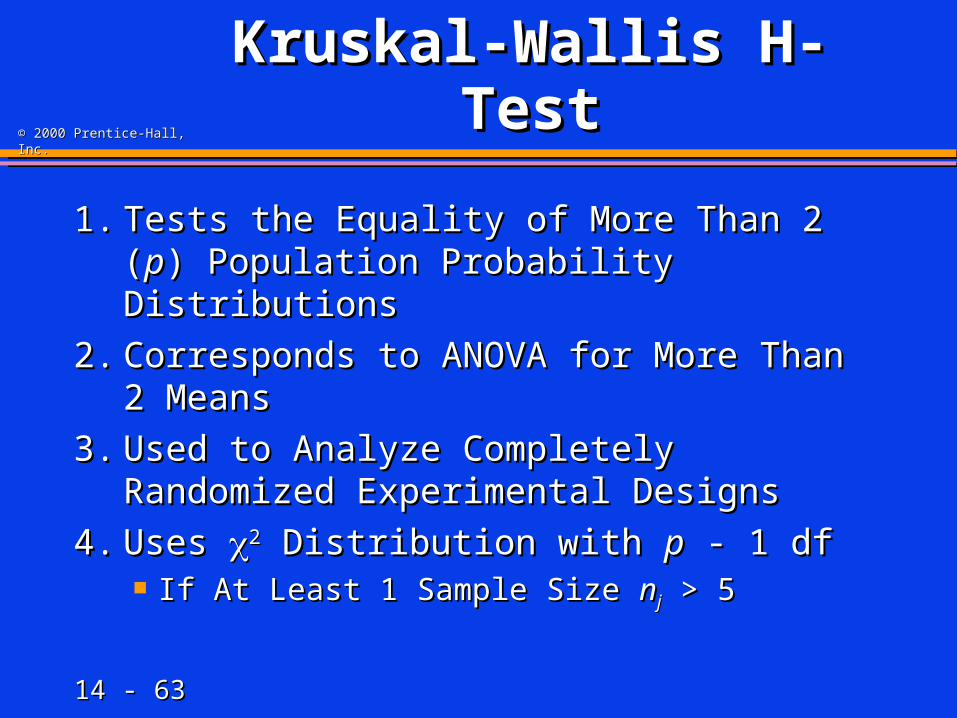
Kruskal-Wallis H-Kruskal-Wallis H-TestTest
1.1. Tests the Equality of More Than 2 (Tests the Equality of More Than 2 (pp) ) Population Probability DistributionsPopulation Probability Distributions
2.2. Corresponds to ANOVA for More Than 2 Corresponds to ANOVA for More Than 2 MeansMeans
3.3. Used to Analyze Completely Used to Analyze Completely Randomized Experimental Designs Randomized Experimental Designs
4.4. Uses Uses 22 Distribution with Distribution with pp - 1 df - 1 df If At Least 1 Sample Size If At Least 1 Sample Size nnjj > 5 > 5
14 - 14 - 6464
© 2000 Prentice-Hall, Inc.© 2000 Prentice-Hall, Inc.
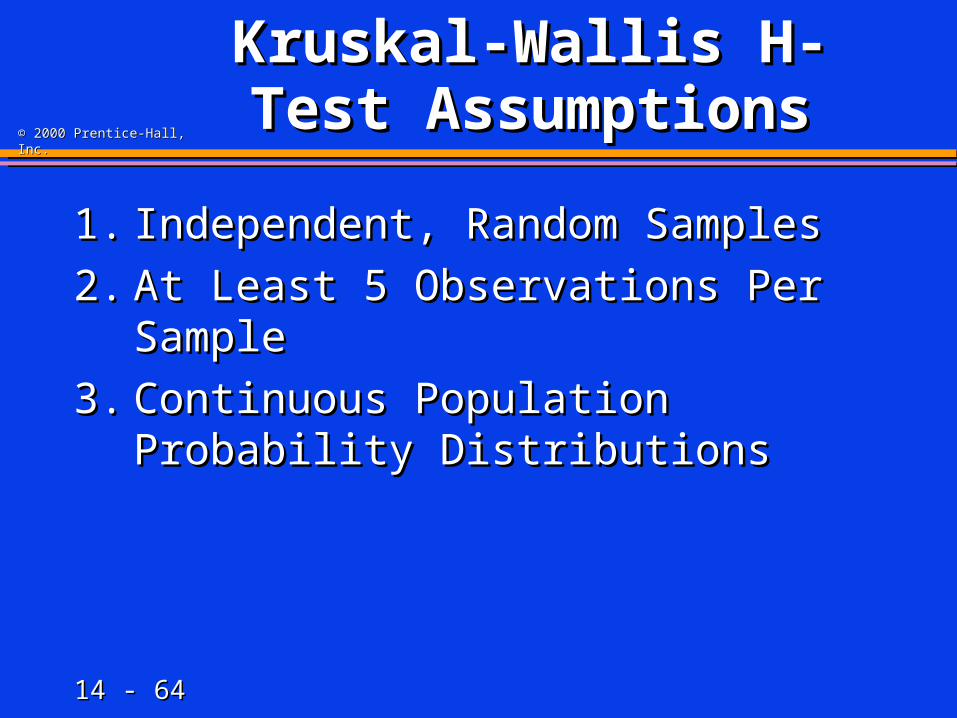
Kruskal-Wallis H-Kruskal-Wallis H-Test AssumptionsTest Assumptions
1.1. Independent, Random Samples Independent, Random Samples
2.2. At Least 5 Observations Per SampleAt Least 5 Observations Per Sample
3.3. Continuous Population Probability Continuous Population Probability DistributionsDistributions
14 - 14 - 6565
© 2000 Prentice-Hall, Inc.© 2000 Prentice-Hall, Inc.
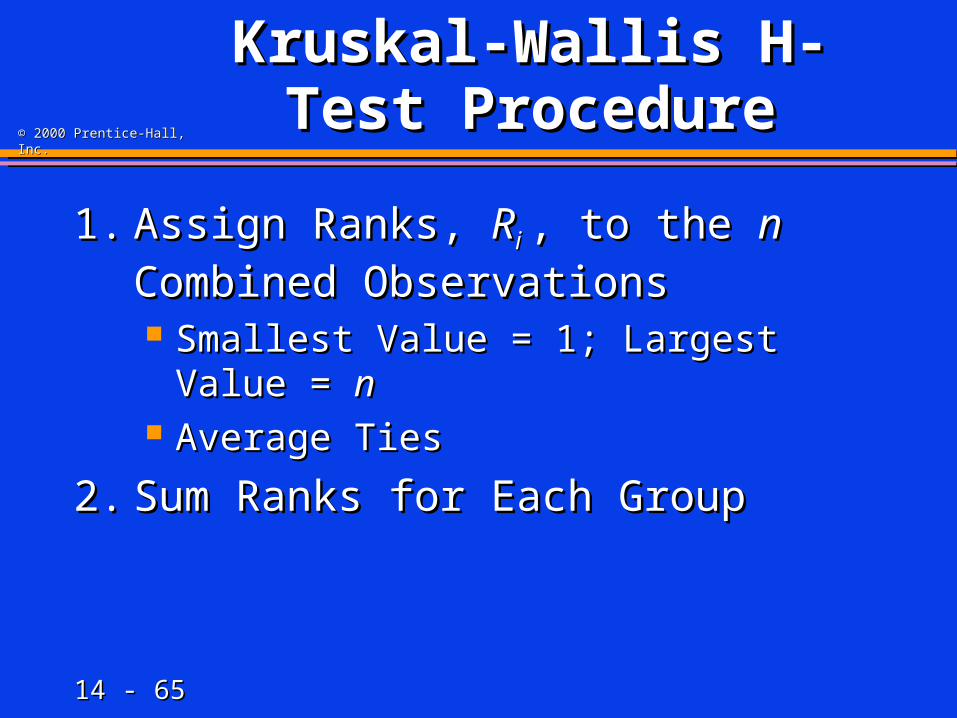
Kruskal-Wallis H-Kruskal-Wallis H-Test ProcedureTest Procedure
1.1. Assign Ranks, Assign Ranks, RRi i , to the , to the nn Combined Combined
ObservationsObservations Smallest Value = 1; Largest Value = Smallest Value = 1; Largest Value = nn Average TiesAverage Ties
2.2. Sum Ranks for Each GroupSum Ranks for Each Group

14 - 14 - 6666
© 2000 Prentice-Hall, Inc.© 2000 Prentice-Hall, Inc.
Kruskal-Wallis H-Kruskal-Wallis H-Test ProcedureTest Procedure
1.1. Assign Ranks, Assign Ranks, RRi i , to the , to the nn Combined Combined
ObservationsObservations Smallest Value = 1; Largest Value = Smallest Value = 1; Largest Value = nn Average TiesAverage Ties
2.2. Sum Ranks for Each GroupSum Ranks for Each Group
3.3. Compute Test StatisticCompute Test Statistic
Hn n
R
nnj
jj
p
FHG
IKJ
12
13 1
2
1a f a fHn n
R
nnj
jj
p
FHG
IKJ
12
13 1
2
1a f a fSquared total of Squared total of each groupeach group
14 - 14 - 6767
© 2000 Prentice-Hall, Inc.© 2000 Prentice-Hall, Inc.
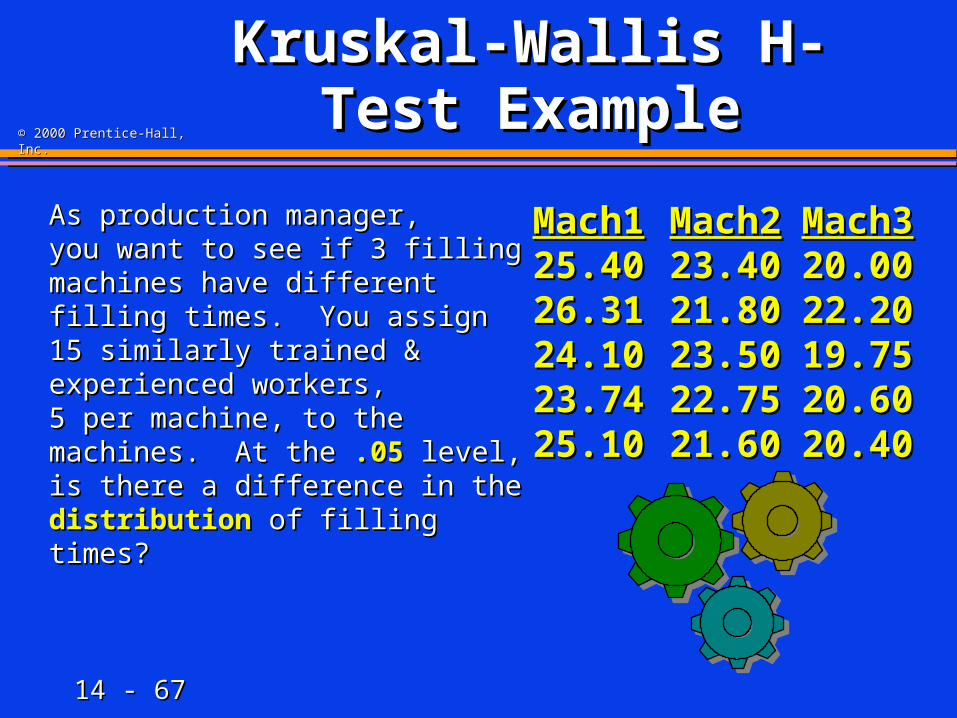
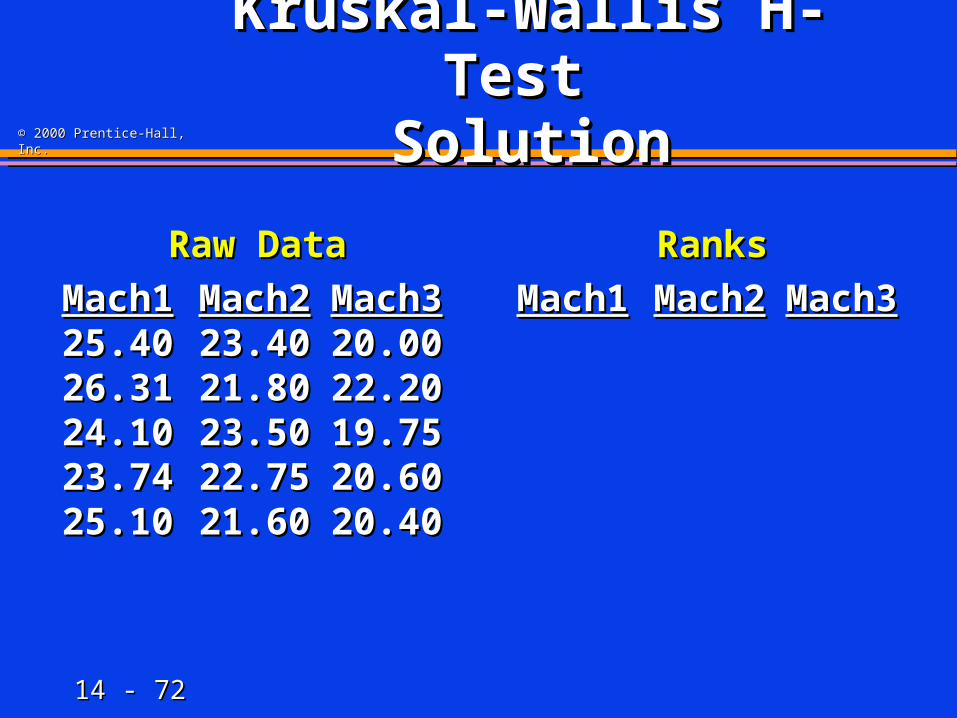
Kruskal-Wallis H-Kruskal-Wallis H-Test ExampleTest Example
As production manager, As production manager, you want to see if 3 filling you want to see if 3 filling machines have different machines have different filling times. You assign filling times. You assign 15 similarly trained & 15 similarly trained & experienced workers, experienced workers, 5 per machine, to the 5 per machine, to the machines. At the machines. At the .05.05 level, is level, is there a difference in the there a difference in the distributiondistribution of filling times?of filling times?
Mach1Mach1 Mach2Mach2 Mach3Mach325.4025.40 23.4023.40 20.0020.0026.3126.31 21.8021.80 22.2022.2024.1024.10 23.5023.50 19.7519.7523.7423.74 22.7522.75 20.6020.6025.1025.10 21.6021.60 20.4020.40
14 - 14 - 6868
© 2000 Prentice-Hall, Inc.© 2000 Prentice-Hall, Inc.
2200
Kruskal-Wallis H-Kruskal-Wallis H-Test Test
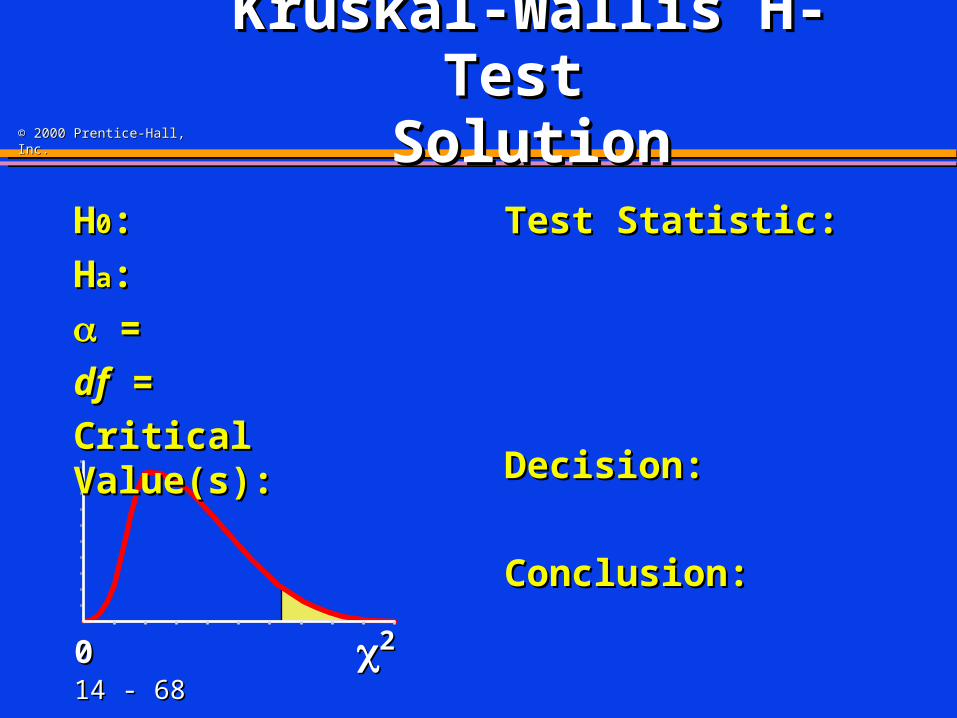
SolutionSolutionHH00::
HHaa::
==
dfdf = =
Critical Value(s):Critical Value(s):
Test Statistic: Test Statistic:
Decision:Decision:
Conclusion:Conclusion:
14 - 14 - 6969
© 2000 Prentice-Hall, Inc.© 2000 Prentice-Hall, Inc.
2200
Kruskal-Wallis H-Kruskal-Wallis H-Test Test
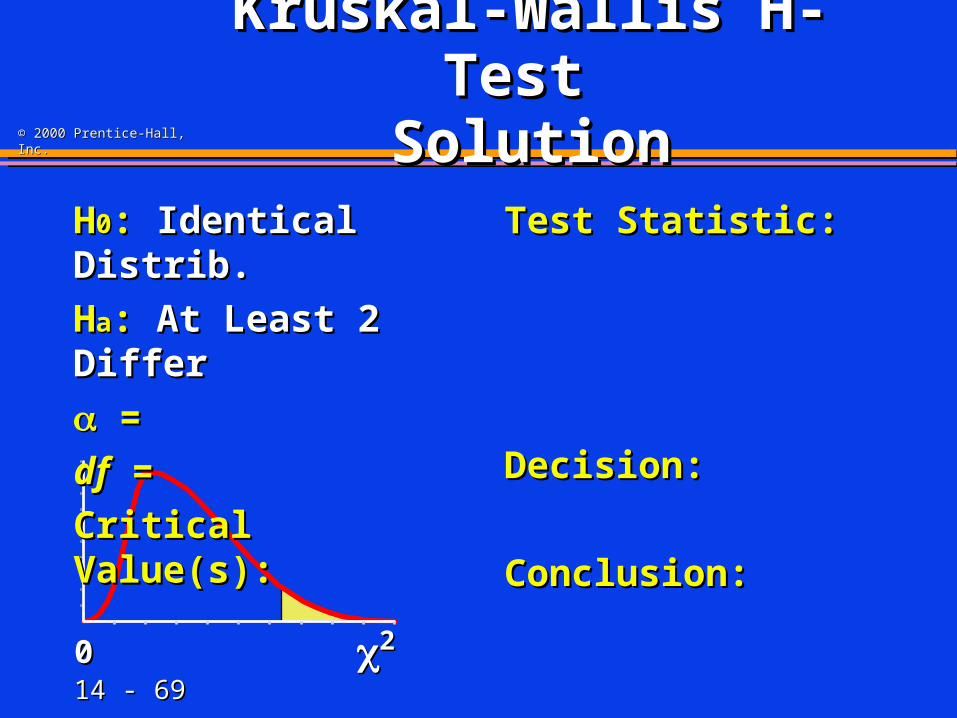
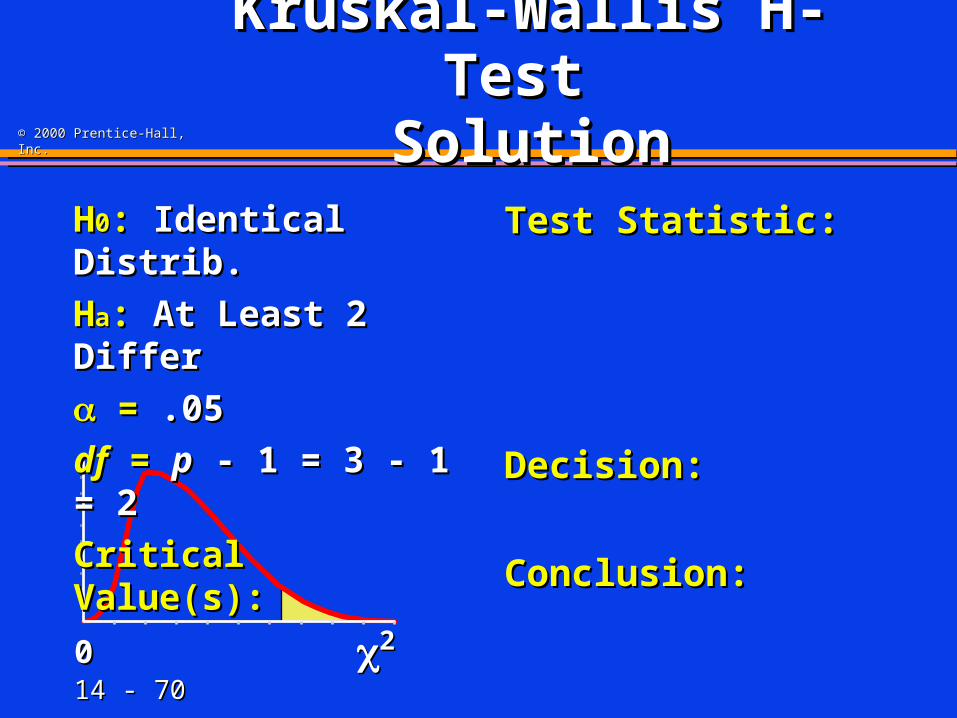
SolutionSolutionHH00: : Identical Distrib.Identical Distrib.
HHaa: : At Least 2 DifferAt Least 2 Differ
==
dfdf = =
Critical Value(s):Critical Value(s):
Test Statistic: Test Statistic:
Decision:Decision:
Conclusion:Conclusion:
14 - 14 - 7070
© 2000 Prentice-Hall, Inc.© 2000 Prentice-Hall, Inc.
2200
Kruskal-Wallis H-Kruskal-Wallis H-Test Test
SolutionSolutionHH00: : Identical Distrib.Identical Distrib.
HHaa: : At Least 2 DifferAt Least 2 Differ
= = .05.05
dfdf = = pp - 1 = 3 - 1 = 2 - 1 = 3 - 1 = 2
Critical Value(s):Critical Value(s):
Test Statistic: Test Statistic:
Decision:Decision:
Conclusion:Conclusion:
14 - 14 - 7171
© 2000 Prentice-Hall, Inc.© 2000 Prentice-Hall, Inc.
2200 5.9915.991
Kruskal-Wallis H-Kruskal-Wallis H-Test Test
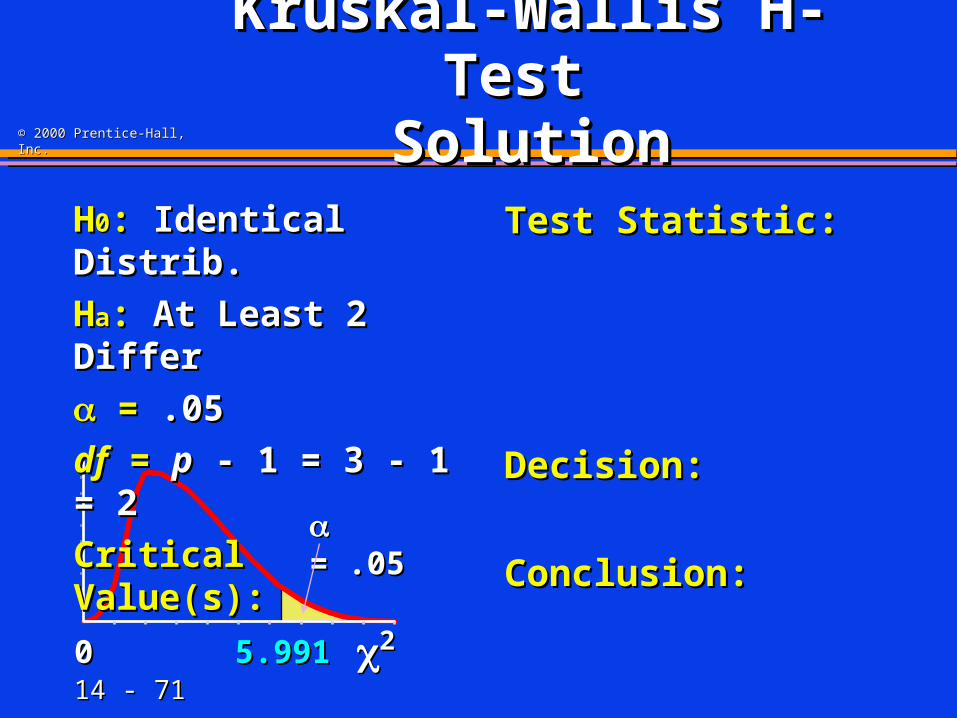
SolutionSolutionHH00: : Identical Distrib.Identical Distrib.
HHaa: : At Least 2 DifferAt Least 2 Differ
= = .05.05
dfdf = = pp - 1 = 3 - 1 = 2 - 1 = 3 - 1 = 2
Critical Value(s):Critical Value(s):
Test Statistic: Test Statistic:
Decision:Decision:
Conclusion:Conclusion: = .05= .05
14 - 14 - 7272
© 2000 Prentice-Hall, Inc.© 2000 Prentice-Hall, Inc.
Kruskal-Wallis H-Kruskal-Wallis H-Test Test
SolutionSolution
Raw DataRaw Data
Mach1Mach1 Mach2Mach2 Mach3Mach325.4025.40 23.4023.40 20.0020.0026.3126.31 21.8021.80 22.2022.2024.1024.10 23.5023.50 19.7519.7523.7423.74 22.7522.75 20.6020.6025.1025.10 21.6021.60 20.4020.40
RanksRanks
Mach1Mach1 Mach2Mach2 Mach3Mach3
14 - 14 - 7373
© 2000 Prentice-Hall, Inc.© 2000 Prentice-Hall, Inc.
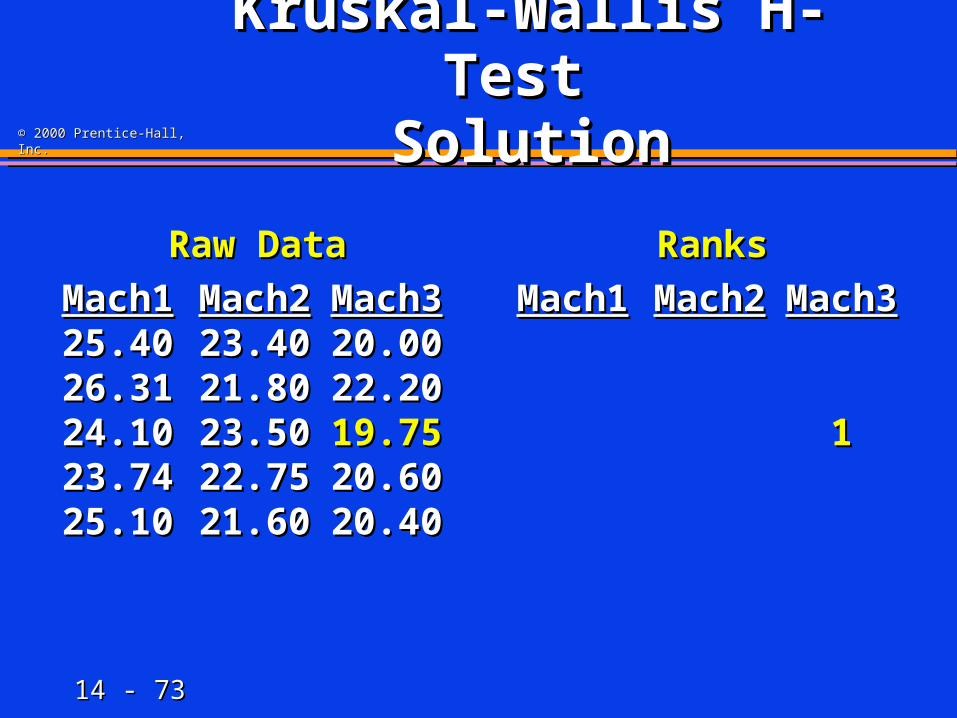
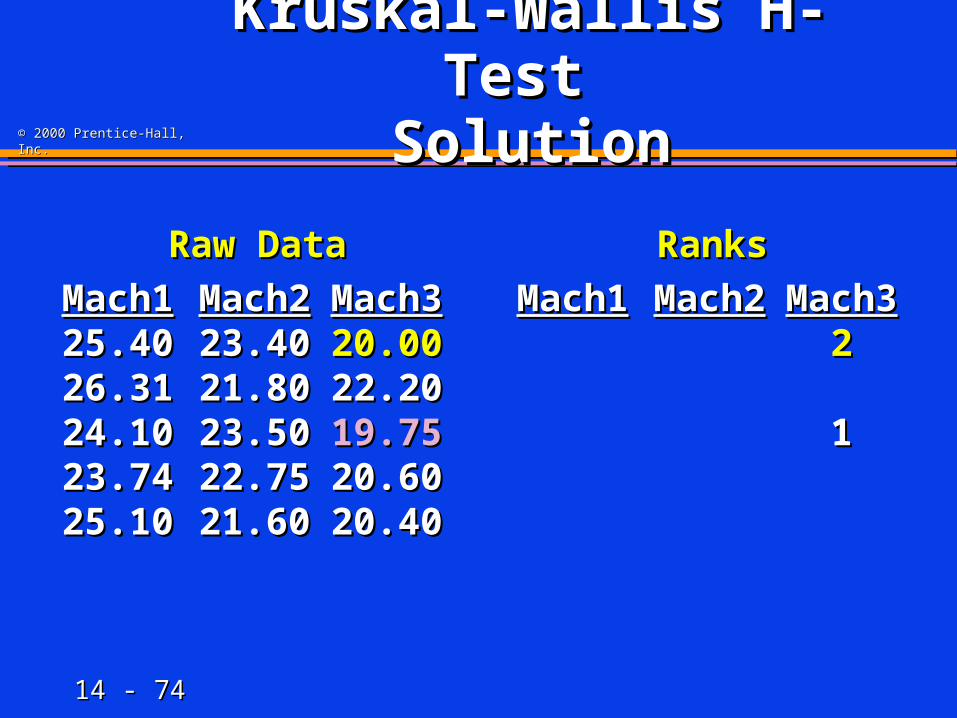
Kruskal-Wallis H-Kruskal-Wallis H-Test Test
SolutionSolution
Raw DataRaw Data
Mach1Mach1 Mach2Mach2 Mach3Mach325.4025.40 23.4023.40 20.0020.0026.3126.31 21.8021.80 22.2022.2024.1024.10 23.5023.50 19.7519.7523.7423.74 22.7522.75 20.6020.6025.1025.10 21.6021.60 20.4020.40
RanksRanks
Mach1Mach1 Mach2Mach2 Mach3Mach3
11
14 - 14 - 7474
© 2000 Prentice-Hall, Inc.© 2000 Prentice-Hall, Inc.
Kruskal-Wallis H-Kruskal-Wallis H-Test Test
SolutionSolution
Raw DataRaw Data
Mach1Mach1 Mach2Mach2 Mach3Mach325.4025.40 23.4023.40 20.0020.0026.3126.31 21.8021.80 22.2022.2024.1024.10 23.5023.50 19.7519.7523.7423.74 22.7522.75 20.6020.6025.1025.10 21.6021.60 20.4020.40
RanksRanks
Mach1Mach1 Mach2Mach2 Mach3Mach322
11
14 - 14 - 7575
© 2000 Prentice-Hall, Inc.© 2000 Prentice-Hall, Inc.
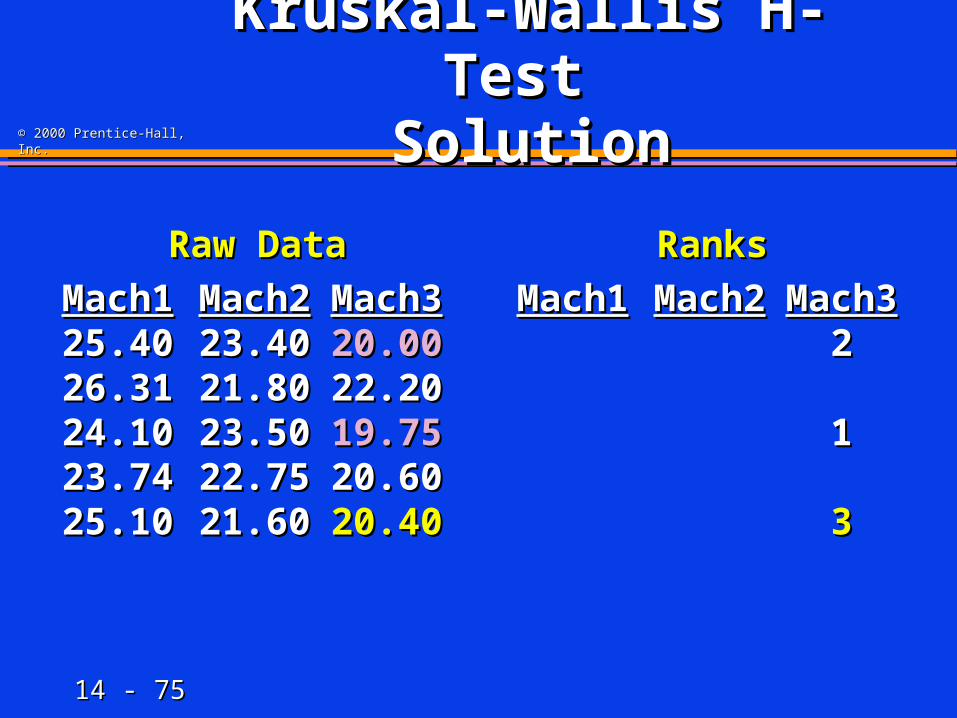
Kruskal-Wallis H-Kruskal-Wallis H-Test Test
SolutionSolution
Raw DataRaw Data
Mach1Mach1 Mach2Mach2 Mach3Mach325.4025.40 23.4023.40 20.0020.0026.3126.31 21.8021.80 22.2022.2024.1024.10 23.5023.50 19.7519.7523.7423.74 22.7522.75 20.6020.6025.1025.10 21.6021.60 20.4020.40
RanksRanks
Mach1Mach1 Mach2Mach2 Mach3Mach322
11
33
14 - 14 - 7676
© 2000 Prentice-Hall, Inc.© 2000 Prentice-Hall, Inc.
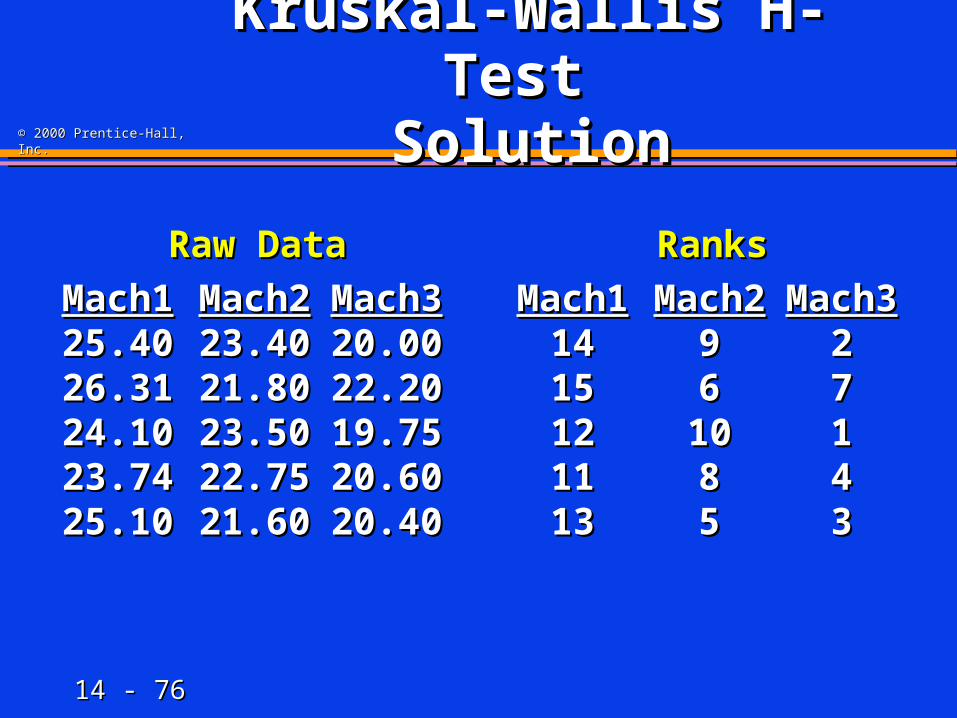
Kruskal-Wallis H-Kruskal-Wallis H-Test Test
SolutionSolution
Raw DataRaw Data
Mach1Mach1 Mach2Mach2 Mach3Mach325.4025.40 23.4023.40 20.0020.0026.3126.31 21.8021.80 22.2022.2024.1024.10 23.5023.50 19.7519.7523.7423.74 22.7522.75 20.6020.6025.1025.10 21.6021.60 20.4020.40
RanksRanks
Mach1Mach1 Mach2Mach2 Mach3Mach31414 99 221515 66 771212 1010 111111 88 441313 55 33

14 - 14 - 7777
© 2000 Prentice-Hall, Inc.© 2000 Prentice-Hall, Inc.
Kruskal-Wallis H-Kruskal-Wallis H-Test Test
SolutionSolution
Raw DataRaw Data
Mach1Mach1 Mach2Mach2 Mach3Mach325.4025.40 23.4023.40 20.0020.0026.3126.31 21.8021.80 22.2022.2024.1024.10 23.5023.50 19.7519.7523.7423.74 22.7522.75 20.6020.6025.1025.10 21.6021.60 20.4020.40
RanksRanks
Mach1Mach1 Mach2Mach2 Mach3Mach31414 99 221515 66 771212 1010 111111 88 441313 55 336565 3838 1717TotalTotal
14 - 14 - 7878
© 2000 Prentice-Hall, Inc.© 2000 Prentice-Hall, Inc.
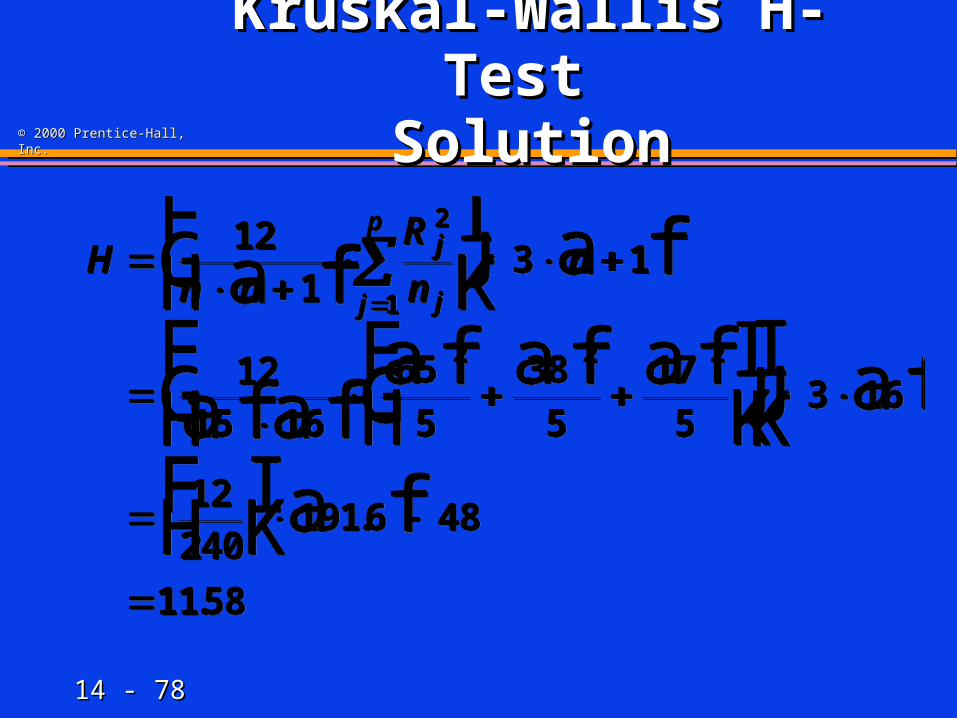
Kruskal-Wallis H-Kruskal-Wallis H-Test Test
SolutionSolution
Hn n
R
nnj
jj
p
FHG
IKJ
FHG
IKJ
FHG
IKJ
FH IK
12
13 1
1215 16
65
5
38
5
17
53 16
12240
1916 48
1158
2
1
2 2 2
a f a f
afafa f a f af af
a f.
.
Hn n
R
nnj
jj
p
FHG
IKJ
FHG
IKJ
FHG
IKJ
FH IK
12
13 1
1215 16
65
5
38
5
17
53 16
12240
1916 48
1158
2
1
2 2 2
a f a f
afafa f a f af af
a f.
.
14 - 14 - 7979
© 2000 Prentice-Hall, Inc.© 2000 Prentice-Hall, Inc.
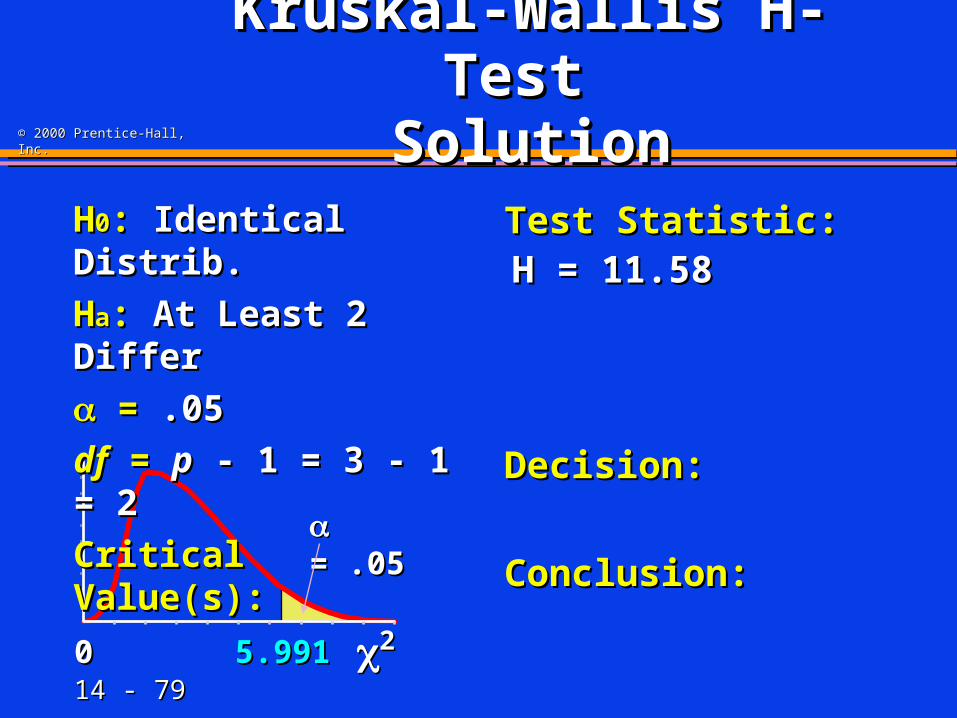
2200 5.9915.991
Kruskal-Wallis H-Kruskal-Wallis H-Test Test
SolutionSolutionHH00: : Identical Distrib.Identical Distrib.
HHaa: : At Least 2 DifferAt Least 2 Differ
= = .05.05
dfdf = = pp - 1 = 3 - 1 = 2 - 1 = 3 - 1 = 2
Critical Value(s):Critical Value(s):
Test Statistic: Test Statistic:
Decision:Decision:
Conclusion:Conclusion: = .05= .05
H = 11.58H = 11.58
14 - 14 - 8080
© 2000 Prentice-Hall, Inc.© 2000 Prentice-Hall, Inc.
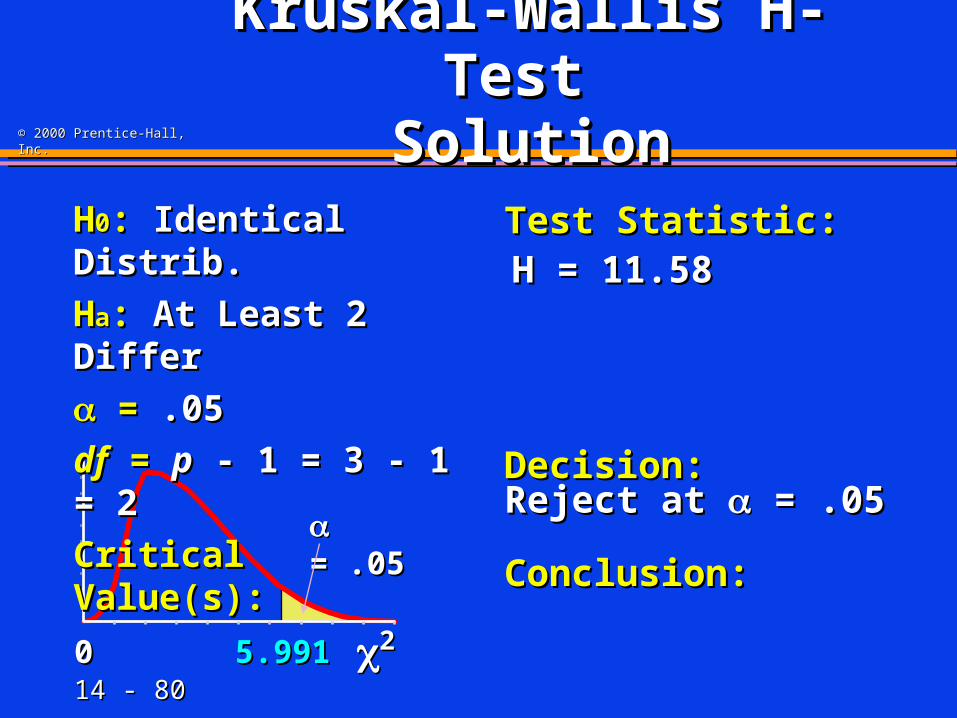
2200 5.9915.991
Kruskal-Wallis H-Kruskal-Wallis H-Test Test
SolutionSolutionHH00: : Identical Distrib.Identical Distrib.
HHaa: : At Least 2 DifferAt Least 2 Differ
= = .05.05
dfdf = = pp - 1 = 3 - 1 = 2 - 1 = 3 - 1 = 2
Critical Value(s):Critical Value(s):
Test Statistic: Test Statistic:
Decision:Decision:
Conclusion:Conclusion:
Reject at Reject at = .05 = .05 = .05= .05
H = 11.58H = 11.58
14 - 14 - 8181
© 2000 Prentice-Hall, Inc.© 2000 Prentice-Hall, Inc.
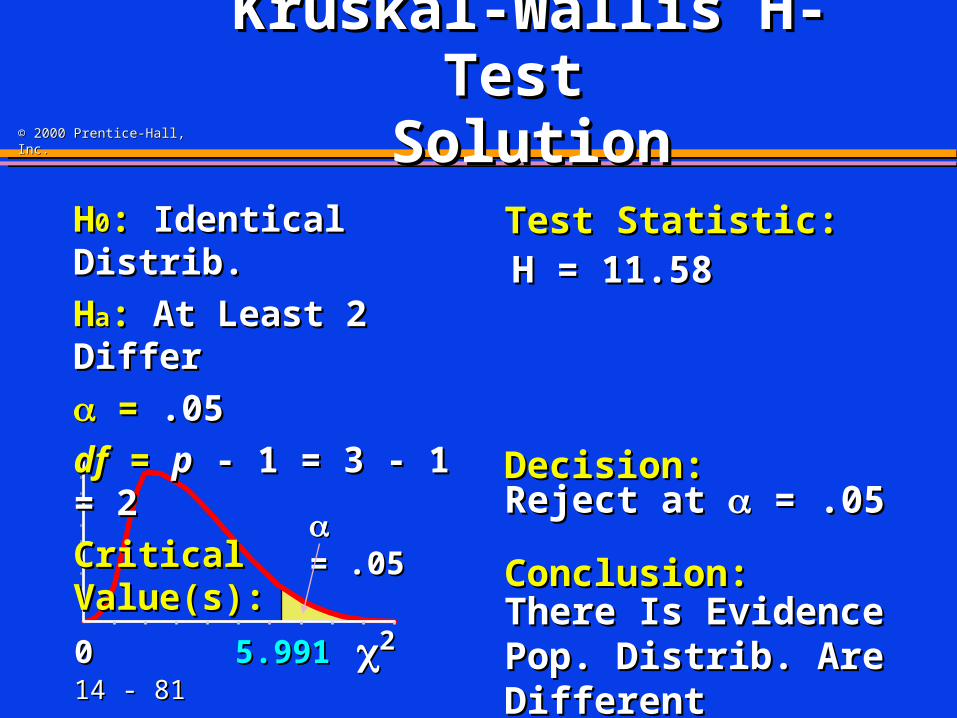
2200 5.9915.991
Kruskal-Wallis H-Kruskal-Wallis H-Test Test
SolutionSolutionHH00: : Identical Distrib.Identical Distrib.
HHaa: : At Least 2 DifferAt Least 2 Differ
= = .05.05
dfdf = = pp - 1 = 3 - 1 = 2 - 1 = 3 - 1 = 2
Critical Value(s):Critical Value(s):
Test Statistic: Test Statistic:
Decision:Decision:
Conclusion:Conclusion:
Reject at Reject at = .05 = .05
There Is Evidence Pop. There Is Evidence Pop. Distrib. Are DifferentDistrib. Are Different
= .05= .05
H = 11.58H = 11.58
14 - 14 - 8282
© 2000 Prentice-Hall, Inc.© 2000 Prentice-Hall, Inc.
Friedman FFriedman Frr-Test-Test

14 - 14 - 8383
© 2000 Prentice-Hall, Inc.© 2000 Prentice-Hall, Inc.
Frequently Used Frequently Used Nonparametric TestsNonparametric Tests
1.1. Sign Test Sign Test
2.2. Wilcoxon Rank Sum TestWilcoxon Rank Sum Test
3.3. Wilcoxon Signed Rank TestWilcoxon Signed Rank Test
4.4. Kruskal Wallis Kruskal Wallis HH-Test-Test
5.5. Friedman Friedman FFrr-Test-Test

14 - 14 - 8484
© 2000 Prentice-Hall, Inc.© 2000 Prentice-Hall, Inc.
Friedman FFriedman Frr-Test-Test
1.1. Tests the Equality of 2 or More (Tests the Equality of 2 or More (pp) ) Population Probability Distributions Population Probability Distributions When Blocking Variable UsedWhen Blocking Variable Used
2.2. Corresponds to Randomized Block F-TestCorresponds to Randomized Block F-Test
3.3. Used to Analyze Randomized Block Used to Analyze Randomized Block Designs Designs
4.4. Uses Uses 22 Distribution with Distribution with pp - 1 df - 1 df If Number of Blocks or Treatments > 5If Number of Blocks or Treatments > 5
14 - 14 - 8585
© 2000 Prentice-Hall, Inc.© 2000 Prentice-Hall, Inc.
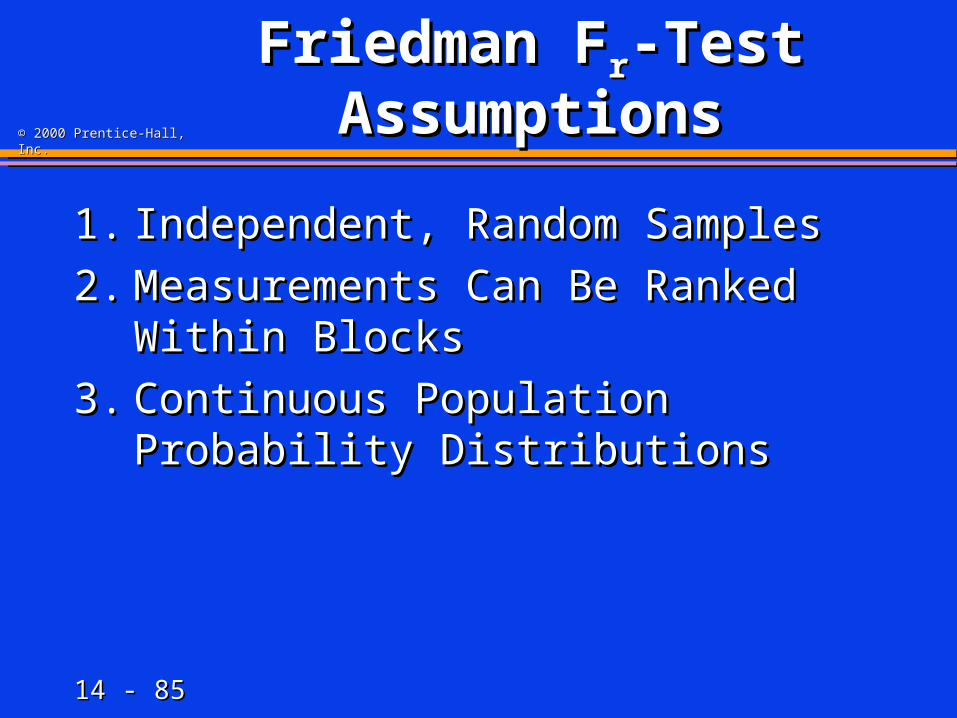
Friedman FFriedman Frr-Test -Test AssumptionsAssumptions
1.1. Independent, Random Samples Independent, Random Samples
2.2. Measurements Can Be Ranked Within Measurements Can Be Ranked Within BlocksBlocks
3.3. Continuous Population Probability Continuous Population Probability DistributionsDistributions
14 - 14 - 8686
© 2000 Prentice-Hall, Inc.© 2000 Prentice-Hall, Inc.
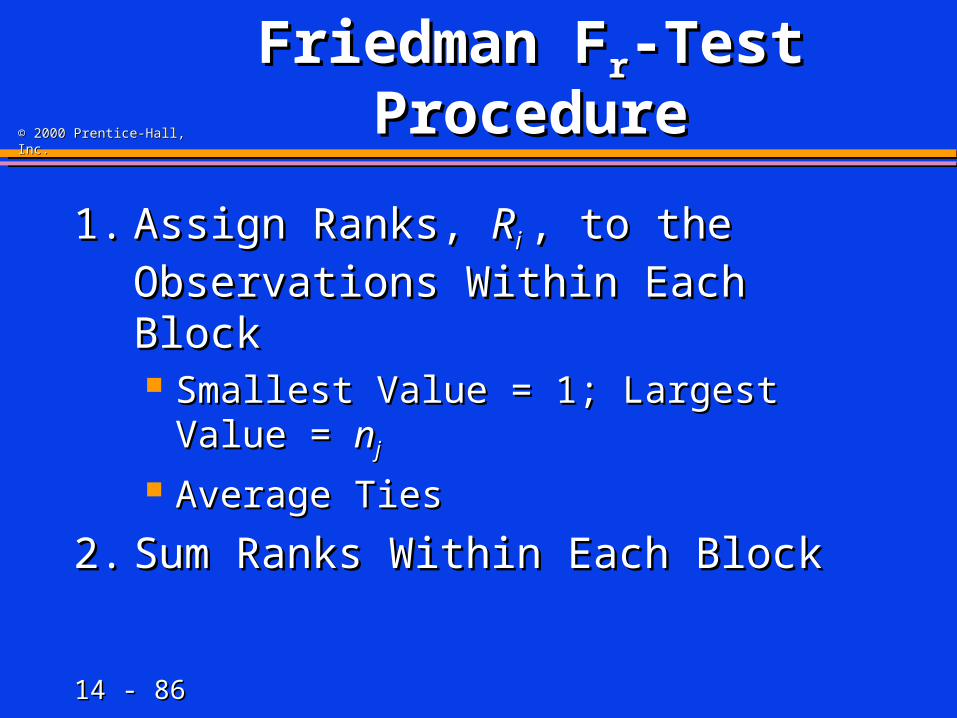
Friedman FFriedman Frr-Test -Test ProcedureProcedure
1.1. Assign Ranks, Assign Ranks, RRi i , to the Observations , to the Observations
Within Each BlockWithin Each Block Smallest Value = 1; Largest Value = Smallest Value = 1; Largest Value = nnjj
Average TiesAverage Ties
2.2. Sum Ranks Within Each BlockSum Ranks Within Each Block
14 - 14 - 8787
© 2000 Prentice-Hall, Inc.© 2000 Prentice-Hall, Inc.
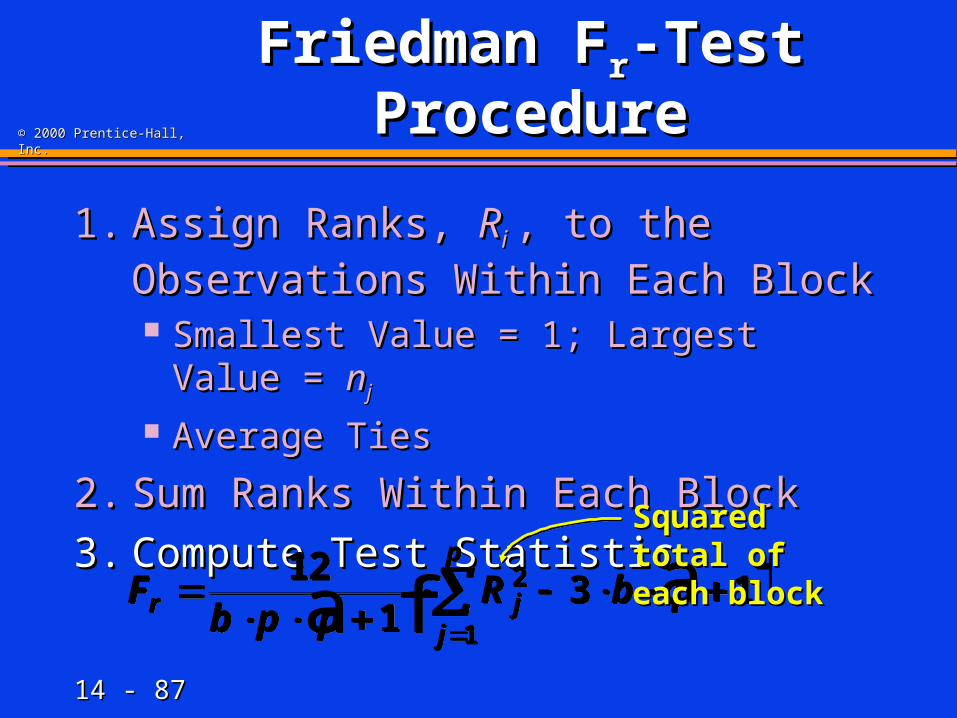
Friedman FFriedman Frr-Test -Test ProcedureProcedure
1.1. Assign Ranks, Assign Ranks, RRi i , to the Observations , to the Observations
Within Each BlockWithin Each Block Smallest Value = 1; Largest Value = Smallest Value = 1; Largest Value = nnjj
Average TiesAverage Ties
2.2. Sum Ranks Within Each BlockSum Ranks Within Each Block
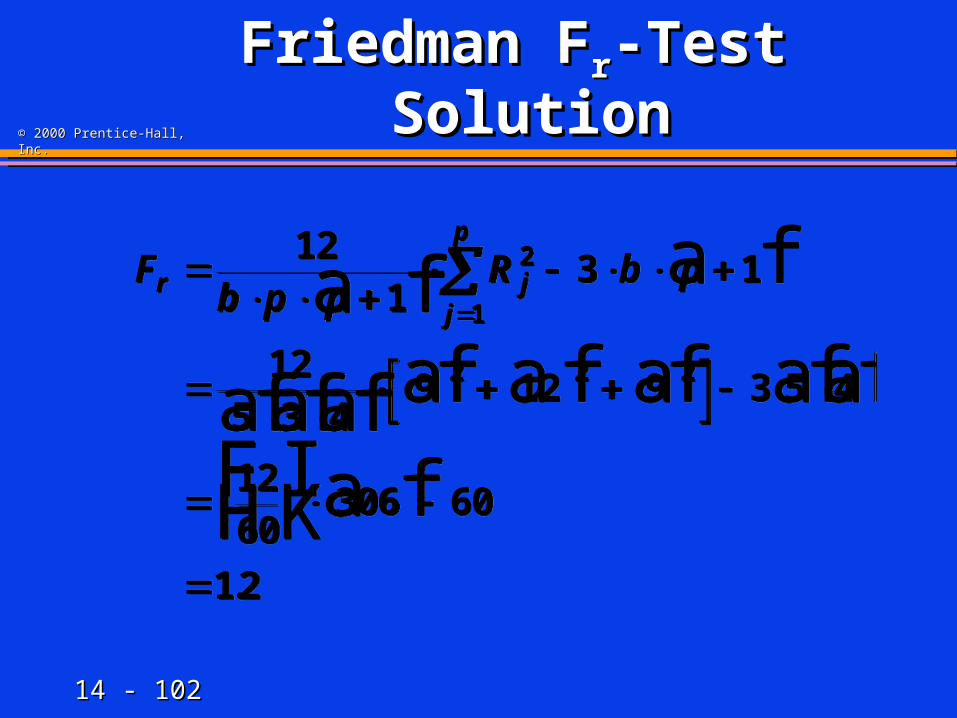
3.3. Compute Test StatisticCompute Test Statistic
Fb p p
R b pr jj
p
12
13 12
1a f a fFb p p
R b pr jj
p
12
13 12
1a f a fSquared total of Squared total of each blockeach block
14 - 14 - 8888
© 2000 Prentice-Hall, Inc.© 2000 Prentice-Hall, Inc.
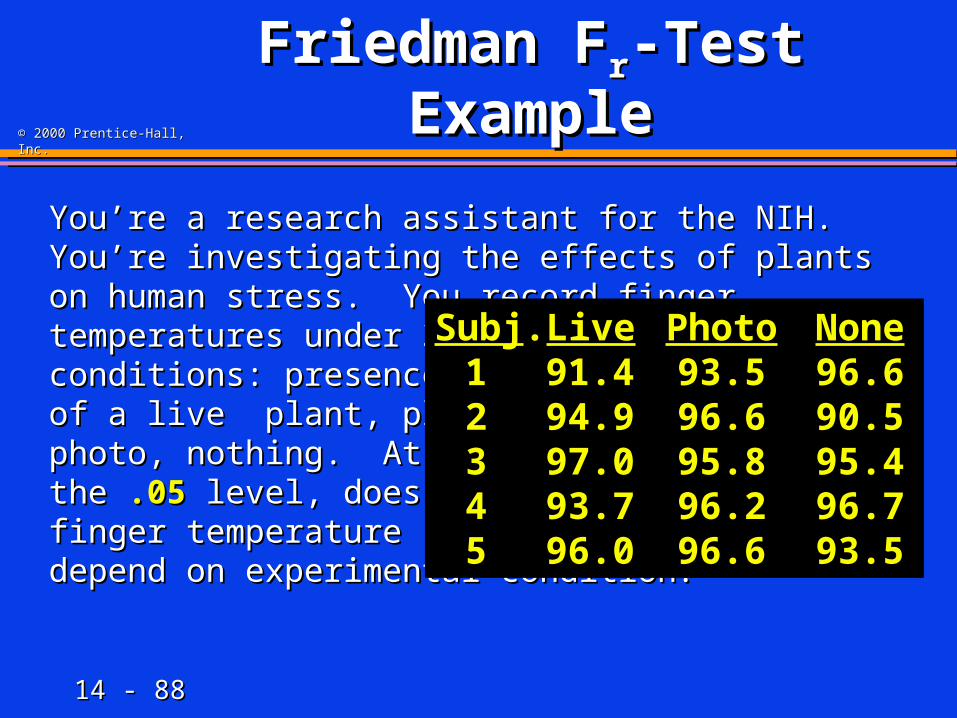
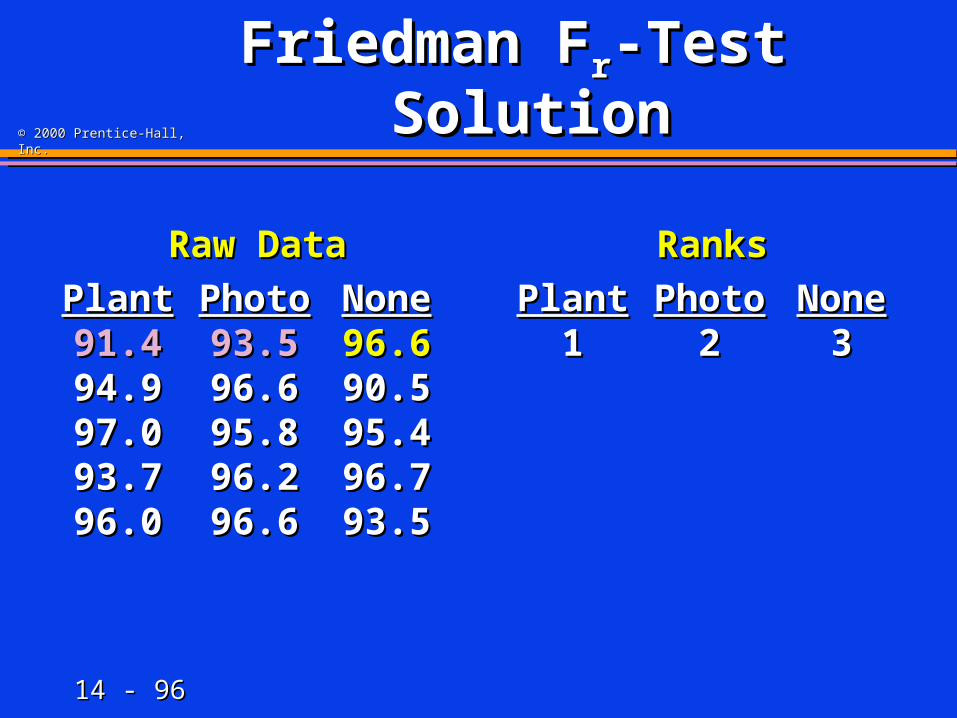
Friedman FFriedman Frr-Test -Test ExampleExample
You’re a research assistant for the NIH. You’re You’re a research assistant for the NIH. You’re investigating the effects of plants on human stress. investigating the effects of plants on human stress. You record finger You record finger temperatures under 3 temperatures under 3 conditions: presence conditions: presence of a live plant, plant of a live plant, plant photo, nothing. At photo, nothing. At the the .05.05 level, does level, does finger temperature finger temperature depend on experimental condition?depend on experimental condition?
Subj. Live Photo None1 91.4 93.5 96.62 94.9 96.6 90.53 97.0 95.8 95.44 93.7 96.2 96.75 96.0 96.6 93.5
14 - 14 - 8989
© 2000 Prentice-Hall, Inc.© 2000 Prentice-Hall, Inc.
2200
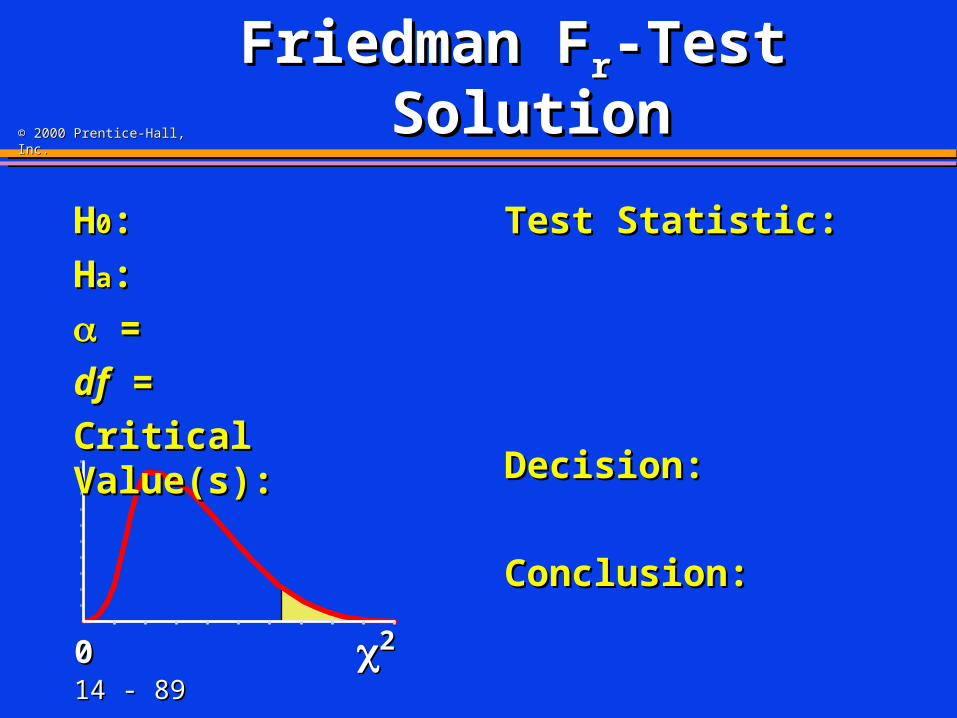
Friedman FFriedman Frr-Test -Test SolutionSolution
HH00::
HHaa::
= =
dfdf = =
Critical Value(s):Critical Value(s):
Test Statistic: Test Statistic:
Decision:Decision:
Conclusion:Conclusion:
14 - 14 - 9090
© 2000 Prentice-Hall, Inc.© 2000 Prentice-Hall, Inc.
2200
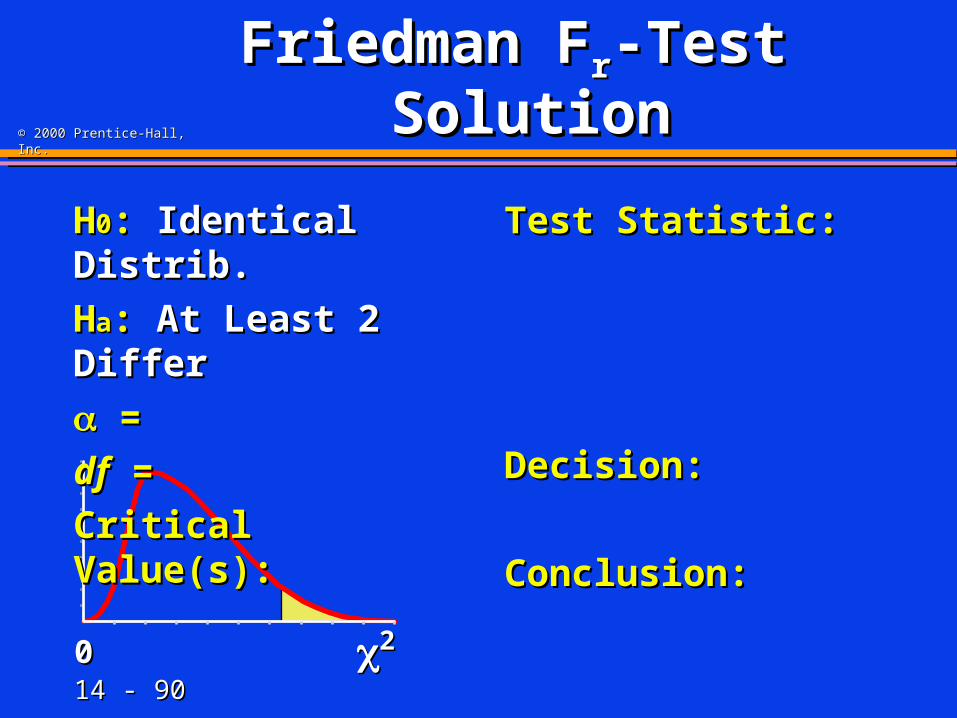
Friedman FFriedman Frr-Test -Test SolutionSolution
HH00: : Identical Distrib.Identical Distrib.
HHaa: : At Least 2 DifferAt Least 2 Differ
= =
dfdf = =
Critical Value(s):Critical Value(s):
Test Statistic: Test Statistic:
Decision:Decision:
Conclusion:Conclusion:
14 - 14 - 9191
© 2000 Prentice-Hall, Inc.© 2000 Prentice-Hall, Inc.
2200
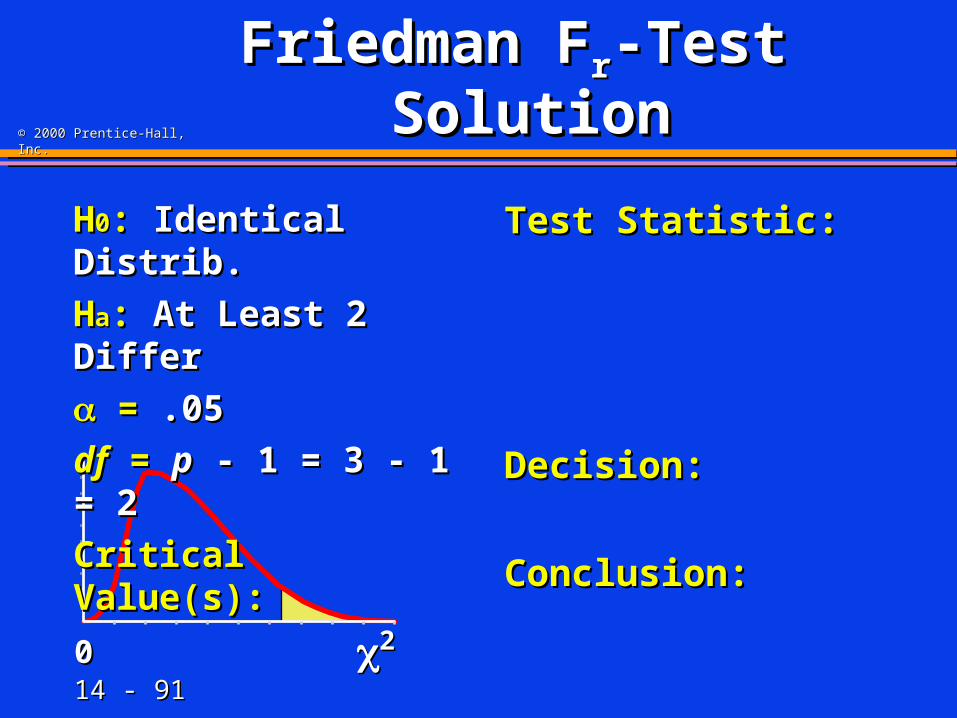
Friedman FFriedman Frr-Test -Test SolutionSolution
HH00: : Identical Distrib.Identical Distrib.
HHaa: : At Least 2 DifferAt Least 2 Differ
= = .05.05
dfdf = = pp - 1 = 3 - 1 = 2 - 1 = 3 - 1 = 2
Critical Value(s):Critical Value(s):
Test Statistic: Test Statistic:
Decision:Decision:
Conclusion:Conclusion:

14 - 14 - 9292
© 2000 Prentice-Hall, Inc.© 2000 Prentice-Hall, Inc.
2200 5.9915.991
Friedman FFriedman Frr-Test -Test SolutionSolution
HH00: : Identical Distrib.Identical Distrib.
HHaa: : At Least 2 DifferAt Least 2 Differ
= = .05.05
dfdf = = pp - 1 = 3 - 1 = 2 - 1 = 3 - 1 = 2
Critical Value(s):Critical Value(s):
Test Statistic: Test Statistic:
Decision:Decision:
Conclusion:Conclusion: = .05= .05

14 - 14 - 9393
© 2000 Prentice-Hall, Inc.© 2000 Prentice-Hall, Inc.
Friedman FFriedman Frr-Test -Test SolutionSolution
Raw DataRaw Data
PlantPlant PhotoPhoto NoneNone91.491.4 93.593.5 96.696.694.994.9 96.696.6 90.590.597.097.0 95.895.8 95.495.493.793.7 96.296.2 96.796.796.096.0 96.696.6 93.593.5
RanksRanks
PlantPlant PhotoPhoto NoneNone
14 - 14 - 9494
© 2000 Prentice-Hall, Inc.© 2000 Prentice-Hall, Inc.
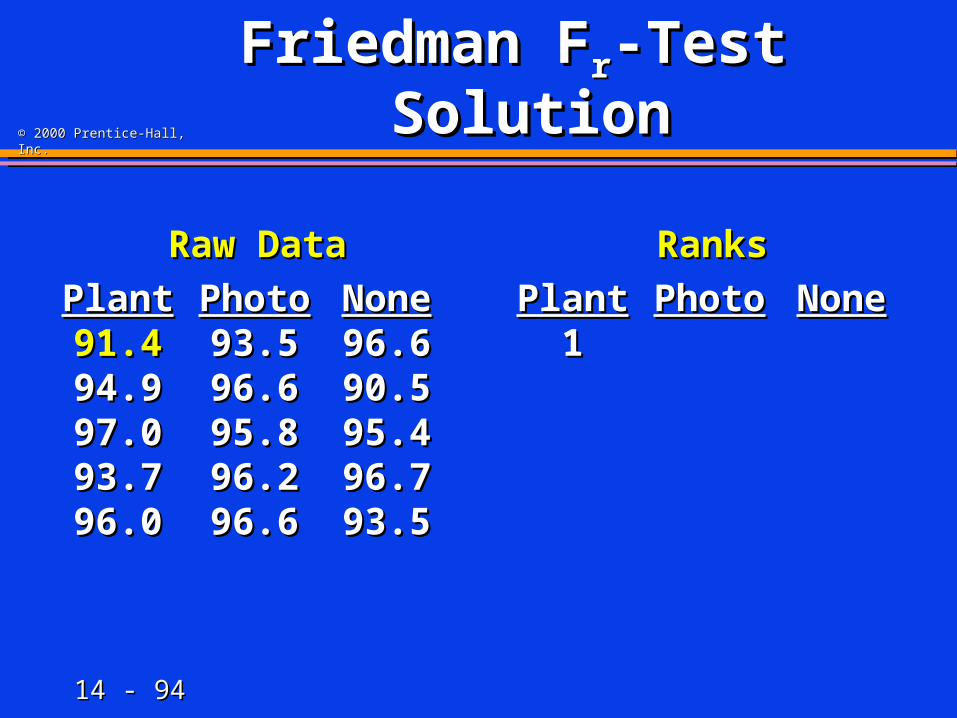
Friedman FFriedman Frr-Test -Test SolutionSolution
Raw DataRaw Data
PlantPlant PhotoPhoto NoneNone91.491.4 93.593.5 96.696.694.994.9 96.696.6 90.590.597.097.0 95.895.8 95.495.493.793.7 96.296.2 96.796.796.096.0 96.696.6 93.593.5
RanksRanks
PlantPlant PhotoPhoto NoneNone11

14 - 14 - 9595
© 2000 Prentice-Hall, Inc.© 2000 Prentice-Hall, Inc.
Friedman FFriedman Frr-Test -Test SolutionSolution
Raw DataRaw Data
PlantPlant PhotoPhoto NoneNone91.491.4 93.593.5 96.696.694.994.9 96.696.6 90.590.597.097.0 95.895.8 95.495.493.793.7 96.296.2 96.796.796.096.0 96.696.6 93.593.5
RanksRanks
PlantPlant PhotoPhoto NoneNone11 22
14 - 14 - 9696
© 2000 Prentice-Hall, Inc.© 2000 Prentice-Hall, Inc.
Friedman FFriedman Frr-Test -Test SolutionSolution
Raw DataRaw Data
PlantPlant PhotoPhoto NoneNone91.491.4 93.593.5 96.696.694.994.9 96.696.6 90.590.597.097.0 95.895.8 95.495.493.793.7 96.296.2 96.796.796.096.0 96.696.6 93.593.5
RanksRanks
PlantPlant PhotoPhoto NoneNone11 22 33

14 - 14 - 9797
© 2000 Prentice-Hall, Inc.© 2000 Prentice-Hall, Inc.
Friedman FFriedman Frr-Test -Test SolutionSolution
Raw DataRaw Data
PlantPlant PhotoPhoto NoneNone91.491.4 93.593.5 96.696.694.994.9 96.696.6 90.590.597.097.0 95.895.8 95.495.493.793.7 96.296.2 96.796.796.096.0 96.696.6 93.593.5
RanksRanks
PlantPlant PhotoPhoto NoneNone11 22 33
11
14 - 14 - 9898
© 2000 Prentice-Hall, Inc.© 2000 Prentice-Hall, Inc.
Friedman FFriedman Frr-Test -Test SolutionSolution
Raw DataRaw Data
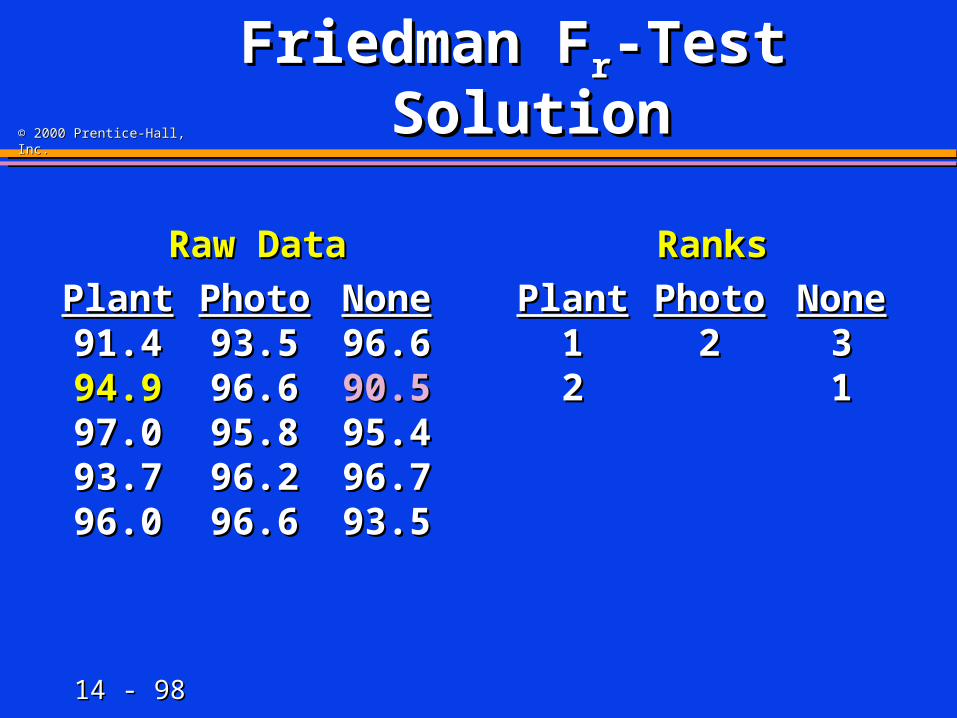
PlantPlant PhotoPhoto NoneNone91.491.4 93.593.5 96.696.694.994.9 96.696.6 90.590.597.097.0 95.895.8 95.495.493.793.7 96.296.2 96.796.796.096.0 96.696.6 93.593.5
RanksRanks
PlantPlant PhotoPhoto NoneNone11 22 3322 11
14 - 14 - 9999
© 2000 Prentice-Hall, Inc.© 2000 Prentice-Hall, Inc.
Friedman FFriedman Frr-Test -Test SolutionSolution
Raw DataRaw Data
PlantPlant PhotoPhoto NoneNone91.491.4 93.593.5 96.696.694.994.9 96.696.6 90.590.597.097.0 95.895.8 95.495.493.793.7 96.296.2 96.796.796.096.0 96.696.6 93.593.5
RanksRanks
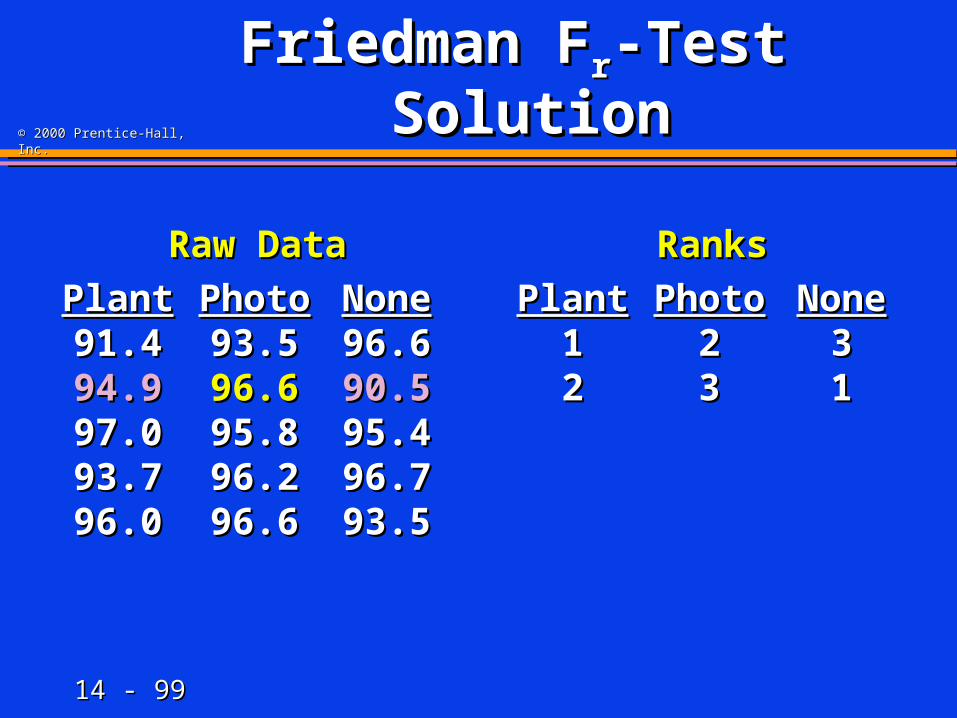
PlantPlant PhotoPhoto NoneNone11 22 3322 33 11
14 - 14 - 100100
© 2000 Prentice-Hall, Inc.© 2000 Prentice-Hall, Inc.
Friedman FFriedman Frr-Test -Test SolutionSolution
Raw DataRaw Data
PlantPlant PhotoPhoto NoneNone91.491.4 93.593.5 96.696.694.994.9 96.696.6 90.590.597.097.0 95.895.8 95.495.493.793.7 96.296.2 96.796.796.096.0 96.696.6 93.593.5
RanksRanks
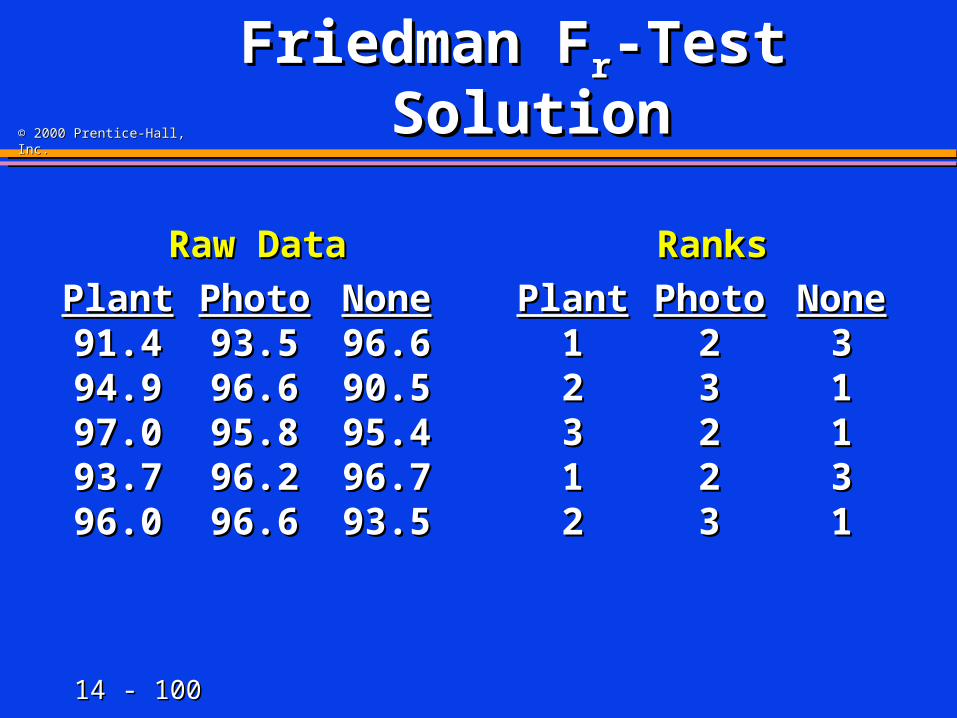
PlantPlant PhotoPhoto NoneNone11 22 3322 33 1133 22 1111 22 3322 33 11
14 - 14 - 101101
© 2000 Prentice-Hall, Inc.© 2000 Prentice-Hall, Inc.
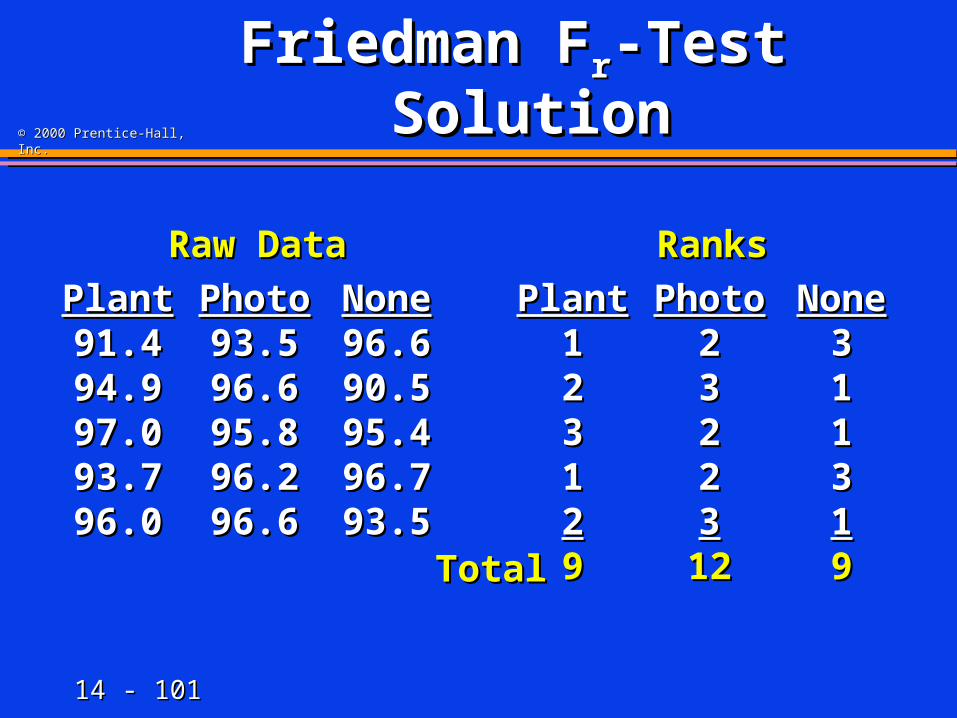
Friedman FFriedman Frr-Test -Test SolutionSolution
Raw DataRaw Data
PlantPlant PhotoPhoto NoneNone91.491.4 93.593.5 96.696.694.994.9 96.696.6 90.590.597.097.0 95.895.8 95.495.493.793.7 96.296.2 96.796.796.096.0 96.696.6 93.593.5
RanksRanks
PlantPlant PhotoPhoto NoneNone11 22 3322 33 1133 22 1111 22 3322 33 1199 1212 99TotalTotal
14 - 14 - 102102
© 2000 Prentice-Hall, Inc.© 2000 Prentice-Hall, Inc.
Friedman FFriedman Frr-Test -Test SolutionSolution
Fb p p
R b pr jj
p
FHIK
12
13 1
125 3 4
9 12 9 3 5 4
1260
306 60
12
2
1
2 2 2
a f a f
afafaf af af af afaf
a f.
Fb p p
R b pr jj
p
FHIK
12
13 1
125 3 4
9 12 9 3 5 4
1260
306 60
12
2
1
2 2 2
a f a f
afafaf af af af afaf
a f.
14 - 14 - 103103
© 2000 Prentice-Hall, Inc.© 2000 Prentice-Hall, Inc.
2200 5.9915.991
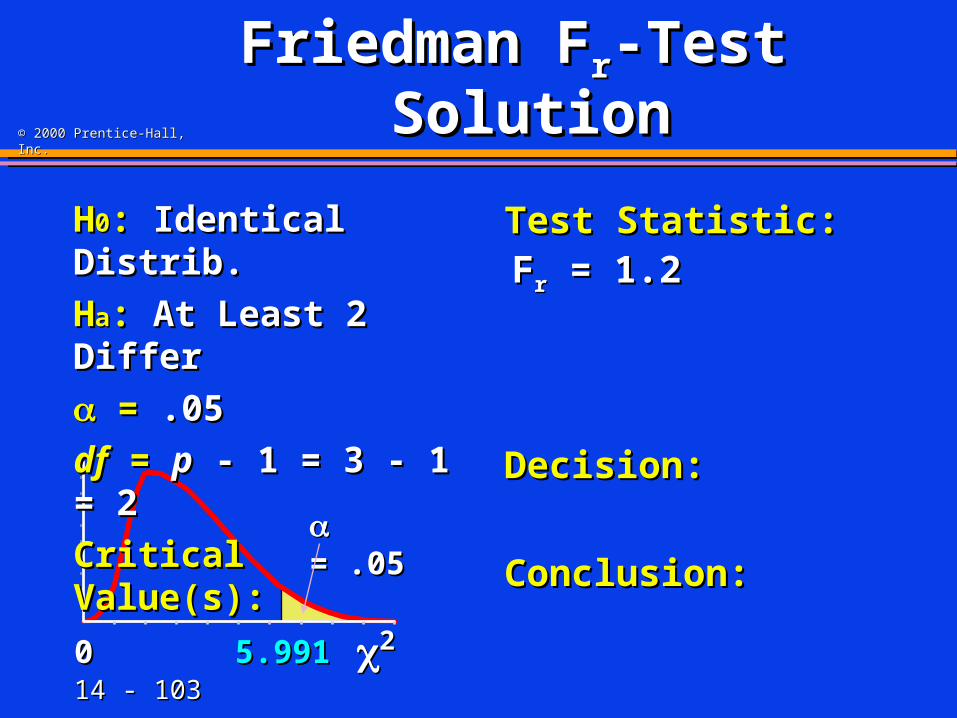
Friedman FFriedman Frr-Test -Test SolutionSolution
HH00: : Identical Distrib.Identical Distrib.
HHaa: : At Least 2 DifferAt Least 2 Differ
= = .05.05
dfdf = = pp - 1 = 3 - 1 = 2 - 1 = 3 - 1 = 2
Critical Value(s):Critical Value(s):
Test Statistic: Test Statistic:
Decision:Decision:
Conclusion:Conclusion: = .05= .05
FFrr = 1.2 = 1.2
14 - 14 - 104104
© 2000 Prentice-Hall, Inc.© 2000 Prentice-Hall, Inc.
2200 5.9915.991
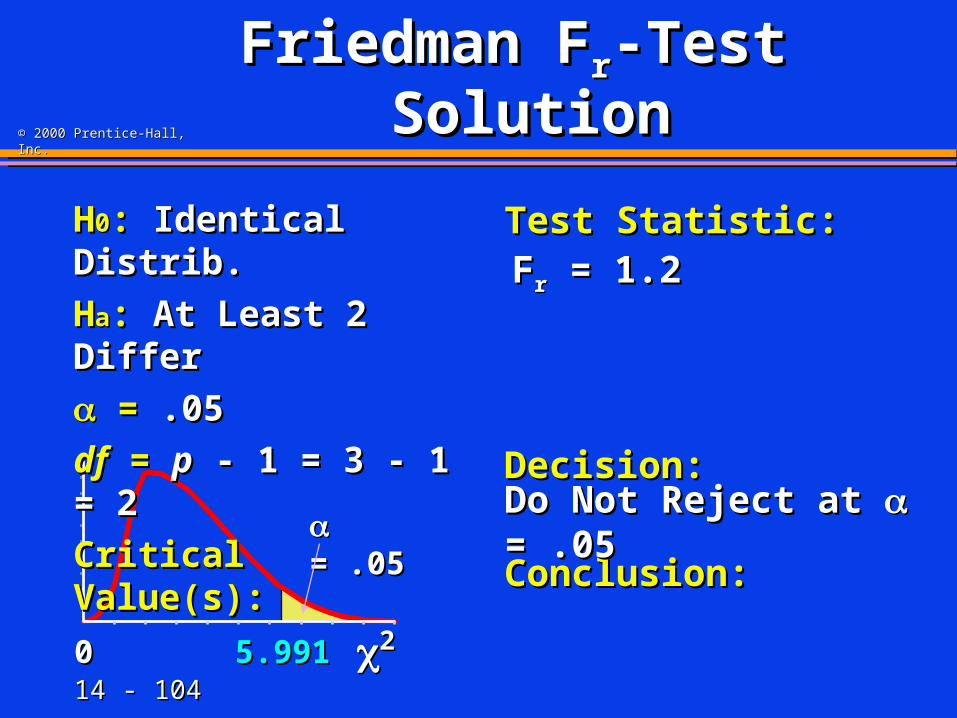
Friedman FFriedman Frr-Test -Test SolutionSolution
HH00: : Identical Distrib.Identical Distrib.
HHaa: : At Least 2 DifferAt Least 2 Differ
= = .05.05
dfdf = = pp - 1 = 3 - 1 = 2 - 1 = 3 - 1 = 2
Critical Value(s):Critical Value(s):
Test Statistic: Test Statistic:
Decision:Decision:
Conclusion:Conclusion:
Do Not Reject at Do Not Reject at = .05 = .05 = .05= .05
FFrr = 1.2 = 1.2
14 - 14 - 105105
© 2000 Prentice-Hall, Inc.© 2000 Prentice-Hall, Inc.
2200 5.9915.991
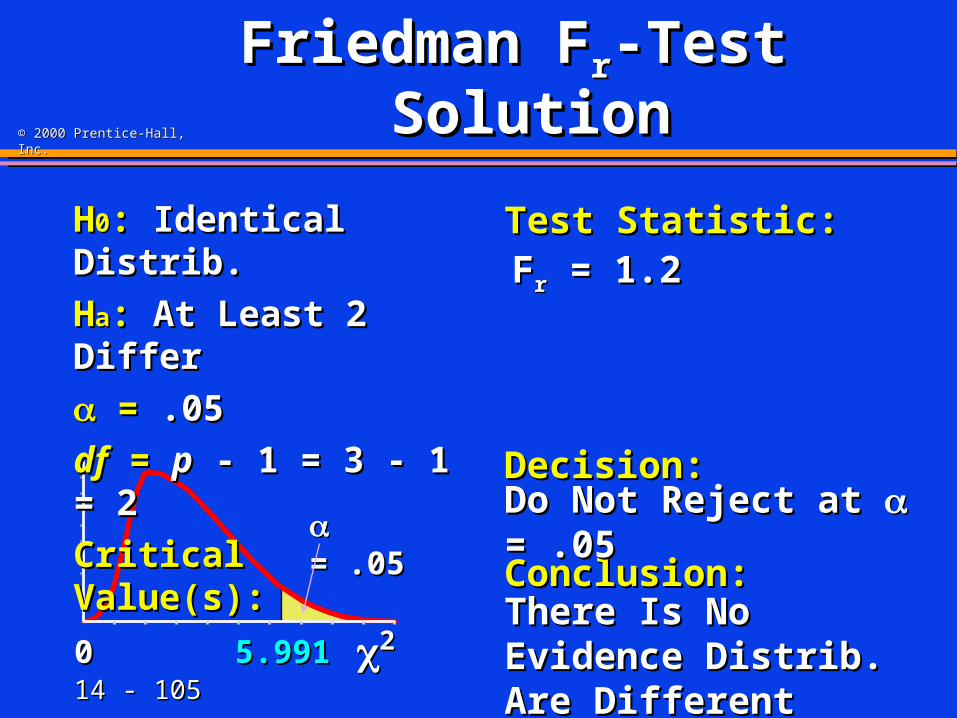
Friedman FFriedman Frr-Test -Test SolutionSolution
HH00: : Identical Distrib.Identical Distrib.
HHaa: : At Least 2 DifferAt Least 2 Differ
= = .05.05
dfdf = = pp - 1 = 3 - 1 = 2 - 1 = 3 - 1 = 2
Critical Value(s):Critical Value(s):
Test Statistic: Test Statistic:
Decision:Decision:
Conclusion:Conclusion:
Do Not Reject at Do Not Reject at = .05 = .05
There Is No Evidence There Is No Evidence Distrib. Are DifferentDistrib. Are Different
= .05= .05
FFrr = 1.2 = 1.2
14 - 14 - 106106
© 2000 Prentice-Hall, Inc.© 2000 Prentice-Hall, Inc.
Spearman’s Rank Spearman’s Rank Correlation CoefficientCorrelation Coefficient

14 - 14 - 107107
© 2000 Prentice-Hall, Inc.© 2000 Prentice-Hall, Inc.
Spearman’s Rank Spearman’s Rank Correlation Correlation CoefficientCoefficient
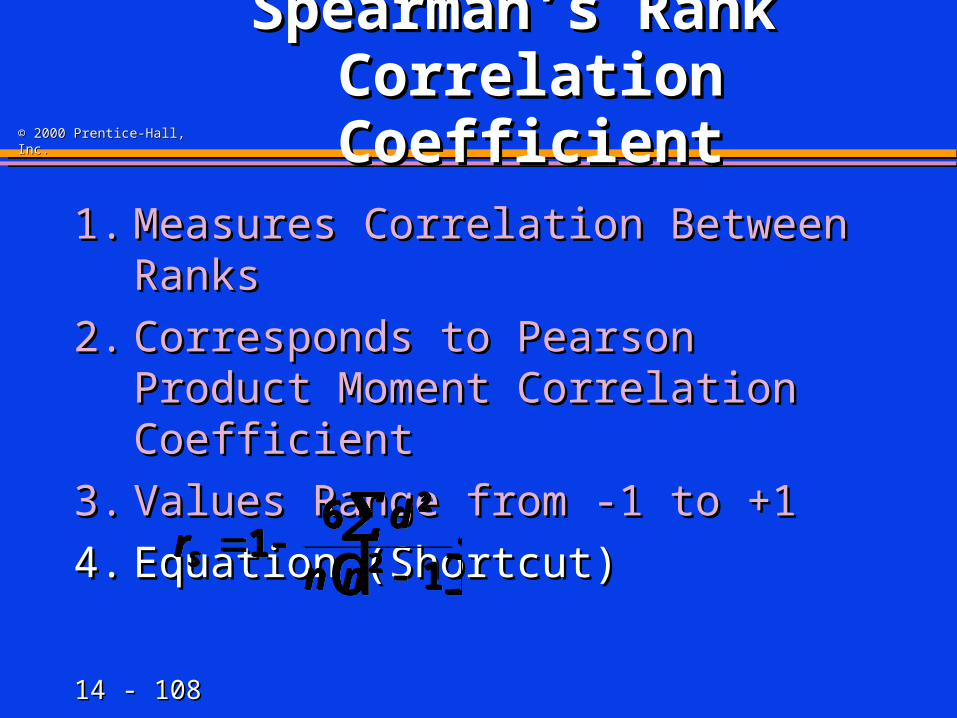
1.1. Measures Correlation Between RanksMeasures Correlation Between Ranks
2.2. Corresponds to Pearson Product Corresponds to Pearson Product Moment Correlation CoefficientMoment Correlation Coefficient
3.3. Values Range from -1 to +1Values Range from -1 to +1
14 - 14 - 108108
© 2000 Prentice-Hall, Inc.© 2000 Prentice-Hall, Inc.
Spearman’s Rank Spearman’s Rank Correlation Correlation CoefficientCoefficient
1.1. Measures Correlation Between RanksMeasures Correlation Between Ranks
2.2. Corresponds to Pearson Product Corresponds to Pearson Product Moment Correlation CoefficientMoment Correlation Coefficient
3.3. Values Range from -1 to +1Values Range from -1 to +1
4.4. Equation (Shortcut)Equation (Shortcut)
rd
n ns
1
6
1
2
2d ird
n ns
1
6
1
2
2d i

14 - 14 - 109109
© 2000 Prentice-Hall, Inc.© 2000 Prentice-Hall, Inc.
Spearman’s Rank Spearman’s Rank Correlation Correlation ProcedureProcedure
1.1. Assign Ranks, Assign Ranks, RRi i , to the Observations , to the Observations
of Each Variable Separatelyof Each Variable Separately
2.2. Calculate Differences, Calculate Differences, ddi i , Between , Between
Each Pair of RanksEach Pair of Ranks
3.3. Square Differences, Square Differences, ddi i 22, Between Ranks, Between Ranks
4.4. Sum Squared Differences for Each VariableSum Squared Differences for Each Variable
5.5. Use Shortcut Approximation FormulaUse Shortcut Approximation Formula
14 - 14 - 110110
© 2000 Prentice-Hall, Inc.© 2000 Prentice-Hall, Inc.
Spearman’s Rank Spearman’s Rank Correlation ExampleCorrelation Example
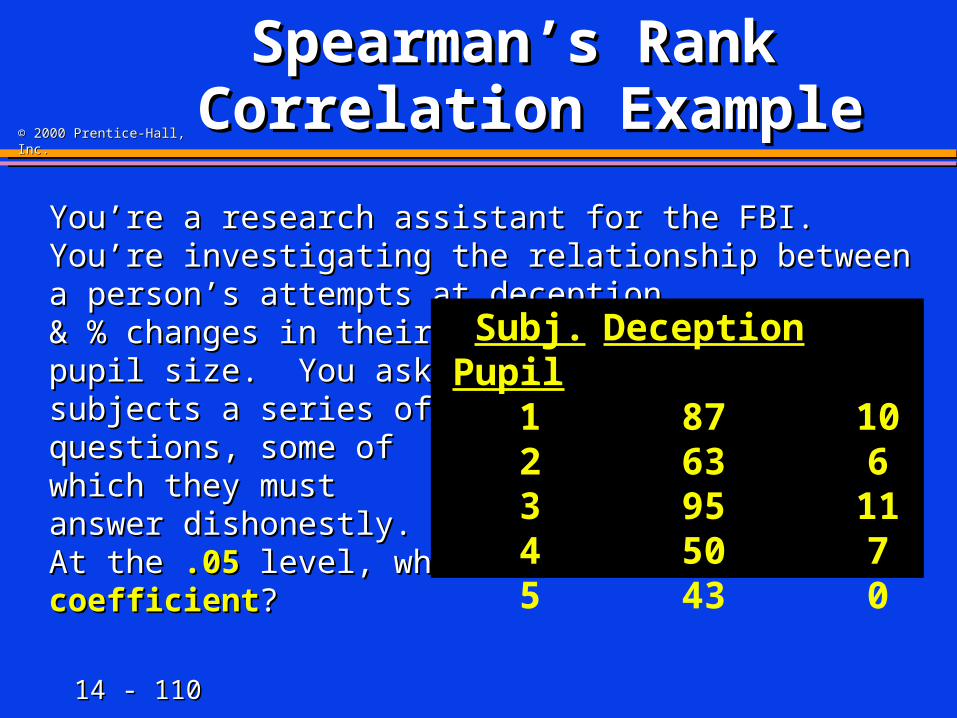
You’re a research assistant for the FBI. You’re You’re a research assistant for the FBI. You’re investigating the relationship between a person’s investigating the relationship between a person’s attempts at deception attempts at deception & % changes in their & % changes in their pupil size. You ask pupil size. You ask subjects a series of subjects a series of questions, some of questions, some of which they must which they must answer dishonestly. answer dishonestly. At the At the .05.05 level, what is the level, what is the correlation coefficientcorrelation coefficient??
Subj. DeceptionPupil
1 87 102 63 63 95 114 50 75 43 0

14 - 14 - 111111
© 2000 Prentice-Hall, Inc.© 2000 Prentice-Hall, Inc.
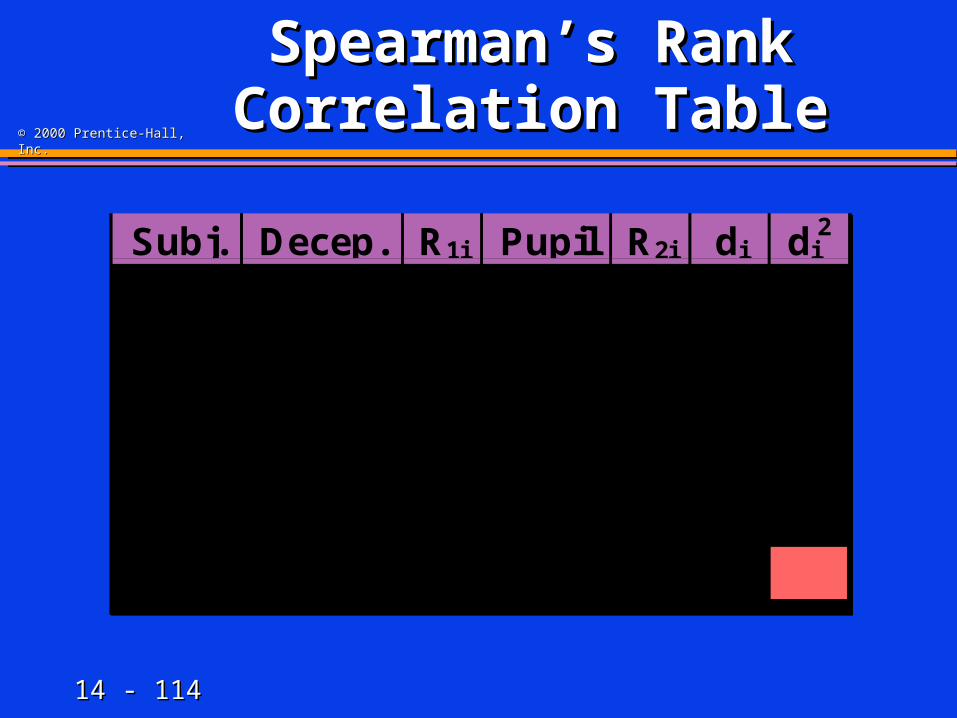
Spearman’s Rank Spearman’s Rank Correlation TableCorrelation Table
Subj. Decep. R1i Pupil R2i di di2
Total
Subj. Decep. R1i Pupil R2i di di2
Total

14 - 14 - 112112
© 2000 Prentice-Hall, Inc.© 2000 Prentice-Hall, Inc.
Spearman’s Rank Spearman’s Rank Correlation TableCorrelation Table
Subj. Decep. R1i Pupil R2i di di2
1 87 10
2 63 6
3 95 11
4 50 7
5 43 0
Total
Subj. Decep. R1i Pupil R2i di di2
1 87 10
2 63 6
3 95 11
4 50 7
5 43 0
Total

14 - 14 - 113113
© 2000 Prentice-Hall, Inc.© 2000 Prentice-Hall, Inc.
Spearman’s Rank Spearman’s Rank Correlation TableCorrelation Table
Subj. Decep. R1i Pupil R2i di di2
1 87 4 10
2 63 3 6
3 95 5 11
4 50 2 7
5 43 1 0
Total
Subj. Decep. R1i Pupil R2i di di2
1 87 4 10
2 63 3 6
3 95 5 11
4 50 2 7
5 43 1 0
Total
14 - 14 - 114114
© 2000 Prentice-Hall, Inc.© 2000 Prentice-Hall, Inc.
Spearman’s Rank Spearman’s Rank Correlation TableCorrelation Table
Subj. Decep. R1i Pupil R2i di di2
1 87 4 10 4
2 63 3 6 2
3 95 5 11 5
4 50 2 7 3
5 43 1 0 1
Total
Subj. Decep. R1i Pupil R2i di di2
1 87 4 10 4
2 63 3 6 2
3 95 5 11 5
4 50 2 7 3
5 43 1 0 1
Total

14 - 14 - 115115
© 2000 Prentice-Hall, Inc.© 2000 Prentice-Hall, Inc.
Spearman’s Rank Spearman’s Rank Correlation TableCorrelation Table
Subj. Decep. R1i Pupil R2i di di2
1 87 4 10 4 0
2 63 3 6 2 1
3 95 5 11 5 0
4 50 2 7 3 -1
5 43 1 0 1 0
Total
Subj. Decep. R1i Pupil R2i di di2
1 87 4 10 4 0
2 63 3 6 2 1
3 95 5 11 5 0
4 50 2 7 3 -1
5 43 1 0 1 0
Total
14 - 14 - 116116
© 2000 Prentice-Hall, Inc.© 2000 Prentice-Hall, Inc.
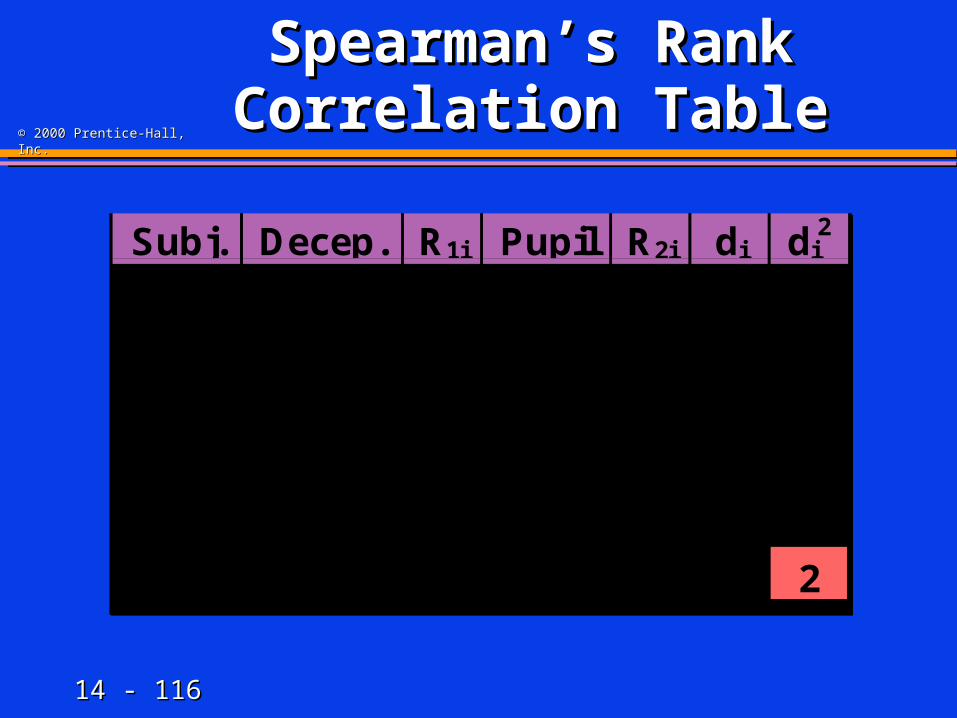
Spearman’s Rank Spearman’s Rank Correlation TableCorrelation Table
Subj. Decep. R1i Pupil R2i di di2
1 87 4 10 4 0 0
2 63 3 6 2 1 1
3 95 5 11 5 0 0
4 50 2 7 3 -1 1
5 43 1 0 1 0 0
Total 2
Subj. Decep. R1i Pupil R2i di di2
1 87 4 10 4 0 0
2 63 3 6 2 1 1
3 95 5 11 5 0 0
4 50 2 7 3 -1 1
5 43 1 0 1 0 0
Total 2
14 - 14 - 117117
© 2000 Prentice-Hall, Inc.© 2000 Prentice-Hall, Inc.
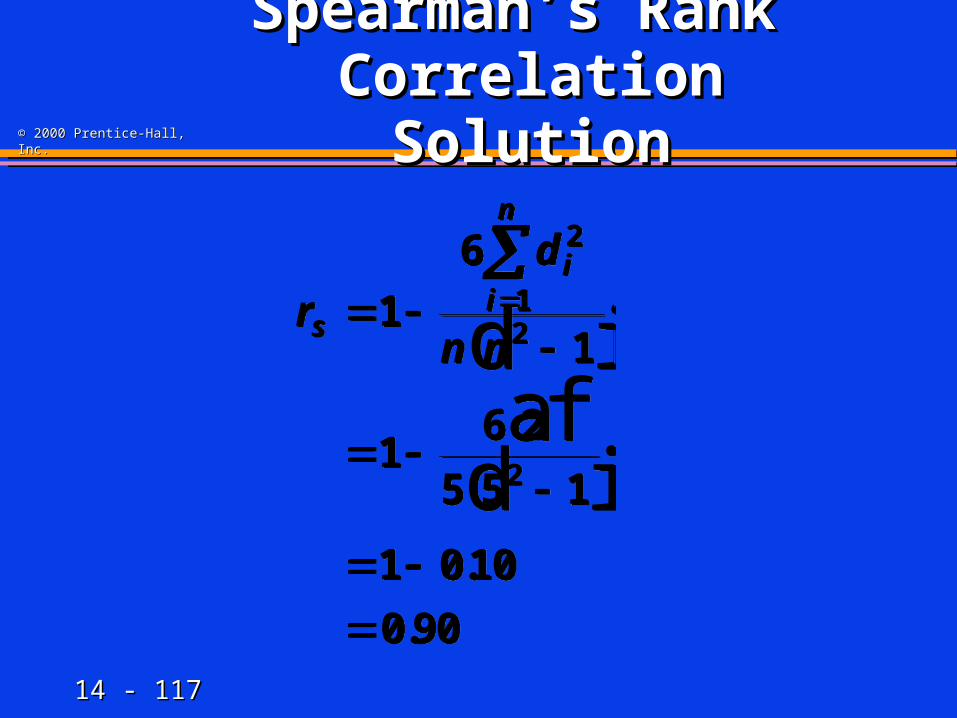
Spearman’s Rank Spearman’s Rank Correlation SolutionCorrelation Solution
r
d
n ns
ii
n
1
6
1
16 2
5 5 1
1 010
0 90
2
12
2
d iafd i.
.
r
d
n ns
ii
n
1
6
1
16 2
5 5 1
1 010
0 90
2
12
2
d iafd i.
.
14 - 14 - 118118
© 2000 Prentice-Hall, Inc.© 2000 Prentice-Hall, Inc.
ConclusionConclusion
1.1. Distinguished Parametric & Distinguished Parametric & Nonparametric Test Procedures Nonparametric Test Procedures
2.2. Explained a Variety of Nonparametric Explained a Variety of Nonparametric Test ProceduresTest Procedures
3.3. Solved Hypothesis Testing Problems Solved Hypothesis Testing Problems Using Nonparametric TestsUsing Nonparametric Tests
4.4. Computed Spearman’s Rank CorrelationComputed Spearman’s Rank Correlation