1h17 results presentation - asx · 2017-02-23 · cmw –1h17 results 2 important information &...
TRANSCRIPT

CMW – 1H17 Results 1
1H17 RESULTS PRESENTATION24 February 2017
For
per
sona
l use
onl
y

CMW – 1H17 Results 2
Important Information & DisclaimerThis presentation including its appendices
(Presentation) is dated 24 February 2017 and has
been prepared by Cromwell Property Group, which
comprises Cromwell Corporation Limited (ACN 001
056 980) and the Cromwell Diversified Property Trust
(ARSN 102 982 598) (the responsible entity of which
is Cromwell Property Securities Limited (ACN 079 147
809; AFSL 238052)). Shares in Cromwell Corporation
Limited are stapled to units in the Cromwell Diversified
Property Trust. The stapled securities are listed on the
ASX (ASX Code: CMW).
This Presentation contains summary information about
Cromwell Property Group as at 31 December 2016.
Statutory financial information has been reviewed by
Cromwell Property Group’s auditors. Operating
financial information has not been subjected to audit
review. All financial information is in Australian dollars
and all statistics are as at 31 December 2016 unless
otherwise stated. All statistics include 50% share of
Northpoint Tower.
The information in this Presentation is subject to
change without notice and does not purport to be
complete or comprehensive. It should be read in
conjunction with Cromwell Property Group’s other
periodic and continuous disclosure announcements
available at www.asx.com.au.
The information in this Presentation does not take into
account your individual objectives, financial situation
or needs. Before making an investment decision,
investors should consider, with or without a financial or
taxation adviser, all relevant information (including the
information in this Presentation) having regard to their
own objectives, financial situation and needs.
Investors should also seek such financial, legal or tax
advice as they deem necessary or consider
appropriate for their particular jurisdiction.
Cromwell Property Group does not guarantee any
particular rate of return or the performance of
Cromwell Property Group nor do they guarantee the
repayment of capital from Cromwell Property Group or
any particular tax treatment. Past performance is not
indicative of future performance. Any “forward-looking”
statements are based on assumptions and
contingencies which are subject to change without
notice. Any forward-looking statements are provided
as a general guide only and should not be relied upon
as an indication or guarantee of future performance.
The information in this Presentation has been obtained
from or based on sources believed by Cromwell
Property Group to be reliable. To the maximum extent
permitted by law, Cromwell Property Group, their
officers, employees, agents and advisors do not make
any warranty, expressed or implied, as to the
currency, accuracy, reliability or completeness of the
information in this Presentation and disclaim all
responsibility and liability for the information (including,
without limitation, liability for negligence).
To the extent that any general financial product advice
in respect of Cromwell Property Group stapled
securities is provided in this Presentation, it is
provided by Cromwell Property Securities Limited.
Cromwell Property Securities Limited and its related
bodies corporate, and their associates, will not receive
any remuneration or benefits in connection with that
advice.
Cromwell Funds Management Limited ACN 114 782
777 AFSL 333214 (CFM) is the responsible entity of,
and the issuer of units in, the Cromwell Australian
Property Fund ARSN 153 092 516 (APF), Cromwell
Direct Property Fund ARSN 165 011 905 (DPF),
Cromwell Ipswich City Heart Trust ARSN 154 498 923
(ICH), Cromwell Phoenix Core Listed Property Fund
ARSN 604 286 071 (PCF), Cromwell Phoenix
Opportunities Fund ARSN 602 776 536 (POF),
Cromwell Phoenix Property Securities Fund ARSN
129 580 267 (PSF), Cromwell Property Trust 12 ARSN
166 216 995 (C12) and Cromwell Riverpark Trust
ARSN 135 002 336 (CRT) (the funds). In making an
investment decision in relation to one or more of the
funds, it is important that you read the product
disclosure statement for the fund. The PDS for each
fund is issued by CFM and is available from
www.cromwell.com.au or by calling Cromwell on 1300
276 693. ICH, C12 and CRT are not open for
investment. PSF is closed to new investment.
Applications for units in APF, DPF, PCF and POF can
only be made on the application form accompanying
the relevant PDS.
This Presentation does not constitute an offer to sell,
or the solicitation of an offer to buy, any securities or
any other financial products in the United States or
any other jurisdiction. Cromwell Property Group
stapled securities have not been, and will not be,
registered under the US Securities Act of 1933, as
amended (Securities Act) or the securities laws of any
state or other jurisdiction of the United States and may
not be offered or sold in the United States or to, or for
the account or benefit of, a person in the United States
unless they have been registered under the Securities
Act, or are offered or sold in a transaction exempt
from, or not subject to the registration requirements of
the Securities Act and any other applicable securities
laws.
© 2017. Cromwell Property Group. All rights reserved.For
per
sona
l use
onl
y

SECTION 1
1H17 Overview
For
per
sona
l use
onl
y

CMW – 1H17 Results 4
Cromwell Property Group Strategy
Targeting an 80:20 Operating Profit Split between direct property investment and funds management.
Direct Property Investment Funds Management
Our goal is to provide securityholders with stable, secure and
increasing distributions per security
Maintain defensive
core portfolio
characteristics of
strong tenant
covenant,
long WALE and fixed
rental increment
Repurpose,
reposition or
transform active
assets to improve
portfolio quality and
realise additional
value
Manage property
internally to
understand risk and
opportunity more
clearly than others
Continually in
market looking for
value based
investment
opportunities
Focus on core, core
plus and value add
opportunities
Select wholesale
partnerships
Ability to execute
mandates across all
investment styles
Provide investors with
a range of product
options
Via either open ended
funds or closed,
unlisted trusts
Focus on delivering
high yield with low
volatilityFor
per
sona
l use
onl
y

CMW – 1H17 Results 5
56.9%
18.5%
14.9%
6.7%3.0%
Office
Retail
Industrial
Property Securities
Other
Platform
350+ people
15countries
30offices
Portfolio
$9.8bn1
AUM
340+ properties
3,600+tenants
Global platform offering diverse product range across key property sectors
Diverse Product Range Extensive and Broad Skill SetTrack Record of Successful Partnerships
Cromwell Property Group Statistics 1H17
AUM by Sector
AUM by Geography
49.6%45.2%
5.2%
Europe
Australia
NZ
4.1m sqm
1) Includes assets under construction at ‘as if complete’, 45% Phoenix Portfolios and 50% of Oyster Group assets under management
For
per
sona
l use
onl
y

CMW – 1H17 Results 6
Operating Profit (cps)
1H17 Results Segment Results1H17 Performance Versus Guidance
Cromwell Property Group 1H17 Headline Results
Direct Property Investment
operating profit of $62.5
million ($70.4 million in 1H16)
Funds Management
(Wholesale) operating profit of
$9.8 million ($10.7 million in
1H16)
Funds Management (Retail)
operating profit of $6.0 million
($8.8 million in 1H16)
Distributions of $5.9 million
from 9.83% stake in Investa
(ASX:IOF)
1H17 operating profit of
$78.7 million ($88.8 million
in 1H16)
1H17 operating profit per
security of 4.5 cps (5.1 cps
1H16)
Statutory profit of $153.2
million ($195.5 million in
1H16)
Distributions of 4.2 cps are
greater than 1H16 (4.0 cps),
1H15 (3.9 cps) and 1H14
(3.8 cps).
1H17 1H16 Change
Statutory profit ($M) 153.2 195.5 (22%)
Statutory profit (cents per security) 8.7 11.2 (22%)
Operating profit ($M)1 78.7 88.8 (11%)
Operating profit (cents per security) 4.5 5.1 (12%)
Distributions ($M) 73.2 69.6 5%
Distributions (cents per security) 4.2 4.0 5%
1) See Appendix for further details of segment results, operating profit and reconciliation to statutory profit
FY17 Guidance
8.40 cps
1H17
4.5 cps
Distributions (cps)
1H17
4.2 cps
FY17 Guidance
8.34 cps
For
per
sona
l use
onl
y
SECTION 2
Property Portfolio And Lease Renewal Programme
For
per
sona
l use
onl
y
CMW – 1H17 Results 8
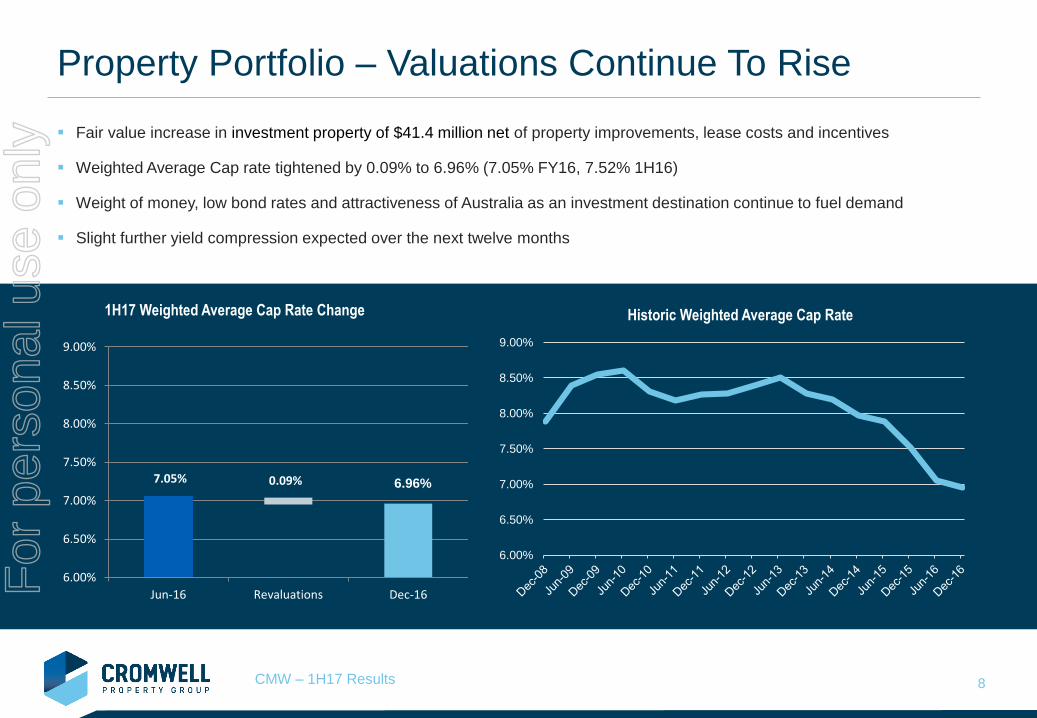
Property Portfolio – Valuations Continue To Rise
Fair value increase in investment property of $41.4 million net of property improvements, lease costs and incentives
Weighted Average Cap rate tightened by 0.09% to 6.96% (7.05% FY16, 7.52% 1H16)
Weight of money, low bond rates and attractiveness of Australia as an investment destination continue to fuel demand
Slight further yield compression expected over the next twelve months
1H17 Weighted Average Cap Rate Change
7.05% 0.09%
6.00%
6.50%
7.00%
7.50%
8.00%
8.50%
9.00%
Jun-16 Revaluations Dec-16
6.96%
6.00%
6.50%
7.00%
7.50%
8.00%
8.50%
9.00%
Historic Weighted Average Cap Rate
For
per
sona
l use
onl
y

CMW – 1H17 Results 9
41.5%
36.1%
22.4% Government Authority
ListedCompany/Subsidary
Private Company
98.5%
1.5%
Office
Other
Property Portfolio – Tenant Profile Remains Robust
Tenant profile remains consistent and of high quality
Government2 contributes 41.5% of income
Top 5 tenants account for 60.8% of income
Portfolio is 65% weighted to Sydney and Melbourne office
market where low vacancy rates and stock withdrawals are
leading to lower incentives/higher rents
Exposure to resource states limited to QLD (20% of
portfolio) with promising leasing successes seen in Brisbane
Tenant Classification1
1) By gross passing income
2) Includes Government owned and funded entities
3) S&P Ratings as at 23 February 2017
Geographic Diversification1 Sector Diversification1
Top 5 Tenants1
% of Gross
Income Cumulative % Credit Rating3
Federal Government 17.3% 17.3% AAA
NSW State Government 14.7% 32.0% AAA
Qantas 14.3% 46.3% BBB-
QLD State Government 9.6% 55.9% AA+
AECOM Australia Pty Ltd 4.9% 60.8%
TOTAL 60.8%
214.6%
54.6%
20.4%
10.1%
0.2% 0.1%
ACT
NSW
QLD
VIC
TAS
SA
All statistics incorporate CMW’s 50% ownership of Northpoint
For
per
sona
l use
onl
y

CMW – 1H17 Results 10
22% 17%4%
22%25% 45%
6% 5%3%
50% 53% 48%
0%
10%
20%
30%
40%
50%
60%
70%
80%
90%
100%
FY17 FY18 FY19
No Review
Market
CPI
Fixed
Property Portfolio – Lease Expiry Profile Favourable
WALE of 6.35 years (6.34 years FY16)
Average fixed review over next 3 years
3.9% over 50% of portfolio in FY17
3.89% over 53% of portfolio in FY18
3.85% over 48% of portfolio in FY19
Next Review Type3
1) Includes vacancy, holdover, casual and expiring leases
2) Includes CPI reviews with a fixed minimum amount
3) Calculated on current gross passing income, subject to review
All statistics incorporate CMW’s 50% ownership of Northpoint
Lease Expiry Profile % Gross Income
NSW: 22%
QLD: 30%
ACT: 39%
TAS: 9%
NSW: 13%
QLD: 39%
ACT: 48%
NSW: 49%
QLD: 27%
ACT: 24%
NSW: 18%
QLD: 27%
VIC: 1%
ACT: 54%
8.0% 7.5%
12.6%
7.3% 7.8%
56.8%
0%
10%
20%
30%
40%
50%
60%
Vacant FY17 FY18 FY19 FY20 Thereafter
NSW: 29%
QLD: 70%
VIC: 1%
NSW: 63%
QLD: 21%
VIC: 15%
ACT: 1%
2
1
1
For
per
sona
l use
onl
y

CMW – 1H17 Results 11
Property Portfolio – Leasing Success In Key Assets
65,000 sqm leased in six months to 31 December 2016
NSW and VIC office assets are >98% leased bar Northpoint which is
under development. Northpoint has seen c5,000 sqm of recent lease
transactions and once completed will benefit from low local vacancy
rates and removal of office stock in North Sydney
Notable lease renewals include;
18,524 sqm to Therapeutic Goods Administration at TGA Complex
15,414 sqm to Bureau of Meteorology at 700 Collins Street
9,474 sqm to QUT at 88 Musk Avenue, Kelvin Grove
1,642 sqm to Verizon at 243 Northbourne Avenue, Canberra
Notable New Leases;
2,682 sqm to Open Universities Australia at 700 Collins Street
2,423 sqm to Pacific Hydro at 700 Collins Street
1,436 sqm to Logicamms at 200 Mary Street
961 sqm to AG Coombes at HQ North
Additional 923 sqm to Ventia at 475 Victoria Avenue, Chatswood
700 Collins St, Melbourne
88 Musk Avenue, Kelvin Grove
HQ North, Fortitude Valley
243 Northbourne Ave, Canberra
For
per
sona
l use
onl
y

CMW – 1H17 Results 12
Property Portfolio – Future Lease Expiries
Lease Expiries representing >1% income (FY17-FY19)
Property Tenant Area (sqm) Expiry Date% of Total Portfolio
Rental Income
FY17
Health House * The State of Queensland Department of Public Works 13,326 30-Jun-17 2.68%
FY18
Tuggeranong Office Park ** Commonwealth of Aust. Dept of FaHCSIA 30,757 31-Aug-17 5.58%
Forestry House * The State of Queensland Department of Public Works 13,387 30-Nov-17 3.28%
Lovett Tower Department of Prime Minister and Cabinet 7,048 30-Jun-18 1.32%
FY19
19 National Circuit Commonwealth of Australia 7,073 22-Sep-18 1.85%
* Development application lodged for redevelopment of Health House and Forestry House to student accommodation
** 15 year lease signed for new building, currently under construction on the existing site with an NLA of over 30,000 sqmFor
per
sona
l use
onl
y

CMW – 1H17 Results 13
Property Portfolio – $300 Million Invested For Future
Tuggeranong Office Park, ACT
Building topped out. Integrated fitout to commence in March
Federal Government signed on 15 year lease over 30,000+ sqm
and is expected to move in final quarter of 2017
5 star Green Star rating and a 4.5 NABERS energy rating, and will
be Canberra’s biggest LED lighting-only office development
Northpoint Tower, North Sydney
Demolition near completion, construction of retail, hotel and other
amenities underway, due for completion in 2018
Woolworths, Medical Centre secured, other negotiations underway
Approx 5,000 sqm of lease transactions at Northpoint completed as
withdrawal of stock for residential, Metro and low vacancy rates
drive tenant demand
Tuggeranong Aerial August 2016
Northpoint – Artist Impression Retail Tenancies
For
per
sona
l use
onl
y

SECTION 3
Funds Management
For
per
sona
l use
onl
y

CMW – 1H17 Results 15
Funds Management - High Levels of Trading Activity
1) Includes 45% of Phoenix Portfolios AUM, 50% of Oyster Group AUM and 100% of Valad Europe
as at their respective exchange rates on 31 December 2016
Operating Profit of $16.4 million ($18.5 million 1H16)
Wholesale Funds operating profit of $9.8 million ($10.7
million 1H16)
Retail Funds operating profit of $6.0 million ($8.8 million
1H16)
Internal Funds operating profit of $0.6 million (loss of
$1.0 million 1H16)
$5.9 million of distributions received from 9.83% stake in
Investa (ASX:IOF) acquired in April 2016.
Total AUM reduced 5% to $9.8 billion ($10.3 billion FY16)
primarily due to substantial trading activity in Europe
€1.8 billion of assets were sold and €1.4 billion acquired
Wholesale Funds AUM of $5.2 billion ($5.6 billion FY16)
Retail Funds AUM of $1.7 billion ($1.7 billion FY16)
Internal AUM of $2.9 billion ($3.0 billion FY16)
Change in AUM ($bn)1
€3.2bn
€1.8bn
€1.4bn
Traded
Sold
Acquired
Trading Update ($bn)1
For
per
sona
l use
onl
y

CMW – 1H17 Results 16
Funds Management – Statement on IOF
During the presentation of Investa Office Fund’s (IOF) HY17 results yesterday, a number of matters were raised regarding
Cromwell’s written proposal to IOF in November and its interest in pursuing a transaction with IOF.
Investa Listed Funds Management Limited (ILFML) says Cromwell’s proposed CA and standstill arrangements are not market
standard, however the standstill arrangements proposed by Cromwell are consistent with those agreed between IOF and Dexus
in 2015.
Despite IOF’s assertion that there has been no correspondence since its 3 February 2017 announcement, there has been
continual correspondence and communication in relation to this matter between the advisors to Cromwell and IOF (albeit not the
Independent Directors) up until the week ending 17 February 2017.
As announced on 20 February 2017, Cromwell sees value for IOF at a range of $4.45 per IOF security up to $4.75 per IOF
security.
Cromwell has recently been granted FIRB approval to acquire stapled securities in IOF greater than the 10% threshold proscribed
under the Foreign Acquisitions and Takeover Act.
Cromwell remains open to continuing discussions with ILFML and its advisors with a view to putting forward an increased cash
offer to all IOF securityholders.
For
per
sona
l use
onl
y

CMW – 1H17 Results 17
Wholesale Funds – Connecting Capital to Opportunity
Focus on broadening investor base for European business to include a
better cyclical balance between Private Equity and LP relationships
Substantial projected near term closed ended fund maturities provides an
opportunity to acquire / transition assets from committed sellers
Activity in half included:
Cromwell European Cities Income Fund launched and acquired three
Dutch assets as part of a €205 million core seed portfolio
Acquired the €120 million Omega portfolio in Finland with Goldman Sachs.
The portfolio comprises 22 properties, 109,000 sqm of space across 13
office buildings, five industrial buildings and four retail premises
Czech Republic – Planning consent was granted to expand the Galerie
Butovice shopping centre in Prague by 15,000 sqm to 51,000 sqm
Poland – Signed contracts with Goldman Sachs on the acquisition of the
42,000 sqm Prosta & Trinity (CEE) office assets for €81 million
Scotland – Acquired the 150,000 sq ft Clyde Retail Park, in Glasgow
Poland – The €65 million expansion and redevelopment of the Janki
Shopping Centre in Warsaw will add 21,000 sqm of space and 74 units
Pallaswiesenstrasse 100, Darmstadt, Germany
Galerie Butovice, Prague
Kaisaniemenkatu, Helsinki
Central Plaza, Rotterdam
For
per
sona
l use
onl
y

CMW – 1H17 Results 18
Retail Funds – Strong Result As Cycle Peaks
Operating profit of $6.0 million (1H16 $8.8 million)
Unitholders in Cromwell’s unlisted fund, the Cromwell
Riverpark Trust voted overwhelmingly in favour to extend
the Trust term for a further five years in July resulting in a
performance fee of $4.1 million
Cromwell Direct Property Fund remains well capitalised with
low gearing, ready to take advantage of market
opportunities as they arise
Cromwell Phoenix Opportunities Fund has generated 5-year
annualised performance of 20.2% net after fees as at
December 2016. Soft close of fund likely by 30 June 2017
64 Allara Street, ACT
Cromwell Direct Property Fund PDS
Energex House – Cromwell Riverpark TrustCromwell Phoenix
Opportunities Fund
For
per
sona
l use
onl
y

CMW – 1H17 Results 19
Retail Funds - Continued Strong Growth in New Zealand
AUM at Oyster Group grew to NZD $977 million (30% growth in calendar year)
Ongoing wholesale offer for the NZD $210 million, 43,500 sqm Millennium
Centre
Oyster Direct Property Fund reopened providing investors with exposure to
over NZD $240 million of commercial property assets
Tauranga Crossing Shopping Centre Development (first stage) opened in
September
Cider Building syndication with offer of 50 interests of NZD $1 million each
closed oversubscribed in July
Additionally a range of assets were sold on behalf of investors including 12
Foreman Road, Hamilton and 131 Lincoln Road, Auckland
Cider Building, Ponsonby Auckland
Tauranga Crossing 2, Tauranga
Millennium Centre, Auckland
For
per
sona
l use
onl
y

SECTION 4
Capital Management
For
per
sona
l use
onl
y
CMW – 1H17 Results 21
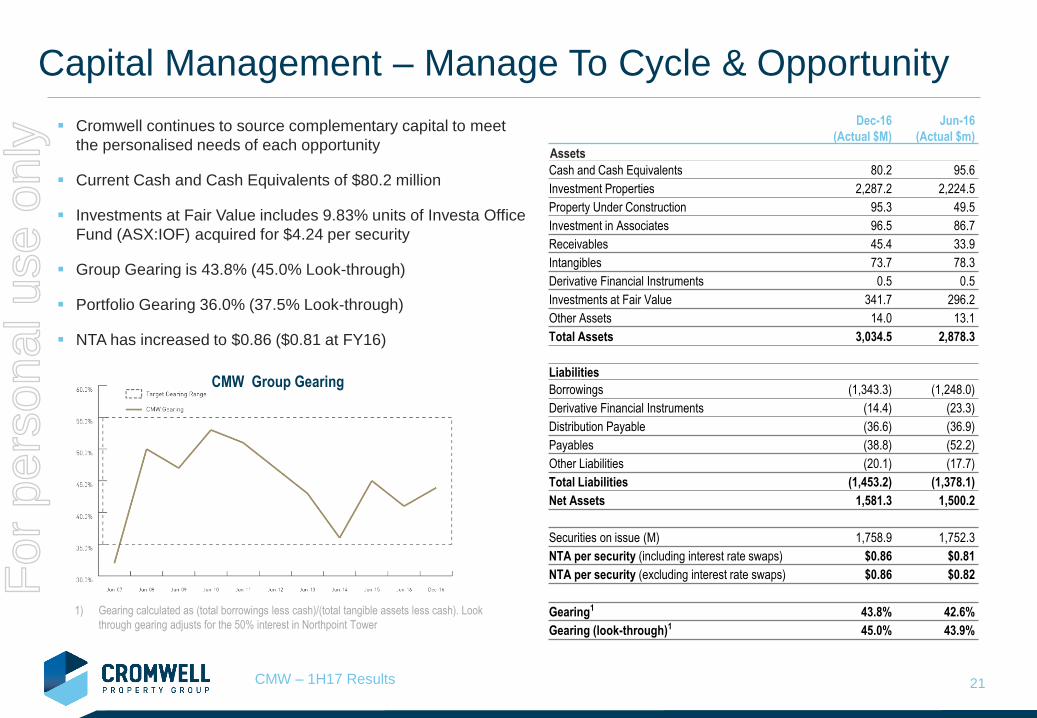
Capital Management – Manage To Cycle & Opportunity
Cromwell continues to source complementary capital to meet
the personalised needs of each opportunity
Current Cash and Cash Equivalents of $80.2 million
Investments at Fair Value includes 9.83% units of Investa Office
Fund (ASX:IOF) acquired for $4.24 per security
Group Gearing is 43.8% (45.0% Look-through)
Portfolio Gearing 36.0% (37.5% Look-through)
NTA has increased to $0.86 ($0.81 at FY16)
Dec-16
(Actual $M)
Jun-16
(Actual $m)
Assets
Cash and Cash Equivalents 80.2 95.6
Investment Properties 2,287.2 2,224.5
Property Under Construction 95.3 49.5
Investment in Associates 96.5 86.7
Receivables 45.4 33.9
Intangibles 73.7 78.3
Derivative Financial Instruments 0.5 0.5
Investments at Fair Value 341.7 296.2
Other Assets 14.0 13.1
Total Assets 3,034.5 2,878.3
Liabilities
Borrowings (1,343.3) (1,248.0)
Derivative Financial Instruments (14.4) (23.3)
Distribution Payable (36.6) (36.9)
Payables (38.8) (52.2)
Other Liabilities (20.1) (17.7)
Total Liabilities (1,453.2) (1,378.1)
Net Assets 1,581.3 1,500.2
Securities on issue (M) 1,758.9 1,752.3
NTA per security (including interest rate swaps) $0.86 $0.81
NTA per security (excluding interest rate swaps) $0.86 $0.82
Gearing1 43.8% 42.6%
Gearing (look-through)1 45.0% 43.9%
1) Gearing calculated as (total borrowings less cash)/(total tangible assets less cash). Look
through gearing adjusts for the 50% interest in Northpoint Tower
CMW Group Gearing
For
per
sona
l use
onl
y

CMW – 1H17 Results 22
Capital Management –Diversified Debt Profile1
1) Includes 50% of Northpoint Debt
Facilities diversified across eight lenders + CB issue with varying maturity dates
Initial engagement with foreign and domestic capital markets investors sees strong appetite for longer tenor lending
Weighted average debt expiry of 3.2 years with 79% not expiring until FY20 and beyond
Moody’s Investors Service continues to assign a Baa3 Issuer Rating for the Group and a stronger Baa2 for the secured debt platform
Key Terms of Convertible Bond
Offer Size €150 million
RankingSenior, unsecured, subordinated to
Cromwell’s secured bank facilities
Term Five years from February 2015
Coupon2.0% per annum payable semi-
annually in arrears
Conversion Price A$1.1503
Reference PriceA$1.07 (the closing price on January
23, 2015)
Anti-dilution
ProtectionStandard provisions
Dividend
Protection
Terms allow for payment of
Cromwell’s FY15 distribution, grown
by 3% during the life of the bond
FY 2017 FY 2018 FY 2019 FY 2020 FY 2021
Australian Major Banks $ 0.0 M $ 50.0 M $ 112.1 M $ 305.3 M $ 347.0 M
International Banks $ 0.0 M $ 123.2 M $ 18.0 M $ 34.8 M $ 225.6 M
Convertible Bond $ 0.0 M $ 0.0 M $ 0.0 M $ 218.3 M $ 0.0 M
$ 0 M
$ 100 M
$ 200 M
$ 300 M
$ 400 M
$ 500 M
$ 600 M
$ 700 M
Debt
Bala
nce (
$M
)
CMW Debt Expiry Profile
For
per
sona
l use
onl
y

CMW – 1H17 Results 23
Capital Management – Interest Rate Hedging
Accreting interest rate cap entered into in August 2014 will cover $1bn by December 2017
Cap allows Cromwell to benefit when variable interest rates are below 3.39%
Existing swaps remain in place and will be replaced by the interest rate cap as they expire
The average interest rate for the Group was 4.03% as at 31 December 2016 down from 5.27% for the year ending 30 June 2016
$ 0.0 M
$ 200.0 M
$ 400.0 M
$ 600.0 M
$ 800.0 M
$ 1,000.0 M
$ 1,200.0 M
$ 1,400.0 M
$ 1,600.0 M
$ 1,800.0 M
Dec-2016 Apr-2017 Aug-2017 Dec-2017 Apr-2018 Aug-2018 Dec-2018 Apr-2019 Aug-2019 Dec-2019
CMW Hedging Profile
TOTAL DEBT (Look Through) Total hedged Fixed through convertible bond
For
per
sona
l use
onl
y

SECTION 5
Outlook
For
per
sona
l use
onl
y

CMW – 1H17 Results 25
Australian economic growth is moderate due to end of mining
investment boom and forecast fall in residential construction
Falling A$ has provided a cushion by boosting tourism,
education, exports, currency sensitive industries
Business and consumer confidence remains subdued,
household consumption weak, inflation under target. Rates
likely to stay low as the economy remains in transition.
Capital values may compress a little further due to offshore
demand. Yields are at GFC lows but spread to 10 year bonds
still 300 to 400 bps (depending on sector).
Bond rates have increased to 2.76%. Further expected rises
will impact values. To be offset by rental growth when and
where it occurs. The key will be the extent to which one offsets
the other.
CBD Office vacancy rates are forecast to drop below 5% in
SYD driving strong net effective rental growth but remain high
elsewhere particularly in mining states (PER 20%+, BNE 15%)
Outlook – Economy Transitioning, Property Demand High
Source: NAB/JLL. As at 30 June 2016
-170,000
-120,000
-70,000
-20,000
30,000
80,000
130,000
180,000
230,000
280,000
-30
-20
-10
0
10
20
30
40
50
Ju
n-0
5
Ju
n-0
6
Ju
n-0
7
Ju
n-0
8
Ju
n-0
9
Ju
n-1
0
Ju
n-1
1
Ju
n-1
2
Ju
n-1
3
Ju
n-1
4
Ju
n-1
5
Ju
n-1
6
CBD Office Net Absorption Actual Expectations
NAB Business Conditions
Finance, Business & Property Services EmploymentSqmIndex
0
2
4
6
8
10
12
14
1/0
6/1
994
1/0
4/1
995
1/0
2/1
996
1/1
2/1
996
1/1
0/1
997
1/0
8/1
998
1/0
6/1
999
1/0
4/2
000
1/0
2/2
001
1/1
2/2
001
1/1
0/2
002
1/0
8/2
003
1/0
6/2
004
1/0
4/2
005
1/0
2/2
006
1/1
2/2
006
1/1
0/2
007
1/0
8/2
008
1/0
6/2
009
1/0
4/2
010
1/0
2/2
011
1/1
2/2
011
1/1
0/2
012
1/0
8/2
013
1/0
6/2
014
1/0
4/2
015
1/0
2/2
016
1/1
2/2
016
Sector Cap Rate Spreads to Bonds
10 Yr Bond Yield All Property Retail Office Industrial
For
per
sona
l use
onl
y

CMW – 1H17 Results 26
Outlook – Market Disruption and Economic Recovery
Brexit slowed transaction volumes and deal activity mid year
but the market corrected itself and normal trading activity
resumed by end of 2016
European transactions volumes softer in 2016, down from
peak in previous year but still above long term average
Wider market of 508 million people means little correlation
between different markets (diversification benefits)
Additional factors to consider
Spread to bond yields c325 bps and between primary
and secondary CBD office yields also attractive
Occupancy rates are stable across much of Europe
New supply has been significantly below the long-
term average for the past 5 years
2016 European Transaction Volume Retreats from Record Levels
2016F = 325bps spread
0
1
2
3
4
5
6
7Eurozone 10 year gov. bond
European Office Prime Net Yields
Source: Valad/PMA, Weighted Average Q1 2016 Low Bond Yield/Low Growth Scenario
European Office Prime Net Yield vs. Eurozone 10-Year Government
Bond Yield (%)
Source: Real Capital Analytics
For
per
sona
l use
onl
y
CMW – 1H17 Results 27
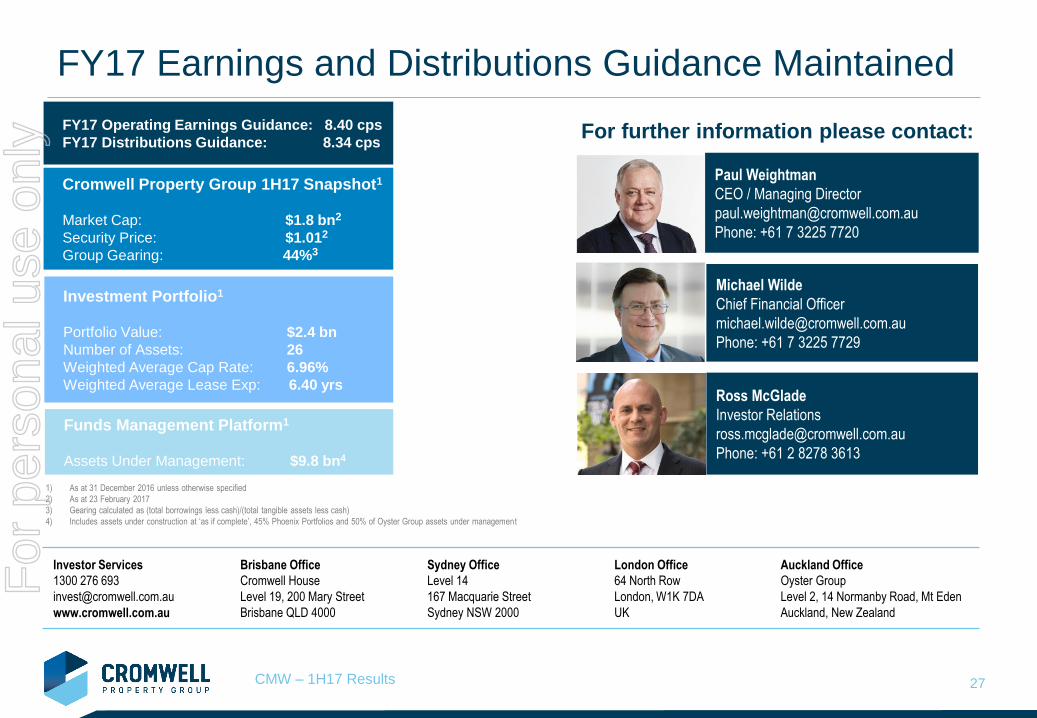
Ross McGlade
Investor Relations
Phone: +61 2 8278 3613
FY17 Earnings and Distributions Guidance Maintained
Paul Weightman
CEO / Managing Director
Phone: +61 7 3225 7720
Investor Services
1300 276 693
www.cromwell.com.au
Brisbane Office
Cromwell House
Level 19, 200 Mary Street
Brisbane QLD 4000
Sydney Office
Level 14
167 Macquarie Street
Sydney NSW 2000
London Office
64 North Row
London, W1K 7DA
UK
Auckland Office
Oyster Group
Level 2, 14 Normanby Road, Mt Eden
Auckland, New Zealand
Michael Wilde
Chief Financial Officer
Phone: +61 7 3225 7729
Cromwell Property Group 1H17 Snapshot1
Market Cap: $1.8 bn2
Security Price: $1.012
Group Gearing: 44%3
Investment Portfolio1
Portfolio Value: $2.4 bn
Number of Assets: 26
Weighted Average Cap Rate: 6.96%
Weighted Average Lease Exp: 6.40 yrs
Funds Management Platform1
Assets Under Management: $9.8 bn4
1) As at 31 December 2016 unless otherwise specified
2) As at 23 February 2017
3) Gearing calculated as (total borrowings less cash)/(total tangible assets less cash)
4) Includes assets under construction at ‘as if complete’, 45% Phoenix Portfolios and 50% of Oyster Group assets under management
For further information please contact: FY17 Operating Earnings Guidance: 8.40 cps
FY17 Distributions Guidance: 8.34 cps
For
per
sona
l use
onl
y

APPENDICES
Additional Information
For
per
sona
l use
onl
y

CMW – 1H17 Results 29
Appendices - Contents
1H17 Operating and Statutory Profit – By Segment 30
1H17 Operating and Statutory Profit – Reconciliation 31
Segment Result – Operating Earnings Detail 32
Property Portfolio – Top 10 Assets 33
Property Portfolio – Top 20 Leases 34
Property Portfolio – Net Property Income 35, 36
Property Portfolio – Movement in Book Value 37
Property Portfolio – Debt Platform Facility Details 38
For
per
sona
l use
onl
y

CMW – 1H17 Results 30
1H17 Operating and Statutory Profit – By Segment
1H17 1H16 Change
Statutory profit ($M) 153.2 195.5 (22%)
Statutory profit (cents per security) 8.7 11.2 (22%)
Property Investment ($M) 62.5 70.4 (11%)
Funds Management Internal ($M) 0.6 (1.0) 160%
Funds Management Retail ($M) 6.0 8.8 (32%)
Funds Management Wholesale ($M) 9.8 10.7 (8%)
Development ($M) (0.2) (0.1) (100%)
Operating profit ($M) 78.7 88.8 (11%)
Operating profit (cents per security) 4.5 5.1 (12%)
Distributions ($M) 73.2 69.6 5%
Distributions (cents per security) 4.2 4.0 5%
Payout ratio (%) 93% 78% 19%For
per
sona
l use
onl
y
CMW – 1H17 Results 31
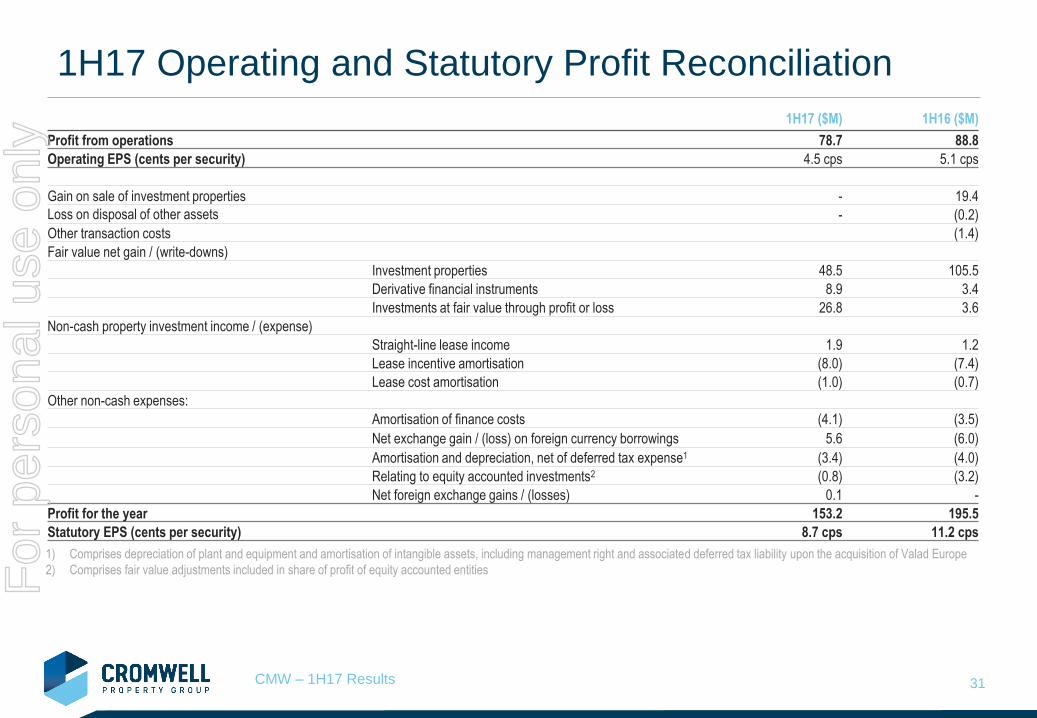
1H17 Operating and Statutory Profit Reconciliation
1H17 ($M) 1H16 ($M)
Profit from operations 78.7 88.8
Operating EPS (cents per security) 4.5 cps 5.1 cps
Gain on sale of investment properties - 19.4
Loss on disposal of other assets - (0.2)
Other transaction costs (1.4)
Fair value net gain / (write-downs)
Investment properties 48.5 105.5
Derivative financial instruments 8.9 3.4
Investments at fair value through profit or loss 26.8 3.6
Non-cash property investment income / (expense)
Straight-line lease income 1.9 1.2
Lease incentive amortisation (8.0) (7.4)
Lease cost amortisation (1.0) (0.7)
Other non-cash expenses:
Amortisation of finance costs (4.1) (3.5)
Net exchange gain / (loss) on foreign currency borrowings 5.6 (6.0)
Amortisation and depreciation, net of deferred tax expense1 (3.4) (4.0)
Relating to equity accounted investments2 (0.8) (3.2)
Net foreign exchange gains / (losses) 0.1 -
Profit for the year 153.2 195.5
Statutory EPS (cents per security) 8.7 cps 11.2 cps
1) Comprises depreciation of plant and equipment and amortisation of intangible assets, including management right and associated deferred tax liability upon the acquisition of Valad Europe
2) Comprises fair value adjustments included in share of profit of equity accounted entitiesFor
per
sona
l use
onl
y

CMW – 1H17 Results 32
Segment Result – Operating Earnings Detail1
1) Excludes certain non operating items. Refer to statutory accounts for complete segment result.
Half Year ending 31 December 2016 (in $M)Property
Investment
Property /
Funds Mgt Internal
Funds Management
External Retail
Funds Management
External Wholesale
Property
Development HY Dec-16
Segment revenue
Sales to external customers 106.2 3.6 8.2 38.3 - 156.3
Sales - intersegmental 0.5 9.3 - - - 9.8
Operating profits of equity accounted entities 2.2 - 0.5 0.6 - 3.3
Distributions - 5.9 0.1 1.0 - 7.0
Interest 0.3 0.3 0.1 0.1 - 0.8
Other income - 0.1 - - - 0.1
Total segment revenue and other income 109.2 19.2 8.9 40.0 - 177.3
Segment expenses
Property outgoings, rates and taxes (16.3) - - - - (16.3)
Property Development cost - - - - (0.2) (0.2)
Intersegmental costs (9.3) (0.5) - - - (9.8)
Funds management costs - - (1.5) - - (1.5)
Employee benefits expense - (11.9) (0.8) (16.9) - (29.6)
Finance costs (20.8) (2.4) - (2.2) - (25.4)
Administration and overhead costs (0.3) (3.8) (0.3) (8.1) - (12.5)
Total segment expenses (46.7) (18.6) (2.6) (27.2) (0.2) (95.3)
Tax expense - - (0.3) (3.0) - (3.3)
Segment result for the year 62.5 0.6 6.0 9.8 (0.2) 78.7
Segment contribution to operating profit 79% 1% 8% 12% 0% 100%
Weighted Average Securities on Issue (M) 1,755.0 For
per
sona
l use
onl
y

CMW – 1H17 Results 33
Property Portfolio – Top 10 Assets
Asset State Class Book Value Cap Rate Occupancy WALE Major Tenants
Qantas HQ NSW Office 450,900,000 5.50% 100.00% 14.7 years Qantas
700 Collins Street VIC Office 240,000,000 5.88% 99.72% 8.8 years Bureau of Meteorology, Metro Trains
Kent Street, Sydney NSW Office 240,000,000 6.25% 98.78% 3.7 years Symantec, Sydney Ports, HLB Mann Judd
HQ North Tower QLD Office 213,000,000 7.50% 98.38% 4.0 years AECOM, Bechtel, Technology One
McKell Building NSW Office 210,000,000 5.57% 100.00% 11.5 years NSW State Government
Victoria Avenue NSW Office 194,500,000 6.75% 96.27% 3.7 years Reed Elsevier, Leighton Contractors
Miller Street, North Sydney1 NSW Office 134,711,827 7.75% 76.45% 2.6 years Secure Parking Pty Ltd, Griffith Hack Lawyers
Tuggeranong Office Park ACT Office 116,120,000 10.50% 100.00% 0.7 years Federal Government
Bundall Corporate Centre QLD Office 86,500,000 8.50% 90.40% 3.5 years Wyndham Resorts, Corporate Executive Offices
Musk Avenue, Kelvin Grove QLD Office 77,500,000 7.25% 84.80% 5.0 years QUT
Total Top 10 Assets 1,963,231,827 6.64% 96.20% 7.04 years
Balance of Portfolio 458,680,000 8.44% 83.1% 4.5 years
Total2 2,421,911,827 6.96% 92.30% 6.4 years
1) Represents Cromwell’s 50% interest
2) Total excludes balance of property under construction
For
per
sona
l use
onl
y

CMW – 1H17 Results 34
Property Portfolio – Top 20 Leases
Tenant Tenant Classification Expiry Date % of Portfolio Rental Income
Qantas Airways Limited Listed Company/Subsidiary Dec-32 14.3%
Government Property NSW Government Authority Jun-28 7.7%
Commonwealth of Aust. Dept of FaHCSIA Government Authority Aug-17 5.6%
AECOM Australia Pty Ltd Listed Company/Subsidiary Apr-20 4.9%
Bureau of Meteorology Government Authority Jul-26 4.5%
Therapeutic Goods Administration Government Authority Jun-22 3.7%
The State of Queensland Department of Public Works Government Authority Nov-17 3.3%
Metro Trains Melbourne Pty Ltd Private Company Feb-25 2.7%
The State of Queensland Department of Public Works Government Authority Jun-17 2.7%
QLD University of Technology Government Authority Nov-21 2.5%
Technology One Limited Listed Company/Subsidiary Apr-21 2.4%
Symantec (Australia) Pty Ltd Listed Company/Subsidiary Jul-21 2.3%
Reed Elsevier Australia Pty Limited Listed Company/Subsidiary Dec-20 2.1%
Government Property NSW Government Authority Jun-28 2.0%
Commonwealth of Australia Government Authority Sep-18 1.8%
Government Property NSW Government Authority Jun-28 1.8%
Government Property NSW Government Authority Jun-28 1.7%
Government Property NSW Government Authority Jun-28 1.4%
Wyndham Vacation Resorts Asia Pacific Pty Ltd Listed Company/Subsidiary Jun-21 1.4%
Department of Prime Minister and Cabinet Government Authority Jun-18 1.3%
70.1%For
per
sona
l use
onl
y

CMW – 1H17 Results 35
Property Portfolio – Net Property Income1
1) Includes only properties held for all of 1H16 and 1H17. Northpoint is equity accounted and therefore excluded from above analysis
1HY17 ($) 1HY16 ($) Variance ($) Variance (%) Comments
Bundall Corporate Centre 3,895,466 2,995,649 899,817 30.0% 6 new lease deals and renewals signed in CY16
Victoria Avenue 7,456,438 6,288,906 1,167,532 18.6% 13 new lease deals and renewals signed in CY16
700 Collins Street 6,821,367 5,879,690 941,677 16.0% New leasing to Metro trains, BoM Renewal
Kent Street 6,957,892 6,695,081 262,811 3.9%
HQ North Tower 8,455,278 8,145,212 310,066 3.8%
Qantas HQ 13,379,424 12,936,808 442,616 3.4%
19 National Circuit 1,549,526 1,514,423 35,103 2.3%
Crown Street, Wollongong 1,328,052 1,299,031 29,021 2.2%
Station Street, Penrith 1,141,252 1,136,822 4,430 0.4%
Musk Avenue, Kelvin Grove 4,189,807 4,174,427 15,380 0.4%
Bull Street, Newcastle 724,252 734,250 (9,998) (1.4%)
Farrer Place, Queanbeyan 939,837 955,362 (15,525) (1.6%)
McKell Building 5,367,356 5,477,153 (109,797) (2.0%)
Forestry House 3,248,473 3,315,197 (66,724) (2.0%)
Health House 2,659,828 2,808,593 (148,765) (5.3%) Lease extension at a reduced rental
Tuggeranong Office Park 9,828,823 10,404,261 (575,438) (5.5%) Changed to holdover lease in Dec-16
Oracle Building 1,399,113 1,535,185 (136,072) (8.9%) Contraction of existing tenant Chandler MacLeod
TGA Complex 3,453,238 4,247,771 (794,533) (18.7%) Expiry of TGA Fitout rental (5 yr option renewal since taken up)
Cromwell House 2,586,627 3,190,696 (604,069) (18.9%) Expiry of QER, 10 new lease deals and renewals signed in CY16
Lovett Tower 674,759 3,836,339 (3,161,580) (82.4%) Expiry of major tenant DVA
Vodafone (138,314) 3,641,130 (3,779,444) (103.8%) Expiry of major tenant Vodafone
Office Total 85,918,495 91,211,987 (5,293,492) (5.8%)For
per
sona
l use
onl
y

CMW – 1H17 Results 36
Property Portfolio – Net Property Income1
1HY17 ($) 1HY16 ($) Variance ($) Variance (%) Comments
Village Cinema Geelong 629,033 619,640 9,393 1.5%
Regent Cinema Centre 657,382 662,270 (4,888) (0.7%)
Retail Total 1,286,415 1,281,910 4,505 0.4%
TOTAL HELD PROPERTIES 87,204,910 92,493,897 (5,288,987) (5.7%)
Henry Waymouth Centre - 2,197,265 (2,197,265) (100.0%) Asset sold Dec-15
Terrace Office Park, Bowen Hills - 554,038 (554,038) (100.0%) Asset sold Sep-15
Bligh Street, Sydney - 569,521 (569,521) (100.0%) Asset sold Aug-15
Bridge Street, Hurstville - (3,885) 3,885 (100.0%) Asset sold Jul-15
Sold Assets Total - 3,316,939 (3,316,939) (100.0%)
Borrowdale House 1,628 30,278 (28,651) (94.6%)
Sturton Rd, Edinburgh Park (29,325) (49,412) 20,087 (40.7%)
Car Parking / Mary St Hub 22,616 (55,677) 78,293 (140.6%)
Consolidation adjustments / eliminations 2,751,681 2,852,169
Other Total 2,746,599 2,777,359 (30,760) (1.1%)
TOTAL NET PROPERTY INCOME 89,951,509 98,588,196 (8,636,686) (8.8%)
1) Includes only properties held for all of 1H16 and 1H17. Northpoint is equity accounted and therefore excluded from above analysis
For
per
sona
l use
onl
y

CMW – 1H17 Results 37
Property Portfolio – Movement In Book Value
Portfolio continuously improved through acquisitions since 2010
Frequent re-cycling of capital means disposing of assets before asset has large capex requirements
In-sourced facilities management model also lowers lifecycle capex
Average Lifecycle Capex as a percentage of average assets of 0.23% of valuation over past seven years
1HY17
($M)
FY16
($M)
FY15
($M)
FY14
($M)
FY13
($M)
FY12
($M)
FY11
($M)
FY10
($M)
Opening balance 2,274.0 2,101.0 2,249.5 2,396.0 1,724.4 1,444.9 1,064.1 1,117.2
Acquisitions - - 8.0 - 661.3 263.4 322.4 -
Construction Costs 41.5 47.2 - - - - - -
Property Improvements 6.5 2.1 16.5 44.5 76.3 50.2 40.4 1.3
Lifecycle Capex 2.0 2.6 6.8 6.8 6.3 2.6 3.0 2.2
Disposals - (150.9) (205.8) (250.0) (42.4) (39.3) (33.7) (22.1)
Transferred to held for sale - - (36.6) - - - - -
Straight Lining of Rental Income 1.9 2.3 5.5 5.6 6.0 6.9 4.9 0.9
Lease costs and incentives 17.1 21.7 37.7 11.9 29.3 15.8 15.9 2.2
Amortisation of leasing costs and incentives (9.0) (15.2) (13.0) (11.6) (9.5) (7.7) (5.8) (5.4)
Net gain/(loss) from fair value adjustments 48.5 263.2 32.4 46.3 (55.7) (12.4) 33.7 (32.1)
Balance 2,382.5 2,274.0 2,101.0 2,249.5 2,396.0 1,724.4 1,444.9 1,064.1
Lifecycle Capex as a % on average assets 0.09% 0.12% 0.31% 0.29% 0.31% 0.16% 0.24% 0.20%For
per
sona
l use
onl
y

CMW – 1H17 Results 38
Property Portfolio - Debt Platform Facility Details
Look through calculations incorporate 50% of Northpoint debt
1) Based on "As Complete" valuation for new build / "Vacant Possession" valuation for existing building
2) Based on "As If Complete" valuation of the site
Facility Amount Maturity
Date
Fin Yr
Expiry
Years
Remaining Covenants
Bank 1 - 5 Year Facility 123,500,000 Mar-2021 2021 4.2 yrs
Bank 2 - 5 Year Facility 100,000,000 Mar-2021 2021 4.2 yrs
Bank 3 - 5 Year Facility 123,500,000 Jan-2021 2021 4.1 yrs
Bank 4 - 5 Year Facility 105,630,520 Mar-2021 2021 4.2 yrs
Bank 5 - 5 Year Facility 18,017,664 May-2019 2019 2.4 yrs
Bank 6 - 5 Year Facility 120,000,000 Mar-2021 2021 4.2 yrs
Bank 1 - 4 Year Facility 85,225,908 Mar-2020 2020 3.2 yrs
Bank 2 - 4 Year Facility 100,000,000 Mar-2020 2020 3.2 yrs
Bank 3 - 4 Year Facility 85,225,908 Jan-2020 2020 3.1 yrs
Bank 1 - 1.5 Year Facility 50,000,000 Jun-2018 2018 1.4 yrs
Syndicated Debt Platform 911,100,000 3.7 yrs
Bank 7 - Term Facility 32,722,222 Jul-2018 2019 1.6 yrs
Bank 7 - Construction Facility 79,404,005 Jul-2018 2019 1.6 yrs
Convertible Bond 218,277,000 Feb-2020 2020 3.1 yrs
Bank 8 - Bank Facility 123,169,908 Jan-2018 2018 1.1 yrs Group LTV 52.5%; Group cash $20M
CMW TOTAL 1,364,673,135 3.2 yrs
Bank 1 - Term Facility 34,835,813 Dec-2019 2020 2.9 yrs
Bank 4 - Term Facility 34,835,813 Dec-2019 2020 2.9 yrs
CMW TOTAL - LOOK THROUGH BASIS 1,434,344,760 3.2 yrs
LVR 60%
ICR 2.0 x
WALE 3.0 yrs
LVR 75% 1
LVR 55%2; ICR 1.5 x
For
per
sona
l use
onl
y

CMW – 1H17 Results 39
For
per
sona
l use
onl
y