1q13 earnings release - · pdf file3 performance net revenue in 1q13, braskem’s...
TRANSCRIPT
EXPAN
SIO
N
CO
MM
ITM
EN
T
EX
PA
NS
ION
FO
CU
S
\
Sales of thermoplastic resins (PE, PP, PVC) increased by 6% in 1Q13
Market share expands by 1 p.p.
HIGHLIGHTS:
Operations
In 1Q13, Brazil’s resins demand totaled 1.3 million tons, increasing by 5.6% and 5.0% from 4Q12
and 1Q12, respectively. Meanwhile, Braskem's sales amounted to 921 kton, growing by 6.2% and
8.8%, while its market share reached 71%.
The crackers operated at an average capacity utilization rate of 90%, compared to 82% in the
prior quarter, which was affected by electricity supply problems.
EBITDA in 1Q13 amounted to R$937 million, growing by 6% from the recurring EBITDA in 4Q12,
which is explained by the higher sales volume, the recovery in international spreads and the gains
in operating efficiency. In U.S. dollar, EBITDA was US$470 million.
Macroeconomic scenario
In response to the proposal submitted by the Chemical Industry Competitiveness Council, the
government approved on May 2013 a reduction in the rate of PIS and COFINS taxes on feedstock
purchases by the first- and second-generation of chemical producers.
Expansion and diversification of feedstock
Mexico Project (Ethylene XXI):
The construction of the new petrochemical complex remains on schedule and the project’s
physical completion reached 26%.
Brazil:
As part of its strategy to increase the value of its cracker streams, Braskem has already begun
the construction of the pipeline to supply propylene to the acrylic complex of Basf, scheduled to start operations in the second half of 2014.
Comperj: the basic engineering studies are on schedule and the conceptual design is expected to be concluded within the new few months.
Commitment to financial health
Receipt of the first installment of R$163 million from the divestment of the assets of the Water
Treatment Unit.
1Q13 Earnings Release

2
EXECUTIVE SUMMARY
In a still uncertain global scenario, the 1Q13 was marked by the recovery of prices and global demand for resins and basic petrochemicals, influenced by the restocking trend in Asia and the scheduled and
unscheduled maintenance shutdowns. The average price of naphtha, the main feedstock used by the petrochemical industry, remained practically stable in relation to 4Q12. Consequently, the spreads for resins1
and basic petrochemicals2 in the international market increased by 24% and 6%, respectively.
The Brazilian market followed the global trend and domestic demand for thermoplastic resins reached 1.3 million tons, growing by 5.6% from 4Q12. In line with its focus, Braskem’s sales amounted to 921 kton,
increasing by 6.2% and supporting a market share gain of 1 p.p. to 71% in 1Q13.
After the volatility in the electricity supply in the 4Q12, the Company’s industrial facilities normalized their
operations, and the average capacity utilization rate of the crackers reached 90% in the first quarter of this year.
EBITDA in 1Q13 amounted to R$937 million, growing by 6% from 4Q12 recurring EBITDA , explained by the
higher sales volume and better spreads, which followed the international market trend. In U.S. dollar, EBITDA was US$470 million.
On March 31, 2013, Braskem’s net debt stood at US$7.4 billion, 8% higher than in the end of 2012, mainly explained by the financial resources provided to the Mexico project. To date, the project has received US$619
million in financial resources, which will be reimbursed to Braskem upon the payment of the 1st installment of
the project finance, expected in June 2013. The EBITDA recovery of the last 12 months partially offset the increase in net debt, and the financial leverage measured by the net debt/EBITDA ratio increased from 3.42x
in December 2012 to 3.62x in March 2013 when measured in U.S. dollar. Excluding the financing structure of the Mexico project, the leverage in U.S. dollar stood at 3.34x, in line with the 4Q12.
The Brazilian government has responded to the uncertainties in the global economy by adopting important measures to recover part of the competitiveness of local industry, which is suffering from infrastructure,
productivity and foreign-exchange issues. On May 8th was approved a reduction in the rate of PIS (Social
Integration) and COFINS (Social contribution) tax for the acquisition of feedstock by first- and second-generation chemical producers, which are consumed by around 50 companies. The tax rate will be reduced
to 1% from 2013 to 2015 and, as of 2016, will rise gradually until 2018.
The outlook for the global scenario remains challenging, which reinforces the need for a more comprehensive
industrial policy that continues to strengthen Brazilian industry. In this context, the government is expected
to announce new measures. The tax reduction implemented by the government is essential for supporting a recovery in growth and higher capacity utilization rates in the industry, which has been operating with idle
capacity in recent years. This should improve the industry’s ability to generate profits and strengthen its capacity to invest, reversing the sector trade deficit and meeting the growing local demand.
1 65% PE (USA), 25% PP (Asia) and 10% PVC (Asia) 2 80% ethylene and propylene, 20% BTX (base Europe)

3
PERFORMANCE
Net Revenue
In 1Q13, Braskem’s consolidated net revenue was US$4.7 billion. The 4% increase from 4Q12 is mainly
explained by the higher average price and higher sales volume in the domestic market, which partially offset the lower resale volume. In Brazilian real, consolidated net revenue was R$9.3 billion, up 1% from the fourth
quarter of last year. Excluding resale volume, net revenue in 1Q13 increased by 6% in U.S. dollar and 3% in
Brazilian real.
Compared to 1Q12, consolidated net revenue in U.S. dollar increased 2%. In Brazilian real, consolidated net
revenue grew 15%, benefitting from the average U.S. dollar appreciation of 13% between the periods.
57%
22%
15%
6%
Domestic Sales Export Sales (ex-resale) United States and Europe Resale
55%
21%
16%
8%
59%20%
17%
4%
1Q12 Net Revenue 4Q12 Net Revenue 1Q13 Net Revenue
Revenue from sales to the external market was US$1.9 billion in 1Q13, stable compared to 4Q12, but down
6% from 1Q12, explained by the lower resale volume and higher resin sales in the domestic market.
Highlights by Segment
Capacity Utilization Rate
Following the operating issues at crackers in 4Q12 due to instability in the power supply, capacity utilization
rates recovered in 1Q13. The capacity utilization rates for Braskem’s main products are presented below:
93%82%
90% 87%76%
85% 90%82%
90% 90%73%
84% 88% 88% 88%
1Q12 4Q12 1Q13 1Q12 4Q12 1Q13 1Q12 4Q12 1Q13 1Q12 4Q12 1Q13 1Q12 4Q12 1Q13
* Does not consider Green Ethylene
Ethylene * Polyethylene Polypropylene PVC United States and Europe

4
Polyolefins
Brazilian market: estimated demand for Polyolefins (PE and PP) was around 994 kton in 1Q13, increasing 3% from 4Q12, driven by the restocking trend in the chain and the healthy performance of the food and
agribusiness sectors. Compared to 1Q12, estimated demand grew by 4%.
Production: production reached 1,068 kton, increasing 10% from 4Q12 due to the higher supply of feedstock.
Compared to 1Q12, production decreased by 2%.
Domestic sales: following the trend in the Brazilian market, sales amounted to 754 kton in 1Q13, 4% higher than in 4Q12, which supported a market share gain of 1 p.p. to 76%. Compared to 1Q12, sales increased
5%, reflecting the better performance of the Brazilian market and the recovery in market share.
Export sales: exports amounted to 240 kton in 1Q13, down 9% and 28% from 4Q12 and 1Q12, respectively,
which is explained by the inventory buildup for the future supply of the domestic market ahead of the scheduled shutdown and the better sales mix in the domestic market.
4
(9)
10
1Q13 x 4Q12 (%) 1Q13 x 1Q12 (%)
Export sales
Production
Domestic sales5
(28)
(2)
PE + PP
Vinyls
Brazilian market: estimated PVC demand in 1Q13 was 311 kton, or 15% higher than in 4Q12, reflecting the
chain inventory reconstruction and the better performance of the construction sector. Compared to 1Q12, domestic demand increased by 9%.
Production: PVC production in 1Q13 was 147 kton, increasing 12% from 4Q12 in response to the stronger
domestic demand. Caustic soda production amounted to 115 kton, or 6% higher than in the prior quarter. Compared to 1Q12, PVC production increased 28%, reflecting the new PVC plant in the state of Alagoas,
while caustic soda production remained practically stable.
Domestic sales: in line with the trend in domestic demand, Braskem’s PVC sales amounted to 166 kton,
increasing 16% from 4Q12, with a market share gain of 1 p.p. to 54%. Meanwhile, soda sales volume amounted to 119 ktons. Compared to 1Q12, PVC sales grew by 27%, reflecting the new PVC plant in the
state of Alagoas. Caustic soda sales grew by 5%, reflecting the stronger demand between the periods.

5
27
5
28
(1)
16
(2)
12
6
1Q13 x 4Q12 (%) 1Q13 x 1Q12 (%)
Production
Domestic sales(10)
3
(3)
(6)PVC Caustic Soda PVC Caustic Soda
Basic Petrochemicals
Ethylene production in 1Q13 was 836 kton, increasing 8% from 4Q12, supported by the recovery in the
crackers average capacity utilization rate, which were impacted in the last quarter of 2012 by interruptions in the power supply. Compared to 1Q12, production volume decreased by 4%.
Performance (tons) 1Q13 4Q12 1Q12 Change (%) Change (%)
BASIC PETROCHEMICALS (A) (B) (C) (A)/(B) (A)/(C)
Production
Ethylene 835,531 770,887 870,154 8 (4)
Propylene 372,137 341,299 377,083 9 (1)
Butadiene 100,850 95,047 78,132 6 29
BTX* 324,359 293,201 324,938 11 (0)
BTX* - Benzene, Toluene, Orthoxylene and Paraxylene
Ethylene and propylene: in 1Q13, total sales volume amounted to 226 kton, increasing 2% from 4Q12,
reflecting the scheduled shutdowns and operational problems at certain clients. Compared to 1Q12, sales volume decreased 7%, also influenced by the lower production volume.
Butadiene: sales amounted to 98 kton in 1Q13, decreasing 2% from 4Q12, but increasing 33% from 1Q12, reflecting the expansion in butadiene capacity at the plant in Triunfo, Rio Grande do Sul.
BTX: sales of Aromatics amounted to 231 kton in 1Q13, down 18% from 4Q12, reflecting the operating issues at certain clients and the market opportunities taken advantage of in 4Q12. In relation to 1Q12, sales
decreased by 7%.
Performance (tons) 1Q13 4Q12 1Q12 Change (%) Change (%)
BASIC PETROCHEMICALS (A) (B) (C) (A)/(B) (A)/(C)
Total Sales
Ethylene/Propylene 225.949 221.123 243.561 2 (7)
Butadiene 98.237 100.070 73.602 (2) 33
BTX* 230.902 281.268 247.937 (18) (7)
BTX* - Benzene, Toluene, Orthoxylene and Paraxylene
Braskem America (USA and Europe)
Market: in the United States, 1Q13 was marked by a strong increase in propylene prices, due to the lower supply in the market caused by the scheduled shutdowns at the region’s refineries, and by the 4% decrease
in regional PP demand. Meanwhile, the European market continued to be affected by the economic scenario while demand remained depressed.
Production: with an average capacity utilization rate of 87%, production volume in 1Q13 was 428 kton, or
around 3% lower than in both 4Q12 and 1Q12.

6
Sales: in 1Q13, sales volume was 431 kton, down 3% from 4Q12, reflecting the weaker demand in the U.S.
and European markets.
Performance (tons) 1Q13 4Q12 1Q12 Change (%) Change (%)
UNITED STATES AND EUROPE (A) (B) (C) (A)/(B) (A)/(C)
Sales
PP 430,872 443,571 428,042 (3) 1
Production
PP 427,757 441,978 439,216 (3) (3)
Cost of Goods Sold - COGS
Braskem's cost of goods sold (COGS) in 1Q13 was
R$8.3 billion, in line with 4Q12. The higher sales
volume of resins and basic petrochemicals in the period was partially offset by (i) the lower naphtha
resale volume and (ii) the 3% appreciation in the Brazilian real against the U.S. dollar, which generated a
gain of R$223 million.
In 1Q13, the average ARA naphtha price reference, the Company’s main feedstock, was US$945/ton, in line
with the fourth quarter of last year (US$941/ton). The three-month moving average, which is a reference for
domestic supply, was US$943/ton, up 1% from US$937/t in 4Q12. Braskem acquires around 70% of
its naphtha needs from Petrobras, with the remainder
imported directly from suppliers in North African countries, Argentina, Mexico and Venezuela.
Regarding the average gas price, between 4Q12 and 1Q13, the Mont Belvieu reference prices for ethane and propane decreased by 9% and 2% to US$26 cts/gal
(US$191/ton) and US$86 cts/gal (US$451/ton), respectively, reflecting the continued growth in the supply of
these products. The average price of USG propylene was US$1,653/ton, increasing 34% in the period, impacted by the lower product supply due to shutdowns at the region’s refineries.
Compared to 1Q12, COGS increased 11%, due to: (i) the 4% increase in the ARA naphtha price reference for the domestic market (moving average of the last three months); and (ii) the 13% U.S. dollar appreciation
(average exchange rate in periods).
Selling, General and Administrative Expenses
In 1Q13, Selling, General and Administrative (SG&A) expenses amounted to R$508 million, decreasing 9%
from the previous quarter. Compared to 1Q12, SG&A expenses increased by R$31 million or 6%.
Selling Expenses totaled R$246 million, decreasing 11% from 4Q12, when these expenses were impacted
by the payment of demurrage and freight expenses related to prior quarters. Compared to 1Q12, selling
expenses increased by 12%, due to the shift in the sales mix between the periods.
General and Administrative Expenses amounted to R$262 million in 1Q13, down 7% from the prior
quarter, explained by lower expenses with outsourced services and corporate campaigns. Compared to 1Q12,
(1) Does not include naphtha resale
Naphtha ; 45.2%
Gas as feedstock; 23.9%
Electric Energy; 2.5%
Natural Gas; 2.0%
Other Variable Costs; 11.1%
Labor; 3.1%
Services; 1.4%Others; 1.0%
Deprec / Amort; 5.6%
Freight; 4.1%
COGS 1Q13 (1)

7
general and administrative expenses increased 2%, reflecting the Company’s efforts to control its fixed costs,
despite the environment marked by inflationary pressures.
EBITDA
Braskem’s consolidated EBITDA3 in 1Q13 amounted to R$937 million or US$470 million, decreasing 33% or
31%, respectively, from 4Q12. Excluding the nonrecurring positive impact of R$516 million in the previous quarter from the sale of non-core assets, 1Q13 EBITDA increased by 6% in Brazilian real and 10% in U.S.
dollar, with EBITDA margin ex-resale of 10.4%. The main factors were (i) the higher sales volume, especially in the domestic market; (ii) the improvement in international spreads for thermoplastic resins and main basic
petrochemicals, which expanded by 24% and 6%, respectively.
Compared to the 1Q12, EBITDA increased 19% in Brazilian real and 6% in U.S. dollar. The increase was
mainly due to the higher spreads for thermoplastic resins and main basic petrochemicals in the international
market, which expanded by 24% and 32%, respectively, between the periods.
442
680
470
1Q12 4Q12 1Q13
EBITDA (US$ million)
-31%
+6%
787
1,399
937
1Q12 4Q12 1Q13
EBITDA (R$ million)
+19%
-33%
Net Financial Result
The net financial result in 1Q13 was an expense of R$107 million, compared to an expense of R$596 million in the prior quarter. The decrease is mainly explained by the Brazilian real4 appreciation through the quarter.
Since Braskem holds net exposure to the U.S. dollar (more dollar-denominated liabilities than dollar-denominated assets), any change in the exchange rate has an impact on the accounting financial result. On
March 31, 2013, this exposure was formed of: (i) in operations, by 55% of trade accounts payable, which was partially offset by 63% of accounts receivable; and (ii) in the capital structure, by 75% of net debt.
Since Braskem’s operating cash flow is heavily dollarized, maintaining this level of net exposure to the dollar
in its liabilities complies with the Company’s Financial Management Policy. Virtually 100% of its revenue is directly or indirectly pegged to the variation in the U.S. dollar exchange rate and approximately 80% of its
costs are also pegged to this currency.
3 EBITDA is defined as the net result in the period plus taxes on profit (income tax and social contribution), the financial result and
depreciation, amortization and depletion. The Company opts to present adjusted EBITDA, which excludes or adds other items from the statement of operations that help improve the information on its potential gross cash generation.
EBITDA is used by the Company’s management as a measure of performance, but does not represent cash flow for the periods presented and should not be considered a substitute for net income or an indicator of liquidity. The Company believes that in addition to serving as a measure of operating performance, EBITDA allows for comparisons with other companies. Note however that EBITDA is not a measure established in accordance with the international accounting standards (IFRS) and is presented in accordance with CVM Instruction 527 of October 4, 2012.
4The Brazilian real/U.S. dollar exchange rate was R$1.9957/US$1.00 in average.

8
It is important to note that the foreign exchange variation effect, which was positive in R$328 million in the
quarter, does not have a direct cash impact in the short term. This amount represents currency translation accounting impacts, especially on the Company’s debt, with any expenditure occurring upon the maturity of
the debt, which has a total average term of 14.2 years (down from 14.8 years). The portion of debt denominated in U.S. dollar has an average term of 19 years.
Excluding the effects of foreign exchange and monetary variation, the net financial result in 1Q13 was an
expense of R$364 million, increasing R$48 million from the expense in the previous quarter, which is mainly due to the increased financial charges resulting from the higher volume of naphtha purchased in the period,
which grew 9%. On the same basis, compared to 1Q12, the net financial result increased by R$62 million, mainly due to the change in the feedstock payment term in the domestic market to 90 days with segregation
of its financial charges, as per the accounting standard for adjustment to present value.
The following table shows the composition of Braskem's financial result.
R$ million 1Q13 4Q12 1Q12
Financial Expenses (230) (773) (192)
Interest Expenses (237) (225) (247)
Monetary Variation (MV) (73) (83) (79)
Foreign Exchange Variation (FX) 285 (275) 251
Net Interest on Fiscal Provisions (22) (46) (48)
Others (183) (144) (70)
Financial Revenue 123 177 85
Interest 28 69 58
Monetary Variation (MV) 2 11 12
Foreign Exchange Variation (FX) 43 68 11
Net Interest on Fiscal Credits 7 2 2
Others 43 27 2
Net Financial Result (107) (596) (107)
R$ million 1Q13 4Q12 1Q12
Net Financial Result (107) (596) (107)
Foreign Exchange Variation (FX) 328 (207) 263
Monetary Variation (MV) (71) (73) (67)
Net Financial Result Excluding FX and MV (364) (317) (303)
Net Income / Loss
Braskem recorded net income of R$227 million in 1Q13, which was mainly explained by the higher cash generation and lower financial expenses, which was affected by the local currency appreciation in the period.
Cash Flow
Braskem’s operating cash flow, adjusted by Financial Investments, amounted to R$228 million in the first quarter of 2013. Working capital was affected by a negative impact of R$619 million, which is mainly
explained by the R$526 million increase in Inventories due to the planning conducted for serving the domestic polyolefin market ahead of scheduled maintenance shutdowns and lower sales volumes of certain
cracker co-products. Inventories levels should normalize over the next few months.
9
R$ million 1Q13 4Q12 1Q12
Operating Cash Flow Ajusted 228 979 1,702
Interest Paid (201) (481) (140)
Income Tax and Social Contribution (8) (8) (8)
Investments (923) (975) (834)
Free Cash Flow Adjusted (904) (485) 721
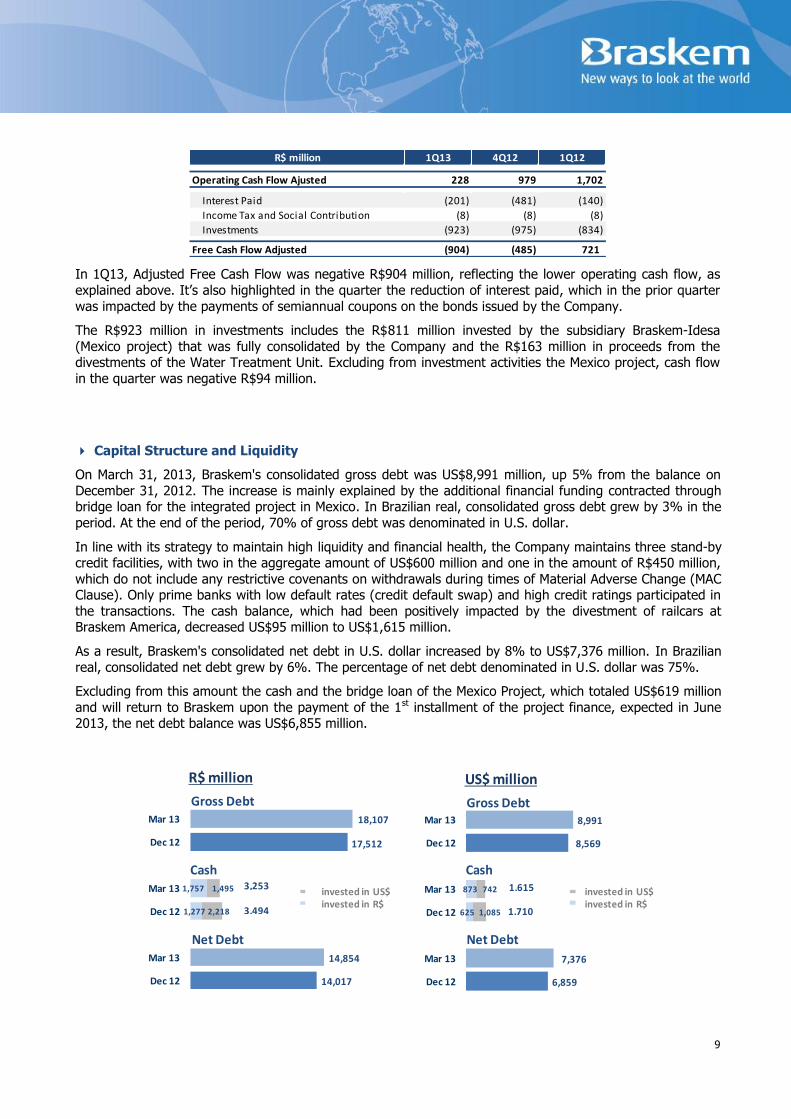
In 1Q13, Adjusted Free Cash Flow was negative R$904 million, reflecting the lower operating cash flow, as
explained above. It’s also highlighted in the quarter the reduction of interest paid, which in the prior quarter
was impacted by the payments of semiannual coupons on the bonds issued by the Company.
The R$923 million in investments includes the R$811 million invested by the subsidiary Braskem-Idesa
(Mexico project) that was fully consolidated by the Company and the R$163 million in proceeds from the divestments of the Water Treatment Unit. Excluding from investment activities the Mexico project, cash flow
in the quarter was negative R$94 million.
Capital Structure and Liquidity
On March 31, 2013, Braskem's consolidated gross debt was US$8,991 million, up 5% from the balance on
December 31, 2012. The increase is mainly explained by the additional financial funding contracted through bridge loan for the integrated project in Mexico. In Brazilian real, consolidated gross debt grew by 3% in the
period. At the end of the period, 70% of gross debt was denominated in U.S. dollar.
In line with its strategy to maintain high liquidity and financial health, the Company maintains three stand-by credit facilities, with two in the aggregate amount of US$600 million and one in the amount of R$450 million,
which do not include any restrictive covenants on withdrawals during times of Material Adverse Change (MAC Clause). Only prime banks with low default rates (credit default swap) and high credit ratings participated in
the transactions. The cash balance, which had been positively impacted by the divestment of railcars at Braskem America, decreased US$95 million to US$1,615 million.
As a result, Braskem's consolidated net debt in U.S. dollar increased by 8% to US$7,376 million. In Brazilian
real, consolidated net debt grew by 6%. The percentage of net debt denominated in U.S. dollar was 75%.
Excluding from this amount the cash and the bridge loan of the Mexico Project, which totaled US$619 million
and will return to Braskem upon the payment of the 1st installment of the project finance, expected in June 2013, the net debt balance was US$6,855 million.
14,017
14,854
1,277
1,757
17,512
18,107
2,218
1,495
Dec 12
Mar 13
Dec 12
Mar 13
Dec 12
Mar 13
6,859
7,376
625
873
8,569
8,991
1,085
742
Dec 12
Mar 13
Dec 12
Mar 13
Dec 12
Mar 13
Net Debt
Gross Debt Gross Debt
Cash Cash
Net Debt
R$ million US$ million
3,253
3,494
1,615
1,710
invested in US$invested in R$
invested in US$invested in R$
10
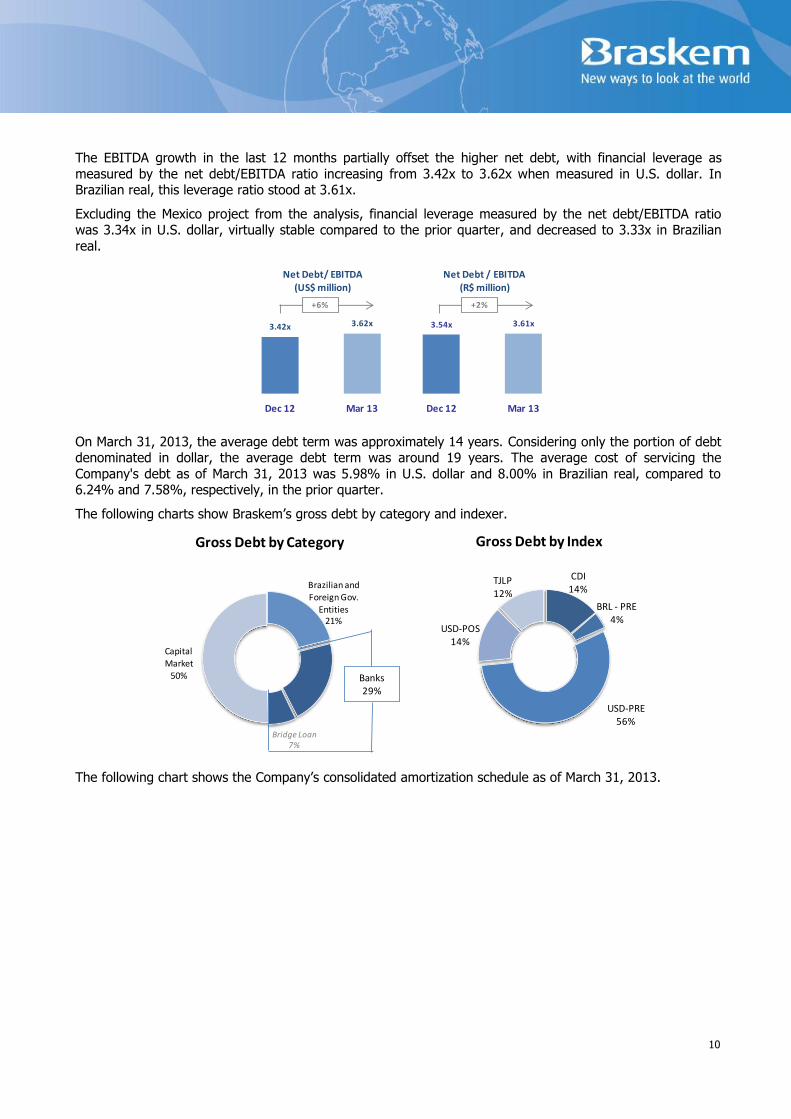
The EBITDA growth in the last 12 months partially offset the higher net debt, with financial leverage as
measured by the net debt/EBITDA ratio increasing from 3.42x to 3.62x when measured in U.S. dollar. In Brazilian real, this leverage ratio stood at 3.61x.
Excluding the Mexico project from the analysis, financial leverage measured by the net debt/EBITDA ratio was 3.34x in U.S. dollar, virtually stable compared to the prior quarter, and decreased to 3.33x in Brazilian
real.
3.42x 3.62x
Dec 12 Mar 13
Net Debt/ EBITDA(US$ million)
+6%
3.54x 3.61x
Dec 12 Mar 13
Net Debt / EBITDA(R$ million)
+2%
On March 31, 2013, the average debt term was approximately 14 years. Considering only the portion of debt denominated in dollar, the average debt term was around 19 years. The average cost of servicing the
Company's debt as of March 31, 2013 was 5.98% in U.S. dollar and 8.00% in Brazilian real, compared to 6.24% and 7.58%, respectively, in the prior quarter.
The following charts show Braskem’s gross debt by category and indexer.
Brazilian and Foreign Gov.
Entities21%
Capital Market
50%
Gross Debt by Category
CDI14%
BRL - PRE4%
USD-PRE56%
USD-POS14%
TJLP12%
Gross Debt by Index
Bridge Loan7%
Banks 29%
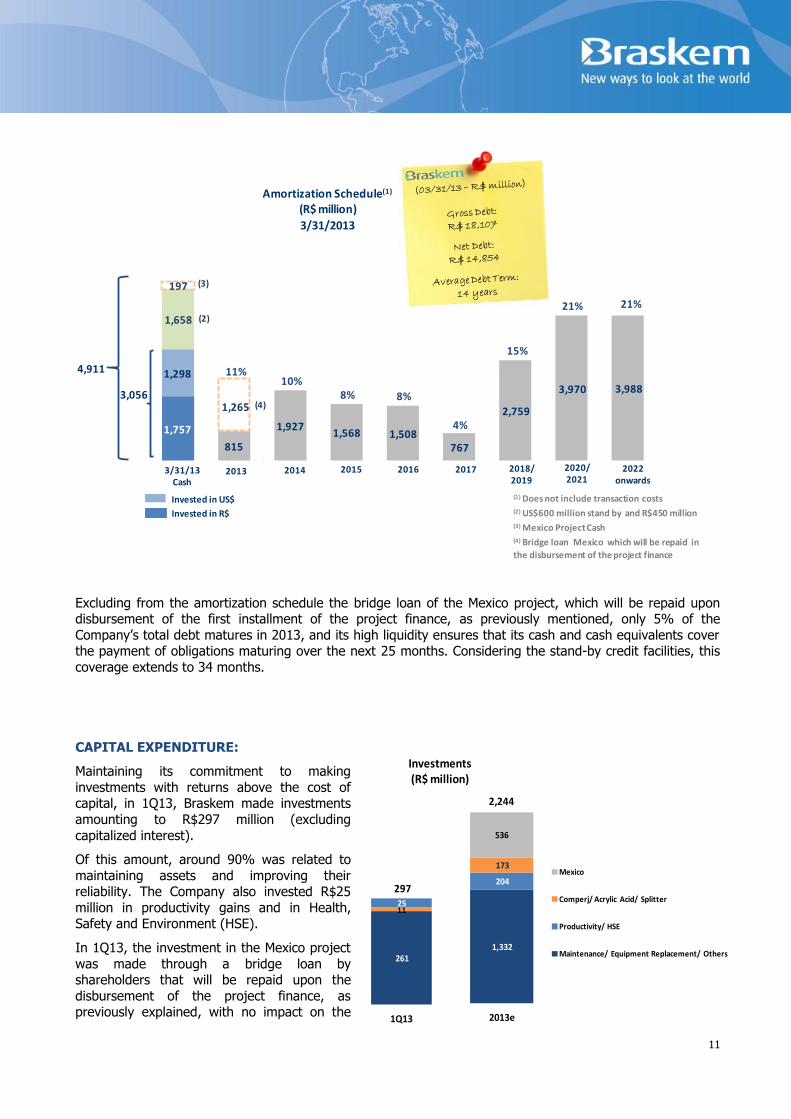
The following chart shows the Company’s consolidated amortization schedule as of March 31, 2013.
11
3,056
1,757
815
1,9271,568 1,508
767
2,759
3,970 3,988
1,298
1,658
197
(2)
(3)
(4)
2013 2014 2015 2016 2017 2018/2019
2020/2021
2022 onwards
3/31/13Cash
11%10%
8% 8%
4%
15%
21% 21%
4,911
Invested in US$
Invested in R$
Amortization Schedule(1)
(R$ million)
3/31/2013
(1) Does not include transaction costs(2) US$600 million stand by and R$450 million (3) Mexico Project Cash(4) Bridge loan Mexico which will be repaid in
the disbursement of the project finance
1,265
Excluding from the amortization schedule the bridge loan of the Mexico project, which will be repaid upon disbursement of the first installment of the project finance, as previously mentioned, only 5% of the
Company’s total debt matures in 2013, and its high liquidity ensures that its cash and cash equivalents cover the payment of obligations maturing over the next 25 months. Considering the stand-by credit facilities, this
coverage extends to 34 months.
CAPITAL EXPENDITURE:
Maintaining its commitment to making
investments with returns above the cost of capital, in 1Q13, Braskem made investments
amounting to R$297 million (excluding
capitalized interest).
Of this amount, around 90% was related to
maintaining assets and improving their reliability. The Company also invested R$25
million in productivity gains and in Health, Safety and Environment (HSE).
In 1Q13, the investment in the Mexico project
was made through a bridge loan by shareholders that will be repaid upon the
disbursement of the project finance, as previously explained, with no impact on the
1,332
204
173
536
2013e
Mexico
Comperj/ Acrylic Acid/ Splitter
Productivity/ HSE
Maintenance/ Equipment Replacement/ Others
2,244
261
11 25
1Q13
297
Investments(R$ million)

12
line Capital Expenditure. Disbursements via equity are expected to be resumed in 2Q13.
For 2013, investment is estimated at R$2.2 billion, with around (i) 70% allocated to maintenance and improving the productivity and reliability of the assets, including the additional expenses arising from the
scheduled maintenance shutdown of one of the lines at the cracker of the Camaçari unit scheduled for 4Q13 and expected to last 30 days; and (ii) 25% allocated to the construction of the new petrochemical complex in
Mexico. The remainder is related to other ongoing projects, such as the studies for the Comperj project and
the construction of a pipeline for the future supply of propylene to the acrylics complex in Bahia.
PROJECT PIPELINE:
In keeping with its medium and long term strategy, Braskem focuses on investments that increase its competitiveness and diversify its raw material matrix, strengthening its leadership in the Americas and in the
biopolymer market.
5 Capex includes only fixed investments and does not include the working capital needs and interest associated with the project.
Project Capacity (kton/y)
CAPEX Characteristics
Ethylene XXI (Integrated ethylene/PE project)
Location: Coatzacoalcos, Mexico
1,050
~US$ 3.2 bn5 JV between Braskem (75%) and Idesa (25%).
Long-term contract (20 years) with PEMEX-Gás based on the Mont Belvieu reference gas price.
In addition to gaining access to feedstock at attractive conditions, the project aims to meet the growing demand in Mexico for PE of around 1.9 million tons, of which some 70% is currently met by imports.
More than US$860 million has already been committed to the acquisition of equipment and materials, which is equivalent to 75% of the total inputs estimated for the project.
Earthmoving works concluded.
Construction: in 1Q13, the project reached 25.8% physical completion. Construction is progressing in all areas of the complex, with highlights including the installation of the foundation piles (80% completed) and the laying of the foundation (50% completed).
In October 2012, the Engineering, Procurement and Construction (EPC) contract was signed with a consortium formed by Odebrecht (40%), Technip (40%) and ICA Fluor (20%) for the complex’s construction.
Progress made on the pre-marketing efforts for sale to local customers.
US$3.2 billion project finance structure concluded in December 2012:
o SACE: US$600 million;
o IDB and IFC: US$570 million A loan to be complemented by a B Loan of US$700 million;
o BNDES: US$623 million;
o BancoMext and NAFIN: US$400 million;
o EDC: US$300 million.
Financial funding contract through bridge loan in the amount of US$619 million as of 1Q13, which will be reimbursed upon the disbursement of first

13
Special Regime for the Chemical Industry (REIQ)
On May 08, 2013, the federal government approved a measure to reduce the rate of PIS (Social Integration) and COFINS (Social Contribution) taxes on the acquisition of raw materials for the chemical and
petrochemical industries, maintaining the tax credit at 9.25%. The tax rates are as follows:
reduction of 5.6% to 1.0% for: naphtha, HLR, ethane, propane and butane;
reduction of 9.25% to 1.0% for: ethylene, propylene, butene, butadiene, ortoxylene, benzene,
toluene, isoprene and paraxylene.
The measure will remain valid in full until 2015. As of 2016, the discounts will be gradually reduced until
2018.
The incentives announced are aimed at supporting recovery in the competitiveness of the industry, which has
suffered from the stronger Brazilian real, the higher labor costs and labor competitiveness as well as infrastructure issues. Around 50 companies will benefit from the measure. The capacity utilization rate of the
industry, which has operated with idle capacity in recent years, is expected to increase, which would improve
its ability to generate profits and strengthen its capacity to invest in meeting the growing demand and reversing the sector’s trade deficit.
BRASKEM’S COMPETITIVE ADVANTAGES:
VISIO Program
With the aim of maximizing value for Clients and the plastics chain, the Visio Program launched new initiatives in
1Q13.
installment of the project finance;
Priorities for 2013:
o Disbursement of the project finance;
o Start of electro-mechanical assembly with the arrival of the main pieces of equipment and materials at the site;
o Expanding pre-marketing activities;
o Hiring and training people to run the future industrial operations.6
Comperj
Rio de Janeiro, Brazil
N/A
To be defined
2013e: defining the capacity and technologies for the petrochemical complex and commencing the basic engineering projects (FEL3) for the industrial units.
2014e: proposal for the project’s development and construction and examination by the Company’s Board of Directors.

14
A new PVC flooring for boats was developed in partnership with Kapazi, a manufacturer
specializing in carpeting and mats. In addition to being easier to clean and having lower maintenance costs, the new product is also more competitive than wood flooring. The
launch expanded the Client’s portfolio and sales, and also allowed for the entry of PVC resin in the boat flooring segment.
Innovation Pipeline
Polyethylene for heat shrink films segment: the new resin developed by Braskem aims to serve the market for shrink films, whose main application is as secondary packaging
for cans and bottles. The new resin creates a compact package free of punctures and surface marks. The potential consumption of PE is estimated at 7 kton/y.
OUTLOOK:
The continued uncertainty associated with the financial crisis in Europe and its influence on the global economy led the International Monetary Fund (IMF) to revise downward its forecast for world economic
growth, which is expected to be 3.3%. Growth continues to be driven primarily by emerging economies.
Meanwhile, China is expected to register GDP growth of 8%. The Chinese government announced that it does not plan to adopt new measures to stimulate economic activity, at least in the short term.
In the case of Brazil, after growing by only 0.9% in 2012, the local economy is expected to recover and post GDP growth of around 3%, supported by the measures adopted by the federal government to boost the
competitiveness of local producers and attract investment to various industries.
In this scenario, Braskem’s strategy remains centered on strengthening its business and increasing its
competitiveness by: (i) strengthening its partnerships with Clients, with market share gains in the Brazilian
market and segmented sales in the U.S. and European markets; (ii) supporting the development of Brazil’s petrochemical and plastics chain; (iii) pursuing operational efficiency by maintaining high capacity utilization
rates and optimizing the production mix; (iv) capturing value creation through additional capacity in PVC and butadiene; (v) diversifying its feedstock matrix and improving its competitiveness by advancing construction
of the gas-based petrochemical complex in Mexico (Ethylene XXI); and (vi) maintaining its financial health.
In the petrochemical market, the short-term scenario remains marked by sharp fluctuations in prices and costs. The continued volatility in crude oil prices, which in turn impact naphtha prices, and the lack of
definition regarding the recovery in the global economy have weighed on growth in demand for petrochemical products. Over the medium and long term, however, the scenario remains positive, with
expectations pointing to a gradual recovery in consumption supported by improvement in the macroeconomic
environment.
Braskem maintains its commitment to sustainable growth and development and will continue to act
proactively to pursue the best opportunities, seeking to create value for its Clients, Shareholders and Society and to increase competitiveness throughout the entire petrochemical and plastics production chain, while
maintaining its focus on financial discipline. In this scenario, the Company has been investing in projects to diversify its feedstock matrix and increase its competitiveness by building the integrated petrochemical
complex in Mexico and advancing the engineering studies for installing the new petrochemical complex in Rio
de Janeiro known as Comperj. Another highlight is Braskem’s continued efforts to increase the value of existing streams, with the startup of the PVC plant and the expansion of the butadiene plant in 2012, as well
as the supply of propylene to the future acrylic complex in Bahia.

15
NOTE: (i) On March 31, 2013, the Brazilian real/U.S. dollar exchange rate was R$2.0138/US$1.00.
UPCOMING EVENTS:
1Q13 Earnings Conference Call
Portuguese
10:00 a.m. (Brasília)
9:00 a.m. (US EST)
6:00 a.m. (Los Angeles)
2:00 p.m. (London)
Tel: +55 (11) 2188-0155
Code: Braskem
English
12:00 p.m. (Brasília)
11:00 a.m. (US EST)
8:00 a.m. (Los Angeles)
4:00 p.m. (London)
USA: +1 (866) 890-2584
Other countries: +55 (11) 2188-0155
Code: Braskem
INVESTOR RELATIONS TEAM:
Guilherme A. Mélega IRO and Controller Phone: (55 11) 3576-9531 [email protected]
Roberta Varella Fernando T. de Campos IR Manager IR Coordinator Phone: (55 11) 3576-9266 Phone: (55 11) 3576-9479 [email protected] [email protected]
Daniela Balle de Castro Pedro Gomes de Souza IR Analyst IR Analyst Phone: (55 11) 3576-9615 Phone: (55 11) 3576-9010 [email protected] [email protected]
Gabriela Bastos de Toledo IR Analyst Phone: (55 11) 3576-9745 [email protected]
www.braskem.com.br/ir

16
EXHIBITS LIST:
EXHIBIT I: Consolidated Statement of Operations 17
EXHIBIT II: EBITDA Calculation 18
EXHIBIT III: Consolidated Balance Sheet 19
EXHIBIT IV: Consolidated Cash Flow Statement 20
EXHIBIT V: Production Volume 21
EXHIBIT VI: Sales Volume - Domestic Market 22
EXHIBIT VII: Sales Volume - Export Market 23
EXHIBIT VIII: Consolidated Net Revenue 24
EXHIBIT IX: Results by Segment 25
Braskem, a world-class Brazilian petrochemical company, is the leader in the thermoplastic resins segment in the Americas. With 36 industrial plants, of which 29 are in Brazil, 5 in the United States and 2 in Europe, the Company has
annual production capacity of 16 million tons of thermoplastic resins and other petrochemical products.
DISCLAIMER
This press release contains forward-looking statements. These forward-looking statements are not just historical data, but rather reflect the targets and expectations of Braskem’s management. Words such as "anticipate", "wish", "expect", "foresee", "intend", "plan", "predict", "project", "aim" and similar terms,
written, seek to identify statements that necessarily involve known and unknown risks. Braskem does not undertake any responsibility for transactions or investment decisions based on the information contained in this document.

17
EXHIBIT I
Consolidated Statement of Operations
(R$ million)
Income Statement 1Q13 4Q12 1Q12 Change (%) Change (%)
CONSOLIDATED (A) (B) (C ) (A)/(B) (A)/(C )
Gross Revenue 11,038 10,923 9,609 1% 15%
Net Revenue 9,296 9,232 8,072 1% 15%
Cost of Good Sold (8,316) (8,309) (7,482) 0% 11%
Gross Profit 980 923 590 6% 66%
Selling Expenses (246) (276) (221) -11% 12%
General and Administrative Expenses (262) (282) (256) -7% 2%
Business Combination - - - - -
Other Net Operating Income (expenses) (29) 46 192 -164% -115%
Investment in Subsidiary and Associated Companies (5) (78) (2) -94% 125%
Operating Profit Before Financial Result 438 332 302 32% 45%
Net Financial Result (107) (596) (107) -82% 0%
Profit (loss) Before Tax and Social Contribution 331 (264) 195 -226% 70%
Income Tax / Social Contribution (104) 111 (53) -194% 96%
Discontinued operations result - 428 10 -100% -100%
Net Profit (loss) 227 275 152 -18% 49%
Earnings (loss) Per Share 0.26 0.35 0.19 -25% 37%
18
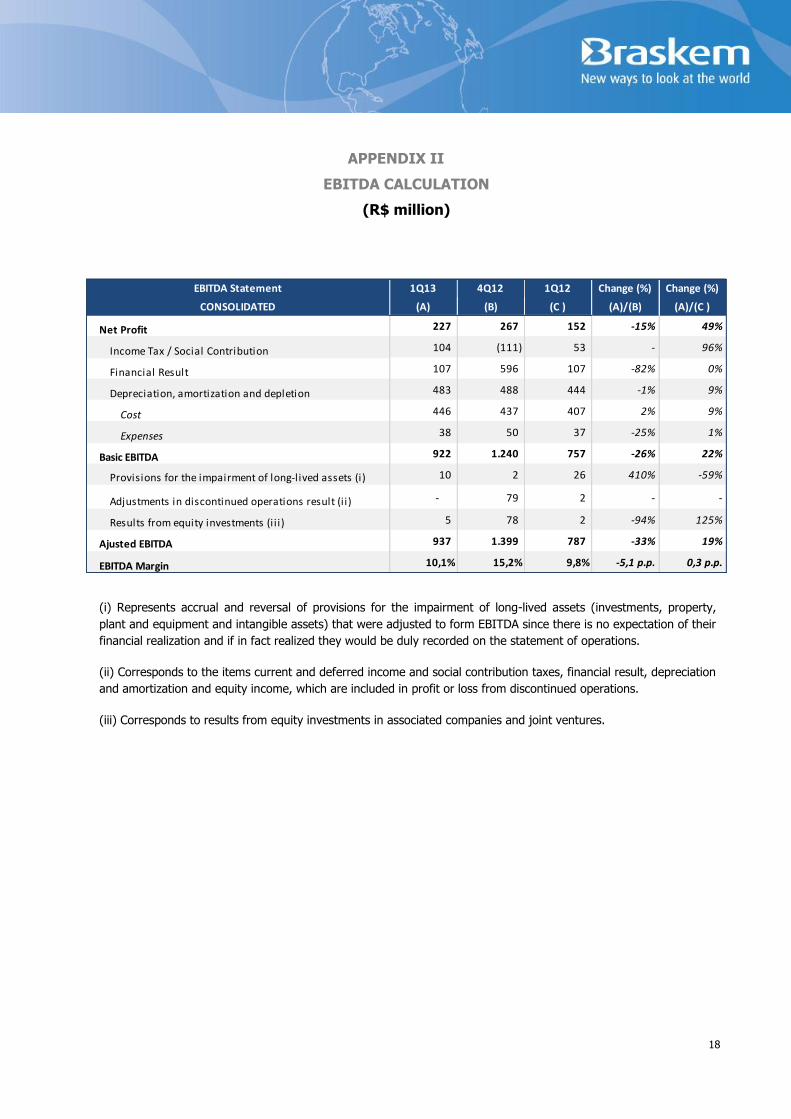
APPENDIX II
EBITDA CALCULATION
(R$ million)
EBITDA Statement 1Q13 4Q12 1Q12 Change (%) Change (%)
CONSOLIDATED (A) (B) (C ) (A)/(B) (A)/(C )
Net Profit 227 267 152 -15% 49%
Income Tax / Social Contribution 104 (111) 53 - 96%
Financial Result 107 596 107 -82% 0%
Depreciation, amortization and depletion 483 488 444 -1% 9%
Cost 446 437 407 2% 9%
Expenses 38 50 37 -25% 1%
Basic EBITDA 922 1.240 757 -26% 22%
Provisions for the impairment of long-lived assets (i) 10 2 26 410% -59%
Adjustments in discontinued operations result (i i) - 79 2 - -
Results from equity investments (i i i) 5 78 2 -94% 125%
Ajusted EBITDA 937 1.399 787 -33% 19%
EBITDA Margin 10,1% 15,2% 9,8% -5,1 p.p. 0,3 p.p.
(i) Represents accrual and reversal of provisions for the impairment of long-lived assets (investments, property,
plant and equipment and intangible assets) that were adjusted to form EBITDA since there is no expectation of their
financial realization and if in fact realized they would be duly recorded on the statement of operations.
(ii) Corresponds to the items current and deferred income and social contribution taxes, financial result, depreciation
and amortization and equity income, which are included in profit or loss from discontinued operations.
(iii) Corresponds to results from equity investments in associated companies and joint ventures.

19
EXHIBIT III
Consolidated Balance Sheet
(R$ million)
03/31/2013 12/31/2012 Change (%)
(A) (B) (A)/(B)
Current 13,109 12,692 3
Cash and Cash Equivalents 3,002 3,288 (9)
Marketable Securities/Held for Trading 222 172 29
Accounts Receivable 2,449 2,326 5
Inventories 4,633 4,102 13
Recoverable Taxes 1,661 1,476 13
Other Receivables 864 1,050 (18)
Non Current Assets Held for Sale 278 278 -
Non Current 29,158 28,478 2
Marketable Securities/ Held-to-Maturity 29 34 (17)
Compulsory Deposits and Escrow Accounts 177 180 (1)
Accounts Receivable 34 38 (10)
Deferred Income Tax and Social Contribution 2,060 2,062 (0)
Taxes Recoverable 1,500 1,527 (2)
Related Parties 129 128 1
Insurance claims 89 47 88
Others Accounts Receivable 241 218 11
Investments 118 126 (6)
Property, Plant and Equipament 21,855 21,177 3
Intangible Assets 2,926 2,941 (1)
Total Assets 42,267 41,170 3
03/31/2013 12/31/2012 Change (%)
(A) (B) (A)/(B)
Current 13,446 12,657 6
Suppliers 8,702 8,898 (2)
Financing/Debentures 2,383 1,836 30
Hedge Accounting Opperations 249 293 (15)
Salary and Payroll Charges 426 349 22
Dividends and Interest on Equity 4 5 (23)
Taxes Payable 353 343 3
Advances from Customers 477 238 101
Sundry Provisions 35 52 (33)
Post-employment Benefit 161 147 9
Other Payable 548 386 42
Non Current Liabilities Held for Sale 110 110 -
Non Current 19,947 19,861 0
Financing/Debentures 15,724 15,676 0
Deferred Income Tax and Social Contribution 2,196 2,139 3
Taxes Payable 1,147 1,165 (2)
Sundry Provisions 365 363 1
Advances from Customers 189 205 (8)
Other Payable 280 267 5
Others 46 47 (3)
Shareholders' Equity 8,874 8,652 3
Capital 8,043 8,043 -
Capital Reserve 798 798 -
Profit Reserves 0 0 -
Treasury Shares (49) (49) -
Other Comprehensive Income 322 337 (5)
Retained Earnings (losses) (349) (566) (38)
Non Controlling Interest 108 88 23
Total Liabilities and Shareholders' Equity 42,267 41,170 3
ASSETS
LIABILITIES AND SHAREHOLDERS' EQUITY

20
EXHIBIT IV
Cash Flow
(R$ million)
Cash Flow 1Q13 4Q12 1Q12
Profit (loss) Before Income Tax and Social Contribution 331 293 211
Adjust for Net Income Restatement
Depreciation and Amortization 483 488 444
Equity Result 5 (7) 2
Interest, Monetary and Exchange Variation, Net 26 429 41
Others 2 307 20
Cash Generation before Working Capital 847 1,510 718
Operating Working Capital Variation
Market Securities (58) 64 (117)
Account Receivable (120) 75 (578)
Recoverable Taxes (149) 35 (128)
Inventories (526) (274) (289)
Advanced Expenses 38 3 12
Other Account Receivables (78) (457) (243)
Suppliers (196) (12) 2,097
Advances from Customers/Long-Term Incentives 224 121 17
Taxes Payable (53) (147) (8)
Other Account Payables 257 48 109
Other Provisions (15) 77 (5)
Operating Cash Flow 169 1,043 1,585
Interest Paid (201) (481) (140)
Income Tax and Social Contribution (8) (8) (8)
Net Cash provided by operating activities (40) 553 1,437
Proceeds from the sale of fixed assets 1 110 0
Proceeds from the capital reduction of associates 163 - -
Additions to Investment (0) (141) -
Additions to Fixed Assets (1,101) (942) (833)
Additions to Intangible Assets (1) (8) (0)
Financial Assets Held to Maturity 15 6 (1)
Cash used in Investing Activities (923) (975) (834)
Obtained Borrowings 2,959 1,070 1,175
Payment of Borrowings (2,285) (407) (1,478)
Dividends (0) (482) (0)
Non-controlling interests (3) (38) 21
Cash used in Financing Activities 671 142 (282)
Exchange Variation on Cash of Foreign Subsidiaries and Jointly Controlled Companies 6 (2) (5)
Increase (decrease) in Cash and Cash Equivalents (285) (281) 316
Represented by
Cash and Cash Equivalents at The Beginning of The Year 3,288 3,569 2,987
Cash and Cash Equivalents at The End of The Year 3,002 3,288 3,303
Increase (Decrease) in Cash and Cash Equivalents (285) (281) 316

21
EXHIBIT V
Production Volume – Main Products
1T12tons 1Q12 2Q12 3Q12 4Q12 1Q13
Polyolefins
PE's 656,359 637,216 666,380 579,520 632,257
PP 431,401 379,643 440,753 394,822 436,029
Vinyls
PVC 114,950 110,629 140,595 131,192 146,877
Caustic Soda 116,142 99,083 126,430 108,934 115,321
Chlorine 15,103 11,641 13,793 12,515 11,404
Basic Petrochemicals
Ethylene 870,154 819,825 868,891 770,887 835,531
Propylene 377,083 363,951 390,155 341,299 372,137
Benzene 212,173 196,181 211,096 184,735 215,095
Butadiene 78,132 75,927 106,597 95,047 100,850
Toluene 43,677 32,637 46,443 42,122 41,742
Fuel (m³) 204,444 199,333 205,932 210,297 221,317
Paraxylene 44,630 45,458 49,050 45,660 44,930
Orthoxylene 24,458 22,924 24,590 20,685 22,592
Butene 1 10,910 10,078 15,067 9,651 11,380
ETBE 71,525 59,017 78,890 76,818 78,403
Mixed Xylene 19,694 21,955 27,580 16,739 15,840
Cumene 63,697 63,804 64,406 54,335 73,138
Polybutene 5,222 6,317 6,010 3,495 9,778
GLP 11,170 6,892 4,533 2,870 6,533
Aromatic Residue 31,838 30,566 33,821 25,972 34,795
Petrochemical Resins 3,918 3,863 3,304 3,112 2,599
United States and Europe
PP 439,216 427,039 448,500 441,978 427,757
PRODUCTION CONSOLIDATED

22
EXHIBIT VI
Sales Volume - Domestic Market – Main Products
#REF! #REF! #REF!
tons 1Q12 2Q12 3Q12 4Q12 1Q13
Polyolefins
PE's 407,701 390,042 458,669 411,759 438,717
PP 307,476 275,205 338,208 312,449 315,724
Vinyls
PVC 131,017 133,053 154,004 142,850 166,216
Caustic Soda 113,673 113,551 114,575 122,253 119,469
Chlorine 12,939 13,387 13,620 12,436 11,821
Basic Petrochemicals
Ethylene 136,402 123,285 138,874 122,727 130,854
Propylene 60,943 46,801 57,302 52,505 54,807
Benzene 109,729 112,832 116,921 108,836 101,778
Butadiene 57,903 59,727 56,748 44,626 57,460
Toluene 32,797 29,939 26,679 12,406 8,638
Fuel (m³) 172,452 179,039 176,205 212,079 137,310
Paraxylene - - 4,989 11,951 2,997
Orthoxylene 23,196 20,962 24,128 18,086 21,050
Mixed Xylene 24,785 22,267 25,045 17,984 14,504
Cumene 67,042 58,853 62,482 62,312 64,817
Polybutene 2,364 3,310 2,439 2,592 2,244
GLP 13,242 8,019 6,957 4,612 8,194
Aromatic Residue 45,195 28,000 37,554 27,467 36,036
Petrochemical Resins 2,326 2,581 2,075 2,217 2,238
Domestic Market - Sales Volume
CONSOLIDATED

23
EXHIBIT VII
Sales Volume - Export Market – Main Products
tons 1Q12 2Q12 3Q12 4Q12 1Q13
Polyolefins
PE's 230,155 227,230 233,607 170,843 174,247
PP 101,740 103,022 117,655 93,077 66,110
Basic Petrochemicals Unit
Propylene 46,216 36,796 60,847 43,885 40,288
Benzene 36,404 47,893 35,732 48,876 40,222
Butadiene 15,699 11,807 55,047 55,443 40,777
Toluene 9,239 6,479 10,748 40,413 24,821
Fuel (M³) 15,393 38,113 15,822 15,661 66,774
Paraxylene 36,572 44,526 46,546 38,601 31,395
Butene 1 1,009 2,040 - 1,499 -
ETBE 62,838 54,312 83,342 89,063 61,689
Mixed Xylene 239 133 80 556 451
Polybutene 3,292 3,364 3,050 3,475 3,829
United States and EuropePP 428,042 420,768 451,723 443,571 430,872
Export Market - Sales Volume
CONSOLIDATED

24
EXHIBIT VIII
Consolidated Net Revenue
(R$ million)
R$ million 1Q12 2Q12 3Q12 4Q12 1Q13
PolyolefinsDomestic Market 2,347 2,400 2,881 2,809 3,034
Export Market 921 1,080 1,109 911 824
VinylsDomestic Market 439 467 535 542 636
Basic Petrochemicals (Most Relevants)Domestic Market
Ethylene/Propylene 496 513 518 481 586
Butadiene 283 341 228 182 208
Cumene 142 160 172 172 199
BTX 343 398 456 426 407
Others 380 376 418 421 345
Export Market
Ethylene/Propylene 121 101 148 124 125
Butadiene 99 71 232 207 148
BTX 212 255 260 378 278
Others 190 245 301 283 315
United States and Europe 1,301 1,432 1,314 1,416 1,606
Resale* 653 678 521 565 409
Others 146 445 161 314 177
Total 8,072 8,963 9,254 9,232 9,296
*Naphtha, condensate and crude oil
Net Revenue by Segment

25
EXHIBIT IX
Results by Segment
(R$ million)
R$ MM
Basic
Petrochemicals Polyolefins Vinyls
United States and
Europe
Sales Net Revenues 5,984 3,858 644 1,606 12,092 (2,797) 9,296
Cost of Goods Sold (5,556) (3,409) (594) (1,511) (11,070) 2,754 (8,316)
Operating Expenses (144) (205) (34) (61) (443) (98) (542)
Operating Profit 284 243 17 34 579 (140) 438
R$ MM
Basic
Petrochemicals Polyolefins Vinyls
United States and
Europe
Sales Net Revenues 5,652 3,267 450 1,301 10,670 (2,599) 8,072
Cost of Goods Sold (5,288) (3,114) (445) (1,212) (10,059) 2,577 (7,482)
Operating Expenses (113) (223) (30) (49) (415) 127 (287)
Operating Profit 251 (69) (25) 40 196 106 302
Segments
Total reportable
segments
Others
/Adjustments
Braskem
consolidated
Results by Business Segment - YTD 2013
Segments
Total reportable
segments
Others
/Adjustments
Braskem
consolidated
Results by Business Segment - YTD 2012