2006 citizen survey final report results for total sample 831 e. morehead street, suite 150...
TRANSCRIPT

2006 Citizen Survey
Final ReportResults for Total Sample
831 E. Morehead Street, Suite 150Charlotte, North Carolina 28202

2
Table of Contents
Objectives 3Methodology 4Rating Scales 5 Summary 6Conclusions 22Detailed Findings for Total Sample 27
Perceptions of CMPD and CMPD Services 28Perceptions of Crime and Safety in Charlotte-Mecklenburg Overall and in Neighborhoods 32Perceptions of Safety in Uptown Charlotte 43Crime in Charlotte-Mecklenburg 56Interaction with CMPD 61Sources that Shape Perceptions of the CMPD 68Use and Perceptions of CMPD Website 70Perceptions of Policing Philosophies 75Respondent Profile 77

3
Objectives
•The Citizen Satisfaction Survey was conducted by MarketWise, Inc.
•The research objectives of the study were the following:
–Measure overall perceptions of the CMPD
–Measure satisfaction with the services
–Explore perceptions of safety and crime levels for:
Charlotte-Mecklenburg overall, neighborhoods, and Uptown.
–Examine sources that shape perceptions of the CMPD
–Explore perceptions of policing philosophies
–Compare changes in perceptions from 2005 to 2006 on keyissues

4
Methodology
• A total of 675 interviews were completed in Nov. and Dec of 2006.• The sample was stratified by the 12 CMPD Divisions, which were defined by Census track & block
groups.
– At least 50 interviews were conducted in each Division.
– To correct for under-representation of Hispanics/Latinos, additional interviews were conducted with respondents in this segment. This resulted in some divisions having more than 50 interviews. Hispanics and Latinos who did not speak English were interviewed in Spanish.
– A total of 653 respondents are in the total (representative) sample of citizens.
– An additional 22 interviews were conducted with residents of Uptown Charlotte to increase the sample for this segment to at least 50 respondents. The 22 targeted interviews are not included in the analysis of the total sample, because they would over-represent Uptown residents. They are included in analysis of the subgroups of: respondents who have been Uptown, respondents who live Uptown, respondents who work or conduct business Uptown, and respondents within divisions.
• Respondents were selected to be age 18 or older. • An additional over-sampling of adults age 18-34 was necessary to correct for under-representation
of this segment.
• Margin of error for the total sample of 653 is + 3.8 percentage points at the 95% confidence level.

5
Rating Scales
• To measure perceptions, respondents used rating scales from 1 to 10.
1=Extremely Negative to 10=Extremely Positive
• With a 10-point scale there is no exact mid-point. Ratings of 5 and 6 are equally in the middle of the scale.
• To simplify interpretation, the data have been collapsed into categories and labeled. For example:
9,10=Very positive 7,8=Positive 5,6=Mid-scale/Average 1-4=Poor
• Ratings of 1-2 and 3-4 have been combined due to the low percentage of responses.
• NOTE:
– Responses may not add to exactly 100% due to rounding.
– Mean ratings are always calculated with “don’t know” responses dropped from the base.

Summary

7
SummaryPerceptions of the CMPD
• The majority of adults in Charlotte-Mecklenburg have a positive impression of the CMPD. This year, 70% of respondents (the same as last year), rate the CMPD 7 or higher on a 10-point scale, while less than 1 in 10 give a low rating (1 to 4).
• Three out of four respondents (able to rate the item) give the CMPD high ratings (7 or higher) on the following measures related to character:
– Courteous – Professional– Performing job with integrity and honesty
• Two out of three respondents (able to rate) give high ratings on – Good judgment in use of force

8
SummaryPerceptions of Services Provided by the CMPD
• A high percentage (70% or more) of respondents (able to rate) give high ratings (7 to 10) on the following CMPD services:
– 911 Call Center– Officer response to emergencies – Working with communities to solve problems– Non-emergency telephone reporting (Mean ratings among respondents able to
rate show significant improvement from 2005 to 2006 -- 6.6 to 7.3, respectively.)• More than 60% of respondents able to rate give high ratings (7 to 10) on:
– Traffic law enforcement– Crime prevention efforts– Animal Control services
• 59% of respondents able to rate give high ratings on drug law enforcement.
• Mean ratings show improvement on perceptions of non-emergency telephone reporting. There was no significant decline on perceptions of any of the other services measured.
9
SummaryPerceptions of the Need for Police
• The majority of respondents agree that the need for police has increased.
– In 2006 (as in 2005), 81% agree (rate 7 to 10) the need for police increased over the past year.
– In 2006 (as in 2005), 33% agree Charlotte-Mecklenburg has an adequate number of police, while 35% believe we do not have an adequate number of police.

10
SummaryPerceptions of Safety in Charlotte-Mecklenburg Overall
and in Neighborhoods
• Significantly more respondents indicate they feel safe in their neighborhoods (74% rate 7-10), than say Charlotte-Mecklenburg overall is a safe place to live (59% rate 7-10). (These results have not changed since 2005.)
• The majority of respondents (69%) believe the CMPD is effective in making Charlotte-Mecklenburg safer. Only 8% believe the CMPD is not effective. (No significant change since 2005.)
– The majority believe Charlotte-Mecklenburg is as safe (44%) or safer (12%) than it was a year ago. However, 43% of respondents believe Charlotte-Mecklenburg is less safe than a year ago. (No significant change since 2005.)
– For Charlotte-Mecklenburg overall, gangs (20%), drugs (20%), break-ins (18%), robberies (17%), assault/violent crime (10%), and theft (10%) are the primary concerns about safety. In 2005, robberies were the top concern (23%).

11
SummaryPerceptions of Safety in Charlotte-Mecklenburg Overall
and in Neighborhoods
• The majority of respondents (63%) believe the CMPD is effective in working with their neighborhood to solve problems. 12% believe the CMPD is not effective. (No significant change since 2005.)
– The majority of respondents believe their neighborhood is as safe (55%) or safer (14%) than a year ago. Only 28% of respondents believe their neighborhood is less safe than a year ago. (No significant change since 2005.)
– For neighborhoods, break-ins (25%), drugs (14%), theft (12%), and robberies (11%) are the top concerns about safety. In 2005, break-ins (32%) were also the top concern.

12
SummaryNeighborhood/Community Groups & Neighborhood Policing
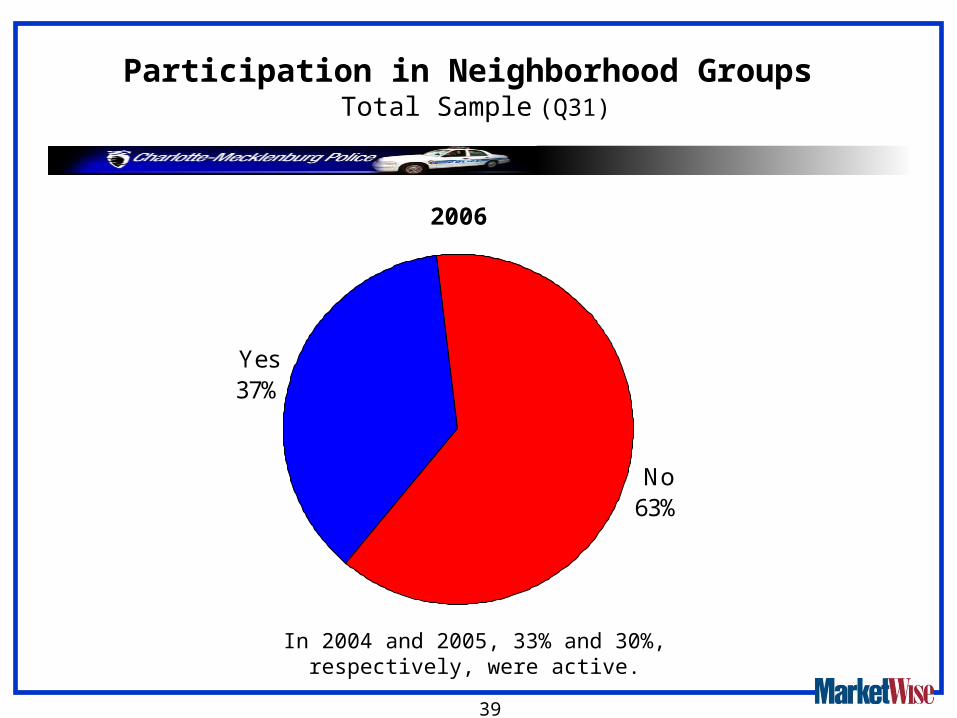
• More respondents are active in a neighborhood/community group in 2006, than in 2005 (37% vs. 30%, respectively).
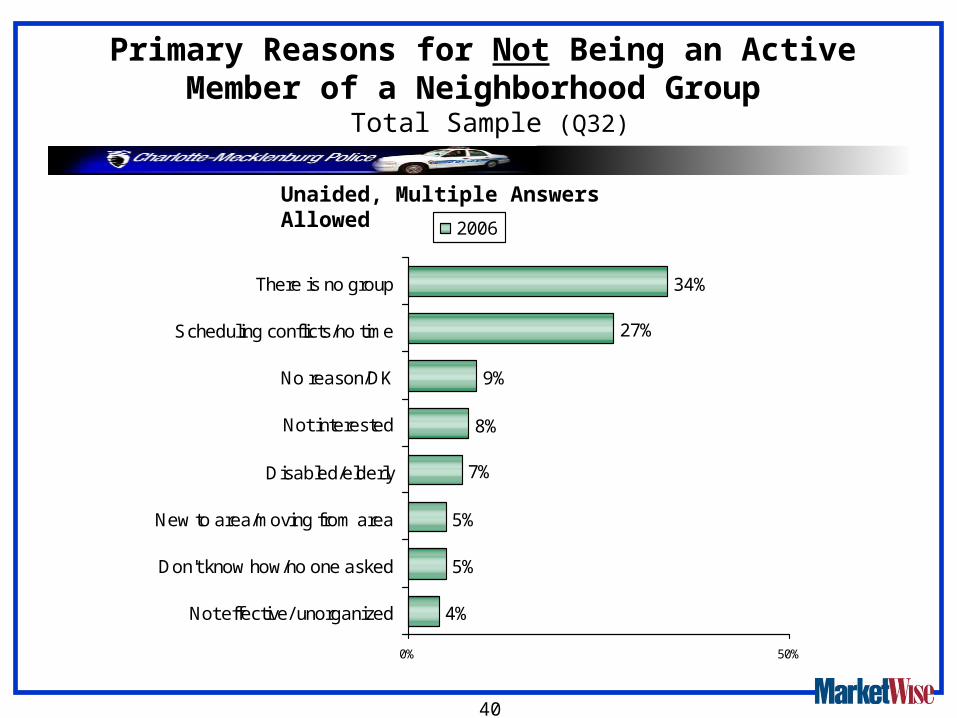
• The primary reasons for not being active in a neighborhood group include: there is no group (34%), scheduling conflicts/lack of time (27%), no reason or no interest (17%), physical disability or elderly (7%), don’t know how or never asked (5%), new to area or moving from area (5%), and not effective/unorganized (4%).
• Almost half (48%) of the respondents (the same as in 2005) are aware they have an assigned community/neighborhood police officer.
• About a third (32%) of respondents (the same as in 2005) have spoken with a police officer about a neighborhood problem (does not include 911 calls) in the past year.

13
SummaryPerceptions of Safety in Uptown Charlotte
• 84% of respondents have been in Uptown Charlotte in the past year (slightly more than last year, 80%). Respondents have been Uptown:
– to dine out (49%)– for work or business (38%)– to use the public library (34%)– to shop (20%)– to use CATS (15%)– for other types of entertainment (60%)– and 5% live in the Uptown area.
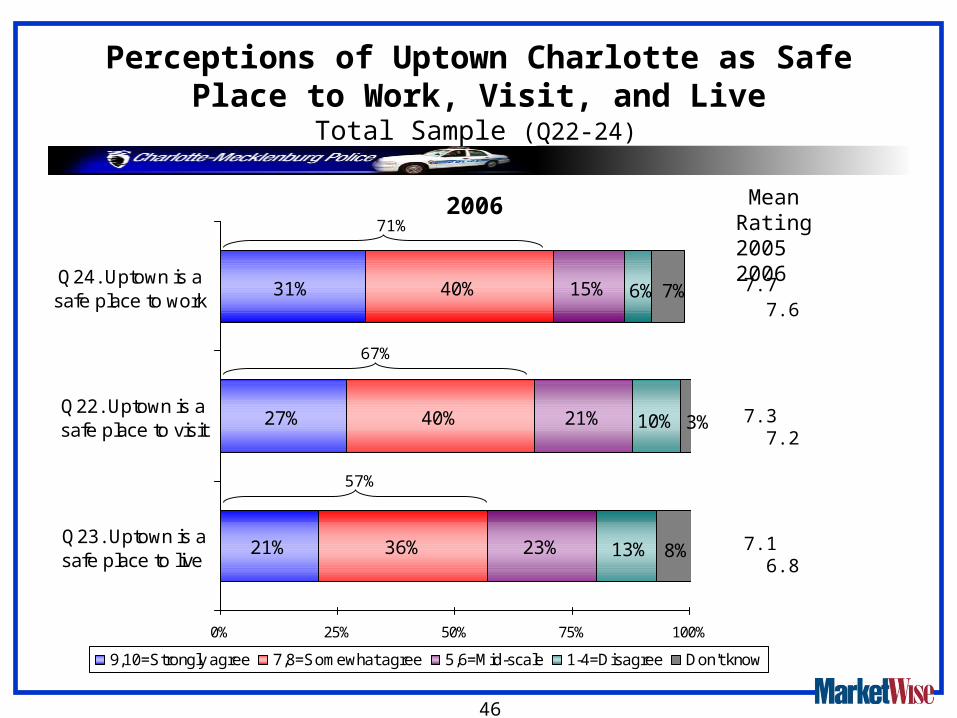
• The majority of respondents believe Uptown Charlotte is a safe place to visit (67%), work (71%), and live (57%). (No significant change since 2005.)
– Respondents who live uptown are the most likely to believe Uptown is a safe place to visit, work, and live.
• The majority of respondents believe (65% rate 7 to 10) the CMPD is effective in making Uptown safer. (This is a 5 percentage point drop since 2005.) Only 6% believe the CMPD is not effective.
– Respondents who live Uptown are the most likely to believe the police have been effective in making Uptown safer.

14
SummaryPerceptions of Safety in Uptown Charlotte
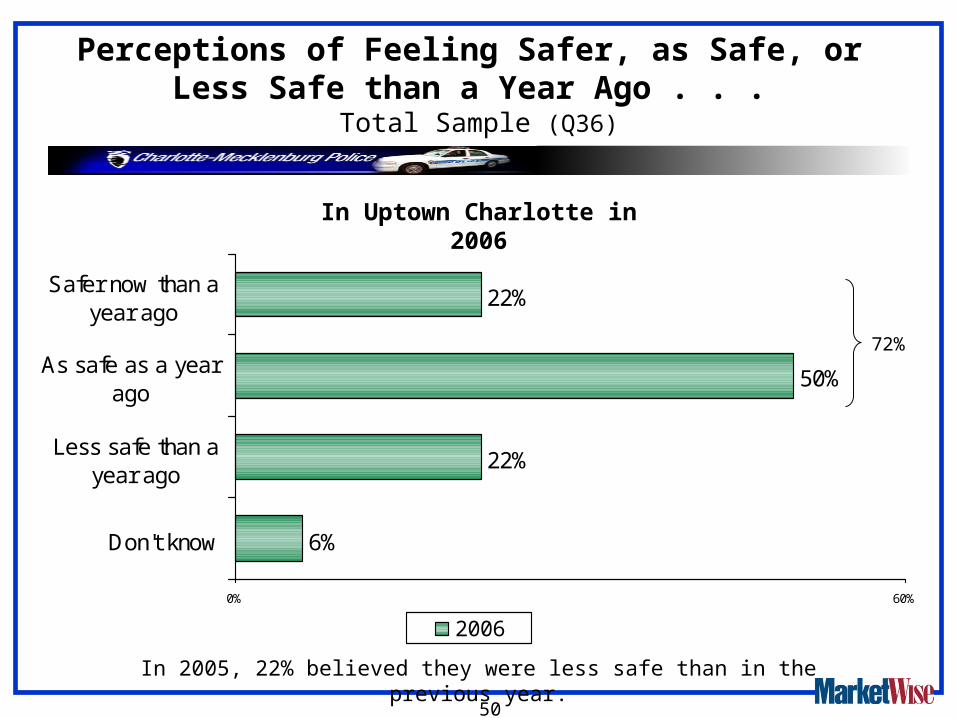
• Most respondents believe Uptown is as safe (50%) or safer (22%) than it was a year ago. Less than a quarter of respondents (22% ) do not believe it is as safe as a year ago. (These findings have not changed significantly since 2005.)
– Respondents who live Uptown are the most likely to believe Uptown is as safe or safer than a year ago.
– Respondents who have been Uptown are more likely than those who have not been, to believe Uptown is as safe or safer than a year ago.
• The majority of respondents (84% of total sample) believe Uptown is safe between 6am and 6pm. Slightly less than a majority of respondents believe Uptown is safe between 6pm and 10pm. Only a quarter of the respondents believe Uptown is safe between 10pm and 6am.
– Respondents who live Uptown are the most likely to believe Uptown is safe, regardless of the time of the time of day.
– Respondents who have been Uptown are more likely than those who have not been Uptown, to believe Uptown is safe between 6am and 6pm, and between 6pm and 10pm. However, the majority of respondents, regardless of whether they have been Uptown or even live Uptown, do not believe Uptown is safe between 10pm and 6am.

15
SummaryPerceptions of Safety in Uptown Charlotte
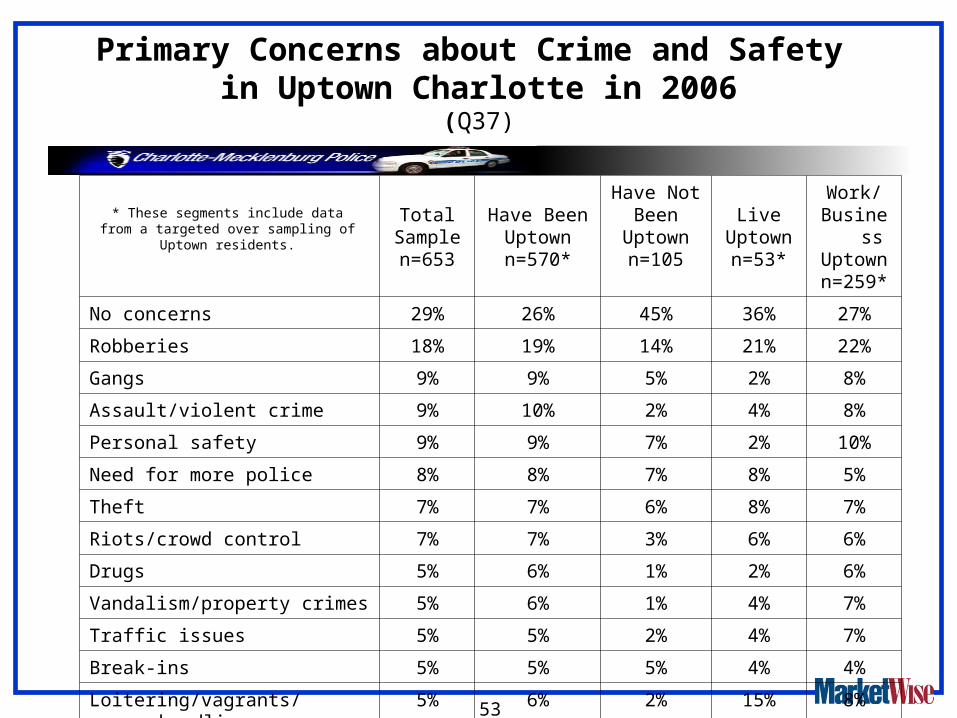
• The primary safety concerns for Uptown are: robberies (18%), gangs (9%), assault/violent crime (9%), personal safety (12%), the need for more police (8%), theft (8%), and crowd control (7%). In 2006, 29% indicated they had no safety concerns for Uptown, compared to 15% in 2005. In 2005, robberies (23%) were also the primary concern. Concern about crowd control has increased from 2005 to 2006 (2% to 7%, unaided).

16
SummaryCrime in Charlotte-Mecklenburg
• Less than a third (31%) of respondents indicate that either they or another member of their household were victims of a crime, in Charlotte-Mecklenburg, during the past year. (This finding has not changed since 2005.)
• Many more respondents report being a victim of a property crime (28%) during the past year, than report being a victim of a violent crime (7%). (This finding has not changed since 2005).
– 22% of respondents reported the property crime to the CMPD, but 6% did not report the crime.
– 6% of respondents reported the violent crime to the CMPD, and 1% did not report the violent crime.
• The reasons given for NOT reporting violent crimes were: it was not worth reporting (25%), police would not be able to catch criminal (13%), it was reported somewhere else (13%), the person was evicted (13%), no answer at 911 (13%), afraid of retaliation (13%), did not know about it until after it happened (13%). (These responses are based on a very small sample.)
• The reasons given for NOT reporting property crimes were: it was not worth reporting (62%), police would not be able to catch criminal (14%), reported to a different source (8%), felt it was my fault (5%), don’t know (5%), police came due to alarm (3%), and knew who did it (3%).
17
SummaryInteraction with CMPD
• In 2006, 66% of respondents (64% in 2005) interacted with the CMPD, either on the phone OR in person, in the past year.
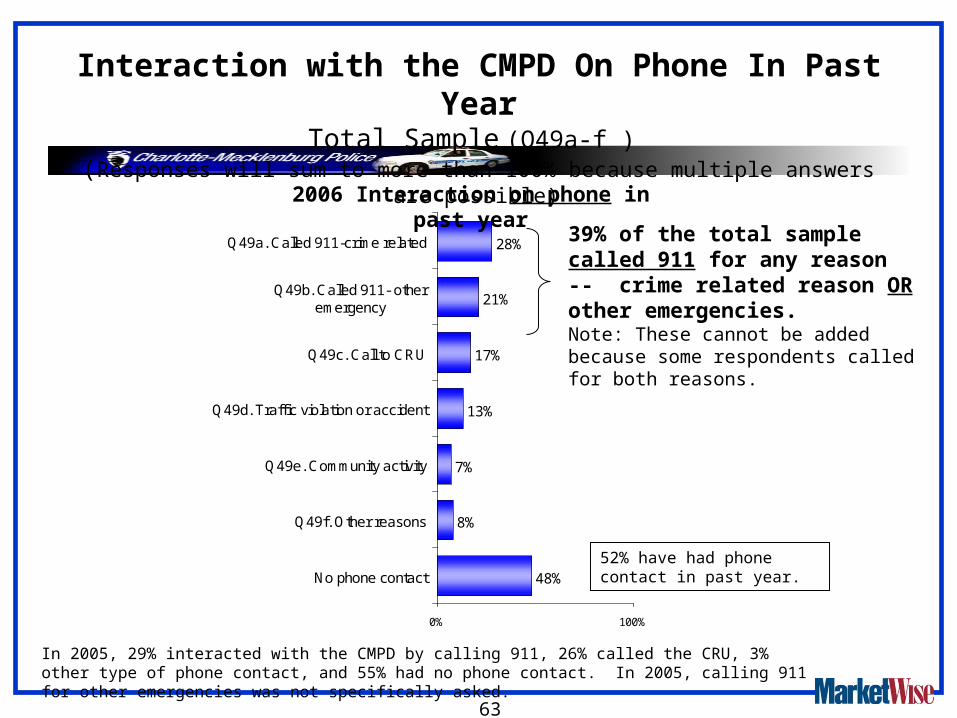
• In 2006, 52% of respondents (compared to 45% in 2005) interacted with the CMPD on the phone, in the past year.
– 28% by calling 911 to report a crime/suspected crime
– 21% by calling 911 for an emergency not related to a crime
– 17% by calling or being transferred to the Crime Reporting Unit
– 11% by calling the CMPD for other reasons
– Note: Percentages add to more than 52% because respondents could have called for multiple reasons.
• Satisfaction with the time it takes to handle non-emergency calls has improved since last year (65% were satisfied in 2005 and 72% in 2006.)

18
SummaryInteraction with CMPD
• In 2006, 52% of respondents (compared to 48% in 2005) interacted with the CMPD in person.
– 14% interacted in person because they were a victim of a crime, 17% due to a crime related issues, 16% due to some other type of emergency, 17% because of a traffic violation or accident, 19% during community related activities, and 11% for other reasons.
– Note: Percentages add to more than 52% because respondents could mention multiple reasons.
• 66% of respondents (about the same as last year) indicated it is appropriate for police to have slower response times for non-emergency situations, another 8% said it is sometimes appropriate, and 26% indicated police should not be slower for non-emergencies.

19
SummarySources of Influence on Opinions of the CMPD
• Respondents (among total sample) indicate the sources that have the most influence on opinions are:
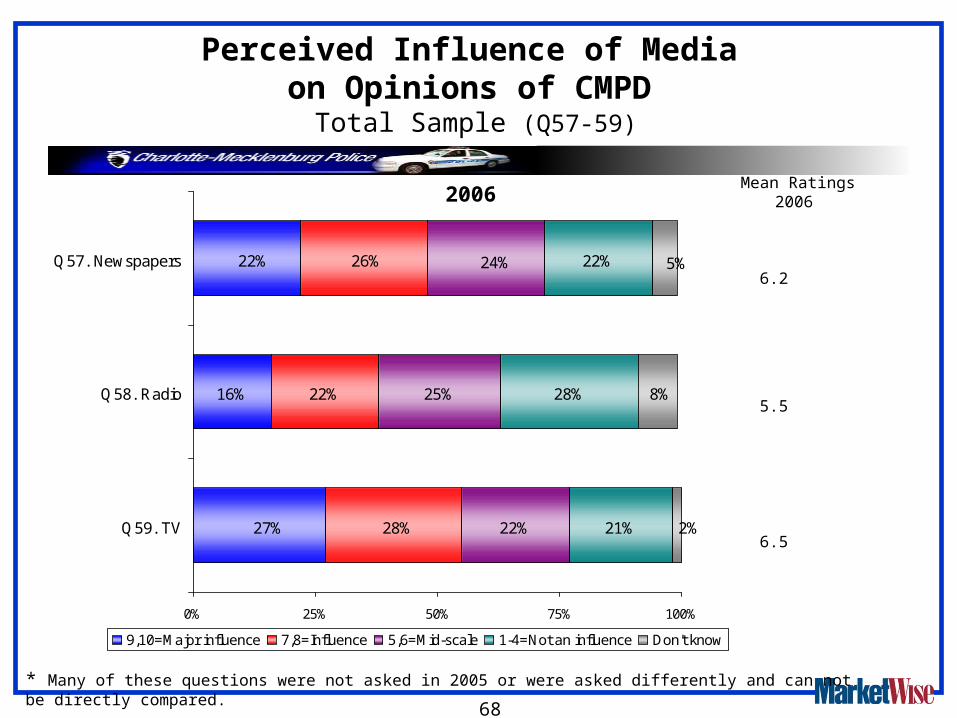
– Personal interaction with police (66%)– Word of mouth (58%)– TV (55%)– Police meetings with community groups (52%)– Newspapers (48%)– Events such as Festival in the Park (44%)
• Second tier sources are:– Radio (38%)– City Council Meetings (34%)– CMPD Website (33%)– Police brochures (33%)
• Other sources are:– CMPD guest column editorials in newspapers (29%)– CMPD Today (25%)– Neighborhood newsletters (22%)– Cmail, City electronic newsletters (20%)

20
SummaryUse and Perceptions of CMPD Website
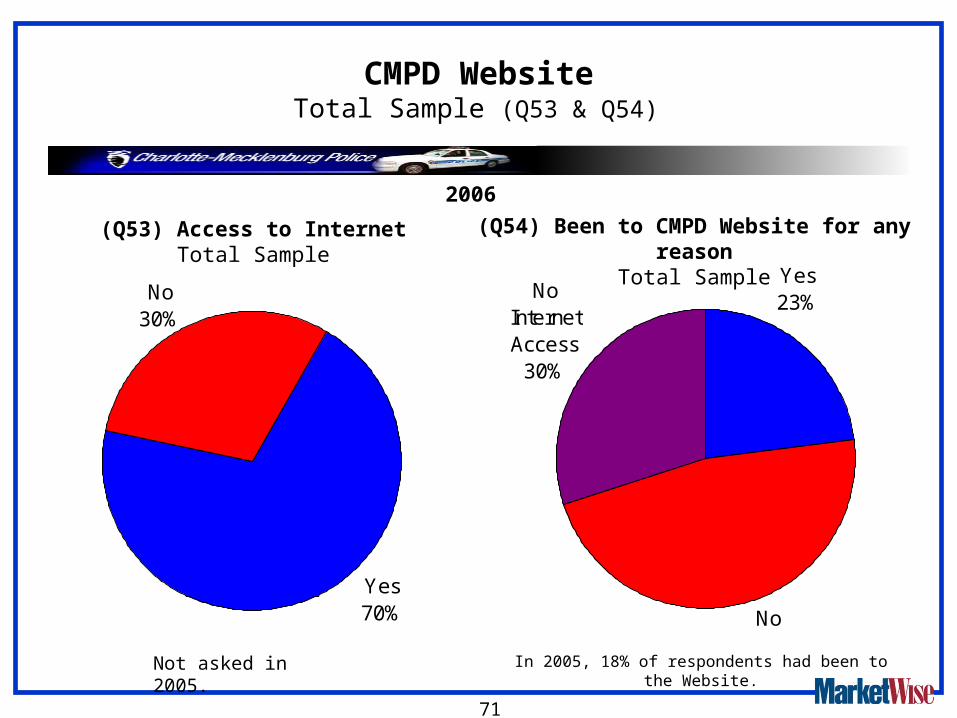
• In 2006, 23% of respondents (compared to18% in 2005) visited the CMPD Website.
– 71% of those who have visited the Website, rate it good or extremely good.– 54% of those who have visited the site say it has an influence on their opinion of the
CMPD. Only 38% of those who visited the site in 2005 indicated the site influenced their opinions.
• Among the total sample (regardless of whether they have visited the site), all the features measured are considered very important to have on the Website:
– Crime prevention information (85%)– Crime statistics (81%)– Ability to obtain a crime report (79%)– Ability to file a crime report (78%) – Latest news from the CMPD (77%)– Homeland Security information (72%)– Traffic reports (67%)

21
Summary Policing Philosophies
• The majority of respondents (78% or more) agreed (rated 7 to 10) with each of the five statements related to policing philosophies. (No significant change since 2005.)
• Examination of strong agreement (ratings of 9 to10) shows that about 60% strongly agree that effective policing should:
– Emphasize a partnership where citizens share responsibility for a safe city– Place heavy emphasis on preventing crimes before they occur– Place strong emphasis on long term solutions
• Examination of strong agreement (ratings of 9 to 10) shows that only 47% strongly agree that effective policing should:
– Focus primarily on officers arresting people who break laws– Focus on locations where repeat crimes occur, instead of random patrols

Conclusions

23
In Conclusion
• From 2005 to 2006, perceptions of the CMPD have remained positive.
– There have been no significant declines in perceptions on character related issues or on services provided.
– Perceptions of non-emergency reporting improved significantly and satisfaction with the time to handle non-emergency calls also improved.
Compared to last year, fewer adults indicated they used the non-emergency reporting service.
Since non-emergency reporting is conducted through the 311 number, it is important that police operators tell citizens they are the Police Crime Reporting Unit to differentiate it from other City services.
• The majority also believe:
– they are safe in Charlotte-Mecklenburg overall
– they are safe in their neighborhood
– the CMPD is effective in making Charlotte-Mecklenburg and neighborhoods safer.

24
In Conclusion
• Nevertheless, most adults continue to believe the need for police has increased.
– For Charlotte-Mecklenburg overall, the primary safety concerns are gangs, drugs, break-ins, robberies, assault/violent crime and theft.
– For neighborhoods, the primary safety concerns are break-ins, drugs, theft and robberies.
– For Uptown, the primary safety concerns are robberies, gangs, assault/violent crime, need for more police, theft, and crowd control.

25
In Conclusion
• Although the majority of adults believe the CMPD have been effective in making Uptown safer, there was a slight decline on this measure.
– There was also an increase in perceptions that crowd control is a safety issue for Uptown.
• Most adults believe Uptown is a safe place to visit, work and live.
– However, when asked about safety during different times of day, most adults did not believe Uptown is safe between 10pm and 6am. Uptown residents, who tend to hold the strongest beliefs that Uptown is safe, also did not believe Uptown is safe during this time period.

26
In Conclusion
• The percentage of citizens who come into contact with the CMPD has not changed since last year. About two out of three adults had contact in-person and/or contact by phone with the CMPD.
– Citizens state that personal contact with police has the most influence on their opinions of the police.
– However, word of mouth and TV also are major influences.
• Use of the CMPD Website has increased significantly and more than half of those who have used it, said it has an influence on perceptions of the CMPD.
• Perceptions of policing philosophies indicate that the public wants all forms of policing.
– However, there is stronger support for focusing on long term solutions, crime prevention, and patrolling where repeat crime occurs, than for focusing mostly on making arrests and random patrols.

Detailed Findings for Total Sample

Perceptions of CMPD and CMPD Services

29
26%
26%
23%
45%
44%
47%
18%
19%
21%
8%
6%
10%
2%
0% 25% 50% 75% 100%
2004
2005
2006
9,10=Very Positive 7,8=Positive 5,6=Mid-scale 1-4=Negative Don't know
Overall Perception of the CMPD Total Sample (Q5)
Mean Ratings
7.2
7.3
70%
71%
7.3
70%

30
26%
35%
40%
40%
37%
39%
39%
36%
18%
16%
13%
15%
11%
7%
7%
7%
8%
0% 20% 40% 60% 80% 100%
Q17. Use good judgement in use offorce
Q16. Perform job w/ integrity & honesty
Q15. Are professional
Q14. Are courteous
9,10=Strongly agree 7,8=Agree 5,6=Mid-scale 1-4=Disagree Don't know
Perceptions of the CMPDTotal Sample (Q14-17)
Mean Ratings2004 2005 2006
7.7 7.9 7.8
7.7 7.9 7.8
7.3 7.5 7.5
7.0 7.4 7.0
2006
78% 76%
79% 79%
69% 63%
76% 74%
% Rating 7 to 10 Able to Total Rate * Sample
* “DK” DroppedFrom Base

31
21%
22%
24%
26%
27%
29%
32%
34%
30%
37%
27%
30%
34%
38%
37%
39%
22%
24%
12%
18%
22%
17%
16%
12%
14%
10%
13%
29%
17%8%
12%
8%
13%
6%
8%
6%
10%
8%
6%
4%
0% 20% 40% 60% 80% 100%
Q12. Drug law enforcement
Q9. Crime prevention
Q7. CRU reporting
Q13. Animal control
Q8. Traffic law enforcement
Q11. Work with communities
Q10. Response to emergencies
Q6. 911 Call Center
9,10=Very Good 7,8=Good 5,6=Mid-scale 1-4=Poor Don't know
Perceptions of Services Provided by the CMPDTotal Sample (Q6-13)
Mean Ratings2004 2005 2006
7.1 7.6 7.3
7.4 7.7 7.4
7.0 7.1 7.0
6.9 7.2 6.8
6.9 7.3 7.2
6.7 6.9 6.7
6.1 6.6 7.3
2006
7.6 8.1 7.8
81% 73%
75% 69%
72% 67%
63% 61%
68% 56%
71% 51%
62% 59%
59% 51%
% Rating 7 to 10
Able to Total Rate * Sample
* “DK” Dropped
From Base

Perceptions of Crime & Safety in
Charlotte-Mecklenburg Overall and in Neighborhoods

33
60%
14%
21%
19%
11%
25% 35%
5%
7%
3%
0% 25% 50% 75% 100%
Q19. The needfor police has
increased in pastyear
Q18. Have anadequate number
of police
9,10=Strongly Agree 7,8=Agree 5,6=Mid-scale 1-4=Disagree Don’t know
Perceptions of Need for PoliceTotal Sample (Q18-19)
Mean Rating2005 2006
5.3 5.3
8.5 8.4
2006
33%
81%

34
19%
37%
40%
37%
25%
15%
15%
11%
0% 25% 50% 75% 100%
Q20. Charlotte-Mecklenburg is asafe place to live
Q21. I am safe inneighborhood
where I live
9,10=Strongly agree 7,8=Somewhat agree 5,6=Mid-scale 1-4=Disagree Don't know
Perceptions of SafetyTotal Sample (Q20-21)
Mean Rating2004 2005 2006
7.6 7.6 7.4
6.9 6.9 6.7
74%
59%
2006

35
19% 50% 22% 8% 2%
0% 20% 40% 60% 80% 100%
2006
9,10=Very effective 7,8=Somewhat effective 5,6=Average 1-4=Not Effective Don't know
Effectiveness of CMPD in Making Charlotte-Mecklenburg Safer
Total Sample (Q25)
Mean Rating2005 2006
69%7.1 7.0
In 2005, 68% believed the CMPD was effective in making Charlotte-Mecklenburg safer.

36
27% 36% 20% 12% 5%
0% 25% 50% 75% 100%
2006
9,10=Very Effective 7,8=Somewhat Effective 5,6=Average 1-4=Not Effective Don't know
Mean Rating2004 2005 2006
7.0 7.3 7.1
63%
Effectiveness of CMPD in Working with Your Neighborhood to Solve Problems
Total Sample (Q28)
In 2005, 64% believed the CMPD was effective in working with neighborhoods to solve problems

37
Perceptions of Being Safer, as Safe, or Less Safe than a Year Ago
Total Sample (Q26 & 29)
1%
43%
44%
12%
0% 60%
Don't know
Less safethan a year
ago
As safe as ayear ago
Safer nowthan a year
ago
2006
(Q26) In Charlotte-Mecklenburg Overall
2%
28%
55%
14%
0% 70%
Don't know
Less safethan a year
ago
As safe as ayear ago
Safer nowthan a year
ago
2006
56% 69%
(Q29) In Your Neighborhood
In 2005, 41% believed they were less safe than in the previous year.
In 2005, 29% believed they were less safe than in the previous year.

38
Primary Concerns about Crime and SafetyUnaided, Multiple Answers Allowed
Total Sample (Q27 & 30)
9%
9%
11%
12%
14%
19%
25%
0% 40%
Need more police
Vandalism
Robberies
Theft
Drugs
No concerns
Break-ins
2006
9%
10%
10%
17%
18%
20%
20%
0% 40%
No concerns
Theft
Assault/violent crime
Robberies
Break-ins
Drugs
Gangs
2006
(Q27) For Charlotte-Mecklenburg Overall (Q30) For Your Neighborhood
In 2005, the top concerns were robberies (23%), break-ins (20%), gangs (19%), need for more police
(13%), theft (13%), assault/violent crime (11%), unsafe drivers (11%), child safety at school/bus
stops (10%), and drugs (7%).
In 2005, the top concerns were break-ins (32%), theft (16%), robberies (13%), no concerns (13%), unsafe
drivers (12%), and drugs (10%).
39
Participation in Neighborhood Groups Total Sample (Q31)
Yes37%
No63%
In 2004 and 2005, 33% and 30%, respectively, were active.
2006
40
Primary Reasons for Not Being an Active Member of a Neighborhood Group
Total Sample (Q32)
4%
5%
5%
7%
8%
9%
27%
34%
0% 50%
Not effective/ unorganized
Don't know how/no one asked
New to area/moving from area
Disabled/elderly
Not interested
No reason/DK
Scheduling conflicts/no time
There is no group
2006
Unaided, Multiple Answers Allowed

41
Awareness of AssignedCommunity or Neighborhood Police Officer
Total Sample (Q33)
Yes48%
No52%
In both 2004 and 2005, 47% were aware.
2006

42
Interaction with Police (Not Including 911 Calls) about Neighborhood Problems In Past Year
Total Sample (Q34)
Yes32%
No68%
In 2005, 32% had spoken with an officer in the past year.
2006

Perceptions of Safety in Uptown Charlotte

44
Been to Uptown Charlotte for Any Reason in Past Year
Total Sample (Q38)
Yes84%
No16%
2006

45
Reasons for Being in Uptown Charlottein Past Year
Total Sample (Q39)
16%
5%
13%
15%
20%
34%
38%
49%
60%
0% 75%
Have NOT been Uptown
Live in Uptown area
Other reasons
Use CATS
Shop
Use public library
Work or business
Dine out
Other types of entertainment
2006
In 2005, the following reasons were given for going Uptown: dine out (48%), other types of entertainment (43%), work or business (36%), Bank of America Stadium (31%), Discovery Place (25%), public library (29%), CATS (23%), Bobcat’s Area (16%), ImaginOn (7%), Live
Uptown (5%).
46
21%
27%
31%
36%
40%
40%
23%
21%
15%
13%
10%
6% 7%
3%
8%
0% 25% 50% 75% 100%
Q23. Uptown is asafe place to live
Q22. Uptown is asafe place to visit
Q24. Uptown is asafe place to work
9,10=Strongly agree 7,8=Somewhat agree 5,6=Mid-scale 1-4=Disagree Don't know
Perceptions of Uptown Charlotte as Safe Place to Work, Visit, and Live
Total Sample (Q22-24)
Mean Rating2005 2006
7.7 7.6
7.3 7.2
7.1 6.8
71%
67%
57%
2006

47
TotalSamplen=653
Have BeenUptownn=570*
Have NotBeen
Uptown n=105
LiveUptownn=53*
Work/BusinessUptownn=259*
Q22. Uptown is a safe place to visit 7.2 7.2 7.2 8.3 7.2
Q23. Uptown is a safe place to live 6.8 6.9 6.6 8.1 6.9
Q24. Uptown is a safe place to work 7.6 7.6 7.2 8.5 7.6
Perceptions of Uptown Charlotte as Safe Place to Work, Visit, and Live
(Q22-24)
Mean Ratings 2006
* These segments include data from a targeted over sampling of Uptown residents.

48
23% 42% 20% 6% 9%
0% 25% 50% 75% 100%
2006
9,10=Very effective 7,8=Somewhat effective 5,6=Mid-scale 1-4=Not effective Don't know
Effectiveness of CMPD in Making Uptown SaferTotal Sample (Q35)
Mean Rating2005 2006
7.7 7.3
65%
In 2005, 70% believed the CMPD was effective in making Uptown safer.

49
Mean Ratings 2006
Effectiveness of CMPD in Making Uptown SaferTotal Sample (Q35)
TotalSamplen=653
Have BeenUptownn=570*
Have NotBeen
Uptown n=105
LiveUptownn=53*
Work/BusinessUptownn=259*
Q35. Effectiveness of CMPD in making Uptown safer
7.3 7.3 7.8 8.3 7.3
* These segments include data from a targeted over sampling of Uptown residents.
50
6%
22%
50%
22%
0% 60%
Don't know
Less safe than ayear ago
As safe as a yearago
Safer now than ayear ago
2006
In Uptown Charlotte in 2006
Perceptions of Feeling Safer, as Safe, or Less Safe than a Year Ago . . .
Total Sample (Q36)
72%
In 2005, 22% believed they were less safe than in the previous year.

51
Total Samplen=653
Have BeenUptown n=570*
Have NotBeen
Uptownn=105
LiveUptownn=53*
Work/BusinessUptownn=259*
Safer 22% 22% 23% 29% 22%
As safe 50% 52% 37% 55% 55%
Less safe 22% 23% 20% 15% 22%
Don’t know 6% 3% 20% 2% 2%
Perceptions of Feeling Safer, as Safe, or Less Safe than a Year Ago . . .
(Q36)
In Uptown Charlotte in 2006
* These segments include data from a targeted over sampling of Uptown residents.

52
Primary Concerns about Crime and Safety in Uptown Charlotte in 2006
Total Sample (Q37)
7%
7%
8%
9%
9%
9%
18%
29%
0% 40%
Riots/crowd control
Theft
Need more police
Personal safety
Assault/violent crime
Gangs
Robberies
No Concerns
2006
Unaided, Multiple Answers Allowed
In 2005, the top concerns were robberies (23%), no concerns (15%), theft (12%), need for more police (12%), loitering/panhandling (12%), personal safety in general (12%), assault/violent crime (10%), break-ins (8%), and
gangs (8%).
53
TotalSamplen=653
Have BeenUptownn=570*
Have NotBeen
Uptownn=105
LiveUptownn=53*
Work/BusinessUptownn=259*
No concerns 29% 26% 45% 36% 27%
Robberies 18% 19% 14% 21% 22%
Gangs 9% 9% 5% 2% 8%
Assault/violent crime 9% 10% 2% 4% 8%
Personal safety 9% 9% 7% 2% 10%
Need for more police 8% 8% 7% 8% 5%
Theft 7% 7% 6% 8% 7%
Riots/crowd control 7% 7% 3% 6% 6%
Drugs 5% 6% 1% 2% 6%
Vandalism/property crimes 5% 6% 1% 4% 7%
Traffic issues 5% 5% 2% 4% 7%
Break-ins 5% 5% 5% 4% 4%
Loitering/vagrants/panhandling 5% 6% 2% 15% 8%
Primary Concerns about Crime and Safety in Uptown Charlotte in 2006
(Q37)
* These segments include data from a targeted over sampling of Uptown residents.

54
5%
11%
40%
21%
36%
43%
28%
10%
25% 35%
17%
15%
8%
5%
0% 25% 50% 75% 100%
Q42. Safebetween 10pm &
6am
Q41.Safebetween 6pm &
10pm
Q40. Safebetween 6am &
6pm
9,10=Very safe 7,8=Somewhat safe 5,6=Mid-scale 1-4=Not safe Don't know
Perceptions of Safety in Uptown Charlottein Past Year
Total Sample (Q40-42)
Mean Ratings2006
8.1
In 2005, mean ratings on safety: during daytime hours= 8.7, during evening hours= 6.7
200683%
47%
26%
6.3
5.1

55
2006
Perceptions of Safety in Uptown Charlotte
in Past Year (Q40-42)
In 2005, mean ratings on being safe during daytime hours was: 8.7 for those who had been Uptown 7.6 for those who had not been Uptown.
In 2005, mean ratings on being safe during evening hours was: 6.7 for those who had been Uptown5.4 for those who had not been Uptown.
TotalSamplen=653
Have BeenUptownn=570*
Have NotBeen
Uptown n=105
LiveUptownn=53*
Work/BusinessUptownn=259*
Q40. Safe between 6am & 6pm 8.1 8.2 7.7 8.9 8.3
Q41. Safe between 6pm & 10pm 6.3 6.3 5.8 6.7 6.4
Q42. Safe between 10pm & 6am 5.1 5.1 4.8 5.9 5.3
* These segments include data from a targeted over sampling of Uptown residents.

Crime in Charlotte-Mecklenburg

57
Victims of Any Type of Crime (Respondent/Other Member of Household) in Past Year, Regardless of Whether or Not It Was Reported
Total Sample (Q43 & Q46 COMBINED)
Yes31%
No69%
In 2005, 30% reported being a victim of a crime in the past year.
2006

58
Victims of Crimes (Respondent/Other member of Household) in Past Year
Total Sample (Q43 & Q46)
(Q46) 2006 Property Crime(Q43) 2006 Violent Crime
No93%
Yes7%
In 2005, 6% were victims of a violent crime during the past year.
No72%
Yes28%
In 2005, 27% were victims of a property crime during the past year.

59
Reporting of Crime to CMPDTotal Sample (Q44 & Q47)
In 2005, 27% were victims of a property crimes; 6% did not report the crime.
(Q47) 2006 Property Crimes(Q44) 2006 Violent Crimes
6%
22%
72%
0% 100%
Not victim ofproperty crime
Victim, did notreport
Victim, reported
1%
6%
93%
0% 100%
Not victimof violent
crime
Victim,did notreport
Victim,reported
In 2005, 5% were victims of a violent crimes; 1% did not report the crime.
28% were victims of property crime
7% were victims of violent crime

60
Reasons for NOT reporting crimeUnaided, Multiple Answers Allowed
Total Sample (Q45 & Q48)
13%
13%
13%
13%
13%
13%
25%
0% 80%
Did not know about it until afterhappened
Afraid of retaliation
No answer at 911
Person evicted from complex
Reported to school officer
Police would not be able to catchcriminal
Not worth reporting
3%
3%
5%
5%
9%
14%
62%
0% 80%
Knew who did it
Police came due to alarm
Don't know
Felt it was my fault
Reported to other (e.g., securityguard, bank)
Police would not be able to catchcriminal
Not worth reporting
(Q48) 2006 Property Crimes(Crimes against respondent &/or other member of household)
(Q45) 2006 Violent Crimes(Crimes against respondent &/or other member of household)
New questions for 2006

Interaction with CMPD

62
Interaction with CMPD On Phone Or In PersonQ49 & Q51 Combined to Create New Variable
2006
Yes66%
No/DK34%
In 2005, 64% interacted either on the phone or in person with the CMPD.
63
Interaction with the CMPD On Phone In Past YearTotal Sample (Q49a-f )
(Responses will sum to more than 100% because multiple answers are possible)
48%
8%
7%
13%
17%
21%
28%
0% 100%
No phone contact
Q49f. Other reasons
Q49e. Community activity
Q49d. Traffic violation or accident
Q49c. Call to CRU
Q49b. Called 911- otheremergency
Q49a. Called 911-crime related
2006 Interaction on phone in past year
52% have had phone contact in past year.
In 2005, 29% interacted with the CMPD by calling 911, 26% called the CRU, 3% other type of phone contact, and 55% had no phone contact. In 2005, calling 911 for other emergencies was not specifically asked.
39% of the total sample called 911 for any reason -- crime related reason OR other emergencies.Note: These cannot be added because some respondents called for both reasons.

64
Interaction with the CMPD In Person In Past YearTotal Sample (Q51a-f)
(Responses will sum to more than 100% because multiple answers are possible)
2006 Interaction in person in past year
48%
11%
19%
17%
16%
17%
14%
0% 100%
No in person contact
Q51f. Other reasons
Q51e. Community activity
Q51d. Traffic violation oraccident
Q51c. Other emergency
Q51b. Crime related, non victims
Q51a. Victim of crime
52% have had contact in person with CMPD in past year.
2005 in-person interaction: 12% victim of crime, 4% file report or complaint, 9% other emergencies, 18% traffic or accident, 15% community activity, 8% other reasons. Categories were slightly different last year. 48% had in person contact, 52% had no in person contact. Categories are not mutually exclusive, a respondent could choose multiple answers.
25% of the total sample interacted with police in person because they were a victim or for some other crime related reason. Note: These cannot be added because some respondents interacted for both reasons.

65
Non-Emergency Reporting (Regardless of Outcome) Was The Time To Handle Report Satisfactory
Base=Respondents who called CRU (non-emergency reporting) n=109 (Q50)
2006
Yes72%
No/DK28%
In 2005, 65% who called in past year reported that call was handled in a timely manner.
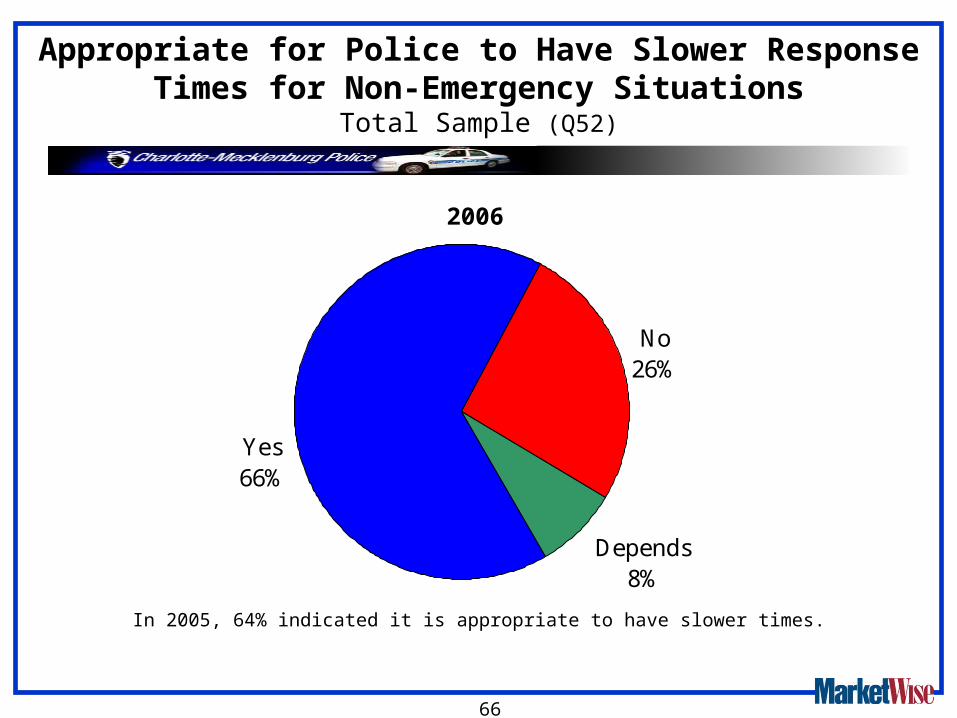
66
Appropriate for Police to Have Slower Response Times for Non-Emergency Situations
Total Sample (Q52)
2006
Depends8%
No26%
Yes66%
In 2005, 64% indicated it is appropriate to have slower times.

Sources that Shape Perceptions of the CMPD
68
16% 22%
22%
25%
21%
28%
22%22%
27%
26%
28%
24% 5%
8%
2%
0% 25% 50% 75% 100%
Q59. TV
Q58. Radio
Q57. Newspapers
9,10=Major influence 7,8=Influence 5,6=Mid-scale 1-4=Not an influence Don't know
Perceived Influence of Media on Opinions of CMPD
Total Sample (Q57-59)
Mean Ratings20062006
6.2
5.5
6.5
* Many of these questions were not asked in 2005 or were asked differently and can not be directly compared.

69
26%
15%
14%
20%
27%
20%
8%
11%
32%
18%
19%
24%
25%
26%
12%
14%
21%
22%
19%
17%
17%
14%
17%
13%
14%
28%
13%
11%
28%
27%
23%
20%
18%
20%
29%
31% 30%
40%
13%
12%
26%
17%
21% 21%
13%
18%
16%
19%
27%
38%
21%
16%
11%
7%
22%
0% 25% 50% 75% 100%
Q70. CMPD guest column editorials in newspapers
Q69. Word of mouth
Q68. Personal interaction
Q67. City council meetings
Q66. Police brochures
Q65. CMPD Website
Q64. Events such as Festival in Park
Q63. Police meeting w/community grps
Q62. Neighborhood newsletters
Q61. Cmail, city electronic newsletter
Q60. CMPD Today
9,10=Major influence 7,8=Influence 5,6=Mid-scale 1-4=Not an influence Don't know
Perceived Influence of Other Sources on Opinions of CMPD
Total Sample (Q60-76)
Mean Ratings 2005 20062006
4.9
4.6
6.3
6.7
6.2
5.7
5.5
4.6 5.4
7.2 7.6
5.8 6.8
5.3
Note: All respondents are included in the base for this analysis.

Use and Perceptions of the CMPD Website
71
CMPD WebsiteTotal Sample (Q53 & Q54)
(Q54) Been to CMPD Website for any reasonTotal Sample
No Internet Access
30%
No47%
Yes23%
In 2005, 18% of respondents had been to the Website.
(Q53) Access to InternetTotal Sample
No30%
Yes70%
Not asked in 2005.
2006

72
2%
7%
20%
45%
26%
0% 60%
Don't know
1-4=Poor
5,6=Mid-scale
7,8=SomewhatGood
9,10=ExtremelyGood
Perception of CMPD WebsiteAmong Respondents Who Have Been to Site (Q55)
Mean Rating20067.4
2006
Note: Respondents who have not been to Website are not included in this analysis.

73
18%
28%
37%
17%
0% 60%
1-4=No influence
5,6=Mid-scale
7,8=Someinfluence
9,10=Majorinfluence
Perception of CMPD WebsiteOn Opinion of CMPD
Among Respondents Who Have Been to Site (Q65)
2006 Mean Ratings 2005 2006 5.4 6.4
Note: Respondents who have not been to Website are not included in this analysis.

74
67%
72%
77%
78%
79%
81%
85%
0% 100%
Traffic reports
Homeland Securityinfo
Latest news frompolice dept.
Ability to file crimereport
Ability to obtain crimereport
Crime statistics
Crime prevention info
Features that are Very Important to Have on CMPD Website
Total Sample (Q56)
2006
Respondents were also asked to name any other types of information they would like on the Website. No additional answers were given by 5% or more of the respondents, so they are not shown.

Perceptions of Policing Philosophies

76
47%
61%
63%
35%
30%
24%
15%
13%
62%
47% 31%
28%
8%
7%
6%
7%
4%
3%
4%
0% 25% 50% 75% 100%
Q72. Focus primarily on officers arrestingpeople who break laws
Q74. Focus on locations where repeatcrimes occur not random patrols
Q73. Emphasize partnership where citizensshare responsibility for safe city
Q75. Place heavy emphasis on preventingcrimes before they occur
Q71. Place strong emphasis on long termsolutions
9,10=Agree strongly 7,8=Agree somewhat 5,6=Mid-scale 1-4=Disagree Don't know
Agreement with Statements About Policing Philosophies
Total Sample (Q71-75)
Mean Rating2005 2006
8.6 8.6
2006
8.7 8.7
8.8 8.8
8.1 8.1
8.1 8.0
Effective policing should . . .

Respondent Profile

78
Race/Ethnicity & Gender Total Sample (Q2 & Q2b)
2%
33%
57%
9%
0% 100%
Some other race
Black or AfricanAmerican
Hispanic or Latino ofany race
White
(Q2) Race/Ethnicity2006
(Q2b) Age
22%
45%
16%
17%
0% 100%
65%
55+
35-54
18-34

79
Gender & EducationTotal Sample(Q3 & Q77)
8%
23%
24%
31%
14%
0% 100%
Less thanHS
HS grad
Somecollege orvocational
Collegegrad
Gradschool
(Q77) Education2006
(Q3) Gender
Male49%
Female51%

80
Employment Status and Marital Status Total Sample (Q78 & Q79)
25%
11%
12%
52%
0% 100%
Single
Widowed
Separated/Divorced
Married
(Q79) Marital Status2006
(Q78) Employment
3%
1%
6%
6%
19%
9%
57%
0% 100%
Not employed
Student
Disabled
Homemaker
Retired
Employed parttime
Employed fulltime

81
Children in Household and & Type of HomeTotal Sample (Q80 & Q81)
2006(Q80) Children in Household
61%
38%
0% 100%
No
Yes
(Q81) Type of Home
2%
15%
9%
74%
0% 100%
Other
Apartment
Townhomeor condo
Detached,single family

82
15%
12%
14%
21%
21%
18%
0% 100%
$100K+
$80K to < $100K
$60K to < $80K
$40K to < $60K
$20K to < $40K
< $20K
Income & Years in Charlotte or Mecklenburg CountyTotal Sample (Q83 & Q4)
Income(Refusals dropped from base, n=556)
2006
49%
20%
13%
10%
8%
0% 100%
< 3
3 to 5
6 to 10
11 to20
20+years
Years Lived in Charlotte or Mecklenburg County