2008 annual report online - american psychological · pdf file*based on the programs that...
TRANSCRIPT

COMMISSION ON ACCREDITATION 2008 ANNUAL REPORT ONLINE SUMMARY DATA: INTERNSHIP PROGRAMS

INTRODUCTION
The Annual Report was created in 1998 to provide the American Psychological Association’s Commission on Accreditation (CoA) more in-depth information in between full programmatic reviews. In order to maintain accreditation from one year to the next, programs must submit detailed information in the Annual Report. In previous years, the Annual Report was submitted in paper format; however, as of 2003 all submissions were required to be completed online. Since that time, programs have submitted their information via the Annual Report Online (ARO). The ARO requires programs to submit data about their supervisors and interns, as well as information on the program as a whole. This document provides a summary of the data provided on the 2007-2008 academic year.
In the past, summary reports such as this were printed and provided annually to our constituents, professional psychology organizations, and to members of the public upon request. However, the CoA believes that these data will be better available to public electronically. Accordingly, from this point forward, all annual summary reports will be solely provided on the public website of the Office of Program Consultation and Accreditation (OPCA).
The data are provided in three main sections. First we provide data on the program as a whole. This includes items such as program frequencies and annual stipends for full-time interns. The second section provides data on interns. You can find demographic information and professional activities here. The last section summarizes data on supervisors. This is where demographic and professional activities can be found.
To better understand the data, we encourage you, as the reader and consumer, to use the information provided for your own analyses. We hope that this will facilitate better understanding of the changes occurring in our field now and in the future. If you have any questions or concerns about the data, please do not hesitate to contact the OPCA.
Table of Contents
I. Program Level Data 1
A. Program & Interns 2
B. Stipends 3
II. Intern Level Data 4
A. Gender & Race/Ethnicity
1. Community Mental Health Center Programs 5
2. Consortium Programs 6
3. Correctional Facility Programs 7
4. General Hospital Programs 8
5. Health Maintenance Organization Programs 9
6. Medical Center Programs 10
7. Medical School Programs 11
8. Military Medical Center Programs 12
9. Private General Hospital Programs 13
10. Private Psychiatric Hospital Programs 14
11.School District or System Programs 15
12. State or County Hospital Programs 16
13. University Counseling Center Programs 17
14. Veterans Affairs Medical Center Programs 18
15. Other Programs 19
16. All Accredited Programs 20
B. Incoming Practicum Hours 21
^Table titles are hyperlinks to the tables within this document

C. Professional Activities
1. Question Wording 24
2. Data Table 25
D. Initial Employment Setting
1. Community Mental Health Center Programs 28
2. Consortium Programs 29
3. Correctional Facility Programs 30
4. General Hospital Programs 31
5. Health Maintenance Organization Programs 32
6. Medical Center Programs 33
7. Medical School Programs 34
8. Military Medical Center Programs 35
9. Private General Hospital Programs 36
10. Private Psychiatric Hospital Programs 37
11.School District or System Programs 38
12. State or County Hospital Programs 39
13. University Counseling Center Programs 40
14. Veterans Affairs Medical Center Programs 41
15. Other Programs 42
16. All Accredited Programs 43
^Table titles are hyperlinks to the tables within this document

E. Initial Employment Activity
1. Community Mental Health Center Programs 44
2. Consortium Programs 44
3. Correctional Facility Programs 45
4. General Hospital Programs 45
5. Health Maintenance Organization Programs 46
6. Medical Center Programs 46
7. Medical School Programs 47
8. Military Medical Center Programs 47
9. Private General Hospital Programs 48
10. Private Psychiatric Hospital Programs 48
11.School District or System Programs 49
12. State or County Hospital Programs 49
13. University Counseling Center Programs 50
14. Veterans Affairs Medical Center Programs 50
15. Other Programs 51
16. All Accredited Programs 51
III. Supervisor Level Data 52
A. Gender & Race Ethnicity
1. Community Mental Health Center Programs 53
2. Consortium Programs 54
3. Correctional Facility Programs 55
4. General Hospital Programs 56
5. Health Maintenance Organization Programs 57
^Table titles are hyperlinks to the tables within this document

6. Medical Center Programs 58
7. Medical School Programs 59
8. Military Medical Center Programs 60
9. Private General Hospital Programs 61
10. Private Psychiatric Hospital Programs 62
11.School District or System Programs 63
12. State or County Hospital Programs 64
13. University Counseling Center Programs 65
14. Veterans Affairs Medical Center Programs 66
15. Other Programs 67
16. All Accredited Programs 68
B. Classifications
1. Definitions 69
2. Data Tables 70
C. Qualifications
1. Qualifications 73
2. Degree Area of Expertise 77
D. Professional Activities
1. Question Wording 80
2. Data Tables 81
IV. Final Comments 84
^Table titles are hyperlinks to the tables within this document

SECTION I: PROGRAM LEVEL DATA
1

N Interns Mean Median Std. Deviation Minimum MaximumCommunity Mental Health Center 65 288 4.43 4 1.98 0 11Consortium 38 368 9.68 7 11.66 0 72Correctional Facility 12 50 4.17 4 1.53 3 8General Hospital 7 29 4.14 4 1.35 2 6Health Maintenance Organization 2 6 3.00 3 0.00 3 3Medical Center 47 317 6.74 6 4.40 3 22Medical School 32 201 6.28 6 3.00 2 14Military Medical Center 10 52 5.20 5 1.69 3 9Private General Hospital 11 72 6.55 5 4.08 3 14Private Psychiatric Hospital 11 69 6.27 6 3.23 3 14School District or System 7 35 5.00 6 3.46 0 11State or County Hospital 41 160 3.90 4 1.51 1 10University Counseling Center 95 340 3.58 3 1.29 0 9Veterans Affairs Medical Center 71 364 5.13 4 2.55 2 14Other 16 94 5.88 5 6.13 0 27Total 465 2,445 5.26 4 4.51 0 72
*Based on the programs that completed the 2008 Annual Report Online
I-A. Programs and Interns*Intern Descriptives
N ProgramsSetting
2008 Internship - Program Level Data
2

I-B. Stipends* (in US Dollars)
Program Setting Programs (N) Mean (N)Median
($)Std. Dev. ($) Min ($) Max ($)
Community Mental Health Center 64 20,684 19,999 4,747 14,400 45,000Consortium 36 20,935 21,050 4,271 11,000 33,000Correctional Facility 12 39,496 45,866 12,357 18,000 49,700General Hospital 6 23,525 23,632 2,834 20,000 27,000Health Maintenance Organization 2 19,000 19,000 0 19,000 19,000Medical Center 46 22,827 23,306 3,412 17,000 30,500Medical School 32 22,660 22,000 5,112 15,500 44,067Military Medical Center 10 47,833 54,582 18,036 14,000 65,000Private General Hospital 11 20,588 20,000 2,315 17,500 24,000Private Psychiatric Hospital 11 20,888 20,800 1,947 18,000 24,000School District or System 7 26,236 25,000 4,519 21,000 34,000State or County Hospital 41 24,832 25,197 6,575 14,500 40,740University Counseling Center 93 22,904 23,600 2,679 17,000 30,475Veterans Affairs Medical Center 70 23,829 23,502 1,031 21,898 26,186Other 15 24,050 22,000 12,007 15,000 65,500Total 456 23,686 22,898 7,091 11,000 65,500
*Minimum stipend for full-time interns
2008 Internship - Program Level Data
3

SECTION II: INTERN LEVEL DATA
4

II-A-1. Intern Gender & Race/Ethnicity Community Mental Health Center Internship Programs (N=65)
Mean Median Std. Dev. Min MaxFemale 10 3.47 0.15 0.00 0.40 0 2Male 2 0.69 0.03 0.00 0.17 0 1Total 12 4.17 0.18 0.00 0.43 0 2Female 0 0.00 0.00 0.00 0.00 0 0Male 0 0.00 0.00 0.00 0.00 0 0Total 0 0.00 0.00 0.00 0.00 0 0Female 18 6.25 0.28 0.00 0.72 0 4Male 5 1.74 0.08 0.00 0.27 0 1Total 23 7.99 0.35 0.00 0.74 0 4Female 162 56.25 2.49 2.00 1.60 0 6Male 41 14.24 0.63 0.00 0.80 0 3Total 203 70.49 3.12 3.00 1.73 0 9Female 30 10.42 0.46 0.00 0.81 0 4Male 3 1.04 0.05 0.00 0.21 0 1Total 33 11.46 0.51 0.00 0.97 0 5Female 13 4.51 0.20 0.00 0.44 0 2Male 2 0.69 0.03 0.00 0.17 0 1Total 15 5.21 0.23 0.00 0.46 0 2Female 0 0.00 0.00 0.00 0.00 0 0Male 0 0.00 0.00 0.00 0.00 0 0Total 0 0.00 0.00 0.00 0.00 0 0Female 0 0.00 0.00 0.00 0.00 0 0Male 0 0.00 0.00 0.00 0.00 0 0Total 0 0.00 0.00 0.00 0.00 0 0Female 1 0.35 0.02 0.00 0.12 0 1Male 1 0.35 0.02 0.00 0.12 0 1Total 2 0.69 0.03 0.00 0.17 0 1Female 234 81.25 3.60 3.00 1.81 0 9Male 54 18.75 0.83 1.00 0.82 0 3Total 288 100.00 4.43 4.00 1.98 0 11
Race/Ethnicity Gender N Interns% of All Interns
Program Level Statistics
African American - Black
American Indian - Alaska Native
Asian - Pacific Islander
Total
*Accredited Canadian programs are not required to provide the race/ethnicity of interns.
Caucasian
Hispanic - Latino
Multi-Ethnic
Other
Interns at Canadian Institutions*
Not Reported
2008 Internship - Intern Level Data
5

II-A-2. Intern Gender & Race/Ethnicity Consortium Internship Programs (N=38)
Mean Mdn. Std. Dev. Min MaxFemale 26 7.07 0.68 0.00 1.14 0 6Male 4 1.09 0.11 0.00 0.31 0 1Total 30 8.15 0.79 0.00 1.17 0 6Female 3 0.82 0.08 0.00 0.27 0 1Male 2 0.54 0.05 0.00 0.23 0 1Total 5 1.36 0.13 0.00 0.34 0 1Female 21 5.71 0.55 0.00 0.83 0 3Male 6 1.63 0.16 0.00 0.55 0 3Total 27 7.34 0.71 0.00 1.14 0 5Female 188 51.09 4.95 4.00 6.68 0 41Male 77 20.92 2.03 2.00 2.58 0 14Total 265 72.01 6.97 5.00 8.98 0 55Female 16 4.35 0.42 0.00 0.95 0 4Male 2 0.54 0.05 0.00 0.23 0 1Total 18 4.89 0.47 0.00 1.03 0 4Female 14 3.80 0.37 0.00 0.82 0 4Male 1 0.27 0.03 0.00 0.16 0 1Total 15 4.08 0.39 0.00 0.95 0 5Female 0 0.00 0.00 0.00 0.00 0 0Male 0 0.00 0.00 0.00 0.00 0 0Total 0 0.00 0.00 0.00 0.00 0 0Female 7 1.90 0.18 0.00 1.14 0 7Male 1 0.27 0.03 0.00 0.16 0 1Total 8 2.17 0.21 0.00 1.30 0 8Female 0 0.00 0.00 0.00 0.00 0 0Male 0 0.00 0.00 0.00 0.00 0 0Total 0 0.00 0.00 0.00 0.00 0 0Female 275 74.73 7.24 5.00 8.83 0 54Male 93 25.27 2.45 2.00 3.15 0 18Total 368 100.00 9.68 6.50 11.66 0 72
Race/Ethnicity Gender N Interns% of All Interns
Program Level Statistics
Total
*Accredited Canadian programs are not required to provide the race/ethnicity of interns.
Other
Interns at Canadian Institutions*
Not Reported
African American - Black
American Indian - Alaska Native
Asian - Pacific Islander
Caucasian
Hispanic - Latino
Multi-Ethnic
2008 Internship - Intern Level Data
6
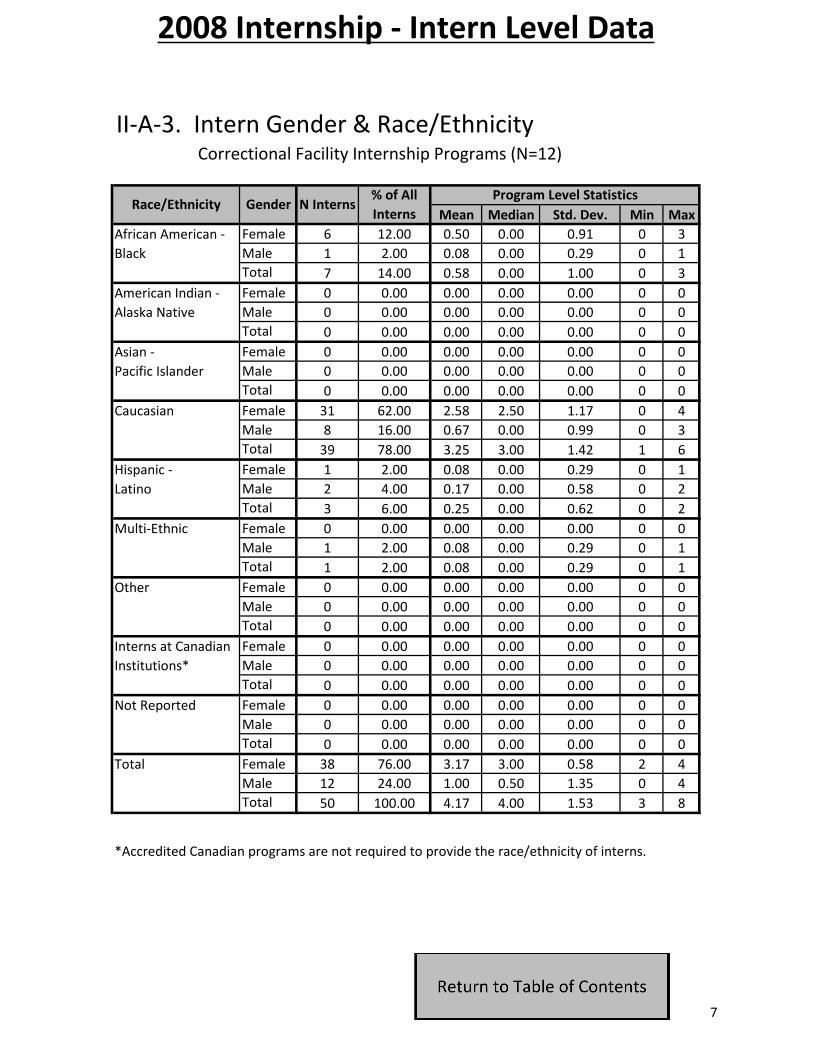
II-A-3. Intern Gender & Race/Ethnicity Correctional Facility Internship Programs (N=12)
Mean Median Std. Dev. Min MaxFemale 6 12.00 0.50 0.00 0.91 0 3Male 1 2.00 0.08 0.00 0.29 0 1Total 7 14.00 0.58 0.00 1.00 0 3Female 0 0.00 0.00 0.00 0.00 0 0Male 0 0.00 0.00 0.00 0.00 0 0Total 0 0.00 0.00 0.00 0.00 0 0Female 0 0.00 0.00 0.00 0.00 0 0Male 0 0.00 0.00 0.00 0.00 0 0Total 0 0.00 0.00 0.00 0.00 0 0Female 31 62.00 2.58 2.50 1.17 0 4Male 8 16.00 0.67 0.00 0.99 0 3Total 39 78.00 3.25 3.00 1.42 1 6Female 1 2.00 0.08 0.00 0.29 0 1Male 2 4.00 0.17 0.00 0.58 0 2Total 3 6.00 0.25 0.00 0.62 0 2Female 0 0.00 0.00 0.00 0.00 0 0Male 1 2.00 0.08 0.00 0.29 0 1Total 1 2.00 0.08 0.00 0.29 0 1Female 0 0.00 0.00 0.00 0.00 0 0Male 0 0.00 0.00 0.00 0.00 0 0Total 0 0.00 0.00 0.00 0.00 0 0Female 0 0.00 0.00 0.00 0.00 0 0Male 0 0.00 0.00 0.00 0.00 0 0Total 0 0.00 0.00 0.00 0.00 0 0Female 0 0.00 0.00 0.00 0.00 0 0Male 0 0.00 0.00 0.00 0.00 0 0Total 0 0.00 0.00 0.00 0.00 0 0Female 38 76.00 3.17 3.00 0.58 2 4Male 12 24.00 1.00 0.50 1.35 0 4Total 50 100.00 4.17 4.00 1.53 3 8
Race/Ethnicity Gender
Caucasian
Hispanic - Latino
Multi-Ethnic
Other
Interns at Canadian Institutions*
Not Reported
N Interns% of All Interns
Program Level Statistics
African American - Black
American Indian - Alaska Native
Asian - Pacific Islander
Total
*Accredited Canadian programs are not required to provide the race/ethnicity of interns.
2008 Internship - Intern Level Data
7

II-A-4. Intern Gender & Race/Ethnicity General Hospital Internship Programs (N=7)
Mean Median Std. Dev. Min MaxFemale 2 6.90 0.29 0.00 0.49 0 1Male 0 0.00 0.00 0.00 0.00 0 0Total 2 6.90 0.29 0.00 0.49 0 1Female 0 0.00 0.00 0.00 0.00 0 0Male 0 0.00 0.00 0.00 0.00 0 0Total 0 0.00 0.00 0.00 0.00 0 0Female 1 3.45 0.14 0.00 0.38 0 1Male 0 0.00 0.00 0.00 0.00 0 0Total 1 3.45 0.14 0.00 0.38 0 1Female 12 41.38 1.71 1.00 1.80 0 5Male 4 13.79 0.57 0.00 0.79 0 2Total 16 55.17 2.29 2.00 2.14 0 5Female 1 3.45 0.14 0.00 0.38 0 1Male 0 0.00 0.00 0.00 0.00 0 0Total 1 3.45 0.14 0.00 0.38 0 1Female 0 0.00 0.00 0.00 0.00 0 0Male 0 0.00 0.00 0.00 0.00 0 0Total 0 0.00 0.00 0.00 0.00 0 0Female 0 0.00 0.00 0.00 0.00 0 0Male 0 0.00 0.00 0.00 0.00 0 0Total 0 0.00 0.00 0.00 0.00 0 0Female 7 24.14 1.00 0.00 1.73 0 4Male 1 3.45 0.14 0.00 0.38 0 1Total 8 27.59 1.14 0.00 1.95 0 4Female 1 3.45 0.14 0.00 0.38 0 1Male 0 0.00 0.00 0.00 0.00 0 0Total 1 3.45 0.14 0.00 0.38 0 1Female 24 82.76 3.43 3.00 1.51 2 6Male 5 17.24 0.71 1.00 0.76 0 2Total 29 100.00 4.14 4.00 1.35 2 6
African American - Black
American Indian - Alaska Native
Asian - Pacific Islander
Caucasian
Hispanic - Latino
Multi-Ethnic
Race/Ethnicity Gender N Interns% of All Interns
Program Level Statistics
Other
Interns at Canadian Institutions*
Not Reported
Total
*Accredited Canadian programs are not required to provide the race/ethnicity of interns.
2008 Internship - Intern Level Data
8

II-A-5. Intern Gender & Race/Ethnicity Health Maintenance Organization Internship Programs (N=2)
Mean Median Std. Dev. Min MaxFemale 0 0.00 0.00 0.00 0.00 0 0Male 0 0.00 0.00 0.00 0.00 0 0Total 0 0.00 0.00 0.00 0.00 0 0Female 0 0.00 0.00 0.00 0.00 0 0Male 0 0.00 0.00 0.00 0.00 0 0Total 0 0.00 0.00 0.00 0.00 0 0Female 0 0.00 0.00 0.00 0.00 0 0Male 0 0.00 0.00 0.00 0.00 0 0Total 0 0.00 0.00 0.00 0.00 0 0Female 3 50.00 1.50 1.50 0.71 1 2Male 0 0.00 0.00 0.00 0.00 0 0Total 3 50.00 1.50 1.50 0.71 1 2Female 2 33.33 1.00 1.00 1.41 0 2Male 0 0.00 0.00 0.00 0.00 0 0Total 2 33.33 1.00 1.00 1.41 0 2Female 1 16.67 0.50 0.50 0.71 0 1Male 0 0.00 0.00 0.00 0.00 0 0Total 1 16.67 0.50 0.50 0.71 0 1Female 0 0.00 0.00 0.00 0.00 0 0Male 0 0.00 0.00 0.00 0.00 0 0Total 0 0.00 0.00 0.00 0.00 0 0Female 0 0.00 0.00 0.00 0.00 0 0Male 0 0.00 0.00 0.00 0.00 0 0Total 0 0.00 0.00 0.00 0.00 0 0Female 0 0.00 0.00 0.00 0.00 0 0Male 0 0.00 0.00 0.00 0.00 0 0Total 0 0.00 0.00 0.00 0.00 0 0Female 6 100.00 3.00 3.00 0.00 3 3Male 0 0.00 0.00 0.00 0.00 0 0Total 6 100.00 3.00 3.00 0.00 3 3
N Interns% of All Interns
Program Level Statistics
African American - Black
American Indian - Alaska Native
Asian - Pacific Islander
Race/Ethnicity Gender
Caucasian
Hispanic - Latino
Multi-Ethnic
Other
Interns at Canadian Institutions*
Not Reported
Total
*Accredited Canadian programs are not required to provide the race/ethnicity of interns.
2008 Internship - Intern Level Data
9

II-A-6. Intern Gender & Race/Ethnicity Medical Center Internship Programs (N=47)
Mean Median Std. Dev. Min MaxFemale 18 5.68 0.38 0.00 0.57 0 2Male 1 0.32 0.02 0.00 0.15 0 1Total 19 5.99 0.40 0.00 0.58 0 2Female 0 0.00 0.00 0.00 0.00 0 0Male 0 0.00 0.00 0.00 0.00 0 0Total 0 0.00 0.00 0.00 0.00 0 0Female 14 4.42 0.30 0.00 0.55 0 2Male 3 0.95 0.06 0.00 0.25 0 1Total 17 5.36 0.36 0.00 0.64 0 2Female 166 52.37 3.53 3.00 3.10 0 15Male 56 17.67 1.19 1.00 1.33 0 5Total 222 70.03 4.72 4.00 3.79 0 19Female 26 8.20 0.55 0.00 0.93 0 5Male 6 1.89 0.13 0.00 0.45 0 2Total 32 10.09 0.68 0.00 1.22 0 7Female 10 3.15 0.21 0.00 0.51 0 2Male 0 0.00 0.00 0.00 0.00 0 0Total 10 3.15 0.21 0.00 0.51 0 2Female 0 0.00 0.00 0.00 0.00 0 0Male 0 0.00 0.00 0.00 0.00 0 0Total 0 0.00 0.00 0.00 0.00 0 0Female 14 4.42 0.30 0.00 0.93 0 4Male 1 0.32 0.02 0.00 0.15 0 1Total 15 4.73 0.32 0.00 1.00 0 4Female 1 0.32 0.02 0.00 0.15 0 1Male 1 0.32 0.02 0.00 0.15 0 1Total 2 0.63 0.04 0.00 0.29 0 2Female 249 78.55 5.30 4.00 3.45 2 18Male 68 21.45 1.45 1.00 1.47 0 6Total 317 100.00 6.74 6.00 4.40 3 22
N Interns% of All Interns
Program Level Statistics
African American - Black
American Indian - Alaska Native
Asian - Pacific Islander
Caucasian
Hispanic - Latino
Multi-Ethnic
Race/Ethnicity Gender
Other
Interns at Canadian Institutions*
Not Reported
Total
*Accredited Canadian programs are not required to provide the race/ethnicity of interns.
2008 Internship - Intern Level Data
10
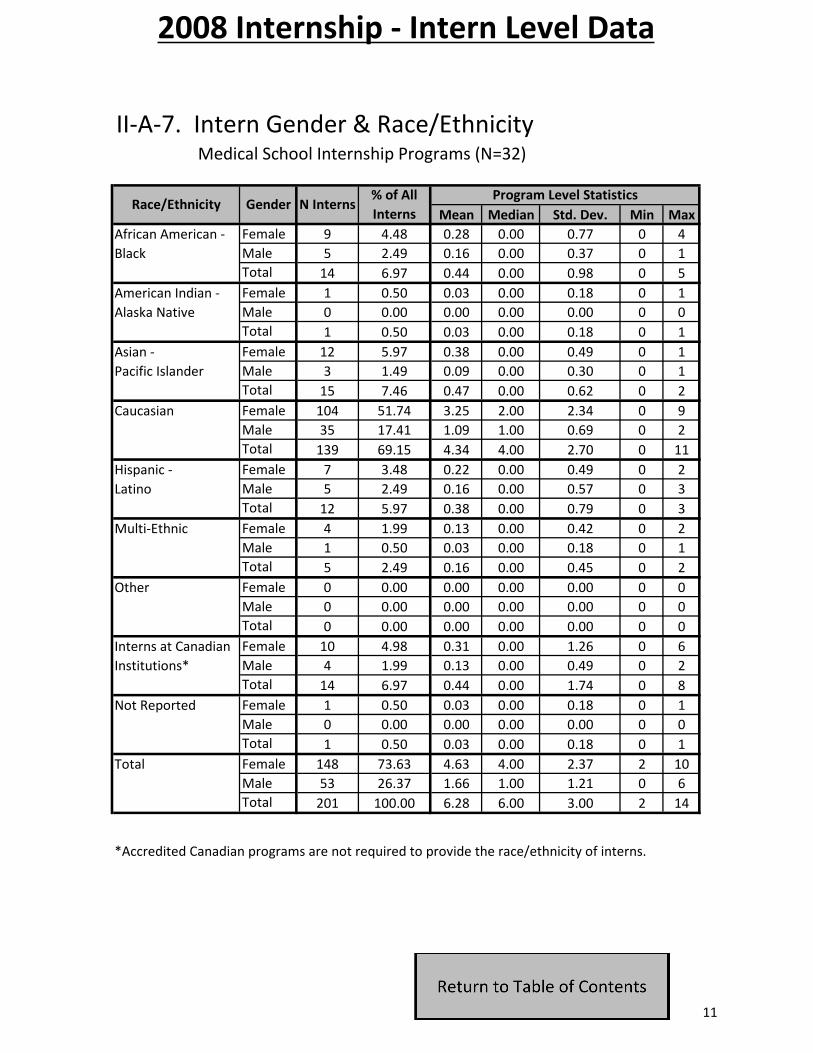
II-A-7. Intern Gender & Race/Ethnicity Medical School Internship Programs (N=32)
Mean Median Std. Dev. Min MaxFemale 9 4.48 0.28 0.00 0.77 0 4Male 5 2.49 0.16 0.00 0.37 0 1Total 14 6.97 0.44 0.00 0.98 0 5Female 1 0.50 0.03 0.00 0.18 0 1Male 0 0.00 0.00 0.00 0.00 0 0Total 1 0.50 0.03 0.00 0.18 0 1Female 12 5.97 0.38 0.00 0.49 0 1Male 3 1.49 0.09 0.00 0.30 0 1Total 15 7.46 0.47 0.00 0.62 0 2Female 104 51.74 3.25 2.00 2.34 0 9Male 35 17.41 1.09 1.00 0.69 0 2Total 139 69.15 4.34 4.00 2.70 0 11Female 7 3.48 0.22 0.00 0.49 0 2Male 5 2.49 0.16 0.00 0.57 0 3Total 12 5.97 0.38 0.00 0.79 0 3Female 4 1.99 0.13 0.00 0.42 0 2Male 1 0.50 0.03 0.00 0.18 0 1Total 5 2.49 0.16 0.00 0.45 0 2Female 0 0.00 0.00 0.00 0.00 0 0Male 0 0.00 0.00 0.00 0.00 0 0Total 0 0.00 0.00 0.00 0.00 0 0Female 10 4.98 0.31 0.00 1.26 0 6Male 4 1.99 0.13 0.00 0.49 0 2Total 14 6.97 0.44 0.00 1.74 0 8Female 1 0.50 0.03 0.00 0.18 0 1Male 0 0.00 0.00 0.00 0.00 0 0Total 1 0.50 0.03 0.00 0.18 0 1Female 148 73.63 4.63 4.00 2.37 2 10Male 53 26.37 1.66 1.00 1.21 0 6Total 201 100.00 6.28 6.00 3.00 2 14
Interns at Canadian Institutions*
Not Reported
Total
N Interns% of All Interns
Program Level Statistics
African American - Black
American Indian - Alaska Native
Asian - Pacific Islander
Race/Ethnicity Gender
*Accredited Canadian programs are not required to provide the race/ethnicity of interns.
Caucasian
Hispanic - Latino
Multi-Ethnic
Other
2008 Internship - Intern Level Data
11

II-A-8. Intern Gender & Race/Ethnicity Military Medical Center Internship Programs (N=10)
Mean Median Std. Dev. Min MaxFemale 7 13.46 0.70 1.00 0.68 0 2Male 1 1.92 0.10 0.00 0.32 0 1Total 8 15.38 0.80 1.00 0.63 0 2Female 0 0.00 0.00 0.00 0.00 0 0Male 0 0.00 0.00 0.00 0.00 0 0Total 0 0.00 0.00 0.00 0.00 0 0Female 1 1.92 0.10 0.00 0.32 0 1Male 0 0.00 0.00 0.00 0.00 0 0Total 1 1.92 0.10 0.00 0.32 0 1Female 21 40.38 2.10 2.00 1.10 1 4Male 17 32.69 1.70 2.00 1.34 0 3Total 38 73.08 3.80 4.00 0.92 2 5Female 4 7.69 0.40 0.00 0.52 0 1Male 1 1.92 0.10 0.00 0.32 0 1Total 5 9.62 0.50 0.00 0.71 0 2Female 0 0.00 0.00 0.00 0.00 0 0Male 0 0.00 0.00 0.00 0.00 0 0Total 0 0.00 0.00 0.00 0.00 0 0Female 0 0.00 0.00 0.00 0.00 0 0Male 0 0.00 0.00 0.00 0.00 0 0Total 0 0.00 0.00 0.00 0.00 0 0Female 0 0.00 0.00 0.00 0.00 0 0Male 0 0.00 0.00 0.00 0.00 0 0Total 0 0.00 0.00 0.00 0.00 0 0Female 0 0.00 0.00 0.00 0.00 0 0Male 0 0.00 0.00 0.00 0.00 0 0Total 0 0.00 0.00 0.00 0.00 0 0Female 33 63.46 3.30 3.00 2.06 1 6Male 19 36.54 1.90 3.00 1.45 0 3Total 52 100.00 5.20 5.00 1.69 3 9
Race/Ethnicity Gender N Interns
*Accredited Canadian programs are not required to provide the race/ethnicity of interns.
% of All Interns
Program Level Statistics
African American - Black
American Indian - Alaska Native
Asian - Pacific Islander
Caucasian
Hispanic - Latino
Multi-Ethnic
Other
Interns at Canadian Institutions*
Not Reported
Total
2008 Internship - Intern Level Data
12

II-A-9. Intern Gender & Race/Ethnicity Private General Hospital Internship Programs (N=11)
Mean Median Std. Dev. Min MaxFemale 6 8.33 0.55 0.00 0.82 0 2Male 0 0.00 0.00 0.00 0.00 0 0Total 6 8.33 0.55 0.00 0.82 0 2Female 0 0.00 0.00 0.00 0.00 0 0Male 0 0.00 0.00 0.00 0.00 0 0Total 0 0.00 0.00 0.00 0.00 0 0Female 3 4.17 0.27 0.00 0.47 0 1Male 0 0.00 0.00 0.00 0.00 0 0Total 3 4.17 0.27 0.00 0.47 0 1Female 48 66.67 4.36 3.00 3.08 1 9Male 9 12.50 0.82 1.00 0.60 0 2Total 57 79.17 5.18 4.00 3.19 2 10Female 2 2.78 0.18 0.00 0.41 0 1Male 0 0.00 0.00 0.00 0.00 0 0Total 2 2.78 0.18 0.00 0.40 0 1Female 3 4.17 0.27 0.00 0.65 0 2Male 0 0.00 0.00 0.00 0.00 0 0Total 3 4.17 0.27 0.00 0.65 0 2Female 0 0.00 0.00 0.00 0.00 0 0Male 0 0.00 0.00 0.00 0.00 0 0Total 0 0.00 0.00 0.00 0.00 0 0Female 0 0.00 0.00 0.00 0.00 0 0Male 0 0.00 0.00 0.00 0.00 0 0Total 0 0.00 0.00 0.00 0.00 0 0Female 0 0.00 0.00 0.00 0.00 0 0Male 1 1.39 0.09 0.00 0.30 0 1Total 1 1.39 0.09 0.00 0.30 0 1Female 62 86.11 5.64 4.00 3.75 2 13Male 10 13.89 0.91 1.00 0.70 0 2Total 72 100.00 6.55 5.00 4.08 3 14
N Interns% of All Interns
Program Level Statistics
African American - Black
*Accredited Canadian programs are not required to provide the race/ethnicity of interns.
Total
American Indian - Alaska Native
Asian - Pacific Islander
Race/Ethnicity Gender
Caucasian
Hispanic - Latino
Multi-Ethnic
Other
Interns at Canadian Institutions*
Not Reported
2008 Internship - Intern Level Data
13

II-A-10. Intern Gender & Race/Ethnicity Private Psychiatric Hospital Internship Programs (N=11)
Mean Median Std. Dev. Min MaxFemale 6 8.70 0.55 0.00 0.69 0 2Male 1 1.45 0.09 0.00 0.30 0 1Total 7 10.14 0.64 0.00 0.92 0 3Female 0 0.00 0.00 0.00 0.00 0 0Male 0 0.00 0.00 0.00 0.00 0 0Total 0 0.00 0.00 0.00 0.00 0 0Female 5 7.25 0.45 0.00 1.04 0 3Male 0 0.00 0.00 0.00 0.00 0 0Total 5 7.25 0.45 0.00 1.04 0 3Female 44 63.77 4.00 4.00 2.45 1 9Male 8 11.59 0.73 1.00 0.91 0 3Total 52 75.36 4.73 4.00 2.49 2 10Female 1 1.45 0.09 0.00 0.30 0 1Male 1 1.45 0.09 0.00 0.30 0 1Total 2 2.90 0.18 0.00 0.40 0 1Female 3 4.35 0.27 0.00 0.65 0 2Male 0 0.00 0.00 0.00 0.00 0 0Total 3 4.35 0.27 0.00 0.65 0 2Female 0 0.00 0.00 0.00 0.00 0 0Male 0 0.00 0.00 0.00 0.00 0 0Total 0 0.00 0.00 0.00 0.00 0 0Female 0 0.00 0.00 0.00 0.00 0 0Male 0 0.00 0.00 0.00 0.00 0 0Total 0 0.00 0.00 0.00 0.00 0 0Female 0 0.00 0.00 0.00 0.00 0 0Male 0 0.00 0.00 0.00 0.00 0 0Total 0 0.00 0.00 0.00 0.00 0 0Female 59 85.51 5.36 5.00 3.11 2 13Male 10 14.49 0.91 1.00 0.83 0 3Total 69 100.00 6.27 6.00 3.23 3 14
Hispanic - Latino
Multi-Ethnic
Race/Ethnicity Gender
Other
Interns at Canadian Institutions*
Not Reported
Total
*Accredited Canadian programs are not required to provide the race/ethnicity of interns.
Caucasian
N Interns% of All Interns
Program Level Statistics
African American - Black
American Indian - Alaska Native
Asian - Pacific Islander
2008 Internship - Intern Level Data
14

II-A-11. Intern Gender & Race/Ethnicity School District or System Internship Programs (N=7)
Mean Median Std. Dev. Min MaxFemale 2 5.71 0.29 0.00 0.49 0 1Male 1 2.86 0.14 0.00 0.38 0 1Total 3 8.57 0.43 0.00 0.53 0 1Female 0 0.00 0.00 0.00 0.00 0 0Male 0 0.00 0.00 0.00 0.00 0 0Total 0 0.00 0.00 0.00 0.00 0 0Female 6 17.14 0.86 0.00 1.21 0 3Male 1 2.86 0.14 0.00 0.38 0 1Total 7 20.00 1.00 0.00 1.53 0 4Female 15 42.86 2.14 2.00 1.35 0 4Male 5 14.29 0.71 0.00 0.95 0 2Total 20 57.14 2.86 3.00 1.86 0 6Female 4 11.43 0.57 0.00 0.79 0 2Male 0 0.00 0.00 0.00 0.00 0 0Total 4 11.43 0.57 0.00 0.79 0 2Female 1 2.86 0.14 0.00 0.38 0 1Male 0 0.00 0.00 0.00 0.00 0 0Total 1 2.86 0.14 0.00 0.38 0 1Female 0 0.00 0.00 0.00 0.00 0 0Male 0 0.00 0.00 0.00 0.00 0 0Total 0 0.00 0.00 0.00 0.00 0 0Female 0 0.00 0.00 0.00 0.00 0 0Male 0 0.00 0.00 0.00 0.00 0 0Total 0 0.00 0.00 0.00 0.00 0 0Female 0 0.00 0.00 0.00 0.00 0 0Male 0 0.00 0.00 0.00 0.00 0 0Total 0 0.00 0.00 0.00 0.00 0 0Female 28 80.00 4.00 4.00 2.65 0 8Male 7 20.00 1.00 1.00 1.16 0 3Total 35 100.00 5.00 6.00 3.46 0 11
N Interns% of All Interns
Program Level Statistics
African American - Black
American Indian - Alaska Native
Asian - Pacific Islander
Race/Ethnicity Gender
Total
Caucasian
Hispanic - Latino
Multi-Ethnic
Other
Interns at Canadian Institutions*
Not Reported
*Accredited Canadian programs are not required to provide the race/ethnicity of interns.
2008 Internship - Intern Level Data
15

II-A-12. Intern Gender & Race/Ethnicity State or County Hospital Internship Programs (N=41)
Mean Median Std. Dev. Min MaxFemale 9 5.63 0.22 0.00 0.48 0 2Male 0 0.00 0.00 0.00 0.00 0 0Total 9 5.63 0.22 0.00 0.47 0 2Female 1 0.63 0.02 0.00 0.16 0 1Male 0 0.00 0.00 0.00 0.00 0 0Total 1 0.63 0.02 0.00 0.16 0 1Female 2 1.25 0.05 0.00 0.22 0 1Male 2 1.25 0.05 0.00 0.22 0 1Total 4 2.50 0.10 0.00 0.30 0 1Female 95 59.38 2.32 2.00 1.40 0 7Male 32 20.00 0.78 1.00 1.01 0 5Total 127 79.38 3.10 3.00 1.50 0 9Female 9 5.63 0.22 0.00 0.61 0 3Male 0 0.00 0.00 0.00 0.00 0 0Total 9 5.63 0.22 0.00 0.61 0 3Female 9 5.63 0.22 0.00 0.42 0 1Male 1 0.63 0.02 0.00 0.16 0 1Total 10 6.25 0.24 0.00 0.43 0 1Female 0 0.00 0.00 0.00 0.00 0 0Male 0 0.00 0.00 0.00 0.00 0 0Total 0 0.00 0.00 0.00 0.00 0 0Female 0 0.00 0.00 0.00 0.00 0 0Male 0 0.00 0.00 0.00 0.00 0 0Total 0 0.00 0.00 0.00 0.00 0 0Female 0 0.00 0.00 0.00 0.00 0 0Male 0 0.00 0.00 0.00 0.00 0 0Total 0 0.00 0.00 0.00 0.00 0 0Female 125 78.13 3.05 3.00 1.50 0 8Male 35 21.88 0.85 1.00 1.06 0 5Total 160 100.00 3.90 4.00 1.51 1 10
Other
Interns at Canadian Institutions*
Not Reported
Total
*Accredited Canadian programs are not required to provide the race/ethnicity of interns.
African American - Black
American Indian - Alaska Native
Asian - Pacific Islander
Caucasian
Hispanic - Latino
Multi-Ethnic
Race/Ethnicity Gender N Interns% of All Interns
Program Level Statistics
2008 Internship - Intern Level Data
16
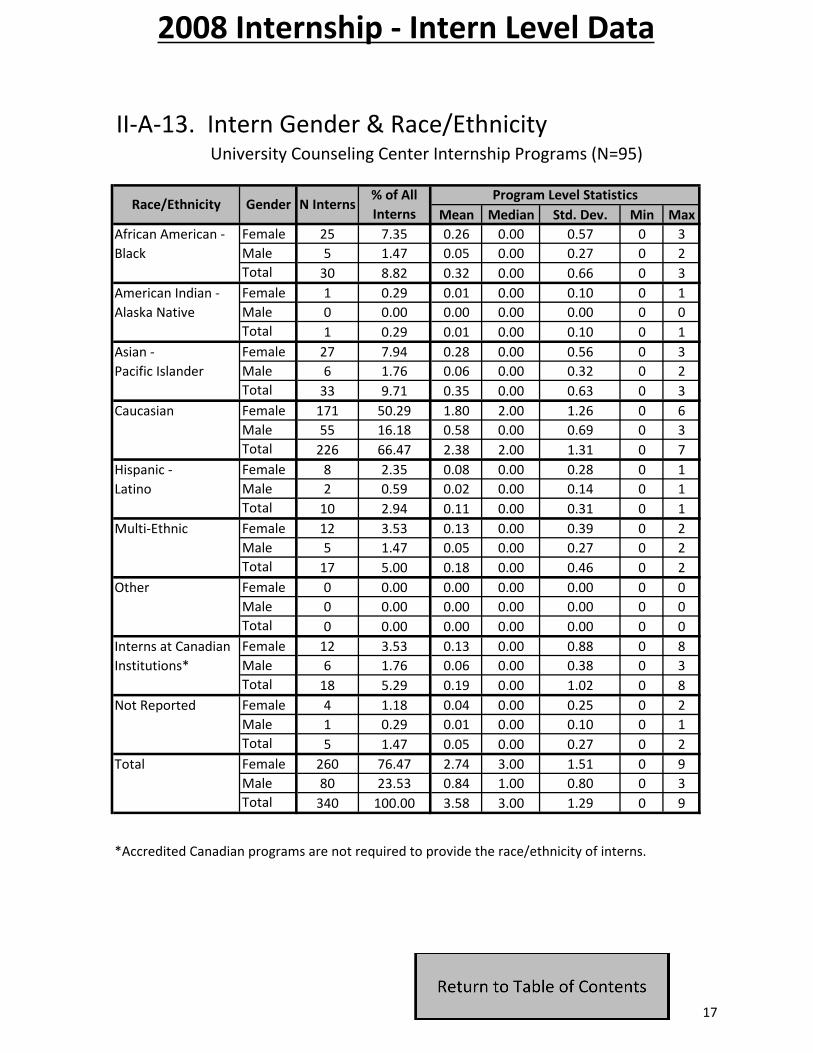
II-A-13. Intern Gender & Race/Ethnicity University Counseling Center Internship Programs (N=95)
Mean Median Std. Dev. Min MaxFemale 25 7.35 0.26 0.00 0.57 0 3Male 5 1.47 0.05 0.00 0.27 0 2Total 30 8.82 0.32 0.00 0.66 0 3Female 1 0.29 0.01 0.00 0.10 0 1Male 0 0.00 0.00 0.00 0.00 0 0Total 1 0.29 0.01 0.00 0.10 0 1Female 27 7.94 0.28 0.00 0.56 0 3Male 6 1.76 0.06 0.00 0.32 0 2Total 33 9.71 0.35 0.00 0.63 0 3Female 171 50.29 1.80 2.00 1.26 0 6Male 55 16.18 0.58 0.00 0.69 0 3Total 226 66.47 2.38 2.00 1.31 0 7Female 8 2.35 0.08 0.00 0.28 0 1Male 2 0.59 0.02 0.00 0.14 0 1Total 10 2.94 0.11 0.00 0.31 0 1Female 12 3.53 0.13 0.00 0.39 0 2Male 5 1.47 0.05 0.00 0.27 0 2Total 17 5.00 0.18 0.00 0.46 0 2Female 0 0.00 0.00 0.00 0.00 0 0Male 0 0.00 0.00 0.00 0.00 0 0Total 0 0.00 0.00 0.00 0.00 0 0Female 12 3.53 0.13 0.00 0.88 0 8Male 6 1.76 0.06 0.00 0.38 0 3Total 18 5.29 0.19 0.00 1.02 0 8Female 4 1.18 0.04 0.00 0.25 0 2Male 1 0.29 0.01 0.00 0.10 0 1Total 5 1.47 0.05 0.00 0.27 0 2Female 260 76.47 2.74 3.00 1.51 0 9Male 80 23.53 0.84 1.00 0.80 0 3Total 340 100.00 3.58 3.00 1.29 0 9
Race/Ethnicity Gender
Caucasian
Hispanic - Latino
Multi-Ethnic
Other
Interns at Canadian Institutions*
Not Reported
N Interns% of All Interns
Program Level Statistics
African American - Black
American Indian - Alaska Native
Asian - Pacific Islander
Total
*Accredited Canadian programs are not required to provide the race/ethnicity of interns.
2008 Internship - Intern Level Data
17

II-A-14. Intern Gender & Race/Ethnicity Veterans Affairs Medical Center Internship Programs (N=71)
Mean Median Std. Dev. Min MaxFemale 14 3.85 0.20 0.00 0.50 0 2Male 4 1.10 0.06 0.00 0.23 0 1Total 18 4.95 0.25 0.00 0.53 0 2Female 0 0.00 0.00 0.00 0.00 0 0Male 1 0.27 0.01 0.00 0.12 0 1Total 1 0.27 0.01 0.00 0.12 0 1Female 15 4.12 0.21 0.00 0.50 0 2Male 4 1.10 0.06 0.00 0.29 0 2Total 19 5.22 0.27 0.00 0.56 0 2Female 201 55.22 2.83 2.00 1.83 0 10Male 93 25.55 1.31 1.00 1.31 0 7Total 294 80.77 4.14 4.00 2.30 0 11Female 11 3.02 0.15 0.00 0.40 0 2Male 4 1.10 0.06 0.00 0.23 0 1Total 15 4.12 0.21 0.00 0.50 0 3Female 7 1.92 0.10 0.00 0.35 0 2Male 8 2.20 0.11 0.00 0.32 0 1Total 15 4.12 0.21 0.00 0.48 0 2Female 1 0.27 0.01 0.00 0.12 0 1Male 0 0.00 0.00 0.00 0.00 0 0Total 1 0.27 0.01 0.00 0.12 0 1Female 0 0.00 0.00 0.00 0.00 0 0Male 0 0.00 0.00 0.00 0.00 0 0Total 0 0.00 0.00 0.00 0.00 0 0Female 1 0.27 0.01 0.00 0.12 0 1Male 0 0.00 0.00 0.00 0.00 0 0Total 1 0.27 0.01 0.00 0.12 0 1Female 250 68.68 3.52 3.00 2.07 0 12Male 114 31.32 1.61 1.00 1.38 0 8Total 364 100.00 5.13 4.00 2.55 2 14
Other
Interns at Canadian Institutions*
Not Reported
Total
African American - Black
American Indian - Alaska Native
Asian - Pacific Islander
Caucasian
Hispanic - Latino
Multi-Ethnic
Race/Ethnicity Gender N Interns% of All Interns
Program Level Statistics
*Accredited Canadian programs are not required to provide the race/ethnicity of interns.
2008 Internship - Intern Level Data
18

II-A-15. Intern Gender & Race/Ethnicity Other Internship Programs (N=16)
Mean Median Std. Dev. Min MaxFemale 4 4.26 0.25 0.00 0.45 0 1Male 0 0.00 0.00 0.00 0.00 0 0Total 4 4.26 0.25 0.00 0.45 0 1Female 1 1.06 0.06 0.00 0.25 0 1Male 0 0.00 0.00 0.00 0.00 0 0Total 1 1.06 0.06 0.00 0.25 0 1Female 7 7.45 0.44 0.00 0.73 0 2Male 3 3.19 0.19 0.00 0.40 0 1Total 10 10.64 0.63 0.00 0.96 0 3Female 50 53.19 3.13 2.50 3.52 0 15Male 17 18.09 1.06 0.00 2.59 0 10Total 67 71.28 4.19 3.00 5.74 0 25Female 6 6.38 0.38 0.00 0.81 0 3Male 1 1.06 0.06 0.00 0.25 0 1Total 7 7.45 0.44 0.00 0.89 0 3Female 4 4.26 0.25 0.00 0.45 0 1Male 1 1.06 0.06 0.00 0.25 0 1Total 5 5.32 0.31 0.00 0.60 0 2Female 0 0.00 0.00 0.00 0.00 0 0Male 0 0.00 0.00 0.00 0.00 0 0Total 0 0.00 0.00 0.00 0.00 0 0Female 0 0.00 0.00 0.00 0.00 0 0Male 0 0.00 0.00 0.00 0.00 0 0Total 0 0.00 0.00 0.00 0.00 0 0Female 0 0.00 0.00 0.00 0.00 0 0Male 0 0.00 0.00 0.00 0.00 0 0Total 0 0.00 0.00 0.00 0.00 0 0Female 72 76.60 4.50 3.50 3.88 0 16Male 22 23.40 1.38 0.50 2.78 0 11Total 94 100.00 5.88 4.50 6.13 0 27
*Accredited Canadian programs are not required to provide the race/ethnicity of interns.
Total
Caucasian
Hispanic - Latino
Multi-Ethnic
Other
Interns at Canadian Institutions*
Not Reported
N Interns% of All Interns
Program Level Statistics
African American - Black
American Indian - Alaska Native
Asian - Pacific Islander
Race/Ethnicity Gender
2008 Internship - Intern Level Data
19

II-A-16. Intern Gender & Race/Ethnicity All Accredited Internship Programs (N=465)
Mean Median Std. Dev. Min MaxFemale 144 5.89 0.31 0.00 0.64 0 6Male 25 1.02 0.05 0.00 0.24 0 2Total 169 6.91 0.36 0.00 0.70 0 6Female 7 0.29 0.02 0.00 0.12 0 1Male 3 0.12 0.01 0.00 0.08 0 1Total 10 0.41 0.02 0.00 0.15 0 1Female 132 5.40 0.28 0.00 0.61 0 4Male 33 1.35 0.07 0.00 0.30 0 3Total 165 6.75 0.35 0.00 0.71 0 5Female 1,311 53.62 2.82 2.00 2.81 0 41Male 457 18.69 0.98 1.00 1.33 0 14Total 1,768 72.31 3.80 3.00 3.65 0 55Female 128 5.24 0.28 0.00 0.65 0 5Male 27 1.10 0.06 0.00 0.28 0 3Total 155 6.34 0.33 0.00 0.77 0 7Female 81 3.31 0.17 0.00 0.47 0 4Male 20 0.82 0.04 0.00 0.21 0 2Total 101 4.13 0.22 0.00 0.52 0 5Female 1 0.04 0.00 0.00 0.05 0 1Male 0 0.00 0.00 0.00 0.00 0 0Total 1 0.04 0.00 0.00 0.05 0 1Female 50 2.04 0.11 0.00 0.72 0 8Male 13 0.53 0.03 0.00 0.23 0 3Total 63 2.58 0.14 0.00 0.86 0 8Female 9 0.37 0.02 0.00 0.15 0 2Male 4 0.16 0.01 0.00 0.09 0 1Total 13 0.53 0.03 0.00 0.19 0 2Female 1,863 76.20 4.01 3.00 3.52 0 54Male 582 23.80 1.25 1.00 1.53 0 18Total 2,445 100.00 5.26 4.00 4.52 0 72
Race/Ethnicity Gender N Interns% of All Interns
Program Level Statistics
Total
African American - Black
American Indian - Alaska Native
Asian - Pacific Islander
Caucasian
Hispanic - Latino
Multi-Ethnic
Other
Interns at Canadian Institutions*
Not Reported
*Accredited Canadian programs are not required to provide the race/ethnicity of interns.
2008 Internship - Intern Level Data
20

Avg. Assessment Hours
Avg. Support Hours
Avg. Supervision Hours
Mean 789.23 640.28 386.11Median 768.00 630.00 375.00Std. Deviation 356.63 320.25 189.31Minimum 0.00 0.00 0.00Maximum 1,549.67 1,601.80 850.20Mean 751.09 502.40 343.08Median 797.11 579.71 383.42Std. Deviation 412.39 294.68 196.43Minimum 0.00 0.00 0.00Maximum 1,568.00 1,005.75 771.08Mean 834.59 589.35 338.93Median 944.00 587.92 370.75Std. Deviation 436.73 323.01 181.81Minimum 0.00 0.00 0.00Maximum 1,344.75 1,007.50 592.00Mean 868.21 616.56 406.05Median 811.67 524.67 372.50Std. Deviation 290.68 389.32 157.73Minimum 533.25 322.00 279.25Maximum 1,300.00 1,460.50 730.00Mean 767.00 588.33 376.83Median 767.00 588.33 376.83Std. Deviation 10.37 40.07 52.09Minimum 759.67 560.00 340.00Maximum 774.33 616.67 413.67Mean 950.50 746.36 466.74Median 934.50 766.23 423.33Std. Deviation 277.48 281.02 189.92Minimum 0.00 0.00 0.00Maximum 1,530.25 1,385.75 1,030.67Mean 934.67 727.62 419.93Median 906.40 747.50 406.13Std. Deviation 236.12 251.71 130.62Minimum 479.83 0.00 0.00Maximum 1,663.14 1,580.00 794.33
Health Maintenance Organization (N=2)
Medical Center (N=47)
Medical School (N=32)
II-B-1.a. Incoming Practicum Hours
Community Mental Health Center (N=65)
Consortium (N=38)
Correctional Facility (N=12)
General Hospital (N=7)
2008 Internship - Intern Level Data
21

Avg. Assessment Hours
Avg. Support Hours
Avg. Supervision Hours
Mean 695.30 578.56 442.40Median 716.25 630.17 358.53Std. Deviation 317.62 256.63 255.67Minimum 0.00 0.00 0.00Maximum 1,263.00 895.60 890.83Mean 800.77 607.87 392.53Median 830.33 723.21 449.14Std. Deviation 494.23 362.63 230.25Minimum 0.00 0.00 0.00Maximum 1,727.33 1,009.33 760.00Mean 867.33 637.53 402.39Median 773.17 681.67 346.50Std. Deviation 401.81 238.66 167.43Minimum 344.00 200.00 240.00Maximum 1,800.00 999.33 781.29Mean 829.47 589.52 333.79Median 877.50 703.33 342.17Std. Deviation 401.20 309.66 183.30Minimum 0.00 0.00 0.00Maximum 1,312.00 938.63 533.00Mean 919.73 659.51 426.48Median 848.33 698.67 383.75Std. Deviation 488.46 268.66 287.66Minimum 0.00 0.00 0.00Maximum 3,173.67 1,135.00 2,000.00Mean 771.30 698.04 403.78Median 773.67 693.33 400.33Std. Deviation 219.33 240.70 123.67Minimum 0.00 0.00 0.00Maximum 1,230.50 1,453.67 750.67
Private General Hospital (N=11)
Private Psychiatric Hospital (N=11)
School District or System (N=7)
State or County Hospital (N=41)
Military Medical Center (N=10)
II-B-1.b. Incoming Practicum Hours, continued
University Counseling Center (N=95)
2008 Internship - Intern Level Data
22

Avg. Assessment Hours
Avg. Support Hours
Avg. Supervision Hours
VAMC (N=71)
Mean 923.89 698.43 452.36Median 911.33 707.71 434.86Std. Deviation 321.63 242.33 193.73Minimum 0.00 0.00 0.00Maximum 2,164.67 1,316.25 1,412.33Mean 958.34 600.35 374.96Median 869.13 596.64 355.25Std. Deviation 536.02 294.91 151.35Minimum 0.00 0.00 0.00Maximum 2,125.25 1,015.75 687.33Mean 849.61 661.93 409.97Median 833.50 681.67 399.00Std. Deviation 349.96 279.38 187.92Minimum 0.00 0.00 0.00Maximum 3,173.67 1,601.80 2,000.00
Total (N=465)
Other (N=16)
II-B-1.c. Incoming Practicum Hours, continued
2008 Internship - Intern Level Data
23

II-C-1. Intern Professional Activities Accredited programs are required to provide annual updates on the professional activities of their interns. Interns need to provide updates on six activities from the current year. The full wording of these questions is provided below as well as how they are labeled in the subsequent tables.
Question # Column Label Question Wording
1 Member Indicate if the intern is a member of a professional or research society by selecting either "Yes", "No" or "N/A". This includes Intern affiliates.
2 Presentations
Indicate if the intern is an author or co-author of papers or workshops at professional meetings by selecting either “Yes”, “No” or "N/A". This includes work published (or in press)/presented during the 2007-2008 academic year only. Books may be included.
3 Articles
Indicate if the intern is an author or co-author of articles in professional or scientific journals by selecting either “yes” or “no”. This includes work published (or in press)/presented during the 2007-2008 academic year only. Books may be included.
4 Research Indicate if the intern is involved in grant-supported research by selecting either "Yes", "No" or "N/A". This includes RA’s.
5 Teaching Indicate if the intern is involved in teaching on an ongoing basis by selecting either "Yes", "No" or "N/A". This includes TA’s.
6 Leadership
Indicate if the intern is involved in leadership roles or activities in professional organizations by selecting either “Yes”, “No” or "N/A". These can include roles in State/Provincial, Regional, or National Professional Organizations.
2008 Internship - Intern Level Data
24

Member Presentation Articles Research Teaching LeadershipMean 85.06 46.93 22.67 19.58 28.50 18.69Median 100.00 50.00 20.00 0.00 20.00 14.29Std. Dev. 26.08 31.92 25.47 27.14 31.46 24.47Min 0.00 0.00 0.00 0.00 0.00 0.00Max 100.00 100.00 100.00 100.00 100.00 100.00Mean 86.19 60.24 38.26 29.08 30.96 16.15Median 100.00 66.67 33.33 19.05 19.03 14.29Std. Dev. 23.67 32.24 29.57 34.03 35.89 19.87Min 0.00 0.00 0.00 0.00 0.00 0.00Max 100.00 100.00 100.00 100.00 100.00 66.67Mean 83.00 51.00 32.83 15.42 28.75 14.42Median 100.00 66.67 33.33 0.00 8.33 8.33Std. Dev. 31.44 36.78 27.71 24.85 40.18 16.52Min 0.00 0.00 0.00 0.00 0.00 0.00Max 100.00 100.00 75.00 75.00 100.00 40.00Mean 96.43 58.33 39.05 28.57 33.10 8.81Median 100.00 83.33 40.00 33.33 33.33 0.00Std. Dev. 9.45 47.87 34.25 28.41 26.71 11.25Min 75.00 0.00 0.00 0.00 0.00 0.00Max 100.00 100.00 100.00 66.67 75.00 25.00Mean 100.00 16.67 16.67 0.00 0.00 0.00Median 100.00 16.67 16.67 0.00 0.00 0.00Std. Dev. 0.00 23.57 23.57 0.00 0.00 0.00Min 100.00 0.00 0.00 0.00 0.00 0.00Max 100.00 33.33 33.33 0.00 0.00 0.00Mean 91.14 72.76 58.66 41.34 33.84 16.74Median 100.00 85.71 62.50 33.33 25.00 7.69Std. Dev. 14.35 28.71 32.20 31.00 34.32 20.20Min 33.33 0.00 0.00 0.00 0.00 0.00Max 100.00 100.00 100.00 100.00 100.00 66.67Mean 90.81 77.24 52.85 42.61 38.79 18.75Median 100.00 85.42 50.00 50.00 34.85 15.48Std. Dev. 18.60 24.94 33.60 30.17 34.42 20.41Min 33.33 16.67 0.00 0.00 0.00 0.00Max 100.00 100.00 100.00 100.00 100.00 71.43
Statistics represent % of total interns involved in each activity
Community Mental Health Center (N=63)Consortium (N=37)
II-C-2-a. Intern Professional Activities
Correctional Facility (N=10)
General Hospital (N=7)
HMO (N=2)
Medical Center (N=47)
Medical School (N=32)
2008 Internship - Intern Level Data
25

Member Presentation Articles Research Teaching LeadershipMean 67.53 28.89 15.56 14.07 5.93 13.15Median 80.00 25.00 20.00 0.00 0.00 0.00Std. Dev. 36.27 24.59 12.56 19.35 12.22 20.08Min 0.00 0.00 0.00 0.00 0.00 0.00Max 100.00 60.00 33.33 50.00 33.33 60.00Mean 82.90 47.56 40.73 25.03 29.34 22.40Median 100.00 35.71 33.33 18.18 16.67 8.33Std. Dev. 29.62 32.41 35.45 28.66 34.21 31.19Min 0.00 0.00 0.00 0.00 0.00 0.00Max 100.00 100.00 100.00 100.00 100.00 100.00Mean 86.06 51.88 34.14 15.95 35.32 26.41Median 100.00 64.29 33.33 0.00 28.57 14.29Std. Dev. 30.62 36.08 31.07 31.08 40.31 33.22Min 0.00 0.00 0.00 0.00 0.00 0.00Max 100.00 100.00 100.00 100.00 100.00 100.00Mean 95.71 63.13 36.62 18.43 29.55 11.11Median 100.00 56.06 34.85 21.97 21.97 0.00Std. Dev. 7.07 31.05 28.67 15.52 37.14 17.21Min 83.33 33.33 0.00 0.00 0.00 0.00Max 100.00 100.00 83.33 33.33 100.00 33.33Mean 87.11 55.08 29.43 18.41 28.94 20.65Median 100.00 50.00 25.00 0.00 20.00 0.00Std. Dev. 24.86 36.56 28.25 25.63 32.88 27.01Min 0.00 0.00 0.00 0.00 0.00 0.00Max 100.00 100.00 100.00 100.00 100.00 100.00Mean 90.10 49.72 34.99 18.16 38.03 19.90Median 100.00 50.00 33.33 0.00 25.00 0.00Std. Dev. 19.60 34.01 30.89 25.95 39.68 25.87Min 0.00 0.00 0.00 0.00 0.00 0.00Max 100.00 100.00 100.00 100.00 100.00 100.00Mean 90.82 58.60 43.75 27.81 21.55 17.58Median 100.00 63.33 38.18 23.61 0.00 0.00Std. Dev. 17.83 33.72 31.47 29.93 30.04 26.62Min 25.00 0.00 0.00 0.00 0.00 0.00Max 100.00 100.00 100.00 100.00 100.00 100.00
State or County Hospital (N=41)
University Counseling Center (N=93)
VAMC (N=70)
II-C-2-b. Intern Professional Activities
Statistics represent % of total interns involved in each activity
School District or System (N=6)
Military Medical Center (N=9)
Private General Hospital (N=11)
Private Psychiatric Hospital (N=11)
2008 Internship - Intern Level Data
26
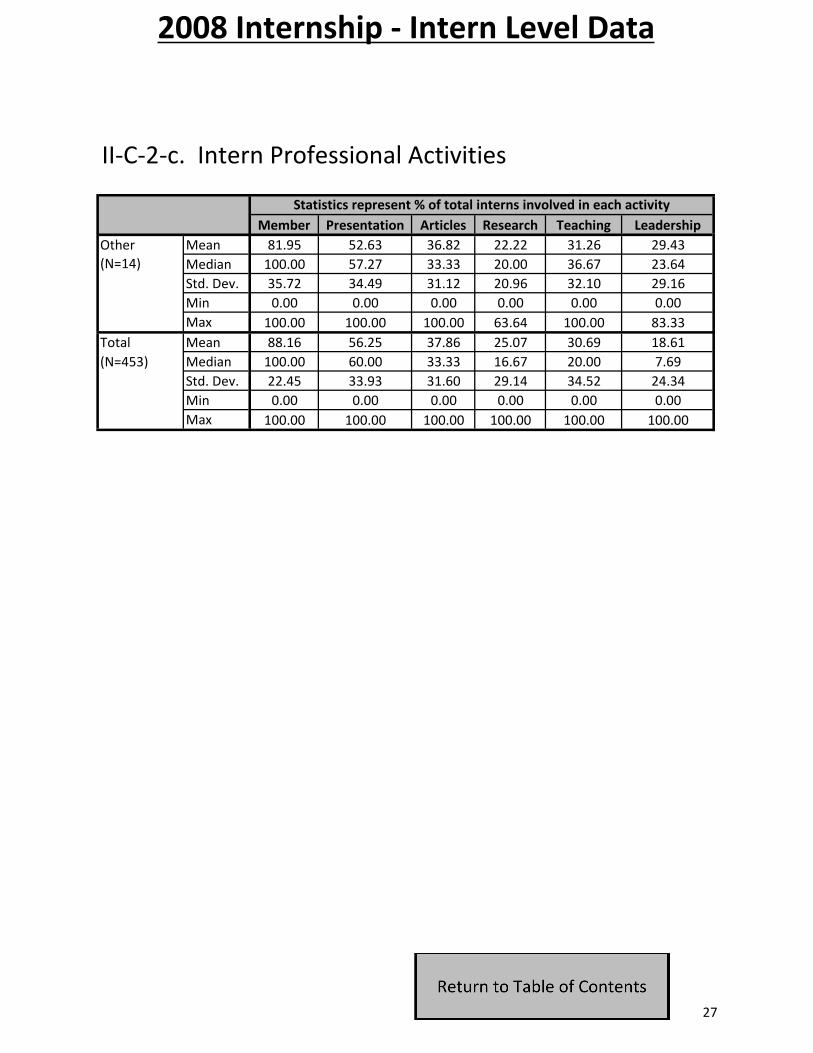
Member Presentation Articles Research Teaching LeadershipMean 81.95 52.63 36.82 22.22 31.26 29.43Median 100.00 57.27 33.33 20.00 36.67 23.64Std. Dev. 35.72 34.49 31.12 20.96 32.10 29.16Min 0.00 0.00 0.00 0.00 0.00 0.00Max 100.00 100.00 100.00 63.64 100.00 83.33Mean 88.16 56.25 37.86 25.07 30.69 18.61Median 100.00 60.00 33.33 16.67 20.00 7.69Std. Dev. 22.45 33.93 31.60 29.14 34.52 24.34Min 0.00 0.00 0.00 0.00 0.00 0.00Max 100.00 100.00 100.00 100.00 100.00 100.00
Total (N=453)
Other (N=14)
II-C-2-c. Intern Professional Activities
Statistics represent % of total interns involved in each activity
2008 Internship - Intern Level Data
27
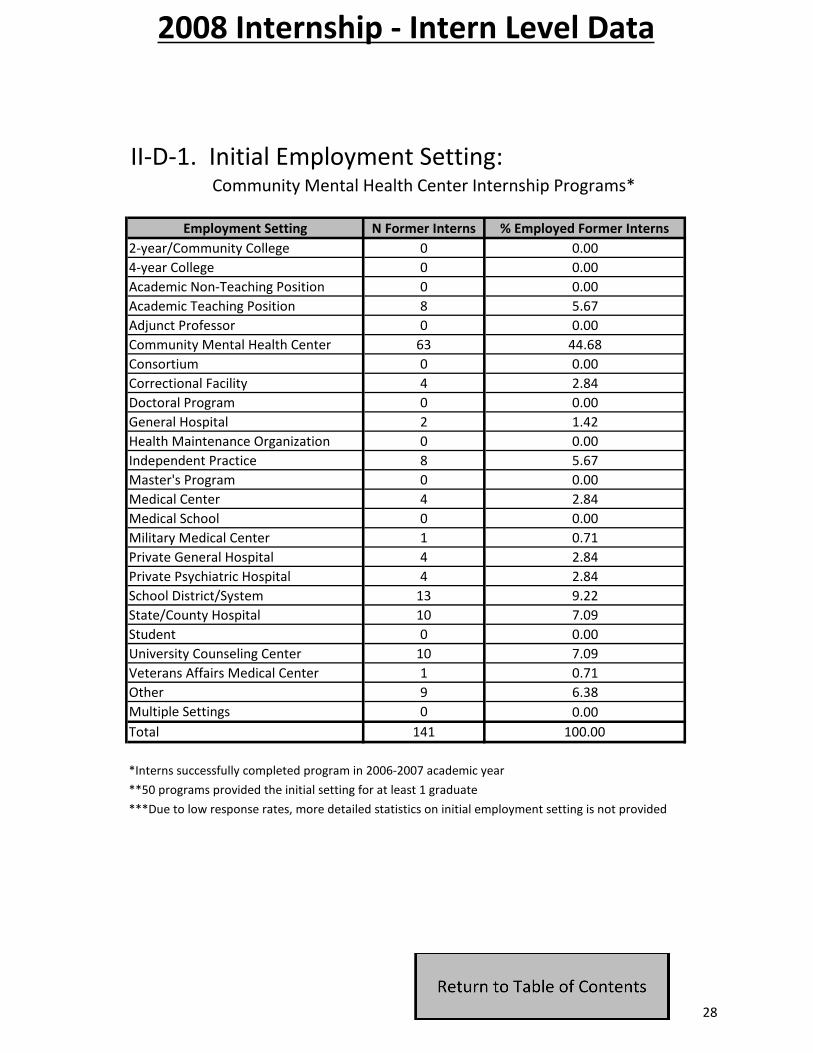
Employment Setting N Former Interns % Employed Former Interns2-year/Community College 0 0.004-year College 0 0.00Academic Non-Teaching Position 0 0.00Academic Teaching Position 8 5.67Adjunct Professor 0 0.00Community Mental Health Center 63 44.68Consortium 0 0.00Correctional Facility 4 2.84Doctoral Program 0 0.00General Hospital 2 1.42Health Maintenance Organization 0 0.00Independent Practice 8 5.67Master's Program 0 0.00Medical Center 4 2.84Medical School 0 0.00Military Medical Center 1 0.71Private General Hospital 4 2.84Private Psychiatric Hospital 4 2.84School District/System 13 9.22State/County Hospital 10 7.09Student 0 0.00University Counseling Center 10 7.09Veterans Affairs Medical Center 1 0.71Other 9 6.38Multiple Settings 0 0.00Total 141 100.00
*Interns successfully completed program in 2006-2007 academic year**50 programs provided the initial setting for at least 1 graduate
II-D-1. Initial Employment Setting: Community Mental Health Center Internship Programs*
***Due to low response rates, more detailed statistics on initial employment setting is not provided
2008 Internship - Intern Level Data
28

Employment Setting N Former Interns % Employed Former Interns2-year/Community College 0 0.004-year College 0 0.00Academic Non-Teaching Position 2 1.80Academic Teaching Position 12 10.81Adjunct Professor 0 0.00Community Mental Health Center 8 7.21Consortium 0 0.00Correctional Facility 2 1.80Doctoral Program 0 0.00General Hospital 0 0.00Health Maintenance Organization 1 0.90Independent Practice 18 16.22Master's Program 0 0.00Medical Center 1 0.90Medical School 4 3.60Military Medical Center 0 0.00Private General Hospital 4 3.60Private Psychiatric Hospital 4 3.60School District/System 15 13.51State/County Hospital 6 5.41Student 5 4.50University Counseling Center 7 6.31Veterans Affairs Medical Center 14 12.61Other 6 5.41Multiple Settings 2 1.80Total 111 100.00
*Interns successfully completed program in 2006-2007 academic year**31 programs provided the initial setting for at least 1 graduate
II-D-2. Initial Employment Setting: Consortium Internship Programs*
***Due to low response rates, more detailed statistics on initial employment setting is not provided
2008 Internship - Intern Level Data
29

Employment Setting N Former Interns % Employed Former Interns2-year/Community College 0 0.004-year College 0 0.00Academic Non-Teaching Position 0 0.00Academic Teaching Position 2 6.45Adjunct Professor 0 0.00Community Mental Health Center 2 6.45Consortium 0 0.00Correctional Facility 12 38.71Doctoral Program 0 0.00General Hospital 0 0.00Health Maintenance Organization 0 0.00Independent Practice 4 12.90Master's Program 0 0.00Medical Center 1 3.23Medical School 0 0.00Military Medical Center 0 0.00Private General Hospital 0 0.00Private Psychiatric Hospital 1 3.23School District/System 1 3.23State/County Hospital 4 12.90Student 2 6.45University Counseling Center 1 3.23Veterans Affairs Medical Center 0 0.00Other 1 3.23Multiple Settings 0 0.00Total 31 100.00
*Interns successfully completed program in 2006-2007 academic year**10 programs provided the initial setting for at least 1 graduate
II-D-3. Initial Employment Setting: Correctional Facility Internship Programs*
***Due to low response rates, more detailed statistics on initial employment setting is not provided
2008 Internship - Intern Level Data
30

Employment Setting N Former Interns % Employed Former Interns2-year/Community College 0 0.004-year College 0 0.00Academic Non-Teaching Position 0 0.00Academic Teaching Position 1 10.00Adjunct Professor 0 0.00Community Mental Health Center 1 10.00Consortium 0 0.00Correctional Facility 0 0.00Doctoral Program 0 0.00General Hospital 0 0.00Health Maintenance Organization 0 0.00Independent Practice 2 20.00Master's Program 0 0.00Medical Center 3 30.00Medical School 0 0.00Military Medical Center 0 0.00Private General Hospital 0 0.00Private Psychiatric Hospital 0 0.00School District/System 0 0.00State/County Hospital 1 10.00Student 0 0.00University Counseling Center 1 10.00Veterans Affairs Medical Center 0 0.00Other 1 10.00Multiple Settings 0 0.00Total 10 100.00
*Interns successfully completed program in 2006-2007 academic year**5 programs provided the initial setting for at least 1 graduate
II-D-4. Initial Employment Setting: General Hospital Internship Programs*
***Due to low response rates, more detailed statistics on initial employment setting is not provided
2008 Internship - Intern Level Data
31

Employment Setting N Former Interns % Employed Former Interns2-year/Community College 0 0.004-year College 0 0.00Academic Non-Teaching Position 0 0.00Academic Teaching Position 0 0.00Adjunct Professor 0 0.00Community Mental Health Center 0 0.00Consortium 0 0.00Correctional Facility 0 0.00Doctoral Program 0 0.00General Hospital 0 0.00Health Maintenance Organization 1 50.00Independent Practice 0 0.00Master's Program 0 0.00Medical Center 0 0.00Medical School 0 0.00Military Medical Center 0 0.00Private General Hospital 0 0.00Private Psychiatric Hospital 0 0.00School District/System 0 0.00State/County Hospital 0 0.00Student 0 0.00University Counseling Center 0 0.00Veterans Affairs Medical Center 0 0.00Other 1 50.00Multiple Settings 0 0.00Total 2 100.00
*Interns successfully completed program in 2006-2007 academic year**2 programs provided the initial setting for at least 1 graduate
II-D-5. Initial Employment Setting Health Maintenance Organization Internship Programs*
***Due to low response rates, more detailed statistics on initial employment setting is not provided
2008 Internship - Intern Level Data
32

Employment Setting N Former Interns % Employed Former Interns2-year/Community College 0 0.004-year College 0 0.00Academic Non-Teaching Position 4 5.00Academic Teaching Position 13 16.25Adjunct Professor 0 0.00Community Mental Health Center 10 12.50Consortium 0 0.00Correctional Facility 5 6.25Doctoral Program 0 0.00General Hospital 2 2.50Health Maintenance Organization 2 2.50Independent Practice 3 3.75Master's Program 0 0.00Medical Center 12 15.00Medical School 10 12.50Military Medical Center 0 0.00Private General Hospital 3 3.75Private Psychiatric Hospital 0 0.00School District/System 0 0.00State/County Hospital 4 5.00Student 3 3.75University Counseling Center 4 5.00Veterans Affairs Medical Center 2 2.50Other 3 3.75Multiple Settings 0 0.00Total 80 100.00
*Interns successfully completed program in 2006-2007 academic year**25 programs provided the initial setting for at least 1 graduate***Due to low response rates, more detailed statistics on initial employment setting is not provided
Medical Center Internship Programs*II-D-6. Initial Employment Setting:
2008 Internship - Intern Level Data
33
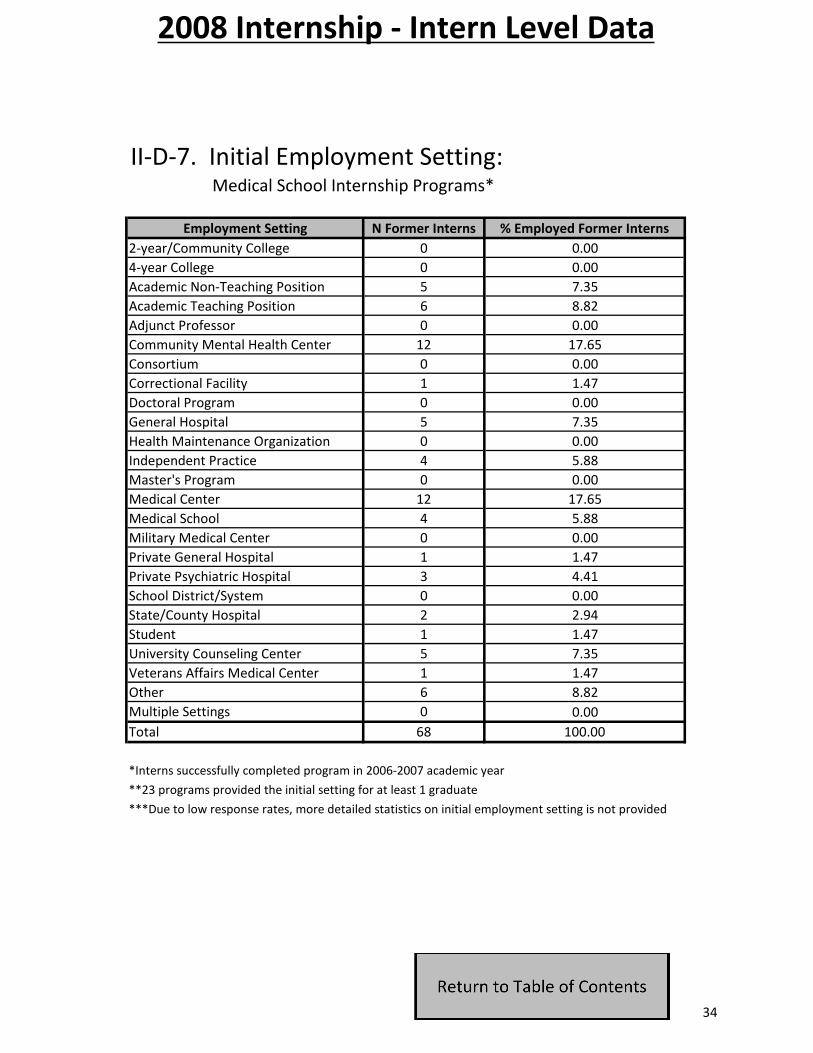
Employment Setting N Former Interns % Employed Former Interns2-year/Community College 0 0.004-year College 0 0.00Academic Non-Teaching Position 5 7.35Academic Teaching Position 6 8.82Adjunct Professor 0 0.00Community Mental Health Center 12 17.65Consortium 0 0.00Correctional Facility 1 1.47Doctoral Program 0 0.00General Hospital 5 7.35Health Maintenance Organization 0 0.00Independent Practice 4 5.88Master's Program 0 0.00Medical Center 12 17.65Medical School 4 5.88Military Medical Center 0 0.00Private General Hospital 1 1.47Private Psychiatric Hospital 3 4.41School District/System 0 0.00State/County Hospital 2 2.94Student 1 1.47University Counseling Center 5 7.35Veterans Affairs Medical Center 1 1.47Other 6 8.82Multiple Settings 0 0.00Total 68 100.00
*Interns successfully completed program in 2006-2007 academic year**23 programs provided the initial setting for at least 1 graduate
II-D-7. Initial Employment Setting: Medical School Internship Programs*
***Due to low response rates, more detailed statistics on initial employment setting is not provided
2008 Internship - Intern Level Data
34

Employment Setting N Former Interns % Employed Former Interns2-year/Community College 0 0.004-year College 0 0.00Academic Non-Teaching Position 0 0.00Academic Teaching Position 0 0.00Adjunct Professor 0 0.00Community Mental Health Center 0 0.00Consortium 0 0.00Correctional Facility 0 0.00Doctoral Program 0 0.00General Hospital 0 0.00Health Maintenance Organization 0 0.00Independent Practice 0 0.00Master's Program 0 0.00Medical Center 0 0.00Medical School 0 0.00Military Medical Center 33 91.67Private General Hospital 0 0.00Private Psychiatric Hospital 0 0.00School District/System 0 0.00State/County Hospital 0 0.00Student 1 2.78University Counseling Center 0 0.00Veterans Affairs Medical Center 0 0.00Other 2 5.56Multiple Settings 0 0.00Total 36 100.00
*Interns successfully completed program in 2006-2007 academic year**7 programs provided the initial setting for at least 1 graduate
II-D-8. Initial Employment Setting: Military Medical Center Internship Programs*
***Due to low response rates, more detailed statistics on initial employment setting is not provided
2008 Internship - Intern Level Data
35

Employment Setting N Former Interns % Employed Former Interns2-year/Community College 0 0.004-year College 0 0.00Academic Non-Teaching Position 0 0.00Academic Teaching Position 0 0.00Adjunct Professor 1 4.35Community Mental Health Center 4 17.39Consortium 0 0.00Correctional Facility 1 4.35Doctoral Program 0 0.00General Hospital 3 13.04Health Maintenance Organization 0 0.00Independent Practice 0 0.00Master's Program 0 0.00Medical Center 1 4.35Medical School 0 0.00Military Medical Center 0 0.00Private General Hospital 4 17.39Private Psychiatric Hospital 0 0.00School District/System 1 4.35State/County Hospital 3 13.04Student 0 0.00University Counseling Center 2 8.70Veterans Affairs Medical Center 0 0.00Other 3 13.04Multiple Settings 0 0.00Total 23 100.00
*Interns successfully completed program in 2006-2007 academic year**7 programs provided the initial setting for at least 1 graduate***Due to low response rates, more detailed statistics on initial employment setting is not provided
Private General Hospital Internship Programs*II-D-9. Initial Employment Setting
2008 Internship - Intern Level Data
36

Employment Setting N Former Interns % Employed Former Interns2-year/Community College 0 0.004-year College 0 0.00Academic Non-Teaching Position 0 0.00Academic Teaching Position 2 14.29Adjunct Professor 0 0.00Community Mental Health Center 4 28.57Consortium 0 0.00Correctional Facility 0 0.00Doctoral Program 0 0.00General Hospital 0 0.00Health Maintenance Organization 1 7.14Independent Practice 2 14.29Master's Program 0 0.00Medical Center 1 7.14Medical School 1 7.14Military Medical Center 0 0.00Private General Hospital 2 14.29Private Psychiatric Hospital 0 0.00School District/System 0 0.00State/County Hospital 0 0.00Student 0 0.00University Counseling Center 0 0.00Veterans Affairs Medical Center 0 0.00Other 1 7.14Multiple Settings 0 0.00Total 14 100.00
*Interns successfully completed program in 2006-2007 academic year**6 programs provided the initial setting for at least 1 graduate
Private Psychiatric Hospital Internship Programs*II-D-10. Initial Employment Setting:
***Due to low response rates, more detailed statistics on initial employment setting is not provided
2008 Internship - Intern Level Data
37

Employment Setting N Former Interns % Employed Former Interns2-year/Community College 0 0.004-year College 0 0.00Academic Non-Teaching Position 0 0.00Academic Teaching Position 1 5.88Adjunct Professor 0 0.00Community Mental Health Center 1 5.88Consortium 0 0.00Correctional Facility 0 0.00Doctoral Program 0 0.00General Hospital 0 0.00Health Maintenance Organization 0 0.00Independent Practice 2 11.76Master's Program 0 0.00Medical Center 0 0.00Medical School 0 0.00Military Medical Center 2 11.76Private General Hospital 0 0.00Private Psychiatric Hospital 0 0.00School District/System 11 64.71State/County Hospital 0 0.00Student 0 0.00University Counseling Center 0 0.00Veterans Affairs Medical Center 0 0.00Other 0 0.00Multiple Settings 0 0.00Total 17 100.00
*Interns successfully completed program in 2006-2007 academic year**7 programs provided the initial setting for at least 1 graduate
School District or System Internship Programs*
***Due to low response rates, more detailed statistics on initial employment setting is not provided
II-D-11. Initial Employment Setting:
2008 Internship - Intern Level Data
38

Employment Setting N Former Interns % Employed Former Interns2-year/Community College 0 0.004-year College 0 0.00Academic Non-Teaching Position 0 0.00Academic Teaching Position 2 2.50Adjunct Professor 0 0.00Community Mental Health Center 3 3.75Consortium 0 0.00Correctional Facility 6 7.50Doctoral Program 0 0.00General Hospital 2 2.50Health Maintenance Organization 0 0.00Independent Practice 6 7.50Master's Program 0 0.00Medical Center 3 3.75Medical School 1 1.25Military Medical Center 0 0.00Private General Hospital 3 3.75Private Psychiatric Hospital 6 7.50School District/System 2 2.50State/County Hospital 39 48.75Student 0 0.00University Counseling Center 2 2.50Veterans Affairs Medical Center 1 1.25Other 3 3.75Multiple Settings 1 1.25Total 80 100.00
*Interns successfully completed program in 2006-2007 academic year**27 programs provided the initial setting for at least 1 graduate***Due to low response rates, more detailed statistics on initial employment setting is not provided
II-D-12. Initial Employment Setting: State or County Hospital Internship Programs*
2008 Internship - Intern Level Data
39

Employment Setting N Former Interns % Employed Former Interns2-year/Community College 2 1.394-year College 0 0.00Academic Non-Teaching Position 5 3.47Academic Teaching Position 32 22.22Adjunct Professor 0 0.00Community Mental Health Center 11 7.64Consortium 0 0.00Correctional Facility 1 0.69Doctoral Program 0 0.00General Hospital 1 0.69Health Maintenance Organization 0 0.00Independent Practice 18 12.50Master's Program 0 0.00Medical Center 7 4.86Medical School 0 0.00Military Medical Center 1 0.69Private General Hospital 0 0.00Private Psychiatric Hospital 1 0.69School District/System 0 0.00State/County Hospital 1 0.69Student 3 2.08University Counseling Center 52 36.11Veterans Affairs Medical Center 2 1.39Other 7 4.86Multiple Settings 0 0.00Total 144 100.00
*Interns successfully completed program in 2006-2007 academic year**69 programs provided the initial setting for at least 1 graduate
University Counseling Center Internship Programs*
***Due to low response rates, more detailed statistics on initial employment setting is not provided
II-D-13. Initial Employment Setting:
2008 Internship - Intern Level Data
40

Employment Setting N Former Interns % Employed Former Interns2-year/Community College 0 0.004-year College 0 0.00Academic Non-Teaching Position 0 0.00Academic Teaching Position 13 10.40Adjunct Professor 0 0.00Community Mental Health Center 16 12.80Consortium 0 0.00Correctional Facility 3 2.40Doctoral Program 0 0.00General Hospital 0 0.00Health Maintenance Organization 1 0.80Independent Practice 7 5.60Master's Program 0 0.00Medical Center 2 1.60Medical School 3 2.40Military Medical Center 1 0.80Private General Hospital 5 4.00Private Psychiatric Hospital 2 1.60School District/System 0 0.00State/County Hospital 6 4.80Student 7 5.60University Counseling Center 3 2.40Veterans Affairs Medical Center 51 40.80Other 5 4.00Multiple Settings 0 0.00Total 125 100.00
*Interns successfully completed program in 2006-2007 academic year**52 programs provided the initial setting for at least 1 graduate***Due to low response rates, more detailed statistics on initial employment setting is not provided
II-D-14. Initial Employment Setting: Veterans Affairs Medical Center Internship Programs*
2008 Internship - Intern Level Data
41

Employment Setting N Former Interns % Employed Former Interns2-year/Community College 0 0.004-year College 0 0.00Academic Non-Teaching Position 1 2.86Academic Teaching Position 1 2.86Adjunct Professor 0 0.00Community Mental Health Center 2 5.71Consortium 0 0.00Correctional Facility 2 5.71Doctoral Program 0 0.00General Hospital 1 2.86Health Maintenance Organization 0 0.00Independent Practice 5 14.29Master's Program 0 0.00Medical Center 2 5.71Medical School 0 0.00Military Medical Center 5 14.29Private General Hospital 0 0.00Private Psychiatric Hospital 0 0.00School District/System 4 11.43State/County Hospital 1 2.86Student 1 2.86University Counseling Center 0 0.00Veterans Affairs Medical Center 0 0.00Other 10 28.57Multiple Settings 0 0.00Total 35 100.00
*Interns successfully completed program in 2006-2007 academic year**6 programs provided the initial setting for at least 1 graduate
II-D-15. Initial Employment Setting:
***Due to low response rates, more detailed statistics on initial employment setting is not provided
Other Internship Programs*
2008 Internship - Intern Level Data
42

Employment Setting N Former Interns % Employed Former Interns2-year/Community College 2 0.224-year College 0 0.00Academic Non-Teaching Position 17 1.85Academic Teaching Position 93 10.14Adjunct Professor 1 0.11Community Mental Health Center 137 14.94Consortium 0 0.00Correctional Facility 37 4.03Doctoral Program 0 0.00General Hospital 16 1.74Health Maintenance Organization 6 0.65Independent Practice 79 8.62Master's Program 0 0.00Medical Center 49 5.34Medical School 23 2.51Military Medical Center 43 4.69Private General Hospital 26 2.84Private Psychiatric Hospital 21 2.29School District/System 47 5.13State/County Hospital 77 8.40Student 23 2.51University Counseling Center 87 9.49Veterans Affairs Medical Center 72 7.85Other 58 6.32Multiple Settings 3 0.33Total 917 100.00
*Interns successfully completed program in 2006-2007 academic year**327 programs provided the initial setting for at least 1 graduate***Due to low response rates, more detailed statistics on initial employment setting is not provided
II-D-16. Initial Employment Setting: All Accredited Internship Programs*
2008 Internship - Intern Level Data
43

Community Mental Health Center Internship Programs*
Employment Activity N Former Interns % Employed Former InternsAdministration 2 1.49Assessment 25 18.66Consultation 2 1.49Psychotherapy 84 62.69Research 2 1.49Supervision 0 0.00Teaching 7 5.22Other 14 10.45All 134 100.00
*Interns successfully completed program in 2006-2007 academic year**47 programs provided the initial activity for at least 1 graduate
Consortium Internship Programs*
Employment Activity N Former Interns % Employed Former InternsAdministration 2 1.94Assessment 14 13.59Consultation 9 8.74Psychotherapy 53 51.46Research 10 9.71Supervision 0 0.00Teaching 13 12.62Other 11 10.68All 103 100.00
*Interns successfully completed program in 2006-2007 academic year**31 programs provided the initial activity for at least 1 graduate
II-E-1. Initial Employment Activity:
II-E-2. Initial Employment Activity:
***Due to low response rates, more detailed statistics on initial employment activity is not provided
***Due to low response rates, more detailed statistics on initial employment activity is not provided
2008 Internship - Intern Level Data
44

Correctional Facility Internship Programs*
Employment Activity N Former Interns % Employed Former InternsAdministration 0 0.00Assessment 11 42.31Consultation 1 3.85Psychotherapy 9 34.62Research 2 7.69Supervision 0 0.00Teaching 2 7.69Other 2 7.69All 26 100.00
*Interns successfully completed program in 2006-2007 academic year**9 programs provided the initial activity for at least 1 graduate
General Hospital Internship Programs*
Employment Activity N Former Interns % Employed Former InternsAdministration 0 0.00Assessment 0 0.00Consultation 1 11.11Psychotherapy 2 22.22Research 1 11.11Supervision 0 0.00Teaching 1 11.11Other 5 55.56All 9 100.00
*Interns successfully completed program in 2006-2007 academic year**5 programs provided the initial activity for at least 1 graduate
***Due to low response rates, more detailed statistics on initial employment activity is not provided
***Due to low response rates, more detailed statistics on initial employment activity is not provided
II-E-4. Initial Employment Activity:
II-E-3. Initial Employment Activity:
2008 Internship - Intern Level Data
45

Health Maintenance Organization Internship Programs*
Employment Activity N Former Interns % Employed Former InternsAdministration 0 0.00Assessment 0 0.00Consultation 0 0.00Psychotherapy 1 50.00Research 0 0.00Supervision 1 50.00Teaching 0 0.00Other 0 0.00All 2 100.00
*Interns successfully completed program in 2006-2007 academic year**2 program provided the initial activity for at least 1 graduate
Medical Center Internship Programs*
Employment Activity N Former Interns % Employed Former InternsAdministration 1 1.35Assessment 14 18.92Consultation 2 2.70Psychotherapy 26 35.14Research 12 16.22Supervision 0 0.00Teaching 8 10.81Other 13 17.57All 74 100.00
*Interns successfully completed program in 2006-2007 academic year**25 programs provided the initial activity for at least 1 graduate
***Due to low response rates, more detailed statistics on initial employment activity is not provided
***Due to low response rates, more detailed statistics on initial employment activity is not provided
II-E-5. Initial Employment Activity:
II-E-6. Initial Employment Activity:
2008 Internship - Intern Level Data
46

Medical School Internship Programs*
Employment Activity N Former Interns % Employed Former InternsAdministration 0 0.00Assessment 4 6.35Consultation 5 7.94Psychotherapy 34 53.97Research 9 14.29Supervision 5 7.94Teaching 6 9.52Other 5 7.94All 63 100.00
*Interns successfully completed program in 2006-2007 academic year**21 programs provided the initial activity for at least 1 graduate
Military Medical Center Internship Programs*
Employment Activity N Former Interns % Employed Former InternsAdministration 0 0.00Assessment 1 2.78Consultation 0 0.00Psychotherapy 10 27.78Research 1 2.78Supervision 0 0.00Teaching 0 0.00Other 24 66.67All 36 100.00
*Interns successfully completed program in 2006-2007 academic year**7 programs provided the initial activity for at least 1 graduate
***Due to low response rates, more detailed statistics on initial employment activity is not provided
II-E-7. Initial Employment Activity:
II-E-8. Initial Employment Activity:
***Due to low response rates, more detailed statistics on initial employment activity is not provided
2008 Internship - Intern Level Data
47
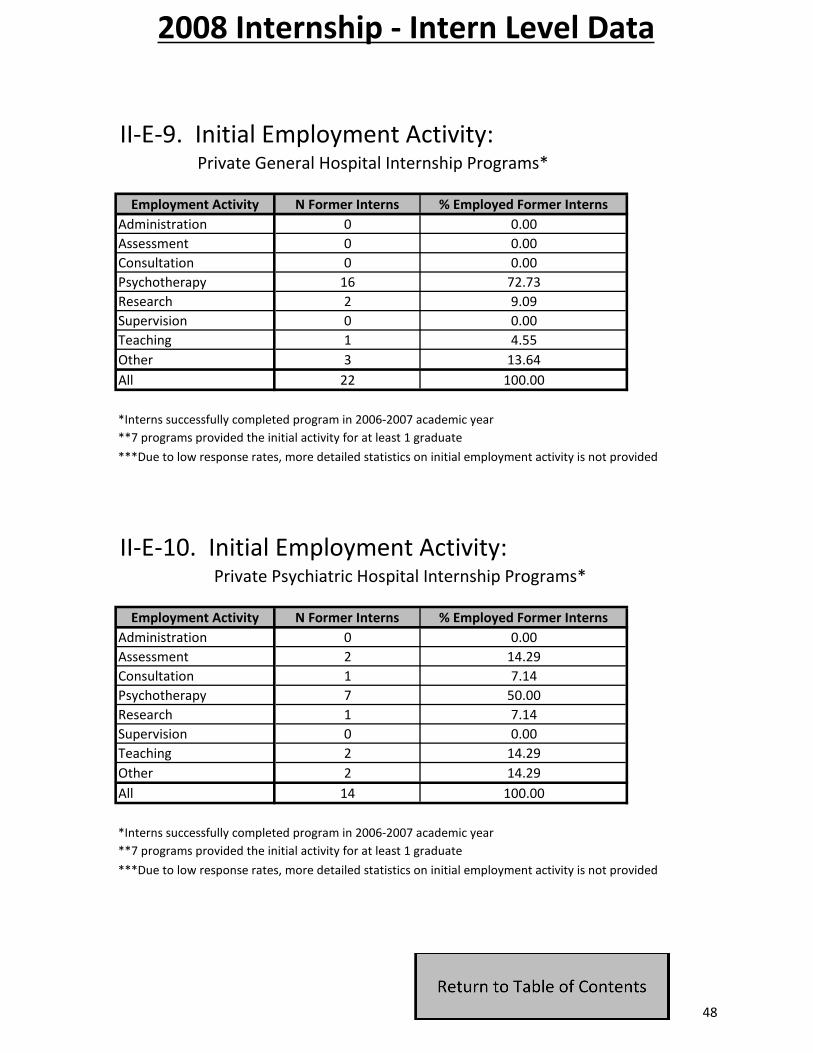
Private General Hospital Internship Programs*
Employment Activity N Former Interns % Employed Former InternsAdministration 0 0.00Assessment 0 0.00Consultation 0 0.00Psychotherapy 16 72.73Research 2 9.09Supervision 0 0.00Teaching 1 4.55Other 3 13.64All 22 100.00
*Interns successfully completed program in 2006-2007 academic year**7 programs provided the initial activity for at least 1 graduate
Private Psychiatric Hospital Internship Programs*
Employment Activity N Former Interns % Employed Former InternsAdministration 0 0.00Assessment 2 14.29Consultation 1 7.14Psychotherapy 7 50.00Research 1 7.14Supervision 0 0.00Teaching 2 14.29Other 2 14.29All 14 100.00
*Interns successfully completed program in 2006-2007 academic year**7 programs provided the initial activity for at least 1 graduate
II-E-9. Initial Employment Activity:
II-E-10. Initial Employment Activity:
***Due to low response rates, more detailed statistics on initial employment activity is not provided
***Due to low response rates, more detailed statistics on initial employment activity is not provided
2008 Internship - Intern Level Data
48

School District or System Internship Programs*
Employment Activity N Former Interns % Employed Former InternsAdministration 0 0.00Assessment 6 35.29Consultation 0 0.00Psychotherapy 4 23.53Research 2 11.76Supervision 0 0.00Teaching 1 5.88Other 4 23.53All 17 100.00
*Interns successfully completed program in 2006-2007 academic year**7 programs provided the initial activity for at least 1 graduate
State or County Hospital Internship Programs*
Employment Activity N Former Interns % Employed Former InternsAdministration 1 1.37Assessment 15 20.55Consultation 3 4.11Psychotherapy 36 49.32Research 3 4.11Supervision 1 1.37Teaching 3 4.11Other 14 19.18All 73 100.00
*Interns successfully completed program in 2006-2007 academic year**25 programs provided the initial activity for at least 1 graduate
II-E-11. Initial Employment Activity:
II-E-12. Initial Employment Activity:
***Due to low response rates, more detailed statistics on initial employment activity is not provided
***Due to low response rates, more detailed statistics on initial employment activity is not provided
2008 Internship - Intern Level Data
49
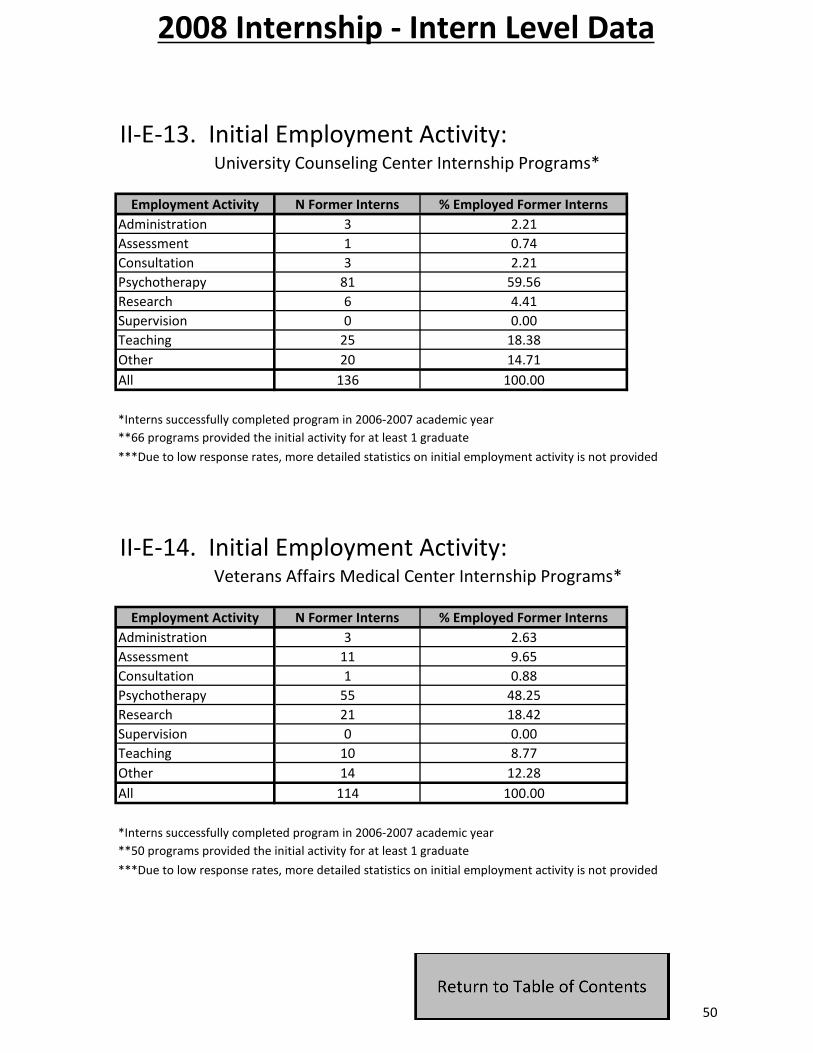
University Counseling Center Internship Programs*
Employment Activity N Former Interns % Employed Former InternsAdministration 3 2.21Assessment 1 0.74Consultation 3 2.21Psychotherapy 81 59.56Research 6 4.41Supervision 0 0.00Teaching 25 18.38Other 20 14.71All 136 100.00
*Interns successfully completed program in 2006-2007 academic year**66 programs provided the initial activity for at least 1 graduate
Veterans Affairs Medical Center Internship Programs*
Employment Activity N Former Interns % Employed Former InternsAdministration 3 2.63Assessment 11 9.65Consultation 1 0.88Psychotherapy 55 48.25Research 21 18.42Supervision 0 0.00Teaching 10 8.77Other 14 12.28All 114 100.00
*Interns successfully completed program in 2006-2007 academic year**50 programs provided the initial activity for at least 1 graduate
***Due to low response rates, more detailed statistics on initial employment activity is not provided
***Due to low response rates, more detailed statistics on initial employment activity is not provided
II-E-13. Initial Employment Activity:
II-E-14. Initial Employment Activity:
2008 Internship - Intern Level Data
50

Other Internship Programs*
Employment Activity N Former Interns % Employed Former InternsAdministration 0 0.00Assessment 4 13.79Consultation 3 10.34Psychotherapy 18 62.07Research 2 6.90Supervision 0 0.00Teaching 3 10.34Other 2 6.90All 29 100.00
*Interns successfully completed program in 2006-2007 academic year**5 programs provided the initial activity for at least 1 graduate
Accredited Internship Programs*
Employment Activity N Former Interns % Employed Former InternsAdministration 12 1.41Assessment 108 12.68Consultation 31 3.64Psychotherapy 436 51.17Research 74 8.69Supervision 7 0.82Teaching 82 9.62Other 133 15.61All 852 100.00
*Interns successfully completed program in 2006-2007 academic year**314 programs provided the initial activity for at least 1 graduate
***Due to low response rates, more detailed statistics on initial employment activity is not provided
***Due to low response rates, more detailed statistics on initial employment activity is not provided
II-E-15. Initial Employment Activity:
II-E-16. Initial Employment Activity:
2008 Internship - Intern Level Data
51

SECTION III: SUPERVISOR LEVEL DATA
52

Community Mental Health Center Internship Programs (N =65)
Mean Median Std. Dev. Min MaxFemale 42 4.27 0.65 0.00 1.10 0 6Male 14 1.42 0.22 0.00 0.55 0 2Total 56 5.70 0.86 0.00 1.27 0 6Female 1 0.10 0.02 0.00 0.12 0 1Male 1 0.10 0.02 0.00 0.12 0 1Total 2 0.20 0.03 0.00 0.17 0 1Female 27 2.75 0.42 0.00 0.85 0 5Male 15 1.53 0.23 0.00 0.63 0 4Total 42 4.27 0.65 0.00 1.32 0 9Female 449 45.68 6.91 6.00 4.73 0 19Male 322 32.76 4.95 4.00 4.24 0 19Total 771 78.43 11.86 10.00 7.69 2 36Female 63 6.41 0.97 0.00 1.60 0 9Male 28 2.85 0.43 0.00 0.90 0 5Total 91 9.26 1.40 1.00 2.24 0 14Female 10 1.02 0.15 0.00 0.36 0 1Male 5 0.51 0.08 0.00 0.32 0 2Total 15 1.53 0.23 0.00 0.52 0 3Female 2 0.20 0.03 0.00 0.17 0 1Male 0 0.00 0.00 0.00 0.00 0 0Total 2 0.20 0.03 0.00 0.17 0 1Female 0 0.00 0.00 0.00 0.00 0 0Male 0 0.00 0.00 0.00 0.00 0 0Total 0 0.00 0.00 0.00 0.00 0 0Female 2 0.20 0.03 0.00 0.17 0 1Male 2 0.20 0.03 0.00 0.25 0 2Total 4 0.41 0.06 0.00 0.39 0 3Female 596 60.63 9.17 7.00 5.94 0 25Male 387 39.37 5.95 5.00 5.03 0 25Total 983 100.00 15.12 12.00 9.58 2 45
III-A-1. Supervisor Gender & Race/Ethnicity
N Supervisor
Program Level Statistics (N)
African American - Black
American Indian - Alaska Native
Asian - Pacific Islander
Race/Ethnicity Gender
Total
Caucasian
Hispanic - Latino
Multi-Ethnic
Other
Supervisors at Canadian Institutions*Not Reported
*Accredited Canadian programs are not required to provide the race/ethnicity of supervisors.
% of All Supervisors
2008 Internship - Supervisor Level Data
53

Consortium Internship Programs (N=38)
Mean Median Std. Dev. Min MaxFemale 40 3.09 1.05 0.00 1.58 0 6Male 17 1.31 0.45 0.00 0.83 0 3Total 57 4.41 1.50 1.00 1.98 0 7Female 5 0.39 0.13 0.00 0.53 0 3Male 2 0.15 0.05 0.00 0.23 0 1Total 7 0.54 0.18 0.00 0.69 0 4Female 26 2.01 0.68 0.00 1.14 0 5Male 7 0.54 0.18 0.00 0.46 0 2Total 33 2.55 0.87 0.00 1.36 0 5Female 599 46.33 15.76 13.00 12.39 0 58Male 510 39.44 13.42 12.50 9.68 0 45Total 1,109 85.77 29.18 28.00 21.29 0 103Female 29 2.24 0.76 0.00 1.68 0 9Male 18 1.39 0.47 0.00 0.83 0 4Total 47 3.63 1.24 0.00 2.40 0 13Female 11 0.85 0.29 0.00 0.65 0 3Male 4 0.31 0.11 0.00 0.31 0 1Total 15 1.16 0.39 0.00 0.75 0 3Female 1 0.08 0.03 0.00 0.16 0 1Male 1 0.08 0.03 0.00 0.16 0 1Total 2 0.15 0.05 0.00 0.23 0 1Female 8 0.62 0.21 0.00 1.14 0 7Male 9 0.70 0.24 0.00 1.46 0 9Total 17 1.31 0.45 0.00 2.60 0 16Female 4 0.31 0.11 0.00 0.39 0 2Male 2 0.15 0.05 0.00 0.23 0 1Total 6 0.46 0.16 0.00 0.55 0 3Female 723 55.92 19.03 14.00 14.82 2 65Male 570 44.08 15.00 13.00 10.20 2 46Total 1,293 100.00 34.03 29.50 23.99 4 111
III-A-2. Supervisor Gender & Race/Ethnicity
N Supervisors
Program Level Statistics (N)
Caucasian
Hispanic - Latino
Multi-Ethnic
Race/Ethnicity Gender
Other
Supervisors at Canadian Institutions*Not Reported
Total
African American - Black
American Indian - Alaska Native
Asian - Pacific Islander
*Accredited Canadian programs are not required to provide the race/ethnicity of supervisors.
% of All Supervisors
2008 Internship - Supervisor Level Data
54

Correctional Facility Internship Programs (N=12)
Mean Median Std. Dev. Min MaxFemale 10 5.92 0.83 0.00 1.59 0 5Male 2 1.18 0.17 0.00 0.39 0 1Total 12 7.10 1.00 0.00 1.86 0 6Female 0 0.00 0.00 0.00 0.00 0 0Male 0 0.00 0.00 0.00 0.00 0 0Total 0 0.00 0.00 0.00 0.00 0 0Female 3 1.78 0.25 0.00 0.45 0 1Male 2 1.18 0.17 0.00 0.58 0 2Total 5 2.96 0.42 0.00 0.90 0 3Female 74 43.79 6.17 5.00 4.47 0 14Male 66 39.05 5.50 5.50 3.06 1 11Total 140 82.84 11.67 12.00 6.76 1 23Female 4 2.37 0.33 0.00 0.78 0 2Male 5 2.96 0.42 0.00 0.90 0 3Total 9 5.33 0.75 0.00 1.06 0 3Female 1 0.59 0.08 0.00 0.29 0 1Male 2 1.18 0.17 0.00 0.58 0 2Total 3 1.78 0.25 0.00 0.87 0 3Female 0 0.00 0.00 0.00 0.00 0 0Male 0 0.00 0.00 0.00 0.00 0 0Total 0 0.00 0.00 0.00 0.00 0 0Female 0 0.00 0.00 0.00 0.00 0 0Male 0 0.00 0.00 0.00 0.00 0 0Total 0 0.00 0.00 0.00 0.00 0 0Female 0 0.00 0.00 0.00 0.00 0 0Male 0 0.00 0.00 0.00 0.00 0 0Total 0 0.00 0.00 0.00 0.00 0 0Female 92 54.44 7.67 6.00 5.63 1 19Male 77 45.56 6.42 5.50 3.73 2 12Total 169 100.00 14.08 12.50 8.80 4 31
III-A-3. Supervisor Gender & Race/Ethnicity
Not Reported
N Supervisors
Program Level Statistics (N)
African American - Black
American Indian - Alaska Native
Asian - Pacific Islander
Total
Caucasian
Hispanic - Latino
Multi-Ethnic
Other
Supervisors at Canadian Institutions*
Race/Ethnicity Gender
*Accredited Canadian programs are not required to provide the race/ethnicity of supervisors.
% of All Supervisors
2008 Internship - Supervisor Level Data
55

General Hospital Internship Programs (N=7)
Mean Median Std. Dev. Min MaxFemale 5 3.03 0.71 0.00 1.11 0 3Male 3 1.82 0.43 0.00 1.13 0 3Total 8 4.85 1.14 0.00 1.68 0 4Female 0 0.00 0.00 0.00 0.00 0 0Male 0 0.00 0.00 0.00 0.00 0 0Total 0 0.00 0.00 0.00 0.00 0 0Female 4 2.42 0.57 0.00 0.79 0 2Male 2 1.21 0.29 0.00 0.49 0 1Total 6 3.64 0.86 1.00 0.90 0 2Female 42 25.45 6.00 4.00 7.55 0 22Male 24 14.55 3.43 2.00 4.89 0 14Total 66 40.00 9.43 7.00 12.37 0 36Female 12 7.27 1.71 2.00 1.38 0 3Male 5 3.03 0.71 1.00 0.76 0 2Total 17 10.30 2.43 3.00 1.72 0 4Female 0 0.00 0.00 0.00 0.00 0 0Male 0 0.00 0.00 0.00 0.00 0 0Total 0 0.00 0.00 0.00 0.00 0 0Female 0 0.00 0.00 0.00 0.00 0 0Male 0 0.00 0.00 0.00 0.00 0 0Total 0 0.00 0.00 0.00 0.00 0 0Female 51 30.91 7.29 0.00 12.45 0 26Male 17 10.30 2.43 0.00 4.16 0 9Total 68 41.21 9.71 0.00 16.59 0 34Female 0 0.00 0.00 0.00 0.00 0 0Male 0 0.00 0.00 0.00 0.00 0 0Total 0 0.00 0.00 0.00 0.00 0 0Female 114 69.09 16.29 13.00 8.67 7 26Male 51 30.91 7.29 5.00 5.68 3 19Total 165 100.00 23.57 17.00 13.43 11 44
III-A-4. Supervisor Gender & Race/Ethnicity
African American - Black
American Indian - Alaska Native
Asian - Pacific Islander
Caucasian
Hispanic - Latino
Multi-Ethnic
Race/Ethnicity GenderN
SupervisorsProgram Level Statistics (N)
Other
Supervisors at Canadian Institutions*Not Reported
Total
*Accredited Canadian programs are not required to provide the race/ethnicity of supervisors.
% of All Supervisors
2008 Internship - Supervisor Level Data
56

Health Maintenance Organization Internship Programs (N=2)
Mean Median Std. Dev. Min MaxFemale 3 5.26 1.50 1.50 0.71 1 2Male 1 1.75 0.50 0.50 0.71 0 1Total 4 7.02 2.00 2.00 0.00 2 2Female 1 1.75 0.50 0.50 0.71 0 1Male 0 0.00 0.00 0.00 0.00 0 0Total 1 1.75 0.50 0.50 0.71 0 1Female 4 7.02 2.00 2.00 0.00 2 2Male 2 3.51 1.00 1.00 1.41 0 2Total 6 10.53 3.00 3.00 1.41 2 4Female 25 43.86 12.50 12.50 9.19 6 19Male 18 31.58 9.00 9.00 7.07 4 14Total 43 75.44 21.50 21.50 16.26 10 33Female 1 1.75 0.50 0.50 0.71 0 1Male 2 3.51 1.00 1.00 1.41 0 2Total 3 5.26 1.50 1.50 2.12 0 3Female 0 0.00 0.00 0.00 0.00 0 0Male 0 0.00 0.00 0.00 0.00 0 0Total 0 0.00 0.00 0.00 0.00 0 0Female 0 0.00 0.00 0.00 0.00 0 0Male 0 0.00 0.00 0.00 0.00 0 0Total 0 0.00 0.00 0.00 0.00 0 0Female 0 0.00 0.00 0.00 0.00 0 0Male 0 0.00 0.00 0.00 0.00 0 0Total 0 0.00 0.00 0.00 0.00 0 0Female 0 0.00 0.00 0.00 0.00 0 0Male 0 0.00 0.00 0.00 0.00 0 0Total 0 0.00 0.00 0.00 0.00 0 0Female 34 59.65 17.00 17.00 11.31 9 25Male 23 40.35 11.50 11.50 9.19 5 18Total 57 100.00 28.50 28.50 20.51 14 43
III-A-5. Supervisor Gender & Race/Ethnicity
Total
N Supervisors
Program Level Statistics (N)
African American - Black
American Indian - Alaska Native
Asian - Pacific Islander
Race/Ethnicity Gender
Caucasian
Hispanic - Latino
Multi-Ethnic
Other
Supervisors at Canadian Institutions*Not Reported
*Accredited Canadian programs are not required to provide the race/ethnicity of supervisors.
% of All Supervisors
2008 Internship - Supervisor Level Data
57

Medical Center Internship Programs (N=47)
Mean Median Std. Dev. Min MaxFemale 36 2.53 0.77 0.00 1.15 0 4Male 16 1.13 0.34 0.00 0.64 0 2Total 52 3.66 1.11 0.00 1.58 0 6Female 1 0.07 0.02 0.00 0.15 0 1Male 0 0.00 0.00 0.00 0.00 0 0Total 1 0.07 0.02 0.00 0.15 0 1Female 32 2.25 0.68 0.00 0.93 0 5Male 6 0.42 0.13 0.00 0.34 0 1Total 38 2.67 0.81 1.00 1.06 0 5Female 620 43.63 13.19 10.00 12.46 0 47Male 428 30.12 9.11 6.00 8.68 0 37Total 1,048 73.75 22.30 15.00 20.53 0 76Female 57 4.01 1.21 0.00 2.17 0 11Male 27 1.90 0.57 0.00 1.16 0 5Total 84 5.91 1.79 0.00 3.01 0 12Female 8 0.56 0.17 0.00 0.48 0 2Male 3 0.21 0.06 0.00 0.32 0 2Total 11 0.77 0.23 0.00 0.70 0 4Female 0 0.00 0.00 0.00 0.00 0 0Male 0 0.00 0.00 0.00 0.00 0 0Total 0 0.00 0.00 0.00 0.00 0 0Female 145 10.20 3.09 0.00 9.23 0 35Male 37 2.60 0.79 0.00 2.54 0 12Total 182 12.81 3.87 0.00 11.63 0 43Female 2 0.14 0.04 0.00 0.20 0 1Male 3 0.21 0.06 0.00 0.32 0 2Total 5 0.35 0.11 0.00 0.43 0 2Female 901 63.41 19.17 18.00 14.52 2 58Male 520 36.59 11.06 8.00 9.12 1 40Total 1,421 100.00 30.23 25.00 22.39 6 90
III-A-6. Supervisor Gender & Race/Ethnicity
Race/Ethnicity Gender
Supervisors at Canadian Institutions*Not Reported
Total
N Supervisors
Program Level Statistics (N)
Other
African American - Black
American Indian - Alaska Native
Asian - Pacific Islander
Caucasian
Hispanic - Latino
Multi-Ethnic
*Accredited Canadian programs are not required to provide the race/ethnicity of supervisors.
% of All Supervisors
2008 Internship - Supervisor Level Data
58

Medical School Internship Programs (N=32)
Mean Median Std. Dev. Min MaxFemale 28 2.83 0.88 1.00 1.10 0 4Male 15 1.52 0.47 0.00 1.02 0 4Total 43 4.35 1.34 1.00 1.60 0 6Female 3 0.30 0.09 0.00 0.39 0 2Male 1 0.10 0.03 0.00 0.18 0 1Total 4 0.40 0.13 0.00 0.49 0 2Female 21 2.13 0.66 0.00 0.97 0 3Male 6 0.61 0.19 0.00 0.47 0 2Total 27 2.73 0.84 0.00 1.22 0 5Female 420 42.51 13.13 11.50 9.95 0 48Male 357 36.13 11.16 10.50 8.79 0 47Total 777 78.64 24.28 23.00 18.31 0 95Female 24 2.43 0.75 0.00 1.11 0 4Male 15 1.52 0.47 0.00 0.98 0 5Total 39 3.95 1.22 0.00 1.72 0 6Female 5 0.51 0.16 0.00 0.45 0 2Male 8 0.81 0.25 0.00 1.24 0 7Total 13 1.32 0.41 0.00 1.60 0 9Female 0 0.00 0.00 0.00 0.00 0 0Male 0 0.00 0.00 0.00 0.00 0 0Total 0 0.00 0.00 0.00 0.00 0 0Female 44 4.45 1.38 0.00 5.62 0 28Male 37 3.74 1.16 0.00 4.84 0 25Total 81 8.20 2.53 0.00 10.45 0 53Female 3 0.30 0.09 0.00 0.39 0 2Male 1 0.10 0.03 0.00 0.18 0 1Total 4 0.40 0.13 0.00 0.42 0 2Female 548 55.47 17.13 16.00 11.07 2 55Male 440 44.53 13.75 13.50 9.93 1 55Total 988 100.00 30.88 28.00 20.41 3 110
III-A-7. Supervisor Gender & Race/Ethnicity
Race/Ethnicity GenderProgram Level Statistics (N)
African American - Black
American Indian - Alaska Native
Asian - Pacific Islander
Total
Hispanic - Latino
Multi-Ethnic
Other
Supervisors at Canadian Institutions*Not Reported
N Supervisors
*Accredited Canadian programs are not required to provide the race/ethnicity of supervisors.
Caucasian
% of All Supervisors
2008 Internship - Supervisor Level Data
59

Military Medical Center (N=10)
Mean Median Std. Dev. Min MaxFemale 8 3.46 0.80 1.00 0.79 0 2Male 4 1.73 0.40 0.00 0.70 0 2Total 12 5.19 1.20 1.00 0.92 0 3Female 0 0.00 0.00 0.00 0.00 0 0Male 0 0.00 0.00 0.00 0.00 0 0Total 0 0.00 0.00 0.00 0.00 0 0Female 5 2.16 0.50 0.00 0.71 0 2Male 2 0.87 0.20 0.00 0.42 0 1Total 7 3.03 0.70 0.00 0.95 0 2Female 87 37.66 8.70 8.50 5.95 1 22Male 104 45.02 10.40 9.50 8.62 2 33Total 191 82.68 19.10 17.50 13.97 3 55Female 10 4.33 1.00 0.00 1.49 0 4Male 4 1.73 0.40 0.00 0.70 0 2Total 14 6.06 1.40 1.00 1.51 0 4Female 3 1.30 0.30 0.00 0.48 0 1Male 4 1.73 0.40 0.00 0.70 0 2Total 7 3.03 0.70 0.50 0.82 0 2Female 0 0.00 0.00 0.00 0.00 0 0Male 0 0.00 0.00 0.00 0.00 0 0Total 0 0.00 0.00 0.00 0.00 0 0Female 0 0.00 0.00 0.00 0.00 0 0Male 0 0.00 0.00 0.00 0.00 0 0Total 0 0.00 0.00 0.00 0.00 0 0Female 0 0.00 0.00 0.00 0.00 0 0Male 0 0.00 0.00 0.00 0.00 0 0Total 0 0.00 0.00 0.00 0.00 0 0Female 113 48.92 11.30 10.50 6.99 1 24Male 118 51.08 11.80 11.00 8.99 3 35Total 231 100.00 23.10 21.50 14.82 5 59
III-A-8. Supervisor Gender & Race/Ethnicity
African American - Black
American Indian - Alaska Native
Asian - Pacific Islander
Caucasian
Hispanic - Latino
Multi-Ethnic
Race/Ethnicity Gender
*Accredited Canadian programs are not required to provide the race/ethnicity of supervisors.
Other
Supervisors at Canadian Institutions*Not Reported
Total
N Supervisors
Program Level Statistics (N)% of All Supervisors
2008 Internship - Supervisor Level Data
60

Private General Hospital Internship Programs (N=11)
Mean Median Std. Dev. Min MaxFemale 8 3.16 0.73 0.00 1.42 0 4Male 1 0.40 0.09 0.00 0.30 0 1Total 9 3.56 0.82 0.00 1.40 0 4Female 0 0.00 0.00 0.00 0.00 0 0Male 2 0.79 0.18 0.00 0.60 0 2Total 2 0.79 0.18 0.00 0.60 0 2Female 12 4.74 1.09 1.00 1.30 0 4Male 4 1.58 0.36 0.00 0.92 0 3Total 16 6.32 1.45 1.00 2.02 0 7Female 134 52.96 12.18 11.00 9.78 2 28Male 80 31.62 7.27 5.00 4.80 2 16Total 214 84.58 19.45 16.00 14.11 4 44Female 4 1.58 0.36 0.00 0.51 0 1Male 3 1.19 0.27 0.00 0.47 0 1Total 7 2.77 0.64 0.00 0.81 0 2Female 2 0.79 0.18 0.00 0.41 0 1Male 2 0.79 0.18 0.00 0.41 0 1Total 4 1.58 0.36 0.00 0.50 0 1Female 0 0.00 0.00 0.00 0.00 0 0Male 1 0.40 0.09 0.00 0.30 0 1Total 1 0.40 0.09 0.00 0.30 0 1Female 0 0.00 0.00 0.00 0.00 0 0Male 0 0.00 0.00 0.00 0.00 0 0Total 0 0.00 0.00 0.00 0.00 0 0Female 0 0.00 0.00 0.00 0.00 0 0Male 0 0.00 0.00 0.00 0.00 0 0Total 0 0.00 0.00 0.00 0.00 0 0Female 160 63.24 14.55 12.00 11.37 3 32Male 93 36.76 8.45 5.00 5.97 2 20Total 253 100.00 23.00 17.00 16.94 6 50
III-A-9. Supervisor Gender & Race/Ethnicity
Total
Caucasian
Hispanic - Latino
Multi-Ethnic
Other
Supervisors at Canadian Institutions*Not Reported
*Accredited Canadian programs are not required to provide the race/ethnicity of supervisors.
N Supervisors
Program Level Statistics (N)
African American - Black
American Indian - Alaska Native
Asian - Pacific Islander
Race/Ethnicity Gender% of All
Supervisors
2008 Internship - Supervisor Level Data
61

Private Psychiatric Hospital Internship Programs (N=11)
Mean Median Std. Dev. Min MaxFemale 2 0.87 0.18 0.00 0.41 0 1Male 2 0.87 0.18 0.00 0.60 0 2Total 4 1.75 0.36 0.00 0.67 0 2Female 0 0.00 0.00 0.00 0.00 0 0Male 0 0.00 0.00 0.00 0.00 0 0Total 0 0.00 0.00 0.00 0.00 0 0Female 4 1.75 0.36 0.00 0.50 0 1Male 6 2.62 0.55 1.00 0.52 0 1Total 10 4.37 0.91 1.00 0.83 0 2Female 121 52.84 11.00 9.00 7.59 1 25Male 88 38.43 8.00 7.00 6.26 2 21Total 209 91.27 19.00 16.00 13.24 5 40Female 1 0.44 0.09 0.00 0.30 0 1Male 3 1.31 0.27 0.00 0.65 0 2Total 4 1.75 0.36 0.00 0.92 0 3Female 2 0.87 0.18 0.00 0.41 0 1Male 0 0.00 0.00 0.00 0.00 0 0Total 2 0.87 0.18 0.00 0.40 0 1Female 0 0.00 0.00 0.00 0.00 0 0Male 0 0.00 0.00 0.00 0.00 0 0Total 0 0.00 0.00 0.00 0.00 0 0Female 0 0.00 0.00 0.00 0.00 0 0Male 0 0.00 0.00 0.00 0.00 0 0Total 0 0.00 0.00 0.00 0.00 0 0Female 0 0.00 0.00 0.00 0.00 0 0Male 0 0.00 0.00 0.00 0.00 0 0Total 0 0.00 0.00 0.00 0.00 0 0Female 130 56.77 11.82 10.00 7.90 2 26Male 99 43.23 9.00 7.00 6.93 2 24Total 229 100.00 20.82 18.00 14.11 6 45
III-A-10. Supervisor Gender & Race/Ethnicity
Race/Ethnicity GenderN
SupervisorsProgram Level Statistics (N)% of All
Supervisors
Other
Supervisors at Canadian Institutions*Not Reported
Total
African American - Black
American Indian - Alaska Native
Asian - Pacific Islander
Caucasian
Hispanic - Latino
Multi-Ethnic
*Accredited Canadian programs are not required to provide the race/ethnicity of supervisors.
2008 Internship - Supervisor Level Data
62

School District or System Internship Programs (N=7)
Mean Median Std. Dev. Min MaxFemale 8 8.79 1.14 1.00 1.46 0 4Male 1 1.10 0.14 0.00 0.38 0 1Total 9 9.89 1.29 1.00 1.50 0 4Female 0 0.00 0.00 0.00 0.00 0 0Male 0 0.00 0.00 0.00 0.00 0 0Total 0 0.00 0.00 0.00 0.00 0 0Female 5 5.49 0.71 0.00 1.89 0 5Male 2 2.20 0.29 0.00 0.76 0 2Total 7 7.69 1.00 0.00 2.65 0 7Female 43 47.25 6.14 4.00 5.46 2 18Male 25 27.47 3.57 4.00 2.82 0 9Total 68 74.73 9.71 9.00 5.94 4 22Female 4 4.40 0.57 0.00 0.79 0 2Male 0 0.00 0.00 0.00 0.00 0 0Total 4 4.40 0.57 0.00 0.79 0 2Female 2 2.20 0.29 0.00 0.49 0 1Male 1 1.10 0.14 0.00 0.38 0 1Total 3 3.30 0.43 0.00 0.79 0 2Female 0 0.00 0.00 0.00 0.00 0 0Male 0 0.00 0.00 0.00 0.00 0 0Total 0 0.00 0.00 0.00 0.00 0 0Female 0 0.00 0.00 0.00 0.00 0 0Male 0 0.00 0.00 0.00 0.00 0 0Total 0 0.00 0.00 0.00 0.00 0 0Female 0 0.00 0.00 0.00 0.00 0 0Male 0 0.00 0.00 0.00 0.00 0 0Total 0 0.00 0.00 0.00 0.00 0 0Female 62 68.13 8.86 7.00 6.09 3 21Male 29 31.87 4.14 4.00 3.67 1 12Total 91 100.00 13.00 11.00 7.21 5 25
African American - Black
American Indian - Alaska Native
Asian - Pacific Islander
Caucasian
Hispanic - Latino
Multi-Ethnic
Other
Supervisors at Canadian Institutions*Not Reported
Total
*Accredited Canadian programs are not required to provide the race/ethnicity of supervisors.
Race/Ethnicity GenderN
SupervisorsProgram Level Statistics (N)% of All
Supervisors
III-A-11. Supervisor Gender & Race/Ethnicity
2008 Internship - Supervisor Level Data
63

State or County Hospital Internship Programs (N=41)
Mean Median Std. Dev. Min MaxFemale 23 2.91 0.56 0.00 0.81 0 3Male 18 2.28 0.44 0.00 0.74 0 3Total 41 5.19 1.00 1.00 1.16 0 5Female 0 0.00 0.00 0.00 0.00 0 0Male 2 0.25 0.05 0.00 0.22 0 1Total 2 0.25 0.05 0.00 0.22 0 1Female 27 3.42 0.66 0.00 1.02 0 5Male 15 1.90 0.37 0.00 0.83 0 4Total 42 5.32 1.02 1.00 1.41 0 5Female 279 35.32 6.80 6.00 4.17 0 20Male 356 45.06 8.68 7.00 6.18 0 26Total 635 80.38 15.49 14.00 8.82 0 41Female 17 2.15 0.41 0.00 0.63 0 2Male 11 1.39 0.27 0.00 0.59 0 2Total 28 3.54 0.68 0.00 0.96 0 4Female 11 1.39 0.27 0.00 0.55 0 2Male 4 0.51 0.10 0.00 0.30 0 1Total 15 1.90 0.37 0.00 0.73 0 3Female 0 0.00 0.00 0.00 0.00 0 0Male 0 0.00 0.00 0.00 0.00 0 0Total 0 0.00 0.00 0.00 0.00 0 0Female 17 2.15 0.41 0.00 2.66 0 17Male 9 1.14 0.22 0.00 1.41 0 9Total 26 3.29 0.63 0.00 4.06 0 26Female 0 0.00 0.00 0.00 0.00 0 0Male 1 0.13 0.02 0.00 0.16 0 1Total 1 0.13 0.02 0.00 0.16 0 1Female 374 47.34 9.12 8.00 5.10 2 26Male 416 52.66 10.15 8.00 6.65 0 30Total 790 100.00 19.27 17.00 9.83 5 45
African American - Black
American Indian - Alaska Native
Asian - Pacific Islander
Caucasian
Hispanic - Latino
Race/Ethnicity GenderN
SupervisorsProgram Level Statistics (N)% of All
Supervisors
III-A-12. Supervisor Gender & Race/Ethnicity
Other
Supervisors at Canadian Institutions*Not Reported
Total
*Accredited Canadian programs are not required to provide the race/ethnicity of supervisors.
Multi-Ethnic
2008 Internship - Supervisor Level Data
64

University Counseling Center Internship Programs (N=95)
Mean Median Std. Dev. Min MaxFemale 94 6.51 0.99 1.00 1.31 0 8Male 56 3.88 0.59 0.00 0.97 0 6Total 150 10.39 1.58 1.00 1.95 0 11Female 2 0.14 0.02 0.00 0.14 0 1Male 4 0.28 0.04 0.00 0.25 0 2Total 6 0.42 0.06 0.00 0.28 0 2Female 76 5.26 0.80 0.00 1.14 0 6Male 33 2.29 0.35 0.00 0.61 0 2Total 109 7.55 1.15 1.00 1.47 0 7Female 598 41.41 6.29 6.00 3.91 0 19Male 362 25.07 3.81 3.00 2.86 0 17Total 960 66.48 10.11 9.00 6.09 0 32Female 59 4.09 0.62 0.00 1.16 0 7Male 32 2.22 0.34 0.00 0.65 0 3Total 91 6.30 0.96 1.00 1.48 0 10Female 16 1.11 0.17 0.00 0.40 0 2Male 6 0.42 0.06 0.00 0.25 0 1Total 22 1.52 0.23 0.00 0.47 0 2Female 0 0.00 0.00 0.00 0.00 0 0Male 0 0.00 0.00 0.00 0.00 0 0Total 0 0.00 0.00 0.00 0.00 0 0Female 53 3.67 0.56 0.00 2.82 0 17Male 37 2.56 0.39 0.00 2.09 0 14Total 90 6.23 0.95 0.00 4.88 0 31Female 12 0.83 0.13 0.00 0.39 0 2Male 4 0.28 0.04 0.00 0.20 0 1Total 16 1.11 0.17 0.00 0.45 0 2Female 910 63.02 9.58 8.00 5.23 2 28Male 534 36.98 5.62 5.00 3.43 1 23Total 1,444 100.00 15.20 13.00 7.76 3 39
*Accredited Canadian programs are not required to provide the race/ethnicity of supervisors.
N Supervisors
Program Level Statistics (N)
African American - Black
American Indian - Alaska Native
Asian - Pacific Islander
Race/Ethnicity Gender
III-A-13. Supervisor Gender & Race/Ethnicity
% of All Supervisors
Caucasian
Hispanic - Latino
Multi-Ethnic
Other
Supervisors at Canadian Institutions*Not Reported
Total
2008 Internship - Supervisor Level Data
65

Veterans Affairs Medical Center Internship Programs (N= 71)
Mean Median Std. Dev. Min MaxFemale 61 3.48 0.86 0.00 1.20 0 6Male 32 1.82 0.45 0.00 0.75 0 3Total 93 5.30 1.31 1.00 1.44 0 8Female 6 0.34 0.08 0.00 0.28 0 1Male 5 0.29 0.07 0.00 0.31 0 2Total 11 0.63 0.15 0.00 0.47 0 3Female 36 2.05 0.51 0.00 0.92 0 4Male 26 1.48 0.37 0.00 0.78 0 4Total 62 3.53 0.87 0.00 1.45 0 8Female 727 41.45 10.24 9.00 6.82 0 36Male 751 42.82 10.58 10.00 5.62 0 28Total 1,478 84.26 20.82 18.00 11.25 0 58Female 52 2.96 0.73 0.00 1.78 0 13Male 29 1.65 0.41 0.00 1.04 0 8Total 81 4.62 1.14 1.00 2.65 0 21Female 13 0.74 0.18 0.00 0.49 0 2Male 8 0.46 0.11 0.00 0.36 0 2Total 21 1.20 0.30 0.00 0.66 0 4Female 0 0.00 0.00 0.00 0.00 0 0Male 0 0.00 0.00 0.00 0.00 0 0Total 0 0.00 0.00 0.00 0.00 0 0Female 0 0.00 0.00 0.00 0.00 0 0Male 0 0.00 0.00 0.00 0.00 0 0Total 0 0.00 0.00 0.00 0.00 0 0Female 3 0.17 0.04 0.00 0.20 0 1Male 5 0.29 0.07 0.00 0.31 0 2Total 8 0.46 0.11 0.00 0.36 0 2Female 898 51.20 12.65 10.00 7.76 2 41Male 856 48.80 12.06 11.00 6.03 3 32Total 1,754 100.00 24.70 22.00 12.44 6 73
*Accredited Canadian programs are not required to provide the race/ethnicity of supervisors.
GenderN
SupervisorsProgram Level Statistics (N)% of All
Supervisors
III-A-14. Supervisor Gender & Race/Ethnicity
Other
Supervisors at Canadian Institutions*Not Reported
Total
African American - Black
American Indian - Alaska Native
Asian - Pacific Islander
Caucasian
Hispanic - Latino
Multi-Ethnic
Race/Ethnicity
2008 Internship - Supervisor Level Data
66

Other Internship Programs (N=16)
Mean Median Std. Dev. Min MaxFemale 22 6.75 1.38 0.00 2.22 0 8Male 6 1.84 0.38 0.00 0.62 0 2Total 28 8.59 1.75 1.00 2.44 0 9Female 0 0.00 0.00 0.00 0.00 0 0Male 0 0.00 0.00 0.00 0.00 0 0Total 0 0.00 0.00 0.00 0.00 0 0Female 7 2.15 0.44 0.00 0.89 0 3Male 5 1.53 0.31 0.00 0.79 0 3Total 12 3.68 0.75 0.00 1.53 0 6Female 153 46.93 9.56 6.00 10.05 1 34Male 110 33.74 6.88 5.00 7.72 0 32Total 263 80.67 16.44 10.00 16.60 3 66Female 11 3.37 0.69 0.00 1.74 0 6Male 7 2.15 0.44 0.00 0.63 0 2Total 18 5.52 1.13 0.00 2.03 0 7Female 4 1.23 0.25 0.00 0.58 0 2Male 0 0.00 0.00 0.00 0.00 0 0Total 4 1.23 0.25 0.00 0.58 0 2Female 1 0.31 0.06 0.00 0.25 0 1Male 0 0.00 0.00 0.00 0.00 0 0Total 1 0.31 0.06 0.00 0.25 0 1Female 0 0.00 0.00 0.00 0.00 0 0Male 0 0.00 0.00 0.00 0.00 0 0Total 0 0.00 0.00 0.00 0.00 0 0Female 0 0.00 0.00 0.00 0.00 0 0Male 0 0.00 0.00 0.00 0.00 0 0Total 0 0.00 0.00 0.00 0.00 0 0Female 198 60.74 12.38 7.50 11.18 2 39Male 128 39.26 8.00 6.00 8.45 1 35Total 326 100.00 20.38 11.00 18.38 4 74
III-A-15. Supervisor Gender & Race/Ethnicity
*Accredited Canadian programs are not required to provide the race/ethnicity of supervisors.
Total
Caucasian
Hispanic - Latino
Multi-Ethnic
Other
Supervisors at Canadian Institutions*Not Reported
N Supervisors
Program Level Statistics (N)
African American - Black
American Indian - Alaska Native
Asian - Pacific Islander
Race/Ethnicity Gender% of All
Supervisors
2008 Internship - Supervisor Level Data
67
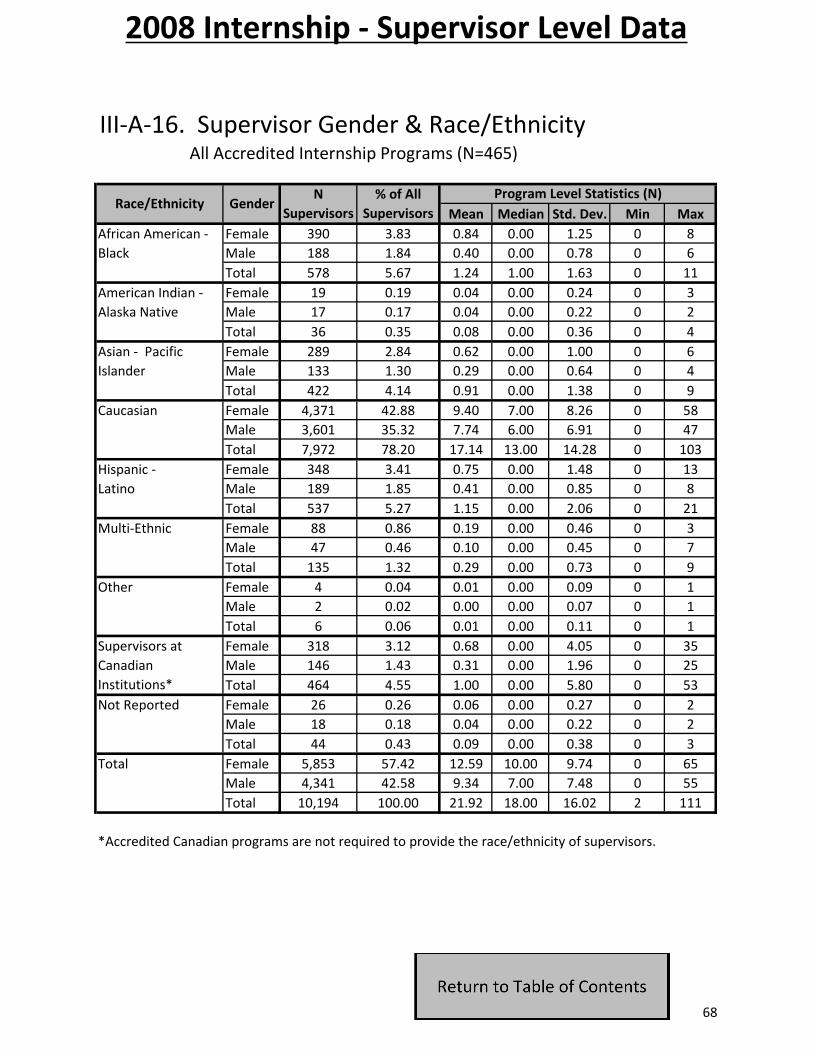
All Accredited Internship Programs (N=465)
Mean Median Std. Dev. Min MaxFemale 390 3.83 0.84 0.00 1.25 0 8Male 188 1.84 0.40 0.00 0.78 0 6Total 578 5.67 1.24 1.00 1.63 0 11Female 19 0.19 0.04 0.00 0.24 0 3Male 17 0.17 0.04 0.00 0.22 0 2Total 36 0.35 0.08 0.00 0.36 0 4Female 289 2.84 0.62 0.00 1.00 0 6Male 133 1.30 0.29 0.00 0.64 0 4Total 422 4.14 0.91 0.00 1.38 0 9Female 4,371 42.88 9.40 7.00 8.26 0 58Male 3,601 35.32 7.74 6.00 6.91 0 47Total 7,972 78.20 17.14 13.00 14.28 0 103Female 348 3.41 0.75 0.00 1.48 0 13Male 189 1.85 0.41 0.00 0.85 0 8Total 537 5.27 1.15 0.00 2.06 0 21Female 88 0.86 0.19 0.00 0.46 0 3Male 47 0.46 0.10 0.00 0.45 0 7Total 135 1.32 0.29 0.00 0.73 0 9Female 4 0.04 0.01 0.00 0.09 0 1Male 2 0.02 0.00 0.00 0.07 0 1Total 6 0.06 0.01 0.00 0.11 0 1Female 318 3.12 0.68 0.00 4.05 0 35Male 146 1.43 0.31 0.00 1.96 0 25Total 464 4.55 1.00 0.00 5.80 0 53Female 26 0.26 0.06 0.00 0.27 0 2Male 18 0.18 0.04 0.00 0.22 0 2Total 44 0.43 0.09 0.00 0.38 0 3Female 5,853 57.42 12.59 10.00 9.74 0 65Male 4,341 42.58 9.34 7.00 7.48 0 55Total 10,194 100.00 21.92 18.00 16.02 2 111
*Accredited Canadian programs are not required to provide the race/ethnicity of supervisors.
III-A-16. Supervisor Gender & Race/Ethnicity
African American - Black
American Indian - Alaska Native
Asian - Pacific Islander
Caucasian
Hispanic - Latino
Multi-Ethnic
Race/Ethnicity GenderN
SupervisorsProgram Level Statistics (N)
Other
Supervisors at Canadian Institutions*Not Reported
Total
% of All Supervisors
2008 Internship - Supervisor Level Data
68

III-B-1. Supervisor Classifications During the full-review process, programs must demonstrate that they have resources of appropriate quality and sufficiency to achieve education and training goals and objectives. The number and quality of supervisors falls under this requirement. When completing records on supervisors, programs must identify their role by selecting a classification. The definitions of these classifications are provided below.
Classification Definition
Training Supervisor Staff who are involved with planning/implementation of the internship and who have direct contact with interns.
Other Agency/ Institution Supervisors
Staff who are not involved in planning/implementation of the internship but who have direct contact with interns.
Other Contributors Staff who are not involved in planning/implementation of the internship and who do not have direct contact with interns, but who provide training opportunities (e.g., didactic seminars).
2008 Internship - Supervisor Level Data
69

III-B-2-a. Supervisor Classifications
Training Supervisor
Other Agency Supervisor
Other Contributors
Total
Sum 510 230 243 983Mean 7.85 3.54 3.74 15.12Median 7.00 2.00 1.00 12.00Std. Dev. 4.17 3.71 6.23 9.58Minimum 2 0 0 2Maximum 21 13 30 45Sum 729 338 226 1,293Mean 19.18 8.89 5.95 34.03Median 13.50 5.00 4.00 29.50Std. Dev. 15.98 12.35 6.88 23.99Minimum 2 0 0 4Maximum 78 58 32 111Sum 122 33 14 169Mean 10.17 2.75 1.17 14.08Median 8.00 .00 .00 12.50Std. Dev. 7.42 4.73 1.80 8.80Minimum 4 0 0 4Maximum 31 13 5 31Sum 100 31 34 165Mean 14.29 4.43 4.86 23.57Median 12.00 3.00 2.00 17.00Std. Dev. 8.67 5.59 8.13 13.43Minimum 4 0 0 11Maximum 32 15 23 44Sum 14 13 30 57Mean 7.00 6.50 15.00 28.50Median 7.00 6.50 15.00 28.50Std. Dev. .00 6.36 14.14 20.51Minimum 7 2 5 14Maximum 7 11 25 43Sum 702 406 313 1,421Mean 14.94 8.64 6.66 30.23Median 12.00 2.00 3.00 25.00Std. Dev. 9.05 15.73 10.63 22.39Minimum 3 0 0 6Maximum 40 67 60 90
Community Mental Health Center
Consortium
Correctional Facility
General Hospital
Health Maintenance Organization
Medical Center
2008 Internship - Supervisor Level Data
70

III-B-2-b. Supervisor Classifications
Training Supervisor
Other Agency Supervisor
Other Contributors
Total
Sum 460 287 241 988Mean 14.38 8.97 7.53 30.88Median 11.50 8.00 3.50 28.00Std. Dev. 8.40 8.70 12.50 20.41Minimum 3 0 0 3Maximum 31 34 68 110Sum 130 52 49 231Mean 13.00 5.20 4.90 23.10Median 12.00 3.00 3.50 21.50Std. Dev. 5.96 7.00 4.70 14.82Minimum 5 0 0 5Maximum 24 20 15 59Sum 140 91 22 253Mean 12.73 8.27 2.00 23.00Median 11.00 4.00 .00 17.00Std. Dev. 6.02 11.74 3.03 16.94Minimum 6 0 0 6Maximum 24 34 9 50Sum 139 46 44 229Mean 12.64 4.18 4.00 20.82Median 7.00 5.00 2.00 18.00Std. Dev. 12.22 4.24 5.39 14.11Minimum 6 0 0 6Maximum 43 11 18 45Sum 65 20 6 91Mean 9.29 2.86 .86 13.00Median 10.00 1.00 .00 11.00Std. Dev. 3.59 3.89 1.21 7.21Minimum 5 0 0 5Maximum 15 11 3 25Sum 473 163 154 790Mean 11.54 3.98 3.76 19.27Median 11.00 2.00 2.00 17.00Std. Dev. 5.97 6.13 4.65 9.83Minimum 3 0 0 5Maximum 28 26 22 45
Medical School
Military Medical Center
Private General Hospital
Private Psychiatric Hospital
School District or System
State or County Hospital
2008 Internship - Supervisor Level Data
71

III-B-2-c. Supervisor Classifications
Training Supervisor
Other Agency Supervisor
Other Contributors
Total
Sum 851 299 294 1,444Mean 8.96 3.15 3.09 15.20Median 8.00 2.00 .00 13.00Std. Dev. 3.77 3.40 5.31 7.76Minimum 3 0 0 3Maximum 21 15 28 39Sum 1,351 171 233 1,755Mean 19.03 2.41 3.28 24.72Median 17.00 1.00 2.00 22.00Std. Dev. 9.22 5.11 4.55 12.43Minimum 5 0 0 6Maximum 56 36 26 73Sum 176 103 49 328Mean 11.00 6.44 3.06 20.50Median 7.00 3.50 1.50 11.00Std. Dev. 10.77 7.78 4.14 18.78Minimum 3 0 0 4Maximum 41 21 14 76Sum 5,962 2,283 1,952 10,197Mean 12.82 4.91 4.20 21.93Median 10.00 2.00 2.00 18.00Std. Dev. 9.08 8.19 6.91 16.03Minimum 2 0 0 2Maximum 78 67 68 111
Other
Total
University Counseling Center
Veterans Affairs Medical Center
2008 Internship - Supervisor Level Data
72

III-C-1-a. Supervisor Qualifications
From Accredited Doctoral Program
State Licensed*
Listed in National Register
ABPP Diplomate
APA Fellow
Nationally Certified School Psychologist
Sum 804 893 99 45 44 24Mean 12.37 13.74 1.52 0.69 0.68 0.37Median 11.00 12.00 1.00 0.00 0.00 0.00Std. Dev. 7.17 8.45 1.88 0.97 1.58 0.78Min 2 2 0 0 0 0Max 35 42 7 5 10 4Sum 1,133 1,190 154 130 66 40Mean 29.82 31.32 4.05 3.42 1.74 1.05Median 23.50 29.00 2.00 2.00 1.00 0.00Std. Dev. 22.83 23.09 4.63 3.73 2.49 2.98Min 3 3 0 0 0 0Max 111 111 18 13 11 17Sum 153 147 10 15 5 3Mean 12.75 12.25 0.83 1.25 0.42 0.25Median 11.50 11.00 0.00 0.50 0.00 0.00Std. Dev. 7.94 7.11 1.27 1.60 0.90 0.62Min 4 4 0 0 0 0Max 30 26 4 4 3 2Sum 122 106 14 8 5 2Mean 17.43 15.14 2.00 1.14 0.71 0.29Median 16.00 12.00 0.00 0.00 0.00 0.00Std. Dev. 7.09 11.08 3.70 1.95 1.11 0.49Min 10 0 0 0 0 0Max 30 32 10 4 3 1
*Supervisor is licensed (in his/her area of training) in state or appropriate jurisdiction.
Community Mental Health Center (N=65)
Consortium (N=38)
Correctional Facility (N=12)
General Hospital (N=7)
2008 Internship - Supervisor Level Data
73

III-C-1-b. Supervisor Qualifications, continued
From Accredited Doctoral Program
State Licensed*
Listed in National Register
ABPP Diplomate
APA Fellow
Nationally Certified School Psychologist
Sum 26 56 0 3 0 0Mean 13.00 28.00 0.00 1.50 0.00 0.00Median 13.00 28.00 0.00 1.50 0.00 0.00Std. Dev. 1.41 19.80 0.00 0.71 0.00 0.00Min 12 14 0 1 0 0Max 14 42 0 2 0 0Sum 1,226 1,318 200 133 96 12Mean 26.09 28.04 4.26 2.83 2.04 0.26Median 22.00 24.00 2.00 2.00 1.00 0.00Std. Dev. 19.92 19.85 5.83 3.98 2.82 0.61Min 4 5 0 0 0 0Max 88 82 23 19 15 3Sum 908 946 157 157 78 18Mean 28.38 29.56 4.91 4.91 2.44 0.56Median 26.00 26.50 4.00 3.00 2.00 0.00Std. Dev. 20.17 19.31 4.13 5.07 2.26 0.91Min 3 3 0 0 0 0Max 105 103 14 22 8 3Sum 210 222 36 40 21 5Mean 21.00 22.20 3.60 4.00 2.10 0.50Median 18.00 21.00 1.00 3.00 2.00 0.00Std. Dev. 14.33 13.88 5.50 3.20 2.03 0.97Min 5 5 0 0 0 0Max 57 56 18 11 7 3
*Supervisor is licensed (in his/her area of training) in state or appropriate jurisdiction.
Medical School (N=32)
Military Medical Center (N=10)
Medical Center (N=47)
Health Maintenance Organization (N=2)
2008 Internship - Supervisor Level Data
74

III-C-1-c. Supervisor Qualifications, continued
From Accredited Doctoral Program
State Licensed*
Listed in National Register
ABPP Diplomate
APA Fellow
Nationally Certified School Psychologist
Sum 231 230 36 29 11 20Mean 21.00 20.91 3.27 2.64 1.00 1.82Median 14.00 16.00 3.00 1.00 0.00 1.00Std. Dev. 15.64 15.94 3.23 3.26 1.55 1.83Min 6 6 0 0 0 0Max 46 49 11 9 5 5Sum 195 208 31 25 14 22Mean 17.73 18.91 2.82 2.27 1.27 2.00Median 12.00 16.00 2.00 2.00 1.00 1.00Std. Dev. 12.17 13.24 3.16 1.62 1.56 3.00Min 6 6 0 0 0 0Max 41 45 11 5 4 9Sum 74 91 12 10 3 12Mean 10.57 13.00 1.71 1.43 0.43 1.71Median 9.00 11.00 2.00 1.00 0.00 0.00Std. Dev. 6.78 7.21 1.89 2.15 0.79 2.63Min 2 5 0 0 0 0Max 20 25 5 6 2 7Sum 721 720 82 52 26 19Mean 17.59 17.56 2.00 1.27 0.63 0.46Median 15.00 16.00 1.00 1.00 0.00 0.00Std. Dev. 9.17 9.27 2.93 1.80 1.07 0.95Min 4 5 0 0 0 0Max 43 42 13 8 5 5
*Supervisor is licensed (in his/her area of training) in state or appropriate jurisdiction.
State or County Hospital (N=41)
School District or System (N=7)
Private General Hospital (N=11)
Private Psychiatric Hospital (N=11)
2008 Internship - Supervisor Level Data
75

III-C-1-d. Supervisor Qualifications
From Accredited Doctoral Program
State Licensed*
Listed in National Register
ABPP Diplomate
APA Fellow
Nationally Certified School Psychologist
Sum 1,147 1,240 93 71 60 5Mean 12.07 13.05 0.98 0.75 0.63 0.05Median 11.00 11.00 1.00 0.00 0.00 0.00Std. Dev. 6.07 6.78 1.39 1.34 1.20 0.22Min 3 3 0 0 0 0Max 36 35 9 10 6 1Sum 1,692 1,636 237 157 74 6Mean 23.83 23.04 3.34 2.21 1.04 0.08Median 21.00 21.00 3.00 1.00 1.00 0.00Std. Dev. 11.51 10.55 3.70 2.77 1.47 0.33Min 6 5 0 0 0 0Max 71 62 21 17 7 2Sum 291 294 40 30 12 21Mean 18.19 18.38 2.50 1.88 0.75 1.31Median 10.00 11.00 1.00 1.00 0.00 0.50Std. Dev. 16.79 16.70 3.20 2.75 1.13 2.21Min 4 4 0 0 0 0Max 65 65 10 10 3 8Sum 8,933 9,297 1,201 905 515 209Mean 19.21 19.99 2.58 1.95 1.11 0.45Median 15.00 16.00 1.00 1.00 0.00 0.00Std. Dev. 14.73 14.83 3.65 2.96 1.83 1.33Min 2 0 0 0 0 0Max 111 111 23 22 15 17
*Supervisor is licensed (in his/her area of training) in state or appropriate jurisdiction.
Total (N=465)
Other (N=16)
University Counseling Center (N=95)
VAMC (N=71)
2008 Internship - Supervisor Level Data
76

III-C-2-a. Supervisor Qualifications: Area of Expertise
Clinical Counseling School Combination* OtherSum 637 90 31 23 181Mean 9.80 1.38 0.48 0.35 2.78Median 8.00 1.00 0.00 0.00 1.00Std. Dev. 6.33 1.74 1.52 1.07 4.10Minimum 1 0 0 0 0Maximum 27 8 11 7 17Sum 873 161 68 20 163Mean 22.97 4.24 1.79 0.53 4.29Median 14.50 3.00 0.00 0.00 1.00Std. Dev. 20.63 4.19 5.71 0.86 5.92Minimum 0 0 0 0 0Maximum 92 19 33 3 22Sum 124 22 4 5 12Mean 10.33 1.83 0.33 0.42 1.00Median 10.00 2.00 0.00 0.00 0.00Std. Dev. 7.63 1.40 0.65 0.90 2.59Minimum 2 0 0 0 0Maximum 27 4 2 3 9Sum 102 5 0 8 48Mean 14.57 0.71 0.00 1.14 6.86Median 12.00 0.00 0.00 1.00 4.00Std. Dev. 6.73 1.50 0.00 1.35 8.75Minimum 7 0 0 0 0Maximum 26 4 0 3 25Sum 18 1 0 0 32Mean 9.00 0.50 0.00 0.00 16.00Median 9.00 0.50 0.00 0.00 16.00Std. Dev. 2.83 0.71 0.00 0.00 12.73Minimum 7 0 0 0 7Maximum 11 1 0 0 25Sum 1,044 75 30 29 228Mean 22.21 1.60 0.64 0.62 4.85Median 19.00 1.00 0.00 0.00 2.00Std. Dev. 18.12 2.30 1.03 1.09 5.85Minimum 1 0 0 0 0Maximum 75 10 4 4 25
*Programs that combine two or more developed practice arease (i.e. clinical, counseling, or school)
Supervisor Degree Area
Community Mental Health Center (N=65)
Consortium (N=38)
Correctional Facility (N=12)
General Hospital (N=7)
Health Maintenance Organization (N=2)
Medical Center (N=47)
2008 Internship - Supervisor Level Data
77

III-C-2-b. Supervisor Qualifications: Area of Expertise, continued
Clinical Counseling School Combination* OtherSum 746 39 15 14 174Mean 23.31 1.22 0.47 0.44 5.44Median 21.50 1.00 0.00 0.00 1.50Std. Dev. 14.50 1.56 1.11 1.01 8.00Minimum 2 0 0 0 0Maximum 63 6 4 4 37Sum 169 23 1 3 34Mean 16.90 2.30 0.10 0.30 3.40Median 14.50 1.00 0.00 0.00 2.00Std. Dev. 11.36 2.91 0.32 0.67 4.81Minimum 5 0 0 0 0Maximum 45 8 1 2 14Sum 181 18 9 15 30Mean 16.45 1.64 0.82 1.36 2.73Median 13.00 1.00 0.00 0.00 1.00Std. Dev. 12.25 2.29 1.33 2.25 3.58Minimum 5 0 0 0 0Maximum 40 8 4 7 11Sum 156 16 16 9 31Mean 14.18 1.45 1.45 0.82 2.82Median 10.00 1.00 0.00 0.00 1.00Std. Dev. 10.73 1.44 3.36 2.09 4.33Minimum 6 0 0 0 0Maximum 40 4 10 7 14Sum 47 9 30 3 2Mean 6.71 1.29 4.29 0.43 0.29Median 6.00 2.00 2.00 0.00 0.00Std. Dev. 5.91 1.25 5.85 0.79 0.76Minimum 0 0 0 0 0Maximum 18 3 16 2 2
Private General Hospital (N=11)
Private Psychiatric Hospital (N=11)
Supervisor Degree Area
School District or System (N=7)
*Programs that combine two or more developed practice arease (i.e. clinical, counseling, or school)
Medical School (N=32)
Military Medical Center (N=10)
2008 Internship - Supervisor Level Data
78

III-C-2-c. Supervisor Qualifications: Area of Expertise, continued
Clinical Counseling School Combination* OtherSum 578 82 11 24 93Mean 14.10 2.00 0.27 0.59 2.27Median 12.00 1.00 0.00 0.00 1.00Std. Dev. 8.21 1.99 0.74 0.95 3.32Minimum 4 0 0 0 0Maximum 39 8 4 3 14Sum 505 579 2 17 328Mean 5.32 6.09 0.02 0.18 3.45Median 4.00 6.00 0.00 0.00 2.00Std. Dev. 5.63 3.92 0.14 0.41 3.80Minimum 0 0 0 0 0Maximum 29 20 1 2 14Sum 1,367 279 1 14 89Mean 19.25 3.93 0.01 0.20 1.25Median 18.00 3.00 0.00 0.00 0.00Std. Dev. 9.89 4.05 0.12 0.55 4.61Minimum 6 0 0 0 0Maximum 67 19 1 3 37Sum 194 34 42 10 45Mean 12.13 2.13 2.63 0.63 2.81Median 7.50 1.50 0.50 0.00 0.50Std. Dev. 9.95 2.50 7.16 1.26 4.71Minimum 2 0 0 0 0Maximum 36 10 29 5 14Sum 6,741 1,433 260 194 1,490Mean 14.50 3.08 0.56 0.42 3.20Median 11.00 2.00 0.00 0.00 1.00Std. Dev. 13.03 3.53 2.49 0.97 5.08Minimum 0 0 0 0 0Maximum 92 20 33 7 37
VAMC (N=71)
Other (N=16)
Supervisor Degree Area
University Counseling Center (N=95)
State or County Hospital (N=41)
*Programs that combine two or more developed practice arease (i.e. clinical, counseling, or school)
Total (N=465)
2008 Internship - Supervisor Level Data
79

III-D-1. Supervisor Professional Activities Accredited programs are required to provide annual updates on the professional activities of their supervisors. Supervisors need to provide updates on five activities from the current year. The full wording of these questions is provided below as well as how they are labeled in the subsequent tables.
Question # Column Label Question Wording
1 Member Indicate if the supervisor is a member of a professional or research society by selecting either "Yes", "No" or "N/A".
2 Presentations
Indicate if the supervisor is an author or co-author of papers or workshops at professional meetings by selecting either “Yes”, “No” or "N/A". This includes work published (or in press)/presented during the 2007-2008 academic year only. Books may be included.
3 Articles
Indicate if the supervisor is an author or co-author of articles in professional or scientific journals by selecting either “yes” or “no”. This includes work published (or in press)/presented during the 2007-2008 academic year only. Books may be included.
4 Research Indicate if the supervisor member is the recipient of grants or contracts by selecting either "Yes", "No" or "N/A".
5 Services Indicate if the supervisor is engaged in the delivery of professional services by selecting either "Yes", "No" or "N/A".
2008 Internship - Supervisor Level Data
80

Member Presentations Articles Research ServicesMean 70.03 27.93 15.22 12.90 80.46Median 77.78 22.22 10.34 9.09 90.24Std. Deviation 28.48 24.30 18.03 14.74 25.63Minimum 0.00 0.00 0.00 0.00 12.50Maximum 100.00 100.00 100.00 62.50 100.00Mean 68.32 37.63 26.60 22.43 71.79Median 80.63 38.16 21.93 22.64 85.71Std. Deviation 30.91 24.91 22.46 17.96 31.25Minimum 2.27 0.00 0.00 0.00 2.27Maximum 100.00 100.00 92.86 59.62 100.00Mean 63.12 24.11 13.44 2.38 85.24Median 72.46 20.83 4.94 0.00 93.21Std. Deviation 35.02 23.61 15.53 8.25 24.25Minimum 9.68 0.00 0.00 0.00 16.13Maximum 100.00 71.43 44.00 28.57 100.00Mean 93.29 32.54 18.99 30.44 95.33Median 97.06 36.36 18.18 36.36 100.00Std. Deviation 8.30 16.73 18.78 15.48 6.35Minimum 81.82 8.33 0.00 0.00 84.09Maximum 100.00 55.88 47.06 47.73 100.00Mean 77.91 4.65 3.49 3.49 89.53Median 77.91 4.65 3.49 3.49 89.53Std. Deviation 31.24 6.58 4.93 4.93 14.80Minimum 55.81 0.00 0.00 0.00 79.07Maximum 100.00 9.30 6.98 6.98 100.00Mean 86.17 53.34 43.36 32.14 87.46Median 92.31 50.85 43.94 27.50 93.02Std. Deviation 18.33 24.38 24.67 24.81 16.84Minimum 16.67 10.00 0.00 0.00 16.67Maximum 100.00 100.00 100.00 100.00 100.00Mean 81.72 60.17 50.29 38.00 84.59Median 86.00 61.11 48.00 36.36 89.19Std. Deviation 17.69 23.16 25.49 21.89 14.69Minimum 38.71 0.00 0.00 0.00 38.71Maximum 100.00 100.00 100.00 100.00 100.00
III-D-2-a. Supervisor Professional Activities
Community Mental Health Center (N=65)
Consortium (N=38)
Correctional Facility (N=12)
General Hospital (N=7)
Health Maintenance Organization (N=2)
Medical Center (N=47)
Medical School (N=31)
2008 Internship - Supervisor Level Data
81

Member Presentations Articles Research ServicesMean 75.66 32.39 22.83 12.02 82.54Median 78.89 20.79 12.89 3.57 82.07Std. Deviation 21.07 31.19 28.64 22.32 14.10Minimum 28.57 0.00 0.00 0.00 62.07Maximum 100.00 86.36 85.71 72.73 100.00Mean 76.37 35.84 29.52 15.67 81.89Median 82.00 37.50 30.61 6.00 87.50Std. Deviation 25.22 18.75 27.85 29.84 21.02Minimum 16.67 4.17 0.00 0.00 33.33Maximum 100.00 63.64 100.00 100.00 100.00Mean 77.37 35.28 19.61 19.18 80.20Median 83.33 30.95 15.56 11.90 88.89Std. Deviation 27.56 23.66 17.43 18.70 28.42Minimum 5.88 5.88 0.00 0.00 5.88Maximum 100.00 66.67 54.05 66.67 100.00Mean 90.33 37.95 11.53 10.38 92.83Median 100.00 28.29 8.00 4.00 100.00Std. Deviation 14.99 23.19 14.24 15.63 11.84Minimum 70.00 12.50 0.00 0.00 72.00Maximum 100.00 70.00 35.00 40.00 100.00Mean 64.67 25.99 17.97 9.24 80.13Median 66.67 23.66 12.55 3.02 92.68Std. Deviation 25.89 21.30 17.60 12.71 28.06Minimum 10.53 0.00 0.00 0.00 10.53Maximum 100.00 80.00 66.67 50.00 100.00Mean 76.12 39.13 19.96 10.63 86.32Median 81.82 34.85 16.67 6.07 100.00Std. Deviation 24.36 24.75 20.55 13.67 23.40Minimum 0.00 0.00 0.00 0.00 0.00Maximum 100.00 100.00 81.82 58.62 100.00
University Counseling Center (N=94)
III-D-2-b. Supervisor Professional Activities, continued
School District or System (N=6)
State or County Hospital (N=40)
Military Medical Center (N=10)
Private General Hospital (N=11)
Private Psychiatric Hospital (N=11)
2008 Internship - Supervisor Level Data
82

Member Presentations Articles Research ServicesMean 74.48 38.95 26.50 13.27 86.83Median 78.57 36.84 21.43 10.34 90.63Std. Deviation 20.74 22.10 20.07 14.08 16.26Minimum 18.97 0.00 0.00 0.00 27.59Maximum 100.00 97.44 89.74 76.92 100.00Mean 70.96 34.21 17.72 16.32 70.19Median 83.33 22.22 11.11 9.09 90.00Std. Deviation 32.28 31.63 14.80 21.82 38.27Minimum 0.00 0.00 0.00 0.00 0.00Maximum 100.00 100.00 50.00 75.00 100.00
Total (N=460)
Mean 74.74 37.99 24.95 16.85 83.18Median 81.82 36.36 18.18 11.11 91.67Std. Deviation 25.26 25.55 23.12 19.34 23.49Minimum 0.00 0.00 0.00 0.00 0.00Maximum 100.00 100.00 100.00 100.00 100.00
VAMC (N=71)
III-D-2-c. Supervisor Professional Activities, continued
Other (N=15)
2008 Internship - Supervisor Level Data
83

FINAL COMMENTS The variables provided in the preceding tables were agreed upon by the CoA. They represent information that is requested most often from the public. The Office of Program Consultation and Accreditation (OPCA) is happy to provide other types of data to the public. These requests must be formally submitted to the OPCA and approved by the CoA, consistent with Implementing Regulation E1-3(a).
If you have any questions about this report or any other accreditation data, you can contact the OPCA at:
Office of Program Consultation and Accreditation Education Directorate
American Psychological Association 750 First Street NE
Washington, DC 20002-4242 Main Tel: (202) 336-5979
Research Tel: (202) 336-6016 Fax: (202) 336-5978
Main Email: [email protected] Research Email: [email protected]
Thank you for your continuing support of Accreditation!
84