2010 annual school report eastern creek public school€¦ · 2010 annual school report eastern...
TRANSCRIPT

NSW Department of Education & Training
1808
2010 Annual School Report Eastern Creek Public School
NSW Public Schools – Leading the way
Eastern Creek Public School
Proud of our past, focused on our future
1
Our school at a glance
Students
Our school community is a rich, warm and culturally diverse group of families who reside in a suburban environment close to the M7 expressway. Sporting facilities, such as the Rooty Hill Soccer Club, the Eastern Creek Raceway and the Olympic Park Sporting Complex are close by.
Historically wealthy, the Eastern Creek area once contained wheat farms, dairies, grain crops and vegetable fields, an army barracks and vineyards. There are significant historical sites in the area including the Rooty Hill which hosts community functions.
In 2010 300 students, including 40 preschool students, were enrolled in our school of which 58.6% of our families have a language background other than English. Families, boys and girls, staff and the community all support the school to make it a close, family orientated and friendly environment.
Our students are recognised for their talents in academic competitions, sport, dance, singing, art and literacy as well as their citizenship, friendliness and support displayed towards each other
Staff
The staff keenly demonstrate a commitment to excellence in education at all levels through the teaching and learning of the Key Learning Areas. The school’s educational support staff; the English as a Second Language (ESL), Support Teacher Learning Assistant (STLA) and School Learning Support Coordinator (SLSC) provide assistance to students with special need and are supported by an active and well organised Learning Support Team.
The school has an administration staff of three; a ground staff member of two and a half days per week, two cleaning staff and three teacher’s aides.
All teaching staff meet the professional requirements for teaching in NSW public schools.
Significant programs and initiatives
In addition to teaching in the six Key Learning Areas (KLAs), programs were offered in the following areas throughout 2010:
English as a Second Language (ESL)
Learning Assistance Program (LAP)
QuckSmart Mathematics
Choir/ Dance/Drum Group
Keyboard
Peer Support and Leadership
Peer Reading
Learning Neighbourhood with Minchinbury PS, Rooty Hill PS and Rooty Hill HS
Premier’s Reading Challenge
Anti Bullying
Learning Mandarin Language- “Ningbo Program”
Coming to School – transition to school program
Drama Dance and Singing performances at local and regional levels
Child Protection
Positive Behaviour for Learning (PBL) program
PBL/STAR Student Achievement program
Eastern Creek Citizenship Program
Gardening and Environment group
Opportunities to participate in Sydney West Regional sporting activities
Excursions
Public Speaking and Debating
Technology and Computers
Active After School Sports program (AASC)
I would like to especially thank, Mrs Zulfiqar and Mrs Galea for initiating the federally funded sports program called the Active After Schools Community Sports Program. This program concluded at the end of 2010 after many children participated throughout the year.

2
Student achievement in 2010
Literacy – NAPLAN Year 3
In 2010 thirty four, Year 3 students sat for the Literacy component of the National Assessment Program for Literacy and Numeracy (NAPLAN). Of particular note is the school summary report showing an above state average performance in summarizing events leading to a conclusion, linking information across a text and recognising the purpose of a text feature in reading.
The NAPLAN school summary report also identified some aspects of literacy in which student performance scored below state average. These aspects include; cohesive terminology, identifying opinions, recognizing rhetorical questions, inferring a characters intention making generalizations, capitalization, identifying nouns, adjectives, demonstrative pronouns and combining sentences.
Numeracy – NAPLAN Year 3
In 2010, thirty four students in Year 3 participated in the Numeracy component of the National Assessment Program for Literacy and Numeracy (NAPLAN). The NAPLAN school summary report identified some aspects of numeracy in which student performance scored below state average. These aspects include; adding tally marks in data collecting, 3D shapes, understanding outcomes in chance and data, identifying shapes and patterns, the quarter of an hour when reading analog clocks, estimating length, whole and quarters in fractions, use of informal units when working out area and addition and multiplication of money.
Literacy – NAPLAN Year 5
In 2010, forty seven, Year 5 students sat for the Literacy component of the National Assessment Program for Literacy and Numeracy (NAPLAN). Of particular note is the school summary report showing an above state average performance in some aspects of reading, spelling, grammar and punctuation. These aspects include; linking information, locating information in a text and identifying relative pronouns.
The NAPLAN school summary report also identified some aspects of literacy in which student performance scored below state average. These aspects include; locating information, identifying opinions, recognizing character
changes, identifying punctuation of direct speech, selecting subjective verbs, identifying conjunctions and identifying apostrophe of possession.
Numeracy – NAPLAN Year 5
In 2010, forty seven students in Year 5 participated in the Numeracy component of the National Assessment Program for Literacy and Numeracy (NAPLAN). The NAPLAN school summary report identified some aspects of numeracy in which student performance scored below state average. These aspects include; perimeter and area, division, 2 digit with a remainder, estimating length of an object, angles, 3D complex models 2D tessellation, fractions, decimals and percentages of proportions.
Messages
Principal’s message
The children enjoyed a very busy, exciting and rewarding year at Eastern Creek PS. The learning experiences were varied and significant and I am sure the children’s knowledge, skills and abilities, were enriched through these academic and social activities which included utilizing the new school and community hall for dancing, drama and games, terrific excursions to Warragamba Dam, animal farms, zoos, an extended overnight camping trip to The Great Aussie Bushcamp at Tea Gardens, Bully Buster activities, Mr Scary Workshops, sport gala days, musical, drama, percussion and dance performances. Our children excelled in the Minchinbury Learning Neighbourhood, combined school concert, “Reach”, which highlighted some amazing talented dancers, drummers and singers. Appreciation is given to Mrs Wallace, Miss Watkins, Mrs Creer and Mrs Parnaby for their enthusiasm and commitment and to the many parents who assisted with transport, costumes and makeup.
The Learn to Swim School program continued with over forty children participating. This most valuable program is now a permanent fixture in the school’s yearly calendar because it gives the children an opportunity to practice and develop a genuine lifesaving skill.
The Ningbo program continued and again was extended to include kindergarten this year. Another student from the Ningbo Province in
3
China, Miss Xinyu Yu started with Year 5 and 6 students in term 4. Appreciation is extended to the Chinese Embassy for their donation of wonderful teaching resources which will help our students learn the Mandarin language.
The Positive Behaviour for Learning (PBL) program was maintained this year and the first of our students started to receive their special bronze, silver and gold STAR badges. The public recognition of students for their efforts, demonstration or core values and achievements greatly enhance student’s well being and esteem and helps to build upon the already supportive school environment.
I would particularly like to thank the P&C Association under the leadership of Julie Warby for their support of the school in assisting to supply new educational and technical resources, the running of the uniform shop and student activities in our new school hall.
I would also like to show my appreciation to the wonderful teaching, ground and administration staff for their hard work and enthusiasm they bring to school each day. Their commitment to providing excellent opportunities for the children to learn is second to none and adds considerably to the culture, school atmosphere and learning ethos of Eastern Creek Public School.
I certify that the information in this report is the result of a rigorous school self-evaluation process and is a balanced and genuine account of the school's achievements and areas for development.
Wesley Chia
Principal
P & C message
I embarked on the journey as president of the P&C in March at the AGM. Throughout the year, after working with the parents of the schools, I was amazed at the “behind the scenes” work that the parents and friends of the school voluntarily do for the children.
Various fund raising activities were run throughout the year. At the election day in March, when our new hall was being used as a polling booth we ran a BBQ and raised $257.00. Then at Easter the P&C ran the Easter Raffle and Easter Egg hunt for the children of the school and
together with the local Rooty Hill IGA store we raised $357.00. Our Mother’s Day stall in particular raised $1200.00. I must congratulate and thank the very busy working bee grandmothers group who busily make handicafts for the stalls we have for Mother’s and Father’s Day.
At the school’s ANZAC assembly I was honoured to represent the school by laying a special parent wreath at the assembly.
The uniform shop, since moving to the unused nurse’s cottage, has been running quite well, providing a very necessary service to the families of the school. On behalf of the P&C I would like to thank Trudi Craft and her committee for running the Uniform Shop.
The P&C voted in to bring back school banking for the children. Throughout the year, forty seven children signed up for banking. Thank you to Mr Vern Loeckenhoff for managing the school bank activity with the Commonwealth Bank.
The P&C, towards the end of the year, was able to provide funding for four Interactive White Boards for the school through a grant from the Rooty Hill RSL. These special white boards are now almost in every classroom and it will be a goal in the future to help the school acquire more boards for the rooms.
The children enjoyed a school disco run in term 3 by the P&C. The new School and Community Hall has provided a much needed facility for the P&C to run activities for the children. Hopefully further activities can be run.
Future goals include lobbying for a security fence for the back playground, airconditioning for the library and further fund raising activities.
I have enjoyed the year as the P&C President and have made many more friends and can appreciate the complexities of being involved in helping to run our school.
Julie Warby
President
Eastern Creek Public School
Parents and Citizen’s Association

4
Student representative’s message
School captain has been the best! Being a school captain has been a big challenge - remembering when to do jobs - like whose turn it was to do the flag.
This year has been the best adventure of my life and it has made me learn more and build my confidence. My family has been proud and I hope that next leaders coming up have the best time as leaders.
I will miss being a school captain and I thank all the teachers and fellow students in the school for helping me learn. I wish everyone all the best in 2011 and the years to come. I hope to see you guys again one day and may God bless this school.
Being a school captain has taught me a lot because my stage fright went away and I have become more confident. At first l thought l couldn’t do this job but my friends and my teacher believed in me.
Franele– School Captain
Leadership is not an easy job, but I did learn to believe in myself and to communicate well with teachers, parents and fellow students. The job of captain has been the best thing so far in my life.
The last thing l want to say is a big thank you to my fellow students and teachers and I wish you all the best in 2011.
Helena – School Captain
School context
Student information
It is a requirement that the reporting of information for all students must be consistent with privacy and personal information policies.
Student enrolment profile
In 2010, the enrolment peaked at 263 students from Year 6 to Kindergarten. In addition there were 40 preschool students equally divided between a morning and afternoon session each day.
Our students live in a suburban environment of which 58.6% come from a language background other than English, with Tagalog, Urdu, Hindi and Samoan being the predominant language groups. 2% of our students are of Aboriginal or Torres Strait Islander descent.
2006 2007 2008 2009 2010
Male 92 102 107 107 111
Female 138 142 136 136 147
Enrolments
0
50
100
150
200
250
300
2006 2007 2008 2009 2010Year
Stu
den
ts
Male Female

5
Student attendance profile
Student attendance rates
0
10
20
30
40
50
60
70
80
90
100
2007 2008 2009 2010Year
Att
en
da
nc
e r
ate
School Region State DET
Year 2007 2008 2009 2010
School K 93.1 94.2
1 91.0 94.2
2 91.4 91.6
3 90.3 94.1
4 91.6 94.5
5 91.6 92.7
6 93.1 94.5
Total 92.6 93.4 91.6 93.6
Region K 94.1 94.6
1 93.5 93.9
2 93.8 94.2
3 94.1 94.4
4 93.9 94.4
5 94.0 94.3
6 93.4 94.2
Total 93.9 94.1 92.1 94.3
State DET K 94.3 94.7
1 93.7 94.2
2 94.0 94.4
3 94.1 94.5
4 94.0 94.5
5 94.0 94.4
6 93.6 94.0
Total 94.0 94.1 92.1 94.4
Our attendance percentage for 2010 has improved not only at a school level but also when comparing results to the region and state.
Management of non-attendance
The student’s attendance is monitored by a daily roll check which is entered onto the ERN computer system in the office. Parents are encouraged to give reasons for non attendance in writing or by phoning into the school so that daily information can be recorded. High levels of unexplained absence are noted and the parents
are contacted so that a range of strategies can be incorporated in making the attendance of the student easier. Such strategies include, vehicle access, available and convenient friends to walk together in the morning, having breakfast prior to coming to school and arriving at school during the morning playtime period. If required, the NSW DET Home School Liaison Unit is notified and at times, the Mt Druitt Youth and Community Officer can be called upon for support. Alarm clocks were purchased for some children in order to assist them in waking up on time for school.
A pleasing attendance result for 2010 was achieved through a closer communication process with families. In particular, parents of children whose attendance was noted often received phone calls from the school regarding how assistance could be given to help the children improve their attendance. Regular newsletter items were included regarding notification of communicable disease outbreaks such as measles, whooping cough and flu.
Class sizes
In March 2003 the Government announced its commitment to publish primary class sizes in annual school reports in order to provide parents with as much local information as possible.
The following table shows our class sizes as reported at the 2010 class size audit conducted on Wednesday 17 March 2010.
Roll Class
Year Total per Year
Total in Class
6L 6 30 30
2-3V 2 15 25
2-3V 3 10 25
KE K 19 19
KR K 18 18
5W 5 24 24
5R 5 23 23
2A 2 24 24
4G 4 32 32
1H 1 20 20
3C 3 24 24
K-1C K 6 21
K-1C 1 15 21

6
Structure of classes
For 2010 nine of the classes at Eastern Creek Public School, are parallel, ie, the students are not divided into different grades. Two classes are multi-aged or “composites”, ie, the class has a mixture of two grades. One class 2/3V has a year 2 and Year 3 component and another, K/1C has a Kindergarten and a Year 1 component.
Staff information
It is a requirement that the reporting of information for all staff must be consistent with privacy and personal information policies
In 2010 the staff of Eastern Creek Public School consisted of Preschool to Year 6 classroom teachers. In the Preschool, Mrs Jennings and Mrs Lucas operated in a shared role capacity throughout the year. Of particular note is the special role the RFF teacher, Mrs Bullen, has in the teaching of Science and the living environment. The Library teacher, Mrs Mead, also specializes in technology, computer education and maintains the school intranet and hardware maintenance. All Assistant Principals have a full time teaching role.
The students are supported by an English as a Second Language Teacher (ESL) three days a week and a Special Teacher Learning Assistance (STLA) two days per week. The School Learning Support Coordinator (SLSC) assisted with the provision of resources and programs for students and classroom teachers. A Literacy and Numeracy Officer was provided by the region to assist the school to better use the Best Start Assessment program for the Kindergarten to Year 2 classes. A School Counselor is appointed one day per week. To support children who receive
special funding a School Learning Support Officer (SLSO) was employed to assist in the classroom and playground.
Staff establishment
Position Number
Principal 1 Deputy Principal(s) n/a Assistant Principal(s) 3 Head Teachers n/a Classroom Teachers 8 Teacher of Emotional Disabilities n/a Teacher of Mild Intellectual Disabilities n/a Teacher of Reading Recovery n/a Support Teacher Learning Assistance 1 Teacher Librarian 1 Teacher of ESL 1 Counsellor 1 School Administrative & Support Staff 4 Total 20
The National Education Agreement requires schools to report on Indigenous composition of their workforce.
There were no indigenous members of staff throughout 2010.
Staff retention
Throughout 2010, all teaching positions were maintained. One member of staff took leave and this position was filled by a temporary teacher. At the start of 2010, the school’s enrolment increased to enable an additional class to be formed.
Teacher qualifications
All teaching staff meet the professional requirements for teaching in NSW public schools.
Enter text here
Qualifications % of staff
Degree or Diploma 100 Postgraduate n/a

7
Financial summary
This summary covers funds for operating costs and does not involve expenditure areas such as permanent salaries, building and major maintenance.
A full copy of the school’s 2010 financial statement is tabled at the annual general meetings of the Parents and Citizens Association. Further details concerning the statement can be obtained by contacting the school.
Date of financial summary: 30/11/2010
Income $
Balance brought forward 82 117.82
Global funds 133 670.40
Tied funds 69 106.20
School & community sources 79 488.11
Interest 3 527.05
Trust receipts 20 656.55
Canteen 0.00
Total income 388 566.13
ExpenditureTeaching & learning
Key learning areas 22 340.01
Excursions 17 729.92
Extracurricular dissections 19 903.54
Library 8 608.06
Training & development 2 919.37
Tied funds 77 310.51
Casual relief teachers 66 810.33
Administration & office 50 921.42
School-operated canteen 0.00
Utilities 33 851.26
Maintenance 12 938.56
Trust accounts 20 321.52
Capital programs 0.00
Total expenditure 333 654.50
Balance carried forward 54 911.63
School performance 2010
The children enjoyed the opportunity to participate in a variety of cultural, academic and sporting activities throughout the year. It was a focus of the year to encourage the children to participate in and “have a go” at as many opportunities as possible.
Achievements
Arts
A strong focus of the year was to ensure children had
opportunities to be engaged in the Arts, especially if
they had not previously participated. A wide range of
activities was provided for the children to “have a go”
at. Class performances at assemblies and special
occasions were a highlight. There were many fine
examples of children dancing, singing and performing
in class plays at these assemblies. A Public Speaking
competition was trialed for the first time with the
purpose of lifting the profile of public speaking across
the grades.
The Eastern Creek Public School choir, performed
admirably at different venues this year such as the Mt
Druitt Shopping Centre, the Joan Sutherland Centre for
the Sydney West Choir Festival as an individual item
and as part of the massed Sydney West Choir. The
choir also performed at the Minchinbury Learning
Neighbourhood’s Reach Concert.
The Reach Concert was also the vehicle for excellent
participation in the Arts for our Djembe drummers,
drama performers and dancers. Eastern Creek
students performed fantastically at the concert with
our drama performers going on to perform at the
Dame Joan Sutherland Theatre for the Sydney West
Drama Festival and the dancers performing at Castle
Hill.
Students from the school also entered teams in the
Regional Public Speaking, Debating and Chess
competitions.
The school participated with the Minchinbury Learning
Neighbourhood “Art on the Hill” and the “Writer’s
Award”. Selected pieces of work in Visual Art were
exhibited and awards presented and the best piece of
writing was presented with a special award.
Appreciation is extended to all of the staff and parents
for making the extra effort to ensure the children have
the best possible experience in the Arts. Creative
talent, skill, knowledge of performance and music,
makeup, costume design and providing transport were
all part of the wonderful team work between teachers
and parents.
8
Sport
Sport and physical activities are particular highlights at Eastern Creek Public School and throughout the year there were significant achievements including:-
entering selected students in the Mt Druitt and Sydney West selection events for rugby league, soccer, netball, basket ball, tennis, cricket, athletics, swimming and cross country teams.
participating in team game events on sports gala days for soccer and rugby league.
Introduction of the Live Life Well program which encourages the children to live healthy by eating the right food and to engage in exercise and daily activity.
Students in K- 2 participated in sports and fitness programs on Friday which aimed to develop team game skills, gross motor abilities and to increase enjoyment in playing sport activities.
Year 3 to Year 6 students played in a range of team games and activities which included the introduction of new games utilizing equipment purchased through the Premier’s Sporting Challenge grant.
Appreciation is extended to all teachers and parents for ensuring the children get the best possible experience in their sporting activities.
Other
Gardening Group
Interested children, under the leadership of Mrs Bullen and Mrs Ritchie, throughout the year, took care of the school gardens. Weeding, watering, planting and fertilizing were all part of their monthly program. A successful grant from Blacktown Council and the kind donation of labour and materials from the Ahofono family enabled three garden beds to be made for the gardening group to grow vegetables. A garden shed was also purchased through the grant to store tools. The garden group also entered the McCain’s Vegetable promotions competition which enabled them to win a wheelbarrow.
Appreciation is extended to Mrs Bullen and Mrs Ritchie for their enthusiasm and commitment to the gardening group.
Chess Team
Nine players entered the Western Sydney division of the NSW Chess League competition. Only two boys in the team had played in a chess tournament previously and so the team was relatively new to the tournament arena. Team selection was through a school competition organized and run by two of the team members.
On-line Learning
2010 saw the introduction of two online learning programs for all children who attend Eastern Creek Public School. Mathletics, a Mathematics program, is available to students who receive a pin number pass and can engage in activities at school or at home. Reading Eggs is a word recognition and phonics programs available for Kindergarten to Year 2 students. The decision to adopt both programs came about as a result of successful trials in 2009 and the recognition of the need to lift the interest level and abilities of basic number skills and sound/word recognition.
Students without internet access, 1.2% of Eastern Creek Public School students, have access to the internet at school in their classroom or library.
QuickSmart Mathematics
Twenty students in Year 5 and Year 6 were selected to be part of this Mathematics program aimed at lifting the skill level of basic number operations. Two School Learning Support Officers were trained and implemented this federally funded program which ran for two terms. Of the twenty students, 65% demonstrated significant improvement in their performance score while 25% demonstrated moderate improvement. The mathematics resources acquired for the program, including the data collection program, will be used as a follow on program for 2010.
The School and Community Hall
The school and community hall BER project concluded at the end of term 4 in 2009 and planned activities and hire usage could finally be programmed for 2010. Student performances, practice sessions, district and zone activities, community usage and whole school activities have been initiated in this excellent venue throughout the year. Highlights of the hall usage include the use for youth activities from the Mt Saione Christian Centre, bible study session for the Tabernacle Worship Centre and David Adlam’s Tae Kwon Do class. The hall is now an integral part of everyday school life.

9
Academic
In the National Assessment Program, the results across the Years 3, 5, 7 and 9 literacy and numeracy assessments are reported on a scale from Band 1 to Band 10.
The achievement scale represents increasing levels of skills and understandings demonstrated in these assessments.
Yr 3: from Band 1 (lowest) to Band 6 (highest for Year 3)
Yr 5: from Band 3 (lowest) to Band 8 (highest for Year 5)
Literacy – NAPLAN Year 3
In reading in Year 3, 41.4% of the students scored in Bands 5 and 6 compared to 48% of the state while 20.5% of the students scored in Bands 1 and 2 compared to 14% of the state.
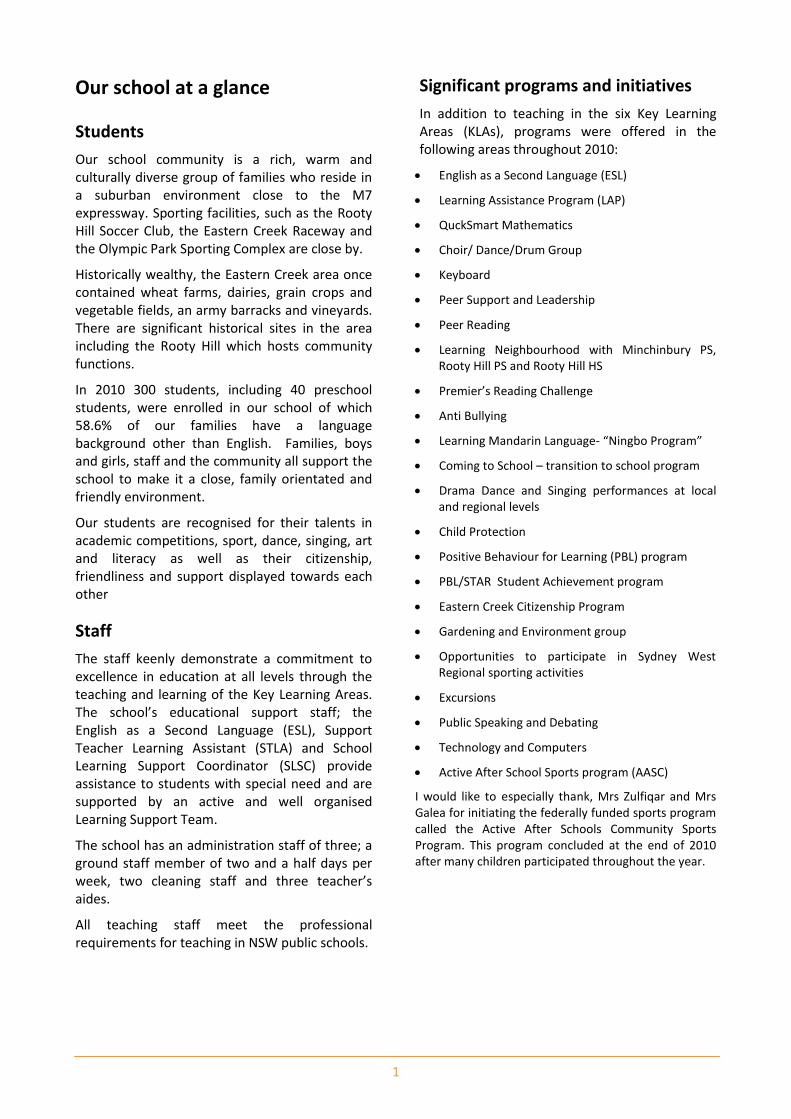
In writing in Year 3, 41.1% of the students scored in Bands 5 and 6 compared to 56% of the state while 5.8% of the students scored in Bands 1 and 2 compared to 6% of the state.
In spelling in Year 3, 29.4% of the students scored in Bands 5 and 6 compared to 46% of the state while 17.6% of the students scored in Bands 1 and 2 compared to 13% of the state.
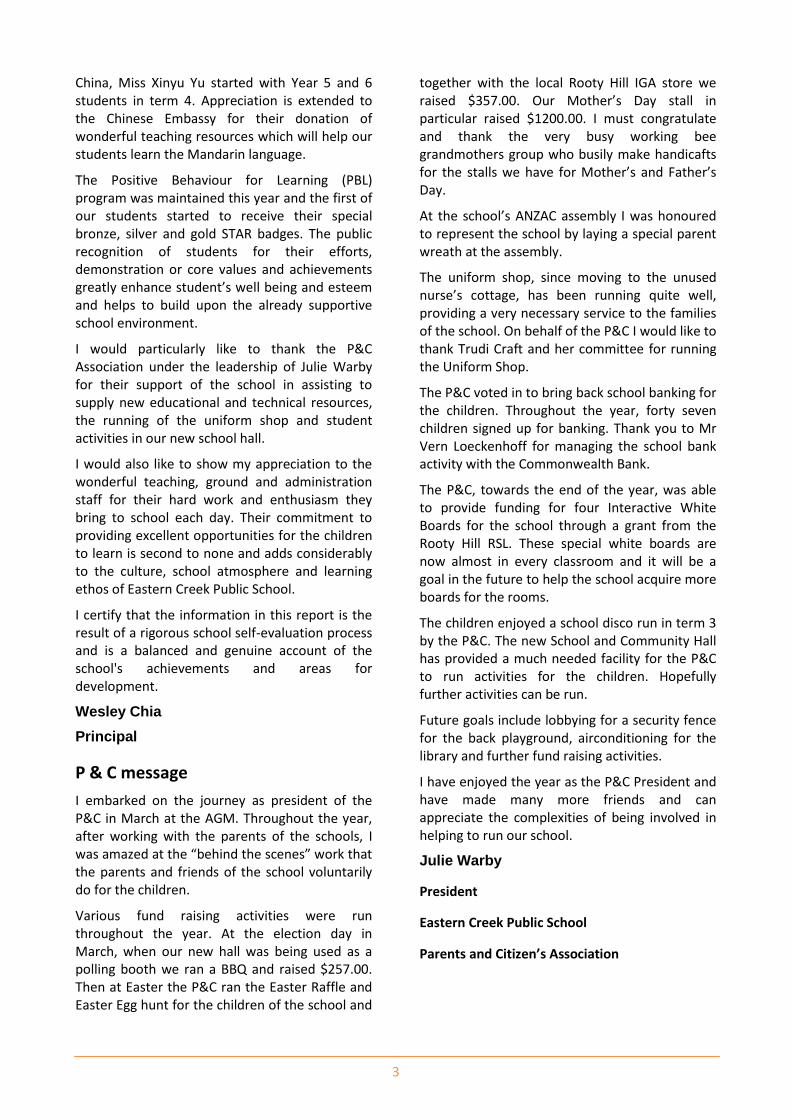
In grammar and punctuation in Year 3, 26.4% of the students scored in Bands 5 and 6 compared to 54% of the state while 26.4% of the students scored in Bands 1 and 2 compared to 15% of the state.
Percentage of students in bands:
Year 3 reading
0
5
10
15
20
25
30
35
1 2 3 4 5 6
Band
Perc
en
tag
e o
f stu
den
tsPercentage in band
School average 2008 - 2010
State DET average 2010
Percentage of students in bands:
Year 3 spelling
0
5
10
15
20
25
30
35
1 2 3 4 5 6Band
Perc
en
tag
e o
f stu
den
ts
Percentage in band
School average 2008 - 2010
State DET average 2010
10
Percentage of students in bands:
Year 3 writing
0
5
10
15
20
25
30
35
1 2 3 4 5 6
Band
Perc
en
tag
e o
f stu
den
ts
Percentage in band
School average 2008 - 2010
State DET average 2010
Percentage of students in bands:
Year 3 grammar and punctuation
0
5
10
15
20
25
30
35
1 2 3 4 5 6Band
Perc
en
tag
e o
f stu
den
ts
Percentage in band
School average 2008 - 2010
State DET average 2010
Numeracy – NAPLAN Year 3
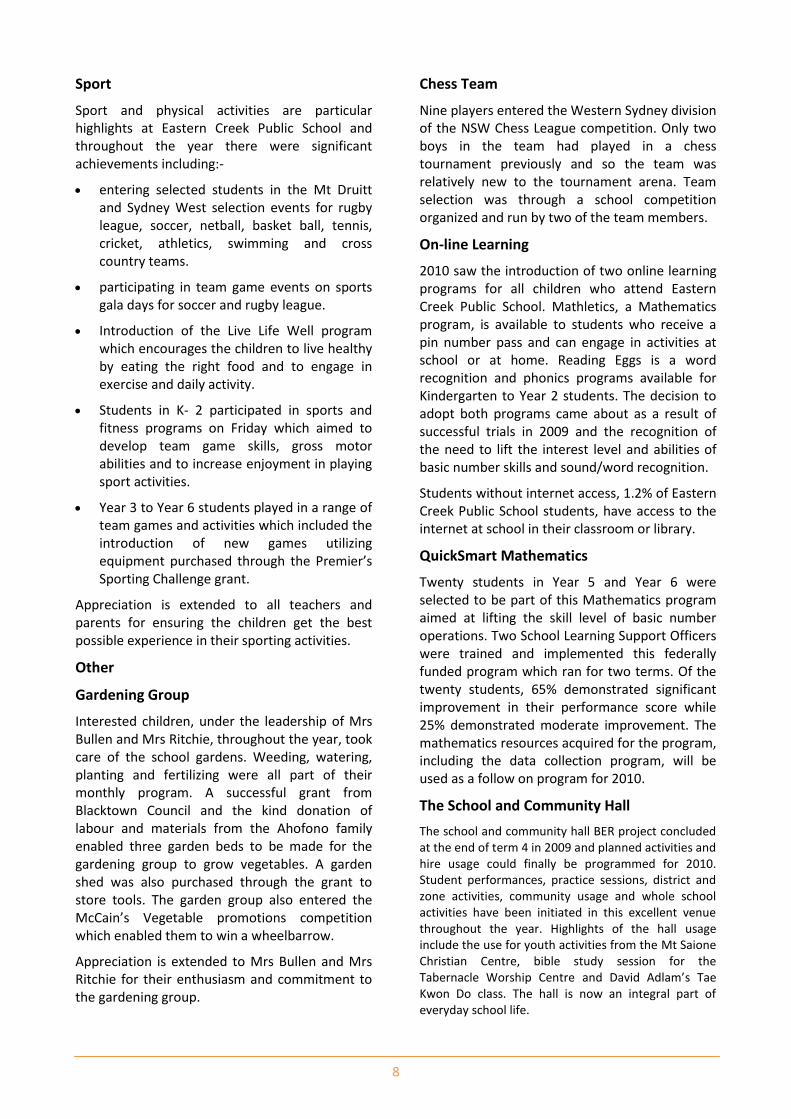
In numeracy in Year 3, 11.7% of the students scored in Bands 5 and 6 compared to 38% of the state while 35.2% of the students scored in Bands 1 and 2 compared to 15% of the state.
In data, measurement, space and geometry, in Year 3, 8.8% of the students scored in Bands 5 and 6 compared to 32% of the state while 26.4% of the students scored in Bands 1 and 2 compared to 17% of the state.
In number, patterns and algebra in Year 3, 29.4% of the students scored in Bands 5 and 6 compared to 40% of the state while 26.4% of the students scored in Bands 1 and 2 compared to 14% of the state.
Percentage of students in bands:
Year 3 numeracy
0
5
10
15
20
25
30
35
1 2 3 4 5 6
Band
Perc
en
tag
e o
f stu
den
ts
Percentage in band
School average 2008 - 2010
State DET average 2010
11
Literacy – NAPLAN Year 5
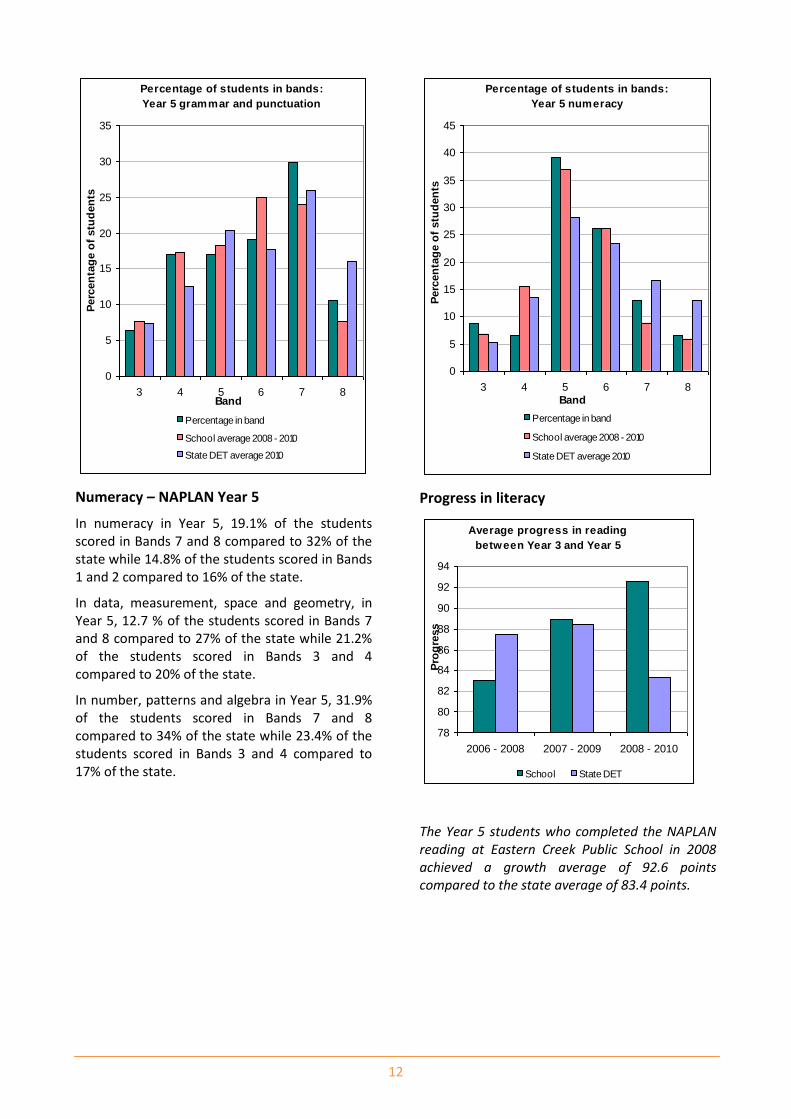
In reading in Year 5, 25.5% of the students scored in Bands 7 and 8 compared to 33% of the state while 12.7% of the students scored in Bands 3 and 4 compared to 20% of the state.
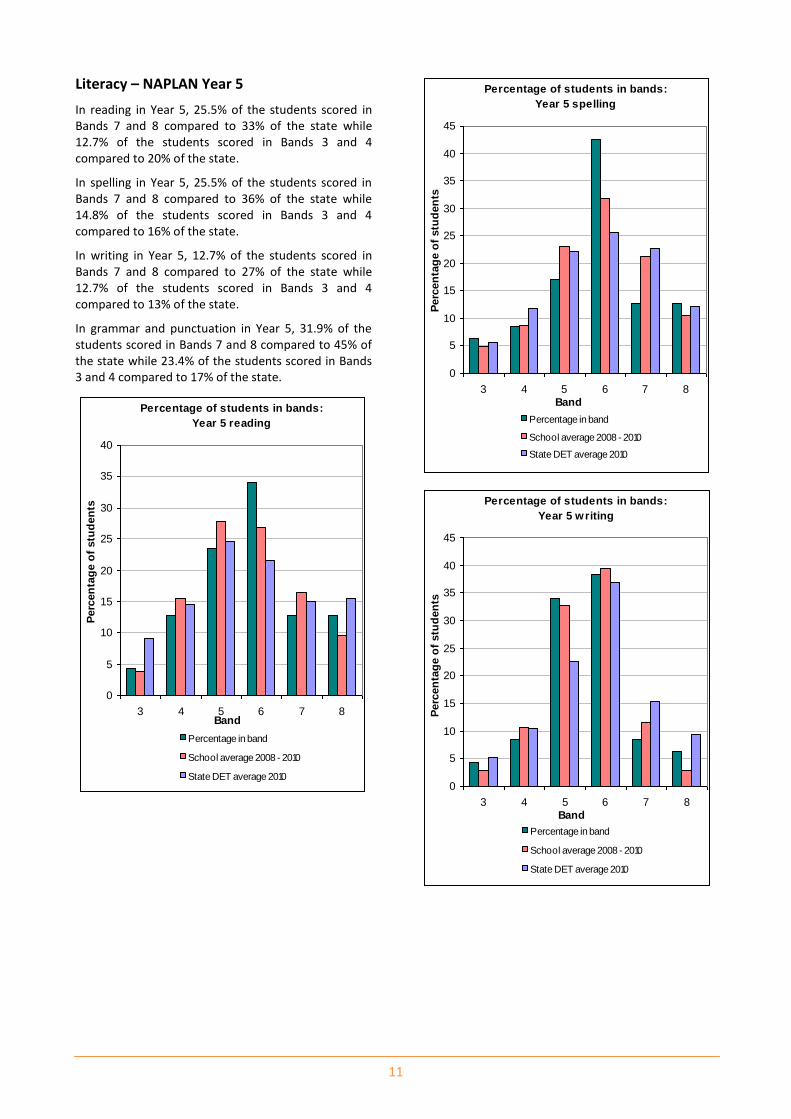
In spelling in Year 5, 25.5% of the students scored in Bands 7 and 8 compared to 36% of the state while 14.8% of the students scored in Bands 3 and 4 compared to 16% of the state.
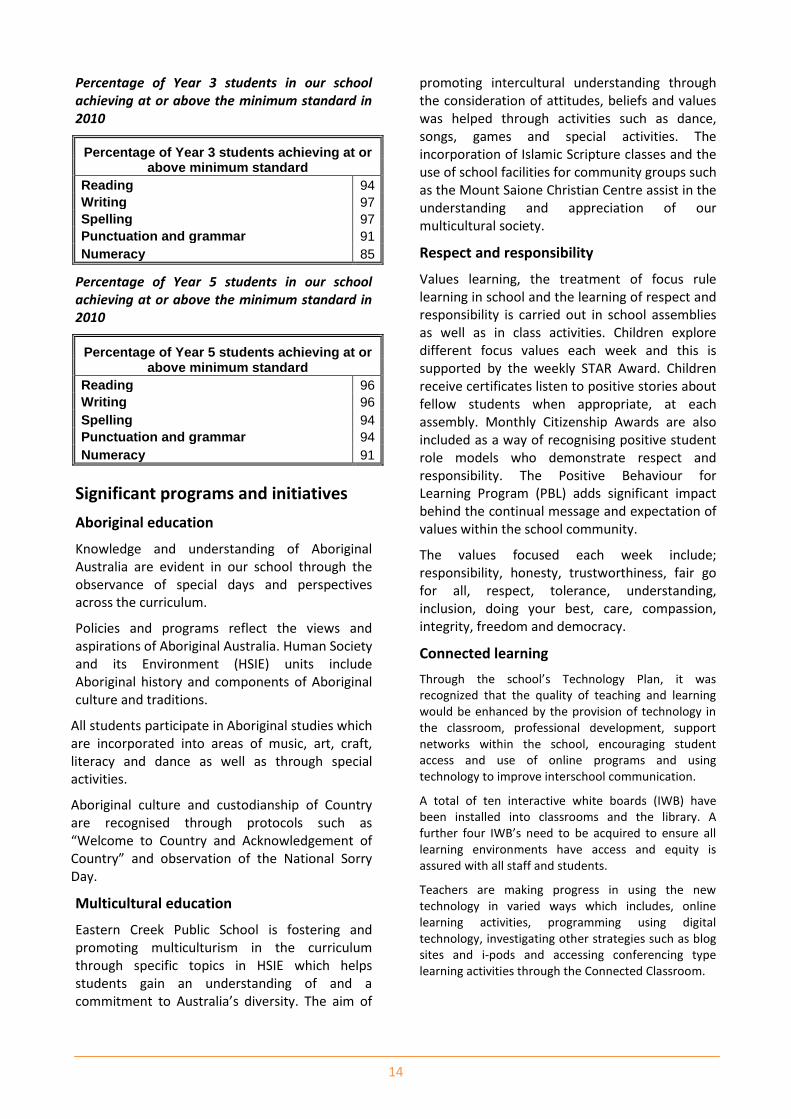
In writing in Year 5, 12.7% of the students scored in Bands 7 and 8 compared to 27% of the state while 12.7% of the students scored in Bands 3 and 4 compared to 13% of the state.
In grammar and punctuation in Year 5, 31.9% of the students scored in Bands 7 and 8 compared to 45% of the state while 23.4% of the students scored in Bands 3 and 4 compared to 17% of the state.
Percentage of students in bands:
Year 5 reading
0
5
10
15
20
25
30
35
40
3 4 5 6 7 8Band
Perc
en
tag
e o
f stu
den
ts
Percentage in band
School average 2008 - 2010
State DET average 2010
Percentage of students in bands:
Year 5 spelling
0
5
10
15
20
25
30
35
40
45
3 4 5 6 7 8
Band
Perc
en
tag
e o
f stu
den
ts
Percentage in band
School average 2008 - 2010
State DET average 2010
Percentage of students in bands:
Year 5 writing
0
5
10
15
20
25
30
35
40
45
3 4 5 6 7 8
Band
Perc
en
tag
e o
f stu
den
ts
Percentage in band
School average 2008 - 2010
State DET average 2010
12
Percentage of students in bands:
Year 5 grammar and punctuation
0
5
10
15
20
25
30
35
3 4 5 6 7 8Band
Perc
en
tag
e o
f stu
den
ts
Percentage in band
School average 2008 - 2010
State DET average 2010
Numeracy – NAPLAN Year 5
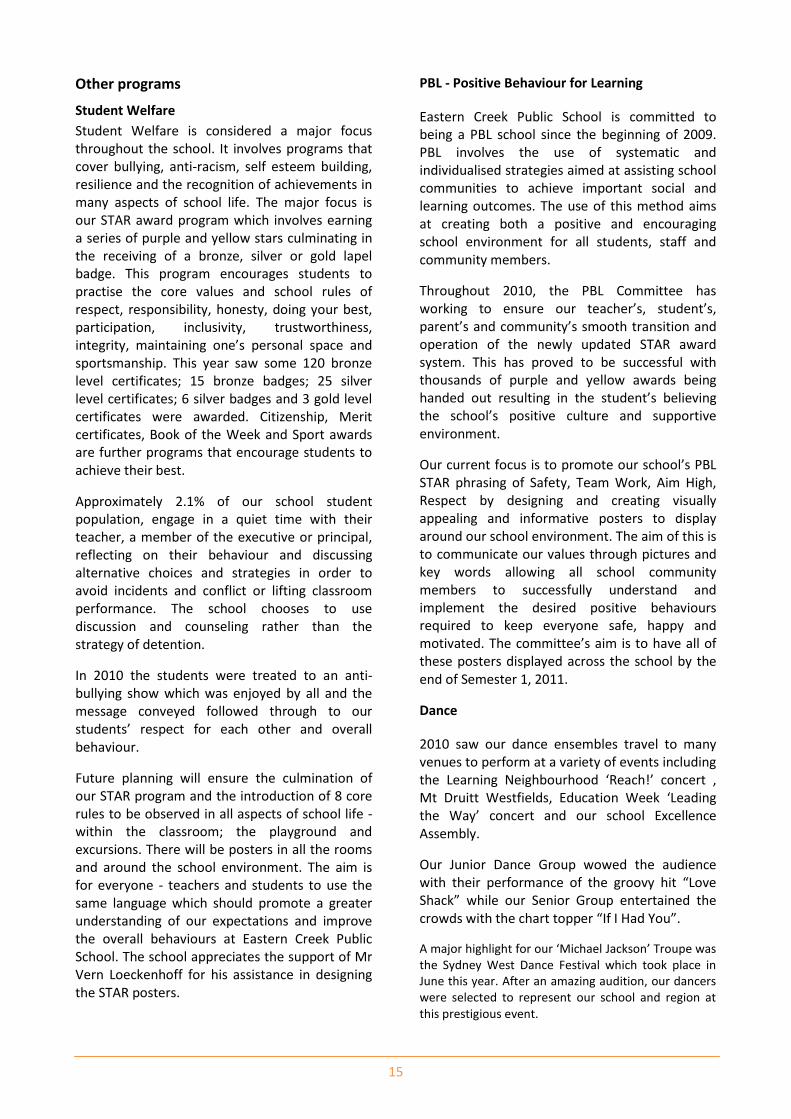
In numeracy in Year 5, 19.1% of the students scored in Bands 7 and 8 compared to 32% of the state while 14.8% of the students scored in Bands 1 and 2 compared to 16% of the state.
In data, measurement, space and geometry, in Year 5, 12.7 % of the students scored in Bands 7 and 8 compared to 27% of the state while 21.2% of the students scored in Bands 3 and 4 compared to 20% of the state.
In number, patterns and algebra in Year 5, 31.9% of the students scored in Bands 7 and 8 compared to 34% of the state while 23.4% of the students scored in Bands 3 and 4 compared to 17% of the state.
Percentage of students in bands:
Year 5 numeracy
0
5
10
15
20
25
30
35
40
45
3 4 5 6 7 8
Band
Perc
en
tag
e o
f stu
den
ts
Percentage in band
School average 2008 - 2010
State DET average 2010
Progress in literacy
Average progress in reading
between Year 3 and Year 5
78
80
82
84
86
88
90
92
94
2006 - 2008 2007 - 2009 2008 - 2010
Pro
gre
ss
School State DET
The Year 5 students who completed the NAPLAN reading at Eastern Creek Public School in 2008 achieved a growth average of 92.6 points compared to the state average of 83.4 points.

13
Average progress in spelling
between Year 3 and Year 5
0
20
40
60
80
100
120
2008 - 2010
Pro
gre
ss
School State DET
The Year 5 students who completed the NAPLAN spelling at Eastern Creek Public School in 2008 achieved a growth average of 104.8 points compared to the state average of 84.5 points.
Average progress in writing
between Year 3 and Year 5
0
10
20
30
40
50
60
70
80
90
2006 - 2008 2007 - 2009 2008 - 2010
Pro
gre
ss
School State DET
The Year 5 students who completed the NAPLAN writing at Eastern Creek Public School in 2008 achieved a growth average of 68 points compared to the state average of 66.8 points.
Average progress in grammar
& punctuation between Year 3
and Year 5
0
20
40
60
80
100
120
140
2008 - 2010
Pro
gre
ss
School State DET
The Year 5 students who completed the NAPLAN grammar and punctuation at Eastern Creek Public School in 2008 achieved a growth average of 122.2 points compared to the state average of 95.7 points.
Progress in numeracy
Average progress in numeracy
between Year 3 and Year 5
0
20
40
60
80
100
120
2006 - 2008 2007 - 2009 2008 - 2010
Pro
gre
ss
School State DET
The Year 5 students who completed the NAPLAN numeracy at Eastern Creek Public School in 2008 achieved a growth average of 95.8 points compared to the state average of 89.3 points.
Minimum standards
The Commonwealth Government sets minimum standards for reading, writing, grammar and punctuation, spelling and numeracy for years 3 and 5.
The performance of the students in our school in the National Assessment Program – Literacy and Numeracy is compared to these minimum standards. The percentages of our students achieving at or above
these standards are reported below.
14
Percentage of Year 3 students in our school achieving at or above the minimum standard in 2010
Percentage of Year 3 students achieving at or above minimum standard
Reading 94
Writing 97
Spelling 97
Punctuation and grammar 91
Numeracy 85
Percentage of Year 5 students in our school achieving at or above the minimum standard in 2010
Percentage of Year 5 students achieving at or above minimum standard
Reading 96
Writing 96
Spelling 94
Punctuation and grammar 94
Numeracy 91
Significant programs and initiatives
Aboriginal education
Knowledge and understanding of Aboriginal Australia are evident in our school through the observance of special days and perspectives across the curriculum.
Policies and programs reflect the views and aspirations of Aboriginal Australia. Human Society and its Environment (HSIE) units include Aboriginal history and components of Aboriginal culture and traditions.
All students participate in Aboriginal studies which are incorporated into areas of music, art, craft, literacy and dance as well as through special activities.
Aboriginal culture and custodianship of Country are recognised through protocols such as “Welcome to Country and Acknowledgement of Country” and observation of the National Sorry Day.
Multicultural education
Eastern Creek Public School is fostering and promoting multiculturism in the curriculum through specific topics in HSIE which helps students gain an understanding of and a commitment to Australia’s diversity. The aim of
promoting intercultural understanding through the consideration of attitudes, beliefs and values was helped through activities such as dance, songs, games and special activities. The incorporation of Islamic Scripture classes and the use of school facilities for community groups such as the Mount Saione Christian Centre assist in the understanding and appreciation of our multicultural society.
Respect and responsibility
Values learning, the treatment of focus rule learning in school and the learning of respect and responsibility is carried out in school assemblies as well as in class activities. Children explore different focus values each week and this is supported by the weekly STAR Award. Children receive certificates listen to positive stories about fellow students when appropriate, at each assembly. Monthly Citizenship Awards are also included as a way of recognising positive student role models who demonstrate respect and responsibility. The Positive Behaviour for Learning Program (PBL) adds significant impact behind the continual message and expectation of values within the school community.
The values focused each week include; responsibility, honesty, trustworthiness, fair go for all, respect, tolerance, understanding, inclusion, doing your best, care, compassion, integrity, freedom and democracy.
Connected learning
Through the school’s Technology Plan, it was recognized that the quality of teaching and learning would be enhanced by the provision of technology in the classroom, professional development, support networks within the school, encouraging student access and use of online programs and using technology to improve interschool communication.
A total of ten interactive white boards (IWB) have been installed into classrooms and the library. A further four IWB’s need to be acquired to ensure all learning environments have access and equity is assured with all staff and students.
Teachers are making progress in using the new technology in varied ways which includes, online learning activities, programming using digital technology, investigating other strategies such as blog sites and i-pods and accessing conferencing type learning activities through the Connected Classroom.
15
Other programs
Student Welfare
Student Welfare is considered a major focus throughout the school. It involves programs that cover bullying, anti-racism, self esteem building, resilience and the recognition of achievements in many aspects of school life. The major focus is our STAR award program which involves earning a series of purple and yellow stars culminating in the receiving of a bronze, silver or gold lapel badge. This program encourages students to practise the core values and school rules of respect, responsibility, honesty, doing your best, participation, inclusivity, trustworthiness, integrity, maintaining one’s personal space and sportsmanship. This year saw some 120 bronze level certificates; 15 bronze badges; 25 silver level certificates; 6 silver badges and 3 gold level certificates were awarded. Citizenship, Merit certificates, Book of the Week and Sport awards are further programs that encourage students to achieve their best.
Approximately 2.1% of our school student population, engage in a quiet time with their teacher, a member of the executive or principal, reflecting on their behaviour and discussing alternative choices and strategies in order to avoid incidents and conflict or lifting classroom performance. The school chooses to use discussion and counseling rather than the strategy of detention.
In 2010 the students were treated to an anti-bullying show which was enjoyed by all and the message conveyed followed through to our students’ respect for each other and overall behaviour.
Future planning will ensure the culmination of our STAR program and the introduction of 8 core rules to be observed in all aspects of school life - within the classroom; the playground and excursions. There will be posters in all the rooms and around the school environment. The aim is for everyone - teachers and students to use the same language which should promote a greater understanding of our expectations and improve the overall behaviours at Eastern Creek Public School. The school appreciates the support of Mr Vern Loeckenhoff for his assistance in designing the STAR posters.
PBL - Positive Behaviour for Learning
Eastern Creek Public School is committed to being a PBL school since the beginning of 2009. PBL involves the use of systematic and individualised strategies aimed at assisting school communities to achieve important social and learning outcomes. The use of this method aims at creating both a positive and encouraging school environment for all students, staff and community members.
Throughout 2010, the PBL Committee has working to ensure our teacher’s, student’s, parent’s and community’s smooth transition and operation of the newly updated STAR award system. This has proved to be successful with thousands of purple and yellow awards being handed out resulting in the student’s believing the school’s positive culture and supportive environment.
Our current focus is to promote our school’s PBL STAR phrasing of Safety, Team Work, Aim High, Respect by designing and creating visually appealing and informative posters to display around our school environment. The aim of this is to communicate our values through pictures and key words allowing all school community members to successfully understand and implement the desired positive behaviours required to keep everyone safe, happy and motivated. The committee’s aim is to have all of these posters displayed across the school by the end of Semester 1, 2011.
Dance
2010 saw our dance ensembles travel to many venues to perform at a variety of events including the Learning Neighbourhood ‘Reach!’ concert , Mt Druitt Westfields, Education Week ‘Leading the Way’ concert and our school Excellence Assembly.
Our Junior Dance Group wowed the audience with their performance of the groovy hit “Love Shack” while our Senior Group entertained the crowds with the chart topper “If I Had You”.
A major highlight for our ‘Michael Jackson’ Troupe was the Sydney West Dance Festival which took place in June this year. After an amazing audition, our dancers were selected to represent our school and region at this prestigious event.

16
The commitment and quality of all performers thrilled and continued to motivate both Miss Creer and Miss Watkins inspiring them to choreograph dances that were unique, captivating and memorable. This year has certainly set a high standard, and all involved look forward to opportunities 2011 has to offer.
Djembe Drums
The success of our 2009 ‘Djembe Drum’ group enabled our goal of increasing the size of our performance group to occur. An additional 8 Djembe drums were purchased at the beginning of the school year which allowed our 2010 group to grow. Many students auditioned for the group with 12 Stage 3 students eventually being chosen to represent our school.
Many creative and floor moving rhythms were showcased during our school assemblies as well as the 2010 Learning Neighbourhood’s Reach! concert where they, along with the combined Djembe group ‘brought the house down’ with their unique performance titled ‘Tribal Beat’.
Our school looks forward to another exciting year and hopes that 2011 will see even more students receive the opportunity to join the very talented Eastern Creek Public School Djembe Drum Group
Mathletics
At Eastern Creek Public School we are always looking for new and exciting ways to assist and improve our student’s success in all Key Learning Areas. For the first time in our school’s history we joined 2,400 schools and over 600,000 students by participating in the Australian created and operated ‘Mathletics’ site. This online program allows students to access stage and age appropriate mathematical activities (independently chosen and set up by their classroom teacher) as well as the very popular ‘Liver Mathletics’ where students can verse other ‘mathletes’ from not only our school, but other Australian and international schools participating in the program. A $10 fee saw a 12 month subscription for each student which allowed 24/7 access as well as automatic enrolment into challenges such as ‘World Maths Day’.
At a school level we have been able to monitor the progress of each class and individual students and have been amazed by both the enthusiasm displayed and the progress made. School statistics have shown that our students have:
Answered 3888,985 ‘Live Mathletics’ and 147,285 ‘Curriculum’ questions correctly
Received 774 online participation certificates Demonstrated an average 1st attempt (the
Are You Ready tests) score of 74% which improved to and average final attempt (Test) score of 95%
Shown an average improvement (across all mathematical strands) of 34%
Due to the overwhelming success and interest displayed by staff and students, ‘Mathletics’ will be continued into 2011 and we look forward to another fun and successful year.
QuickSmart
As part of a federal government grant, 20 Stage Students participated in the QuickSmart Numeracy program in 2010. This program is aimed at freeing up mathematical working memory and allowing students to recall number facts accurately and quickly.
The three Stage 3 teachers and three Support Learning School Officers (SLSO), were trained in the principles of QuickSmart and each SLSO, including the coordinator, were trained in implementation of the program.
The program was initially for 12 students, however, through careful planning and resource allocation the school was able to accommodate 20 students who were deemed in need of extra support.
Each student had intensive 30 minute lessons three days each week for 28 weeks with outstanding results. All but two students demonstrated significant growth with one student showing a 25% growth. One student showed no growth and another fell behind.
Participating students were surveyed and indicated that they felt more confident in mathematics. Parent surveys indicated that children were noticeably more confident in mathematics and were progressing well. Teacher surveys indicated that students were not only

17
more confident in maths, but recall skills had noticeably improved.
Peer Reading
A buddy peer reading program was implemented in Term One of 2011 to assist younger students improve in reading. Through the employment of a qualified reading recovery teacher, 30 Year Six students were trained in peer tutoring. Each student was matched with a younger ‘buddy’ with the texts being specifically matched to the child’s reading level.
The program was implemented three days each week for most of the year and was extremely successful. Significant reading growth was evident for each student. Classroom teachers reported that students who participated in the program demonstrated improved learning outcomes in Literacy.
Preschool
2010 has been a busy and successful year in the Preschool. Our staff finds it very rewarding watching the children’s progress during the year and have worked very well as a team in job sharing positions.
This year we have enjoyed learning about healthy eating, dinosaurs, under the sea, helpers in our community, fairy tales, road safety and transport. The children have enjoyed using our new puppet theatre and retelling some of the fairy tales they have studied. Our home corner has been a hospital, a restaurant, a hair salon and a school during the year and has been very popular with all our students. This year we set up a drawing table that was available to the children every day. Here the children have learnt how to use tape dispensers, staplers, a hole punch and various drawing/writing tools as well as further developing the cutting, pasting and name writing skills they have learnt during programmed craft activities.
The Preschool had a visit from Magic Craig- “The Nutrition Magician” this year. As part of the Healthy Eating unit, the children learnt about eating foods of all different colours and varieties and choosing water to drink, to help them be Super Food Kids. The children laughed and giggled through the whole show and were very
excited to meet Mr Rainbow - Magic Craig’s rabbit.
The Transition to School Program continued this year. We combined with the Kindergarten classes for dancing and a special day called ‘Wacky Wednesday’. We also joined the Kindergarten classes during their lessons at the library in terms 3 and 4, getting to know how the library works and enjoying stories with Mrs Mead. The am class performed an item at the K-6 School Assembly in term 3. Many of the children also attended the Coming to School Program in term 4.
The outdoor program was improved this year with the installation of synthetic grass to some areas at the rear of the Preschool. This has made the area more comfortable for the children and allowed much better use of the area. Repairs were also made to the soft fall surface and climbing equipment at the front of the Preschool, improving safety. The stage became a police station and a woodwork area this year and the children also enjoyed being landscapers and traffic controllers after watching the digger working just outside the preschool fence.
The Preschool staff has been involved in a number of professional development events this year to prepare us for the implementation of the Early Years Learning Framework. The teachers attended the DET Preschool conference in October and returned with many new ideas to try. This year we have a Regional Preschool Consultant-Ruth Garlic- supporting us with local preschool meetings and other professional development.
The children did a great job performing for their parents at our Presentation Day, where they also received their portfolios/work sample folders and Preschool Certificates. In the last week they will also take home a gift they have made for their parents and a gift from their teachers.

18
Progress on 2010 targets
Target 1
75% of all K-6 student learning outcomes in
reading comprehension will increase their
reading age by 12 months and/ or an increase in
NAPLAN result by 1 band from Year 3 to Year 5.
Our achievements include:
The Waddington Reading test indicates that:
In Stage 1, (Yrs 1 and 2) 91.1% of the students in 2010 completed the reading test for both 2009 and 2010. 4.5% of students in Yr 1 and Yr 2 scored two years or above their chronological age, 46.2% scored twelve months to twenty three months above their chronological age, 40.2% scored one month to eleven months above their chronological age and 8.9% did not progress or scored a negative growth. The results showed that the school did not reach the intended target of 75% as only 50.7% of students in Yr 1 and Yr 2 scored an improvement of twelve months or above.
In Stage 2, (Yrs 3 and 4) 84.8% of the students in 2010 completed the reading test for both 2009 and 2010. 0% of students in Yr 3 and Yr 4 scored two years or above their chronological age, 20.3% scored twelve months to twenty three months above their chronological age, 61.8% scored one month to eleven months above their chronological age and 16.9% did not progress or scored a negative growth. The results showed that the school did not reach the intended target of 75% as only 20.3% of students in Yr 3 and Yr 4 scored an improvement of twelve months or above.
In Stage 3, (Yrs 5 and 6)88.8% of the students in 2010 completed the reading test for both 2009 and 2010. 2.8% of students in Yr 5 and Yr 6 scored two years or above their chronological age, 19.7% scored 12 months to twenty three months above their chronological age, 70.4% scored one month to eleven months above their chronological age and 5.6% did not progress or scored a negative growth. The results showed that the school did not reach the intended target of
75% as only 22.5% of students in Yr 5 and Yr 6 scored an improvement of twelve months or above.
In 2009 the NAPLAN reading band distribution showed that 33.3% of Year 5 students scored in Bands 8 and 7, 40.7% scored in Bands 6 and 5 and 25.9% scored in Bands 4 and 3. In 2010 the NAPLAN reading band distribution showed that 26% of Year 5 students scored in Bands 8 and 7, 58.6% scored in Bands 6 and 5 and 17.3% scored in Bands 4 and 3. The results show that the school succeeding in lifting the representation of students in Bands 6 and 5 and diminished the student representation in Bands 4 and 3 but did not lift representation in Bands 8 and 7.
Professional development activities in literacy will continue throughout the next year in order to improve the ability of students to read and utilize different strategies.
Target 2
75% of all K-6 students learning outcomes in
measurement, number patterns and algebra and
numeracy will increase by 10% according to the
Scaffolding Maths Diagnostic Test and/or an increase
in NAPLAN result by 1 band from Year 3 and Year 5.
Our achievements include:
Note: The Scaffolding Diagnostic Mathematics Test is used as a benchmarking tool to determine the percentage scores of students in number, patterns and algebra, measurement, space and geometry and data. For this reports all scores were averaged to determine a percentage score. Individual scores for each strand can be referenced at the school level. It is interesting to note that student scores reflected increasing complexity and level of understanding between each stage.
In Stage 1, (Yrs 1 and 2) 93.2% of the students in 2010 completed the Scaffold Mathematics Test for both 2009 and 2010. 44.9% of Yr 1 and Yr 2 students scored an improvement of 10% or above their 2009 test score. 6.8% scored from 1% to 9% improvement over their 2009 score and 47.8% showed nil or negative growth. The results show that the school did not achieve the intended target of

19
75% of students improving by 10% on their previous score.
In Stage 2, (Yrs 3 and 4) 78.6% of the students in 2010 completed the Scaffold Mathematics Test from both 2009 and 2010. 50.8% of Yr 3 and Yr 4 students scored an improvement of 10% or above their 2009 test score. 8.4% scored from 1% to 9% improvement over their 2009 score and 40.6% showed nil or negative growth. The results show that the school did not achieve the intended target of 75% of students improving by 10% on their previous score.
In Stage 3, (Yrs 5 and 6) 87.6% of the students in 2010 completed the Scaffold Mathematics Test from both 2009 and 2010. 29.7% of Yr 5 and Yr 6 students scored an improvement of 10% or above their 2009 test score. 14.2% scored from 1% to 9% improvement over their 2009 score and 55.9% showed nil or negative growth. The results show that the school did not achieve the intended target of 75% of students improving by 10% on their previous score.
In 2009 the NAPLAN band distribution in Numeracy showed that 0% of Year 5 students scored in Bands 8 and 7, 66.6% scored in Bands 6 and 5 and 33.3% scored in Bands 4 and 3. In 2010 the NAPLAN Numeracy band distribution showed that 19.5% of Year 5 students scored in Bands 8 and 7, 65.2% scored in Bands 6 and 5 and 15.2% scored in Bands 4 and 3. The results show that the school succeeding in lifting the representation of students in Bands 8 and 7 and diminished the student representation in Bands 4 and 3 and virtually remained the same for Bands 6 and 5.
In 2009 the NAPLAN band distribution in Data, Measurement, Space and Geometry showed that 7.4% of Year 5 students scored in Bands 8 and 7, 62.9% scored in Bands 6 and 5 and 29.6 % scored in Bands 4 and 3. In 2010 the NAPLAN Data, Measurement, Space and Geometry band distribution showed that 15.2% of Year 5 students scored in Bands 8 and 7, 63.0% scored in Bands 6 and 5 and 21.7% scored in Bands 4 and 3. The results show that the school succeeding in lifting the representation of students in Bands 8 and 7 and diminished the student representation in Bands 6, 5, 4 and 3.
In 2009 the NAPLAN band distribution in Number, Patterns and Algebra showed that 3.7% of Year 5 students scored in Bands 8
and 7, 66.6% scored in Bands 6 and 5 and 29.6 % scored in Bands 4 and 3. In 2010 the NAPLAN Number, Patterns and Algebra band distribution showed that 32.6% of Year 5 students scored in Bands 8 and 7, 43.4% scored in Bands 6 and 5 and 23.9% scored in Bands 4 and 3. The results show that the school succeeding in lifting the representation of students in Bands 8 and 7 and diminished the student representation in Bands 6 and 5. The representation in Bands 4 and 3 virtually remained the same.
Target 3
100% of K-6 students will have opportunities to
participate in performing arts activities and 20% of K-
6 students will have opportunities to extend, explore
and challenge their performing arts talents through a
variety of performances.
Our achievements include:
All students had opportunities to perform at school assemblies in dance, drama, singing and percussion.
An introduction of a public speaking competition, K-6, ensured that all students were given an opportunity to engage in public speaking at a class, grade and whole school level.
25.6% of students were able to represent the school in a performing art activity and engage audiences outside the school in such activities as dance, singing, drama, debating, drums and public speaking.
20
Key evaluations
It is a requirement for all NSW public schools to conduct at least two annual evaluations – one related to educational and management practice and the other related to curriculum. In 2010 our school carried out evaluations of
Educational and management practice
English- writing
Background
To make decisions aimed at improving the effectiveness of the teaching of writing, the school community, students and staff were asked to comment on aspects of the teaching and learning of writing using a survey developed from School Map- Best Practice Statements.
In all, 110 student surveys (from 110), 10 staff surveys (from 16) and 14 (from 124) of parent surveys were returned.
Findings and conclusions
Of the parent surveys, 11.2% were returned. Of the twelve questions nine were answered in the strongly agree and agree categories. In particular ‘confidence that writing is implemented K-6’, and ‘professional development of teachers in writing is important’ of which 90% answered ‘Strongly Agree’ and ‘Agree’. Parents survey indicated in the 80% range ‘that adequate and suitable writing resources is essential’, ‘support is necessary for students who experience difficulty in writing’ and that ‘grammar is being taught across all grades’. The survey shows that there is a need to ‘keep parents informed about writing practices and strategies’(30%). 20% of parent surveys showed that they do not believe “students complete quality pieces of writing, ‘understand the Board of Studies outcomes for writing’ and that “children know how to use grammar correctly when writing”.
Of the student surveys, 100% (110) were returned. All thirteen questions were answered in the strongly agree and agree categories. In particular ‘confidence that writing is taught in my classroom’, ‘I am given chances to practice my writing’, I understand why I have to learn writing’, ‘the school has good resources to help my writing’, ‘I try my very best when I do writing’, and ‘the use of correct grammar when writing is important in writing’ scored 90% and over in the
‘Strongly Agree’ and ‘Agree’ category. Of the survey questions 6.8% disagree with the statement “I have high expectations when completing my writing activities’ 15.8% disagree and strongly disagree with the statement, ‘the school has good writing resources’ and 15.8% disagree and strongly disagree with the statement “I am challenged to be creative and do really good writing’. 22.6% disagree and strongly disagree with the statement, “I like writing’ and 28.1% disagrees and strongly disagrees with the statement I like learning about grammar.
Ten teachers returned their English-writing survey sheets. Of the returned surveys, 20% disagree with the statement, ‘my students achieve quality writing outcomes’ and ‘my students achieve quality outcomes when using grammar in their writing’. Of particular note, 90% agree and strongly agree with the statements, ‘writing is taught across K-6’, ‘outcomes for writing as written by the Board of Studies is understood’, ‘I have high expectations of my student’s involvement in writing’, ‘my students achieve quality writing’, ‘my students are being extended and challenged in writing’ and ‘NAPLAN results help me to plan and effectively teach writing’. 100% agree and strongly agree with the statements, ‘the teaching of grammar is an essential part of teaching writing’, ‘professional development of teachers in writing is an important aspect to improving the quality of their teaching’.
Future directions
Writing opportunities for children to challenge their abilities and scope of writing pieces will be expanded. The “Learning Neighbourhood” Writers Award and the University of NSW writing competition provides opportunities for the students to participate in challenging writing activities. The school newsletter can be expanded to cater for student’s pieces of work. Professional development activities linked to writing will be sought as well as an increase in the level of resources available for classroom teachers to utilize for the teaching of writing. Parents will be informed through newsletter articles and workshops on aspects of writing, grammar and literacy.

21
Learning and School Culture
Background
To make decisions aimed at improving the learning within the definition of school culture, the school community, students and staff were asked to comment on aspects of learning and school culture using a survey developed from School Map- Best Practice Statements.
In all, 110 student surveys (from 110), 10 staff surveys (from 16) and 14 (from 124) of parent surveys were returned.
Findings and conclusions
In all, 100% of students returned their forms to the survey about School Culture. The vast majority of students expressed “almost always” and “usually” to the quality of learning. 4.2% of student responses indicated a “sometimes” and “rarely” to some of the questions. The majority of students indicate that a positive school environment exists in the school.
Of the returned Parent Surveys about School Culture indicated that the vast majority of parents are almost always or usually happy with aspects of School Culture. Two responses (14.2%) indicate that ‘when necessary the school makes important changes to what it does’ and ‘two responses (14.2%) indicated that ‘parents support what is happening at the school’ challenges improvements to be made in these two perceptions of school culture. There were no recorded results of “Rarely” in the surveys.
The staff surveys indicated a positive response to almost all of the questions. 28.5% (4) of responses were “sometimes”. There were no “rarely” recorded.
Future directions
Even though the areas indicated as “usually” and “sometimes” were small compared to the overall positive comments ticked, they are still responses that need to be looked at. The survey results will guide us in the future look at areas of: aspects of school leadership and the influences of positive change and to ensure that parent concerns are addressed in a positive and meaningful manner.
Parent, student, and teacher satisfaction
In 2010 the school sought the opinions of parents, students and teachers about the school.
Their responses are presented below.
Quality of Learning Environment
Background
A survey on Quality Learning Environment was conducted to determine the level of satisfaction within the school community. The survey asked for responses in two area- physical resources and facilities and personal feelings about teacher/parent/student relationship. The overwhelming majority of respondents indicting that the quality of learning environment was positive.
Throughout the year significant finances were expended on improving the learning environment of the school. Federal Government grants as well as P&C initiatives, community grants and school global budgeting allowed several projects to be completed.
Together with teaching and learning programs involving The Arts, online learning programs, furniture and room refurbishment programs has improved the quality of the learning environment. In December 2010, the school was awarded a special Premier’s Sport Grant to construct an all purpose sport court- tennis, netball, basketball- a much needed facility at the school which will improve the quality of teaching and learning physical education.
Of particular note, throughout 2010, the BER School and Community Hall was commissioned into full time use, four additional interactive White Boards were installed, all students K-6 were given the opportunity to participate in online learning, a teacher/parent meeting room was refurbished from a disused storeroom, a garden shed was constructed, the disused Western Sydney Area Health Community Nurse’s room was refurbished as the school uniform and community cottage, several vegetable garden beds were constructed for the gardening group, artificial turf was laid in parts of the preschool to improve safety and the back playground was improved significantly through the removal of concrete drainage pipes and replaced with a grassed swale and safety fencing.

22
It is a particular policy of the school for staff to be available for parents to have meaningful discussions about the progress and level of need of students and how best suited is the school in meeting those student needs.
In all, 86 student surveys (from 110), 14 staff surveys (from 16) and 14 (from 124) of parent surveys were returned. The surveys indicated a very positive feeling about the Quality of Learning Environment in the school.
Findings and conclusions
Of the parent surveys, 11.2% were returned. Of the forty questions twenty three scored 85% or more in terms of the ‘always’ and ‘mostly’ criteria. Fourteen of the forty criteria questions scored in the 70% to 84% ‘always’ and ‘mostly’ criteria.
Three criteria; ‘Homework is a valued educational learning activity” scored 57%, “I talk to my child’s teacher about learning’ scored 42.8% and ‘I have learnt some things about teaching and learning from my child’s teacher’ scored 64.2% in the ‘always’ and mostly’ criteria. Information from the school about aspects of teaching and learning and an evaluation of homework policy and activities will be looked at next year as a result of the parent surveys.
Of the student surveys, 87.2% were returned. Of the forty questions twelve scored in the scored 85% or more in terms of the ‘always’ and ‘mostly’ criteria. Thirteen of the forty criteria questions scored in the 71% to 84% ‘always’ and ‘mostly’ criteria.
Four criteria; ‘I get to choose my own projects’, scored 41.3% ‘students show respect for one another’ scored 55.1%, ‘students think doing homework is important’ scored 44.8% and ‘my teacher praises me when I do well’ scored 58.6% in the ‘always’ and mostly’ criteria. 17.5% of students do not agree with the statement, ‘my friends and I get together to talk about what we have learned’ These five survey results indicate that students have concerns about receiving feedback, individual research projects and the importance of homework, which can be addressed next year.
Of the staff surveys, 87.5% were returned. Of the forty questions thirty one scored 85% or more in terms of the ‘always’ and ‘mostly’ criteria. Three
of the forty criteria questions scored in the 70% to 84% ‘always’ and ‘mostly’ criteria.
Four criteria, ‘in class I sometimes allow my students the freedom to explore their own learning’ scored 21.4% in the ‘always’ and ‘mostly’ criteria, ‘I get to make presentations to colleagues about aspects of my profession’, scored 14.2%, ‘I often ask my students for their opinions about what we are learning’ scored 57.1% and ‘I am recognized professionally for my achievements’, scored 50% in the ‘always’ and ‘mostly’ criteria, need to be addressed next year through, better staff communications, opportunities for leadership and looking at teaching and learning strategies in the classroom.
Professional learning
Individual staff members are encouraged to develop their own professional development plan and in conjunction with school programs and focus areas, participate in training activities that will develop and improve their teaching skills.
Significant program for 2010 include, Best Start K-2 assessment and reporting, Literacy and numeracy, swimming instruction, leadership, Autism Spectrum Disorder and Healthy Living and Well Being for students.
The administration staff is encouraged to participate in professional learning activities. This year programs involving finances, spreadsheets and publishing as well as first aid, school administration staff conferences and workshops were attended.
The total of all professional development funding expenditure, for all staff, for 2010 was $15818.18 which includes relief staff on classes.

23
School development 2009 – 2011
The school will work towards achieving targets based on the 2009-2011 School Plan. The School Plan encompasses five areas:-
-Literacy
-Numeracy
-Performing Arts- dance, drama, percussion, singing, art
-Technology
-Positive Behaviour for Learning
Although specifically mentioned in the School Plan these five areas are not exclusive to the overall focus and implementation of programs in the school. Other programs include Live Life Well (Healthy Living, Sun Smart, Quiet retreat areas) and Best Start.
Targets for 2011
Three targets for 2011 are repeated from 2010 but modified to reflect the need to reach attainable and sustainable targets.
Target 1
75% of all Years 1-6 student will increase their
reading age by at least 6 months according to
the Waddington Reading Test and/ or an
increase in NAPLAN result by 1 band from Year 3
to Year 5.
Strategies to achieve this target include:
Stage teams developing and implementing innovative and creative teaching programs for comprehension, writing and spelling
Monitoring student progress through data collection of reading and spelling scores and the continued use of standardised tests for spelling and reading
Targeting individual students to access the school STLA , ESL and Best Start programs
Accessing WSR support programs such as the regional STLA and the SLSC coordinators
Accessing professional development programs to improve the quality of teaching and learning in reading, comprehension and spelling.
Extending the availability of new and highly motivating reading tests, reading schemes
and spelling and writing resources such as the Yellow, Blue, Red and Green box
‘Scaffolding Literacy’ teaching strategy to be used in all Stage 2 and 3 classes- eg school magazine.
Participating in competitions such as the Premier’s Reading Challenge, Premier’s Spelling Bee, debating, public speaking and UNSW competitions.
Parent training in the acquisition of literacy skills with emphasis on reading and writing.
Using initial assessment data to focus particular language and literacy programs for ATSI students with the use of Personalised Learning Programs.
Utilisation of the Best Start results and Best Start Literacy and Numeracy Coordinator in Stage 1.
Our success will be measured by:
Data indicates progress in strategic goals at NAPLAN level:- in particular-
Band progress from Year 3 to Year 5 . 75% of all students will improve their
comprehension level by at least 6 months in school based performance standardised testing.
Reduction in student representation in Skill Band 1 and Band 2 (Yr 3) and Band 3 and Band 4 (Yr 5) in the reading component from the 2010 NAPLAN results.
Increase in student representation by 10% in Band 5 and Band 6 from the 2010 NAPLAN for reading.
ASTI students K-6 will improve their standardised scores in reading and spelling by 6 months from the 2010 data result.
Target 2
75% of all Years 1-6 students in number,
patterns and algebra, measurement, space and
geometry and data will increase their score by
10% according to the Scaffolding Maths
Diagnostic Test and/or an increase in NAPLAN
result by 1 band from Year 3 and Year 5.
Strategies to achieve this target include:
Increased exposure to the recording of results and written tasks in numeracy activities, particularly from the ‘Counting On’ level.

24
Targeting class based teaching in areas of development for Year 4 and Year 6 as identified in NAPLAN results for 2010 (using SMART data)
Targeting individual and small group teaching in areas of development in Year 4 and Year 6 as identified in the NAPLAN results for 2010 (using SMART data).
Professional Learning – any Numeracy Online or PD activities including Connected Classroom Technology.
Professional Learning – targeted individual teacher learning in planning for and using effective strategies in the classroom- PBL strategies.
Provision of new resources for teaching of measurement, patterns and algebra and numeracy.
Utilisation of the Best Start results and Best Start Literacy and Numeracy Coordinator for ES1 and S1.
Implementing teaching strategies from the QuickSmart Maths program for students targeted in Year 5 and Year 6.
Our success will be measured by:
All K- 2 students will be using counting on strategies by the end of Stage 1 and the classroom teachers adopting the strategies provided by the Best Start Literacy/Numeracy Coordinator.
Reduction in student representation in Skill Band 1 and 2 in the measurement, number patterns and algebra and numeracy strands of the 2011 NAPLAN results compared to the 2010 results for Year 3 and 5.
Band progress from Year 3 to Year 5 for Year 5 students.
10% (3) increase in students achieving in the top two skill bands in the NAPLAN numeracy assessment (using SMART data) for Year 3 and Year 5.
75% percent of students Yr 1-6 will demonstrate growth of 10% in their Mathematics Scaffolding assessment scores for measurement, patterns and algebra and numeration over their 2010 score.
Target 3
100% of K-6 students will have opportunities to
participate in performing arts activities and 20% of K-
6 students will have opportunities to extend, explore
and challenge their performing arts talents through a
variety of performances.
Strategies to achieve this target include:
Providing opportunities for students to participate in singing, drama, percussion, dance and art activities at a classroom, school and wider level which includes district and regional performances.
Support ongoing staff development programs in all areas of performances and art.
Recognise the success of student’s performances.
Provide and update quality and relevant art and performance materials such as paint, fabric and other art supplies, musical instruments and costumes.
Explore the possibility of increasing the participation of students to perform at venues outside the local area.
Develop opportunities for students to participate in debating and public speaking.
Our success will be measured by:
Students’ participation rate in performing art activities.
Opportunities for selected groups of performers to participate at venues outside the school.
Level of interest and enthusiasm demonstrated by students to perform either in dance, drama, singing or display art works at exhibitions or in public speaking and debating engagements.
Utilisation of the School and Community Hall for performances, talent quests and other creative art activities.

25
About this report
In preparing this report, the self-evaluation committee has gathered information from evaluations conducted during the year and analysed other information about the school's practices and student learning outcomes. The self-evaluation committee and school planning committees have determined targets for the school's future development.
Preschool Team
Alison Jennings- classroom teacher
Sandra Lovegrove- school learning support officer
Melinda Lucas- classroom teacher
Arts Team
Melanie Creer- classroom teacher
Gay Parnaby- assistant principal
Elizabeth Wallace- classroom teacher
Lauren Watkins- classroom teacher
Reports
Louise Payne- assistant principal
Helen Ektoros- school administration manager
Julie Warby- P&C president
Franelle and Helena- school captains
Wesley Chia- principal
School contact information
Eastern Creek Public School
200 Rooty Hill Rd
Eastern Creek
Ph: 9625 8112
Fax: 9832 2412
Email: [email protected]
School Code: 1808
Parents can find out more information about Annual School Reports, how to interpret information in the reports and have the opportunity to provide feedback about these reports at: http://www.schools.nsw.edu.au/asr