2012 - amazon simple storage services3.amazonaws.com/pdfs.usna.com/2012annual_report.pdf · home...
TRANSCRIPT

RIGHTresultsthetheRIGHTreasons
ANNUAL REPORTThe United States Naval Academy Alumni Association
and United States Naval Academy Foundation
2012

For the right reasons—recruiting, educating, training
and supporting the young men and women who
have answered the call to serve their nation in a
challenging 21st century global environment.
Delivering the right results—the best and
brightest students, important and innovative
programs, outstanding preparation for leadership and
service. The USNA Alumni Association and Foundation
are the difference between great and truly exceptional.
reasons…results

2012 ANNUAL REPORT 1
A message from the Chairmen
Vice Admiral John R. Ryan ’67, USN (Ret.)Chairman, Board of DirectorsUnited States Naval Academy Foundation, Inc.
Admiral Robert J. Natter ’67, USN (Ret.) Chairman, Board of TrusteesUnited States Naval Academy Alumni Association, Inc.
The United States Naval Academy Alumni Association and Foundation have been committed to supporting the Naval Academy and to serving Academy alumni, parents and friends. This work touches everyone in the Brigade of Midshipmen and, through them, the U.S. Navy, the U.S. Marine Corps and the future of our nation. For the right reasons, both the Academy and the Alumni Association and Foundation deliver the right results: the best and brightest students, important and innovative programs, outstanding preparation for leadership and service.
Fiscal year 2012 was a year focused on investment and preparation for an exciting and complex future, centered on the vital priorities identified in the Naval Academy’s Strategic Plan 2020. Investments in talented people, landmark programs and cutting-edge infrastructure will enable us to
better support the Academy going forward. We anticipate that 2013 will set the stage for great accomplishments.
Generous gifts from our alumni, parents, friends of the Academy and corporations sustained and buoyed the Alumni Association and Foundation as we continued to build for tomorrow. We are grateful that so many believe in the Academy and are willing to support those who serve.
Alumni Association membership is now 58,268 strong, an increase of more than 1,939 new members. The Naval Academy is supported by 75 active graduated class organizations, 100 chapters worldwide and 80 parents clubs across the nation.
We are committed to serving the Naval Academy and its alumni for the right reasons, and we look confidently to helping deliver the right results in 2013.
As always, thank you for your generous support.

2012 ANNUAL REPORT 2
reasons…results
For the right reasons—providing vital resources and
support to the Naval Academy as it achieves the
priorities defined in its Strategic Plan 2020 and
continues to prepare graduates to serve in a
complex world.
Delivering the right results—adding the talents,
capabilities and technologies that enable us to
even better sustain and build one of the world’s finest
academic and leadership institutions.

2012 ANNUAL REPORT 3
A Message from the President and CEO
The United States Naval Academy Alumni Association and Foundation are better prepared than ever to enter into one of the most important and defining periods for the Naval Academy. As the Academy charts a course toward its Plan 2020 strategic objectives, fiscal year 2012 has seen our organization support that effort and expand our alumni network and engagement.
In 2012, we worked closely with the Academy Superintendent, Vice Admiral Michael Miller ’74, USN, to communicate and support Plan 2020 strategic priorities for the Brigade of Midshipmen. After outstanding service, Admiral Steve Abbot ’66, USN (Ret.), left the role of chairman of the Alumni Association Board of Trustees and has been followed by Admiral Robert Natter ’67, USN (Ret.). Vice Admiral John Ryan ’67, USN (Ret.), remains as chairman of the Foundation Board of Directors. The Athletic & Scholarship Program continues to be led by Chairman Rear Admiral Tom Lynch ’64, USN (Ret.). It is my honor and pleasure to work with each of these distinguished alumni leaders and their volunteer leadership.
Vision from our Alumni Association Board of Trustees is represented in the Alumni Association 2020 Strategic Plan. We have begun to align operationally under the Alumni 2020 Strategic Plan and are in a terrific position to build on this strategic plan effort each year. Our mission is evident in our activities throughout the year including: supporting the approximately 6,500 alumni who returned for class reunions in the fall and spring; increased chapter and club engagement during the football season from Dublin, Ireland, to the Kraft Fight
Hunger Bowl in San Francisco, CA; improved visibility at home football games with compelling alumni engagement at every game, including on-field recognition of the 2012 Distinguished Graduates and recognition of the families of fallen alumni; and, finally, more events and communications in support of the Academy as well as our alumni, donors and friends.
We have made exciting new hires to our Foundation team, headed by William J. O’Connor, new executive vice president. We have added robust technology and communications to enable and serve our mission and daily efforts. As always, we are deeply grateful to the alumni, parents, friends and corporations who continue to sustain our efforts to support our Academy and our alumni.
For 2012, donations to the Naval Academy totaled more than $11.6 million, which supported the Academy in critical areas such as cyber studies, ethics, international education and STEM camps. Our vital Naval Academy Annual Fund gifts totaled $6.7 million. With continued support from alumni, parents and friends, we are able to sustain vibrant programs and services that serve our Alumni Association and Foundation missions.
Thank you for your support.
Byron Marchant ’78President and CEO

2012 ANNUAL REPORT 4
You already know the right reasons: recruiting, educating, training and supporting the young men and women who have answered the call to serve their nation in a challenging global environment. These are the reasons—and the commitment—that span the 167-year history of the United States Naval Academy. Today and tomorrow, the global environment we face is a world of 21st century challenges, many of which are more technological, faster-moving and more decentralized than ever before.
This is why delivering the right results—the best and brightest students, benefiting from the most forward-looking, important and innovative programs, receiving complete, adaptable and outstanding preparation for leadership and service—is absolutely vital. Through the power of your generosity and commitment, the United States Naval Academy Alumni Association and Foundation are the difference between great and truly exceptional in all of these areas. This “margin of excellence” includes project-based learning programs, study abroad opportunities, athletic programs and other
initiatives that enhance the power of taxpayer dollars—all of which serve midshipmen and prepare them to be agile and exemplary when they graduate from the Academy.
In strategic partnership with the Naval Academy, the Alumni Association and Foundation are the inspiration, engine, vehicle and toolbox enabling both alumni and non-alumni to marshal the strength of their vision and philanthropy to support, promote and advance the mission of the Naval Academy. This is where the tremendous additional potential and opportunity defined by private philanthropic support of the Naval Academy become real and where the future is launched. In that future, America will continue to rely upon members of the armed forces to be its ambassadors of peace, strength and goodwill around the world. And our nation—its citizens, its government, its society—will continue to depend upon the people who dedicate their lives to perpetuating the values set forth by its founders.
In 2012, with the Naval Academy’s identification of its strategic priorities leading to 2020, it became even more clear that realizing those vital priorities requires
For all the right reasons, the Alumni
Association and Foundation are the
inspiration, engine and toolbox enabling
alumni and non-alumni to use the power of
your generosity to support and advance
the mission of the Naval Academy.
RIGHTresultsthetheRIGHTreasons…

2012 ANNUAL REPORT 5
the dedicated assistance and support of the Alumni Association and Foundation. The Academy has set forth a powerful and necessary vision, and we must provide the added measure of private support that will make these priorities a reality.
From the Foundation perspective, this was a year of preparing and investing for tomorrow. The groundwork was laid and the technological infrastructure and personnel were put in place for an accelerated effort to support the Academy’s strategic plan and provide the Brigade of Midshipmen with superb programs, facilities and opportunities as they prepare to become effective leaders in a rapidly changing world.
From the Alumni Association perspective, this was a year of expanded and enhanced engagement with alumni, parents and friends. New channels of communication and involvement were put in place to connect and grow the Academy family. Face-to-face connections around the nation grew in number and attendance. Bound to each other and their alma mater, Academy alumni continue to give back by encouraging outstanding young men and women to attend the Academy, by sharing their time and talent with today’s midshipmen and by supporting the Academy financially. It is the Alumni Association’s mission and privilege to
create, plan and support activities, programs and events that strengthen these bonds.
The Naval Academy Annual Fund remained an essential pool of funds that helped the Academy stay agile, flexible and ready to respond to emerging priorities or pursue exciting initiatives when opportunities arise. This is the powerful tool that Naval Academy leadership uses to leverage the greatest value for the Brigade of Midshipmen. As such, unrestricted giving through the Annual Fund continues to be vital to both the immediate and long-term quality of the Naval Academy and its programs.
In service to the right reasons, in successful pursuit of the right results, fiscal year 2012 was a continuation of our mission to support the nation’s premier leadership institution and a preparation for efforts that will be bigger and bolder than anything that has come before. We logged growing accomplishment and innovation in programs and partnerships, including the Center for Cyber Security Studies, the Stockdale Center for Ethical Leadership and the Fund for Athletic Excellence. Our deepest gratitude goes to all of you who made 2012 a transformative year. We hope you will continue to give of your resources, time and commitment, enabling the United States Naval Academy to continue to prepare young men and women to lead the nation with honor, courage and commitment.
Your commitment to the Academy
returns the right results and touches
everyone in the Brigade of Midshipmen and,
through them, the U.S. Navy, the U.S. Marine
Corps and the future of our nation.

2012 ANNUAL REPORT 6
A Message from the Chief Financial Officer
Henry J. SanfordChief Financial Officer and Treasurer
As the Chief Financial Officer and Treasurer of the Naval Academy Alumni Association and Foundation, I am pleased to provide a true and accurate picture of the financial condition of both organizations.
Overall, fiscal year 2012 was a year of transition and preparation for things to come. We made future-focused investments in IT infrastructure and paid off debt. The metrics we use to assess our financial health were strong, and we ended fiscal year 2012 in a good position, ready and able to provide ever more effective support to the Academy.
Our total support to the Naval Academy for fiscal year 2012 was $11.6 million, reflecting an increase from the previous year. Our goal, as always, was to be very conservative in our decision-making while maximizing both the services we offer to our alumni and the support we provide to the Academy.
The consolidated financial statements in this report accurately present the organization’s financial position, results of operations and workflows. The financial information is prepared in accordance with Generally Accepted Accounting Principles (GAAP) in the United States. The financial statements in this document are the complete set presented to our auditors. I have reviewed them, and to the best of my knowledge, they contain no untrue material statements nor do they omit any material facts.
Independent auditor McGladrey LLP audited our financial statements and expressed an unqualified opinion thereon. The auditor considered our internal controls to the extent they believe necessary to determine and conduct the audit to render an opinion. They found no significant deficiencies or material weaknesses during their audit, and there were no adjustments made. Our internal controls ensure transactions are authorized, executed and recorded properly.
The Joint Finance and Audit Committee—nine members who are neither officers nor employees of the Alumni Association or Foundation—meets quarterly with management to ensure the management team fulfills its responsibility for accounting controls and preparation of the financial statements and related data.
We are grateful to those who continue to support our mission, and we remain committed to operating with the utmost financial integrity as we are guided by the right reasons to deliver the right results.
2012 ANNUAL REPORT 7
020
40
60
8010012
014016
0180
FY12
FY11
FY10
FY09
FY08
FY07
FY06
FY05
FY04
FY03
FY02
-2%
0%
2%
4%
6%
8%
10%12
%
Ten
Year
s
Five
Yea
rs
Thre
e Ye
ars
One
Yea
r
0%
5%
10%
15%
20%
25%
30%
35%
40%
Oth
er H
edgi
ng A
sset
s
Cash
Equ
ival
ents
Infla
tion
Link
ed B
onds
Priv
ate
Real
ty &
Res
ourc
esREIT
s
Com
mod
ities
Oth
er T
otal
Ret
urn
Asse
ts
High
Yie
ld B
onds
Priv
ate
Equi
ty
Glo
bal E
quity
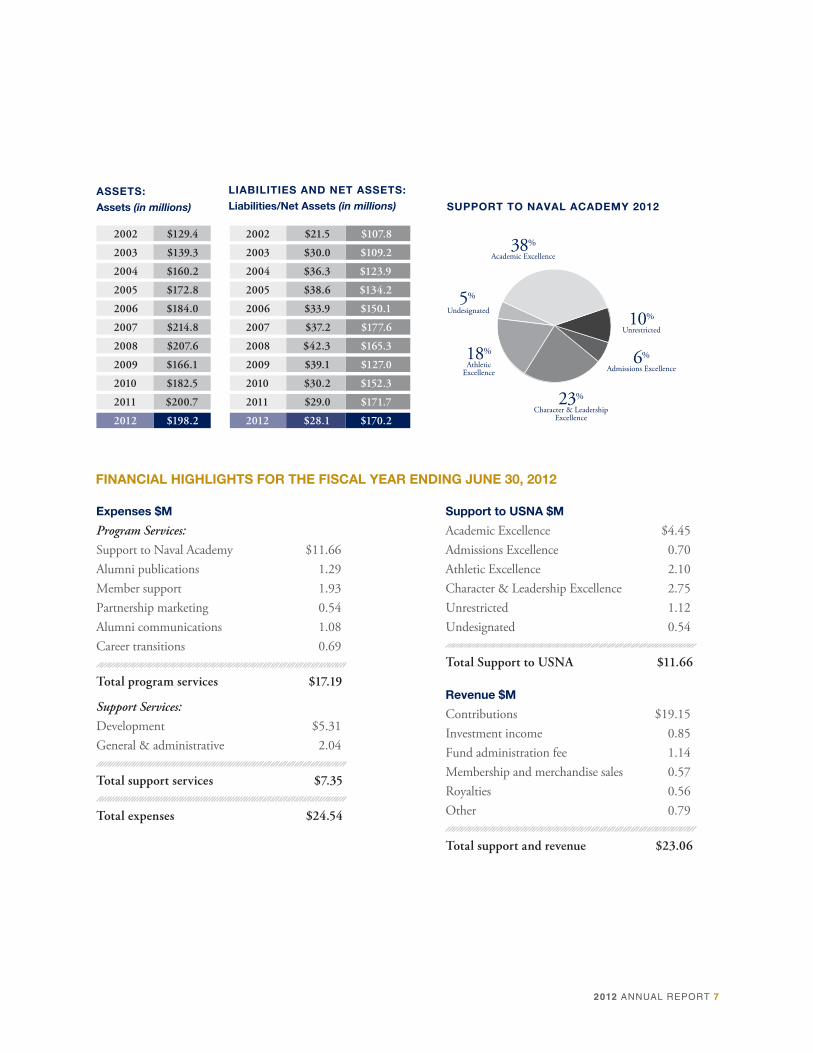
5% Undesignated
38% Academic Excellence
10% Unrestricted
6% Admissions Excellence
23% Character & Leadership
Excellence
18% Athletic
Excellence
SUPPORT TO NAVAL ACADEMY 2012
LIABILITIES AND NET ASSETS:
Liabilities/Net Assets (in millions)ASSETS:
Assets (in millions)
2002 $129.4
2003 $139.3
2004 $160.2
2005 $172.8
2006 $184.0
2007 $214.8
2008 $207.6
2009 $166.1
2010 $182.5
2011 $200.7
2012 $198.2
FINANCIAL HIGHLIGHTS FOR THE FISCAL YEAR ENDING JUNE 30, 2012
Support to USNA $M
Academic Excellence $4.45Admissions Excellence 0.70Athletic Excellence 2.10Character & Leadership Excellence 2.75Unrestricted 1.12Undesignated 0.54
Total Support to USNA $11.66
Revenue $M
Contributions $19.15Investment income 0.85Fund administration fee 1.14Membership and merchandise sales 0.57Royalties 0.56Other 0.79
Total support and revenue $23.06
Expenses $M
Program Services: Support to Naval Academy $11.66Alumni publications 1.29Member support 1.93Partnership marketing 0.54Alumni communications 1.08Career transitions 0.69
Total program services $17.19
Support Services: Development $5.31General & administrative 2.04
Total support services $7.35
Total expenses $24.54
2002 $21.5 $107.8
2003 $30.0 $109.2
2004 $36.3 $123.9
2005 $38.6 $134.2
2006 $33.9 $150.1
2007 $37.2 $177.6
2008 $42.3 $165.3
2009 $39.1 $127.0
2010 $30.2 $152.3
2011 $29.0 $171.7
2012 $28.1 $170.2

2012 ANNUAL REPORT 8
0
20
40
60
80
100
120
140
160
180
FY12FY11FY10FY09FY08FY07FY06FY05FY04FY03FY02
-2%
0%
2%
4%
6%
8%
10%
12%
Ten YearsFive YearsThree YearsOne Year
0% 5% 10% 15% 20% 25% 30% 35% 40%
Other Hedging Assets
Cash Equivalents
Inflation Linked Bonds
Private Realty & Resources
REITs
Commodities
Other Total Return Assets
High Yield Bonds
Private Equity
Global Equity
OVERVIEW
The total investment portfolio of the Alumni Association and Foundation is comprised of the Core Portfolio, the Planned Gift Portfolio and a number of stand alone accounts for various purposes which we have labeled as our Special Investments. As of 30 June 2012, the Core Portfolio, which holds the vast majority of the invested assets of the combined organization, was valued at $131.2M. The Planned Gift Portfolio consisting of non-pooled assets such as charitable remainder trusts, charitable gift annuities, and other life
Investment Portfolio Review
income funds was valued at $10.6M and the Special Investments accounted for $21.6M, bringing the total investment portfolio to $163.4M. This represents a market value decline of $3.1M from the previous fiscal year. The net decrease in market value since 30 June 2011 consists of $1.3M in net investment gains and a $4.4M reduction due to distributions. The annual market values of the total investment portfolio for each of the last ten fiscal years ending 30 June are shown below.
TOTAL PORTFOLIO MARKET VALUE
FISCAL YEARS ENDING JUNE 30 ($ MILLIONS)
78.287.2
105.1115.6
130.7
158.4 153.3
124.9
140.3
166.6 163.5
Core Portfolio Planned Gift Portfolio Special Investments

2012 ANNUAL REPORT 9
0
20
40
60
80
100
120
140
160
180
FY12FY11FY10FY09FY08FY07FY06FY05FY04FY03FY02
-2%
0%
2%
4%
6%
8%
10%
12%
Ten YearsFive YearsThree YearsOne Year
0% 5% 10% 15% 20% 25% 30% 35% 40%
Other Hedging Assets
Cash Equivalents
Inflation Linked Bonds
Private Realty & Resources
REITs
Commodities
Other Total Return Assets
High Yield Bonds
Private Equity
Global Equity
CORE PORTFOLIO ALLOCATION
Actual Allocation Policy Portfolio Targets
Tota
l Ret
urn
A
sset
sH
edg
ing
Ass
ets
CORE PORTFOLIO
The Core Portfolio represents approximately 80% of the total investment portfolio and holds the majority of endowed and long-term restricted gift funds. It’s a pooled fund managed by the firm, The Investment Fund for Foundations (TIFF) under the oversight of the Joint Investment Committee.
The Core Portfolio is invested with an objective of preserving the purchasing power of our invested assets over the long-term commensurate with the risk tolerance of the organization while supporting current spending. We believe that to achieve this objective we must invest with a strategy that contains the following elements: 1) A focus on long-term inefficiencies and mis-pricings that arise from the actions of those focused on the short term, 2) Seeks returns through asset allocation
decisions, manager outperformance and tactical tilts, and 3) A portfolio that is diversified across asset classes and managers. Thus, while we have built our Core Portfolio’s targeted asset allocation, the Policy Portfolio, with the long-term in mind, we take action in the shorter-term to add value and reduce risk as we deem prudent.
The Policy Portfolio is diversified across several asset classes, strategies and many underlying investment managers. It is developed in collaboration with our Investment Management firm TIFF and approved by the Joint Investment Committee. It represents the mix of assets that the Joint Investment Committee believes is best suited to meet our needs over the long-term and it provides both a guide and benchmark for measuring performance.

2012 ANNUAL REPORT 10
At the end of fiscal year 2012, the Core Portfolio had 55% of its assets invested in total return assets (equities and equity like investments) and 45% in hedging assets. Compared to the end of fiscal year 2011, this allocation represented about a 3% shift from hedging to total return assets. Several factors account for this shift with the mains ones being the continued build out of our private equity portfolio and modest positioning changes by our investment managers. Despite this modest shift towards total return assets, the Core Portfolio continues to be positioned more conservatively than our long-term strategic asset allocation—the Policy Portfolio.
During fiscal year 2012 the unresolved macroeconomic situation dominated and led to choppy markets. Overall
global equity returns trailed fixed income returns. Within the equities markets the non-U.S. indices were decidedly negative and trailed U.S. indices. The fixed income markets were positive across the spectrum. Ten-year U.S. Treasuries returned 17.4% as the Federal Reserve took actions to continue holding interest rates low to alleviate credit market distress.
As the chart on the next page shows the Core Portfolio returned 0.2% for fiscal year 2012. While on an absolute basis this is not a significant return, it outperformed the -1.3% return of our composite benchmark and the -1.0% of the passive portfolio. For the trailing 3-, 5- and 10-year periods, the Core Portfolio netted 10.7%, 2.3% and 6.7% respectively, also ahead of both benchmarks.

2012 ANNUAL REPORT 11
0
20
40
60
80
100
120
140
160
180
FY12FY11FY10FY09FY08FY07FY06FY05FY04FY03FY02
-2%
0%
2%
4%
6%
8%
10%
12%
Ten YearsFive YearsThree YearsOne Year
0% 5% 10% 15% 20% 25% 30% 35% 40%
Other Hedging Assets
Cash Equivalents
Inflation Linked Bonds
Private Realty & Resources
REITs
Commodities
Other Total Return Assets
High Yield Bonds
Private Equity
Global Equity
CORE PORTFOLIO VS. BENCHMARKS
0.2%
10.5%10.7%
-1.3% -1.0%
10%
2.3%1.6% 1.2%
6.7%6.1% 6.1%
Core Portfolio Composite Benchmark* 65/35 Passive Benchmark**
*USNA AA/F Composite Benchmark is a blend of benchmark returns for each asset class. Since 4/1/2006 it represents the
TIFF Adjusted Policy Portfolio. Prior to 4/1/2006 it was a Constructed Index calculated by Hirtle Callaghan.
**65% MSCI All Country World Index, 35% Barclays US Aggregate Bond Index.
PLANNED GIFT PORTFOLIO
The Planned Gift Portfolio consists of non-pooled investment accounts for charitable trusts assets, charitable gift annuities and a pooled income fund. The Planned Gift Portfolio made up about 7% of the total investment portfolio as of 30 June 2012. SunTrust Bank continues to serve as the Associations’ planned gift investment portfolio manager and planned gift administrator.
SPECIAL INVESTMENTS
The Associations hold a number of stand-alone investment accounts that do not fit within the core or planned gift portfolios. At fiscal year-end, these non-pooled special investments made up 13% of all investments. These accounts have a wide assortment of objectives and hold a wide variety of different investments. The largest accounts are the Alumni Association and Foundations’ short-term investment
accounts that totaled $12.0M as of 30 June 2012. These short-term investment accounts are invested in six month treasury bills for minimum risk and maximum liquidity. These accounts hold funds for restricted funds that will be needed in the near term or should not be subjected to market volatility and the organizations’ operating reserves.
OUTLOOK
With global growth continuing to be weak, central bankers in the U.S. and Europe setting extraordinarily accommodative credit policies, and very tenuous fiscal issues both in the U.S. and abroad, the future remains uncertain. Given this, we continue to remain cautious. We believe a well-diversified portfolio continues to be an appropriate long-term approach to achieve growth and sustain spending.

2012 ANNUAL REPORT 12

2012 ANNUAL REPORT 13
JUNE 30
2012CONSOLIDATED FINANCIAL REPORT The United States Naval Academy Alumni Association, Inc.
and United States Naval Academy Foundation, Inc.

The United States Naval Academy Alumni Association and Foundation
2012 ANNUAL REPORT 14
INDEPENDENT AUDITOR’S REPORT
To the Board of TrusteesThe United States Naval Academy Alumni Association, Inc.
To the Board of DirectorsUnited States Naval Academy Foundation, Inc.Annapolis, Maryland
We have audited the accompanying consolidated statements of financial position of The United States Naval Academy Alumni Association, Inc. (the Alumni Association) and the United States Naval Academy Foundation, Inc. (the Foundation) as of June 30, 2012 and 2011, and the related consolidated statements of activities and cash flows for the years then ended. These financial statements are the responsibility of the Alumni Association’s and the Foundation’s management. Our responsibility is to express an opinion on these financial statements based on our audits.
We conducted our audits in accordance with auditing standards generally accepted in the United States of America. Those standards require that we plan and perform the audit to obtain reasonable assurance about whether the financial statements are free of material misstatement. An audit includes examining, on a test basis, evidence supporting the amounts and disclosures in the financial statements. An audit also includes assessing the accounting principles used and significant estimates made by management, as well as evaluating the overall financial statement presentation. We believe that our audits provide a reasonable basis for our opinion.
In our opinion, the consolidated financial statements referred to above present fairly, in all material respects, the financial position of the Alumni Association and the Foundation as of June 30, 2012 and 2011, and the changes in their net assets and their cash flows for the years then ended, in conformity with accounting principles generally accepted in the United States of America.
Baltimore, MarylandOctober 12, 2012

2012 ANNUAL REPORT 15
2012 2011Assets Cash and cash equivalents $ 2,966,389 $ 2,802,662Accounts receivable and other current assets 556,748 361,450Contributions receivable, net (Note 2) 21,634,458 21,266,357Investments (Notes 3 and 4) 163,457,678 166,587,560Property and equipment, net (Note 6) 6,596,627 6,519,046Interest in third party trusts (Note 4) 3,062,173 3,214,872
Total assets $ 198,274,073 $ 200,751,947
Liabilities and Net AssetsLiabilities Accounts payable and accrued expenses $ 1,638,119 $ 1,602,344 Deposits on life memberships (Note 7) 568,365 596,418 Class savings accounts 2,497,440 2,591,093 Deferred income and deposits 885,543 979,017 Note payable (Note 8) - 1,000,000 Split-interest agreements 7,043,502 7,383,963 Accrued key employees’ retirement (Note 10) 830,141 728,153
Unamortized life memberships deferred revenue (Note 7) 14,604,238 14,188,831
Total liabilities 28,067,348 29,069,819
Commitments (Note 4)
Net Assets Unrestricted 10,475,865 11,816,442 Temporarily restricted (Notes 11 and 13) 100,620,261 100,851,595
Permanently restricted (Notes 12 and 13) 59,110,599 59,014,091
Total net assets 170,206,725 171,682,128
Total liabilities and net assets $ 198,274,073 $ 200,751,947
See Notes To Consolidated Financial Statements.
CONSOLIDATED STATEMENTS OF FINANCIAL POSITION June 30, 2012 and 2011

The United States Naval Academy Alumni Association and Foundation
2012 ANNUAL REPORT 16
Temporarily Permanently Unrestricted Restricted Restricted Total
Revenue, gains, and other support:Contributions (Note 5) $ 7,480,891 $ 11,157,187 $ 514,814 $ 19,152,892Membership dues 227,521 - - 227,521Life member amortization (Note 7) 306,324 - - 306,324Merchandise sales 35,317 - - 35,317Net investment income (Note 3) 315,399 675,825 (140,046) 851,178Publications and advertising 238,493 - - 238,493House activities 189,002 - - 189,002Career transition services 629,154 - - 629,154Homecoming and conference fees 127,675 - - 127,675Fund administrative fee 1,140,958 - - 1,140,958Royalties 562,260 - - 562,260Travel income 58,460 - - 58,460Other 157,406 - - 157,406Other support:
Change in value of split-interest agreements (250,813) (366,996) 5,114 (612,695) Changes in donors’ intent (Note 9) (781,933) 1,065,307 (283,374) - Net assets released from restrictions (Note 9) 12,762,657 (12,762,657) - -
Total revenue and gains 23,198,771 (231,334) 96,508 23,063,945
Expenses:Program services:
Support to the Naval Academy (Note 5) 11,664,735 - - 11,664,735 Alumni publications 1,287,169 - - 1,287,169 Membership support 1,930,129 - - 1,930,129 Partnership marketing 543,648 - - 543,648 Alumni communications 1,080,541 - - 1,080,541 Career transitions 686,739 - - 686,739
Total program services 17,192,961 - - 17,192,961
Supporting services:Development 5,306,438 - - 5,306,438General and administrative 2,039,949 - - 2,039,949
Total supporting services 7,346,387 - - 7,346,387
Total expenses 24,539,348 - - 24,539,348
Change in net assets (1,340,577) (231,334) 96,508 (1,475,403)Net assets:
Beginning 11,816,442 100,851,595 59,014,091 171,682,128
Ending $ 10,475,865 $ 100,620,261 $ 59,110,599 $ 170,206,725
See Notes To Consolidated Financial Statements.
CONSOLIDATED STATEMENT OF ACTIVITIES Year Ended June 30, 2012

2012 ANNUAL REPORT 17
CONSOLIDATED STATEMENT OF ACTIVITIES Year Ended June 30, 2011
Temporarily Permanently Unrestricted Restricted Restricted Total
Revenue, gains, and other support:Contributions (Note 5) $ 9,856,238 $ 6,201,766 $ 524,303 $ 16,582,307Membership dues 269,904 - - 269,904Life member amortization (Note 7) 294,703 - - 294,703Merchandise sales 43,534 - - 43,534Net investment income (Note 3) 4,680,819 16,643,198 482,788 21,806,805Publications and advertising 210,692 - - 210,692House activities 124,344 - - 124,344Career transition services 625,272 - - 625,272Homecoming and conference fees 181,132 - - 181,132Fund administrative fee 1,081,243 - - 1,081,243Royalties 573,058 - - 573,058Travel income 55,420 - - 55,420Other 48,272 - - 48,272Other support:
Change in value of split-interest agreements (165,602) 598,611 126,083 559,092 Changes in donors’ intent (Note 9) (1,650,634) 2,065,023 (414,389) - Net assets released from restrictions (Note 9) 11,872,998 (11,872,998) - -
Total revenue and gains 28,101,393 13,635,600 718,785 42,455,778Expenses:
Program services: Support to the Naval Academy (Note 5) 10,748,424 - - 10,748,424 Alumni publications 1,194,834 - - 1,194,834 Membership support 2,164,885 - - 2,164,885 Partnership marketing 537,357 - - 537,357 Alumni communications 978,874 - - 978,874 Career transitions 657,844 - - 657,844
Total program services 16,282,218 - - 16,282,218
Supporting services: Development 5,148,675 - - 5,148,675
General and administrative 1,653,737 - - 1,653,737
Total supporting services 6,802,412 - - 6,802,412
Total expenses 23,084,630 - - 23,084,630
Change in net assets 5,016,763 13,635,600 718,785 19,371,148
Net assets: Beginning 6,799,679 87,215,995 58,295,306 152,310,980
Ending $ 11,816,442 $ 100,851,595 $ 59,014,091 $ 171,682,128
See Notes To Consolidated Financial Statements.

The United States Naval Academy Alumni Association and Foundation
2012 ANNUAL REPORT 18
2012 2011Cash Flows From Operating Activities
Change in net assets $ (1,475,403) $ 19,371,148Adjustments to reconcile change in net assets to net cash
(used in) provided by operating activities: Depreciation and amortization 395,987 362,910 Change in discount and allowance on contributions receivable (207,246) (1,609,910) Amortization of life memberships (306,324) (294,703) Net realized and unrealized losses (gains) on investments 152,126 (17,059,149) Split-interest agreements (340,461) 286,781 Interest in third-party trusts 152,699 (470,748) Loss on disposal of property and equipment 4,802 - Contributed securities (1,582,173) (2,580,095) Contributions restricted for long-term investment (1,808,099) (190,782) Changes in assets and liabilities: (Increase) decrease in assets: Accounts receivable and other current assets (195,298) 183,361 Contributions receivable 108,978 8,438,471 Increase (decrease) in liabilities: Accounts payable and accrued expenses 35,775 349,820 Deposits on life memberships (28,053) 47,493 Class savings accounts (93,653) 61,245 Deferred income and deposits (93,474) 12,909 Accrued key employees’ retirement 101,988 115,803
Unamortized life memberships deferred revenue 721,731 681,252
Net cash (used in) provided by operating activities (4,456,098) 7,705,806
Cash Flows From Investing ActivitiesPurchases of property and equipment (478,370) (151,236)Purchase of investments (21,603,232) (24,806,662)Proceeds from sales or maturities of investments 26,163,161 18,159,178
Net cash provided by (used in) investing activities 4,081,559 (6,798,720)
Cash Flows From Financing ActivitiesProceeds from contributions restricted for long-term investment 1,538,266 740,719Principal payments on notes payable (1,000,000) (2,390,000)
Net cash provided by (used in) financing activities 538,266 (1,649,281)
Net increase (decrease) in cash and cash equivalents 163,727 (742,195)
Cash And Cash Equivalents:Beginning of year 2,802,662 3,544,857
End of year $ 2,966,389 $ 2,802,662
Supplemental Schedule Of Cash Flow InformationCash paid during year for interest $ 4,195 $ 21,321
Supplemental Disclosure Of Noncash Investing And Financing ActivitiesContributed securities $ 1,582,173 $ 2,580,096
Other non-cash assets $ 70,029 $ 98,340
See Notes To Consolidated Financial Statements.
CONSOLIDATED STATEMENTS OF CASH FLOWS Years Ended June 30, 2012 And 2011

2012 ANNUAL REPORT 19
Note 1. Organization And Summary Of Significant Accounting Policies
The consolidated financial statements of The United States Naval Academy Alumni Association, Inc. (the Alumni Association) and the United States Naval Academy Foundation, Inc. (the Foundation) have been prepared on the accrual basis of accounting. The two entities are collectively referred to herein as the Associations. Significant intercompany amounts have been eliminated in consolidation. The significant accounting policies are described below.
Organization: The Alumni Association is a not-for-profit, independent, self-supporting corporation of the Naval Academy alumni. First formed in 1886 as the United States Naval Academy Graduates Association, it was organized for educational and charitable purposes in 1931. It is dedicated to serve and support the nation, the naval service, the Naval Academy, and its alumni.
The Foundation was established in 1944 as an organization to support Naval Academy athletics and candidates for admission to the Naval Academy. The private giving arm of the Foundation was established in 1968 under the name of the United States Academy Memorial Fund, Inc. (the Memorial Fund).
During 1996, the name of the Memorial Fund was changed to the Naval Academy Associates, Inc. During 1997, the name of the Associates was changed to the Naval Academy Endowment Trust, Inc. (the Endowment Trust). As of December 31, 1999, the Endowment Trust amalgamated with the U.S. Naval Academy Foundation and changed its name to United States Naval Academy Foundation, Inc. The Foundation is a not-for-profit, independent organization created to raise private contributions to benefit the United States Naval Academy, the Brigade of Midshipmen (the Naval Academy), and the Alumni Association. The Alumni Association manages the investment and administrative functions of the Foundation. The Foundation records its share of actual expenses incurred by the Alumni Association for such services.
Net assets classification: Net assets, revenues, gains and losses are classified based on the existence or absence of donor-imposed restrictions. Accordingly, the net assets of the Associations and changes therein are classified and reported as follows:
Unrestricted net assets – Net assets that are not subject to donor-imposed stipulations.
Temporarily restricted net assets – Net assets subject to donor-imposed stipulations that may or will be met either by actions of the Associations and/or the passage of time.
Permanently restricted net assets – Net assets subject to donor-imposed stipulations that the Associations maintain them permanently. Generally, the donors of these assets permit the Associations to use all or a part of the income earned on related investments for general or specific purposes.
Revenue recognition: Contributions, including unconditional promises to give (pledges), are recognized as revenues in the year received. Promises to give are reported net of current year adjustments and discounts. Contributions for the benefit of the Naval Academy are recorded as contribution revenue when received and as support expenses when paid. The Alumni Association recognizes income from life membership dues over the life expectancy of the member at the time he or she becomes a member.
Contributions and investment income: Contributions and investment income are reported as increases in unrestricted net assets, unless use of the related assets is limited by donor-imposed purpose or time restrictions. Expirations of temporary restrictions on net assets (i.e., the donor-stipulated purpose has been fulfilled and/or the stipulated time period has elapsed) are reported as net assets released from restrictions in the consolidated statements of activities (see Note 9).
NOTES TO CONSOLIDATED FINANCIAL STATEMENTS

The United States Naval Academy Alumni Association and Foundation
2012 ANNUAL REPORT 20
Note 1. Organization And Summary Of Significant Accounting Policies (Continued)
Contributions with donor-imposed time restrictions are reported as unrestricted revenues when those restrictions are met in the same year the contribution is received.
Functional expenses: The costs of providing various programs and other activities have been summarized on a functional basis in the consolidated statements of activities. Accordingly, certain costs have been allocated among the programs and supporting services benefited.
Career transitions program expenses relate to the Service Academies Career Conference and career transition programs. Membership support expenses are the costs to provide services to members of the Alumni Association for class and chapter support and for special alumni events. Partnership marketing expenses relate to affinity programs and the cost of sales on merchandise. Alumni publication expenses consist primarily of the cost to produce Shipmate magazine and the Service Academy Business Resource Directory (SABRD). Alumni communication expenses support all electronic and Web-site-based communications. Development expenses are the costs to raise funds for the Naval Academy and the Associations.
Cash and cash equivalents: Cash equivalents are short-term investments with original maturities of three months or less at the date of purchase, excluding those short-term investments managed by the Associations’ investment managers as part of their long-term investment strategies.
Accounts receivable: Accounts receivable consists of current amounts due to the Alumni Association for life and corporate membership dues, advertising in Shipmate magazine, and events held at Alumni House. Accounts receivable are carried at original invoice amount less an estimate made for doubtful receivables based on a review of all outstanding amounts on a monthly basis. Management determines the allowance for doubtful accounts by identifying troubled accounts and by using historical experience applied to an aging of accounts. Accounts receivable are written off when deemed uncollectible. Recoveries of accounts receivable previously written off are recorded when received. An account receivable is considered to be past due if any portion of the receivable balance is outstanding for more than 90 days. Interest is not charged on receivables that are outstanding for more than 30 days. Management has determined that an allowance for doubtful accounts on accounts receivable was not necessary at June 30, 2012 and 2011.
Contributions receivable: Contributions are recognized when the donor makes a promise to give to the Associations that is, in substance, unconditional.
In accordance with Financial Accounting Standards Board (FASB) Accounting Standards Codification (ASC) 958-605-15-2 and FASB ASC 958-605-15-4, Revenue Recognition – Contributions Received, contributions to be received in a future period are discounted to their net present value at the time the revenue is recorded. The Associations’ contributions are discounted at a rate of five percent.
The Associations use the allowance method to determine uncollectible contributions. Management determines the allowance for uncollectible contributions by identifying troubled accounts and by using historical experience applied to an aging of accounts.
Investments: In accordance with FASB ASC 820, Fair Value Measurements and Disclosure, the Associations report all investments at fair value (see Note 4).
NOTES TO CONSOLIDATED FINANCIAL STATEMENTS

2012 ANNUAL REPORT 21
Note 1. Organization And Summary Of Significant Accounting Policies (Continued)
Investments are used for operations, class savings accounts, split-interest agreements, board-designated life membership funds, support for the Naval Academy, and the Associations’ endowments. Both entities initially record donated securities at the fair value on the date of the gift. These investments are exposed to various risks such as interest rate, market, and credit. Due to the level of risk associated with such investments and the related changes in value, it is at least reasonably possible that changes in risks in the near term would materially affect investment balances from the amounts reported in the consolidated financial statements.
The Associations’ core portfolio largely consists of various mutual funds under a principal investment manager. The multi-asset mutual funds provide exposure to several asset class segments: global stocks, absolute return, high yield bonds, real estate investment trusts (REIT’s), commodities, resource-related stocks, inflation linked bonds, conventional bonds, and cash equivalents.
Property and equipment: Property and equipment is stated at cost, less accumulated depreciation. Depreciation of property and equipment and amortization of software are computed using the straight-line method at rates adequate to depreciate and amortize the applicable assets over their expected useful lives, as follows:
Buildings and improvements 27 – 50 years Furniture and equipment 5 – 10 years Computer equipment and software 3 – 5 years
Maintenance and repair expenses are charged against operations. Expenditures for improvements that extend the useful lives of the assets are capitalized.
Valuation of long-lived assets: The Associations account for long-lived assets under FASB ASC 360-10-20, Accounting for the Impairment or Disposal of Long-Lived Assets. FASB ASC 360-10-20 requires that long-lived assets and certain identifiable intangible assets be reviewed for impairment whenever events or changes in circumstances indicate that the carrying amount of an asset may not be recoverable. Recoverability of the long-lived asset is measured by a comparison of the carrying amount of the asset to future undiscounted net cash flow expected to be generated by the asset. If such assets are considered to be impaired, the impairment to be recognized is measured by the amount by which the carrying amount of the assets exceeds the estimated fair value of the assets. Assets to be disposed of are reportable at the lower of the carrying amount or fair value, less costs to sell.
Class savings accounts: The Alumni Association is the custodian of various class savings accounts. These funds are invested and included in the Alumni Association’s investments ($2,481,020 and $2,428,673 at June 30, 2012 and 2011, respectively) and cash and cash equivalents ($16,420 and $162,420 at June 30, 2012 and 2011, respectively), but are restricted for use by the Alumni classes on Alumni events. The Alumni Association charges an administrative fee equal to 20 percent of the interest and realized and unrealized gains earned on each classes’ account balance, which is included in investment income in the consolidated statements of activities.
NOTES TO CONSOLIDATED FINANCIAL STATEMENTS

The United States Naval Academy Alumni Association and Foundation
2012 ANNUAL REPORT 22
Deferred income and deposits: Funds received for an affinity credit card agreement are recognized as royalty revenue over the life of the agreement. The remainder of deferred income and deposits consists of prepaid annual dues. Annual dues are amortized monthly into income over a period of one year.
Split-interest agreements: The Associations are the beneficiaries of several split-interest agreements, including charitable remainder unitrusts for which the Associations act as the trustee, charitable gift annuities, and a pooled income fund. Under charitable remainder trust agreements, the donor establishes and funds a trust. As trustee, the Associations make specified distributions to designated beneficiaries over the trust’s term. Upon termination of the trust, the Associations receive all or portions of the remaining trust assets, as set forth in the trust agreement. Under charitable gift annuity agreements, the Associations pay a fixed annuity amount for the life of the beneficiary(ies) and receive the remaining assets upon the death of the beneficiary(ies) as set forth in the annuity agreements. Under pooled income fund agreements, donors are assigned a specific number of units based on the proportion of the fair value of their contributions to the total fair value of the pooled income fund. Until a donor’s death, the donor is paid the actual income earned on the donor’s assigned units. Upon the donor’s death, the value of these assigned units reverts to the Alumni Association.
In the year of the gift, contribution revenue is recognized based on the net amount of the assets and liabilities of split-interest agreements. The contribution revenue recognized under such agreements was $69,378 and $45,068 during the years ended June 30, 2012 and 2011, respectively. The fair value of the assets held for all split-interest agreements was $11,123,902 and $12,762,912 as of June 30, 2012 and 2011, respectively. The liability to beneficiaries from the life-contingent agreements represents the present value of the estimated future payments based on actuarial assumptions. The liability for fixed term charitable remainder unitrusts is calculated in accordance with ASC 815, Derivatives and Hedging, by summing the present value of the debt host and the fair value of the embedded derivative. Adjustments to the liability to reflect any changes in actuarial assumptions, amortization of the discount are recognized as change in values in the consolidated statements of activities. The discount rates were determined at the time of initial contribution and range from 1.4 percent to 8.2 percent. The estimated life expectancies used for the charitable gift annuity agreements are from the Annuity 2000 Mortality Tables and the 2000CM tables for all trusts.
Interest in third-party trusts: The Associations are the beneficiary of certain third-party trusts held and administered by others. The estimated fair values of the trust assets, which approximate the present values of expected future cash flows from the Trust, are recognized as assets and as gift revenue when the Trusts are established or when reported to the Associations. Subsequent changes to the fair values of the trust assets are recognized as investment income.
Fund administrative fees: Restricted cash gifts are subject to an implementation fee of five percent in the year of receipt of the gift, which helps defray the cost of fund-raising and communication. Balances of restricted accounts of funds collected in a prior year are subject to fees for administrative services. Restricted accounts are subject to a .85 percent fee paid quarterly based on the cash balance at the beginning of the year. The fees are recorded as fund administrative fees in the consolidated statements of activities.
NOTES TO CONSOLIDATED FINANCIAL STATEMENTS
Note 1. Organization And Summary Of Significant Accounting Policies (Continued)

2012 ANNUAL REPORT 23
Income taxes: The Alumni Association has been recognized by the Internal Revenue Service (IRS) as exempt from federal income taxes under section 501(c)(3) of the lnternal Revenue Code (the Code), except for taxes on income generated from unrelated business activities such as the Alumni Travel Program, certain sponsorship income, advertising income from Shipmate magazine, and certain investment income. The Foundation has also been recognized by the IRS as exempt from federal income taxes under section 501(c)(3) of the Code.
The Associations have adopted the accounting for uncertainty in income taxes, which addresses the determination of whether tax benefits claimed or expected to be claimed on a tax return should be recorded in the financial statements. Under this policy, the Associations may recognize the tax benefit from an uncertain tax position only if it is more-likely-than-not that the tax position would be sustained on examination by taxing authorities, based on the technical merits of the position. Management has evaluated the Associations’ tax positions and has concluded that the Associations have taken no uncertain tax positions that require adjustment to the consolidated financial statements to comply with provisions of this guidance.
As of June 30, 2012 and 2011, there are no material unrecognized/derecognized tax benefits or tax penalties or interest. Generally, the Associations are no longer subject to U.S. federal, state or local tax examinations by tax authorities for years ending before June 30, 2009.
Fair value of financial instruments: The carrying amounts reported on the consolidated statements of financial position for cash and cash equivalents, receivables, accounts payable, and accrued expenses approximate their fair values. The fair value of the Associations’ notes and other long-term debt approximate the carrying amounts because the interest rates on these instruments fluctuate with market interest rates.
Credit risk: At certain times during the year, the Associations have funds on deposit with a financial institution in excess of federally insured amounts. The Associations have not experienced any losses on cash accounts and management believes they are not exposed to significant credit risk on cash.
Use of estimates: Management of the Associations has made a number of estimates and assumptions relating to the reporting of assets and liabilities, the disclosure of contingent assets and liabilities, and the reporting of revenues and expenses to prepare these consolidated financial statements in conformity with accounting principles generally accepted in the United States of America. Actual results could differ from those estimates.
Development expense: During the years ended June 30, 2012 and 2011, pledges totaling $1,147,820 and $1,490,942, respectively, were written off by the Associations. The pledges were written off as a result of the downturn in the economy and the change in financial ability of donors. Bad debt expense is included in Development expense and reported in the year the pledge becomes uncollectible.
Subsequent events: The Associations have evaluated subsequent events for potential required disclosures through October 12, 2012, which is the date the consolidated financial statements were available to be issued.
NOTES TO CONSOLIDATED FINANCIAL STATEMENTS
Note 1. Organization And Summary Of Significant Accounting Policies (Continued)

The United States Naval Academy Alumni Association and Foundation
2012 ANNUAL REPORT 24
Note 2. Contributions Receivable
Contributions receivable at June 30, 2012 and 2011, are summarized as follows:
2012 2011Unconditional promises expected to be collected in: Less than one year $ 11,936,019 $ 10,562,929 One year to five years 7,918,834 8,934,794
Over five years 6,616,277 6,812,552
26,471,130 26,310,275Less allowance for uncollectible amounts (2,586,240) (2,541,402)Less discount to present value (5%) (2,250,432) (2,502,516)
$ 21,634,458 $ 21,266,357
Note 3. Investments
Investments at fair value at June 30, 2012 and 2011, are summarized as follows:2012 2011
Cash and cash equivalents $ 1,481,595 $ 2,326,938Share certificates 1,956,790 1,673,578Debt securities bonds and notes 1,504,920 1,604,855Equity securities stocks 527,430 609,250
Total cash, cash equivalents, certificates and securities 5,470,735 6,214,621
Mutual funds Fixed income and debt mutual funds 23,766,512 24,975,224 Equity mutual funds 7,207,982 13,153,669 Combined fixed income and equity funds 543,726 300,503
Multi-asset mutual funds 89,524,933 89,967,328
Total mutual funds 121,043,153 128,396,724
Other investments Limited partnerships 11,945 13,010 Private equity funds 16,324,758 13,121,957 Private realty and resources funds 6,268,680 4,501,825 Hedge funds 13,126, 273 13, 129, 900
Charitable life insurance policies 1,212,134 1,209,523
Total other investments 36,943,790 31,976,215
$ 163,457,678 $ 166,587,560
NOTES TO CONSOLIDATED FINANCIAL STATEMENTS

2012 ANNUAL REPORT 25
Note 3. Investments (Continued)
Net investment income for the years ended June 30, 2012 and 2011, is as follows: 2012
Temporarily Permanently Unrestricted Restricted Restricted Total
Interest and dividends $ 371,144 $ 1,177,715 $ - $ 1,548,859Net realized gains 734,050 1,103,837 - 1,837,887Net unrealized losses (775,951) (1,214,062) (140,046) (2,130,059)Less management fees (97,289) (308,220) - (405,509) 231,954 759,270 (140,046) 851,178Transfer to restore corpus 83,445 (83,445) - -
Net investment income $ 315,399 $ 675,825 $ (140,046) $ 851,178
2011 Temporarily Permanently Unrestricted Restricted Restricted Total
Interest and dividends $ 992,957 $ 3,682,695 $ - $ 4,675,652Net realized gains 187,603 203,815 - 391,418Net unrealized gains 2,867,186 13,800,546 482,788 17,150,520Less management fees (97,491) (313,294) - (410,785) 3,950,255 17,373,762 482,788 21,806,805Transfer to restore corpus 730,564 (730,564) - -
Net investment income $ 4,680,819 $ 16,643,198 $ 482,788 $ 21,806,805
During fiscal year 2009, a number of the permanently restricted endowment funds sustained realized and unrealized investment losses, which resulted in the fund balances falling below corpus. A portion of unrestricted net assets has been reclassified as temporarily restricted to restore these balances to corpus levels. When the permanently restricted endowment funds’ balances rise above corpus, the unrestricted net assets that had been previously reclassified as temporarily restricted will be transferred back to unrestricted. The Associations transferred $83,445 and $730,564 to refund these unrestricted amounts, as of June 30, 2012 and 2011, respectively. Deficiencies of this nature that are reported in unrestricted net assets were $10,242 and $93,687 as of June 30, 2012 and 2011, respectively.
Note 4. Fair Value Measurements
Accounting guidance defines fair value as the price that would be received to sell an asset or paid to transfer a liability in an orderly transaction between market participants at the measurement date, and sets out a fair value hierarchy.
Observable inputs reflect market data obtained from independent sources. Unobservable inputs reflect assumptions based on the best information available under the circumstances. The Associations’ investment managers and staff use valuation techniques that maximize the use of observable inputs, and minimize the use of unobservable inputs. Certain alternative investments are carried at estimated fair value as of March 31 and adjusted for cash receipts, cash distributions and security distributions through June 30.
NOTES TO CONSOLIDATED FINANCIAL STATEMENTS

The United States Naval Academy Alumni Association and Foundation
2012 ANNUAL REPORT 26
Level 1 – Quoted prices (unadjusted) in active markets that are accessible at the measurement date for identical assets
Level 2 – Quoted prices for similar assets and liabilities in active markets; quoted prices for identical or similar assets and liabilities in markets that are not active; inputs other than quoted market prices that are observable for the asset or liability; and inputs that are derived principally from or corroborated by observable market data
Level 3 – Unobservable inputs for the asset or liability are supported by little or no market activity and significant to the fair values
The following table sets forth by level within the fair value hierarchy assets measured and reported at fair value on a recurring basis in the consolidated statements of financial position at June 30, 2012 and 2011, respectively:
Year Ended June 30, 2012Level 1 Level 2 Level 3 Total
Debt securities U.S. Government $ 1,494,856 $ - $ - $ 1,494,856 Corporate 10,064 - - 10,064Equity securities stocks 527,430 - - 527,430Mutual funds Domestic equity funds 6,683,720 - - 6,683,720 International equity funds 161,295 - - 161,295 World equity funds 159,732 - - 159,732 Emerging markets equity funds 101,104 - - 101,104 Government bond funds 19,513,351 - - 19,513,351 Corporate bond funds 3,809,718 - - 3,809,718 Corporate and Government bond funds 279,789 - - 279,789 Multi-asset fund 89,524,933 - - 89,524,933 Equity and fixed income funds 462,734 - - 462,734 Other – commodities, convertibles and sector funds 346,777 - - 346,777Limited partnership - - 11,945 11,945Private equity funds - - 16,324,758 16,324,758Private realty and resources funds - - 6,268,680 6,268,680Hedge funds - - 13,126,273 13,126,273Charitable life insurance policies - 1,212,134 - 1,212,134Interest in third party trusts - - 3,062,173 3,062,173Interest in charitable remainder unitrusts with third-party trustees - - 4,073,821 4,073,821
Total $ 123,075,503 $ 1,212,134 $ 42,867,650 $ 167,155,287
Note 4. Fair Value Measurements (Continued)
NOTES TO CONSOLIDATED FINANCIAL STATEMENTS

2012 ANNUAL REPORT 27
Note 4. Fair Value Measurements (Continued)
Year Ended June 30, 2011Level 1 Level 2 Level 3 Total
Debt securities bonds and notes U.S. Government $ 1,595,807 $ - $ - $ 1,595,807 Corporate 9,048 - - 9,048Equity securities stocks 609,250 - - 609,250Mutual funds Domestic equity funds 10,331,886 - - 10,331,886 International equity funds 2,437,442 - - 2,437,442 World equity funds 173,922 - - 173,922 Emerging markets equity funds 118,521 - - 118,521 Government bond funds 20,733,709 - - 20,733,709 Corporate bond funds 4,225,920 - - 4,225,920 Multi-Asset Fund 89,967,328 - - 89,967,328 Equity and fixed income funds 208,725 - - 208,725 Other – commodities, convertibles and sector funds 199,271 - - 199,271Limited partnership - - 13,010 13,010Private equity funds - - 13,121,957 13,121,957Private realty and resources funds - - 4,501,825 4,501,825Hedge funds - - 13,129,900 13,129,900Charitable life insurance policies - 1,209,523 - 1,209,523Interest in third party trusts - - 3,214,872 3,214,872Interest in charitable remainder unitrusts with third-party trustees - - 4,361,351 4,361,351
Total $ 130,610,829 $ 1,209,523 $ 38,342,915 $170,163,267
Cash and cash equivalents are excluded from the fair value hierarchy as cash and cash equivalents are generally measured at cost. As such, $1,481,595 and $2,326,938 of cash and cash equivalents and $1,956,790 and $1,673,578 of share certificates held in the Associations’ investment portfolio at June 30, 2012 and 2011, respectively, have been excluded from this table.
NOTES TO CONSOLIDATED FINANCIAL STATEMENTS

The United States Naval Academy Alumni Association and Foundation
2012 ANNUAL REPORT 28
The following is a reconciliation of the beginning and ending balances for assets measured at fair value using significant unobservable inputs (Level 3):
Balance, June 30, 2010 $ 11,278 $ 9,144,717 $ 2,353,063 $ 11,859,684 $ 2,744,124 $ 3,760,744 $ 29,873,610
Realized gains 353 309,606 69,541 379,500 Unrealized gains 1,732 1,692,115 409,108 1,270,216 482,788 - 3,855,959 Transfer into Level 3 - 2,462,122 1,772,091 - - - 4,234,213Transfer out of Level 3 - (88,875) - - - - (88,875) Sales (353) (397,728) (101,978) - (31,239) - (531,298)Change in value - - - - 19,199 600,607 619,806 Balance, June 30, 2011 13,010 13,121,957 4,501,825 13,129,900 3,214,872 4,361,351 38,342,915
Realized gains - 845,254 125,716 - - - 970,970Unrealized gains (losses) (1,065) 110,836 253,109 (3,627) (140,046) - 219,207Transfer into Level 3 - 3,861,469 1,651,127 - - - 5,512,596Transfer out of Level 3 - (966,485) (231,533) - - - (1,198,018)Sales - (648,273) (31,564) - (29,746) - (709,583)Change in value - - - - 17,093 (287,530) (270,437)Balance, June 30, 2012 $ 11,945 $ 16,324,758 $ 6,268,680 $ 13,126,273 $ 3,062,173 $ 4,073,821 $ 42,867,650
Unrealized gains (losses) and change in value relating to assets still held as of June 30, 2012 $ (1,065) $ 110,836 $ 253,109 $ (3,627) $ (122,954) $ (287,530) $ (51,231)
The Associations categorize assets within the fair value hierarchy based on their understanding of the valuation process used by their investment managers or general partners to derive the fair value and their judgment regarding the observability of the related inputs. In evaluating the observability of such inputs, the Associations’ staff considered factors such as the extent of market benchmarks available and the judgments or modeling required in the valuation process.
Limited partnership: The fair value of the limited partnership is determined based on the audited financial statements which the entity prepares on an annual basis as of the Associations’ reporting date. The .5 percent limited partnership interest was gifted to the Foundation in 1998, and no other capital commitments are required. The underlying assets of the partnership primarily consist of bank accounts, marketable securities, debt instruments, loans to partners and a prepaid inheritance paid to a descendent of a family member/limited partner. The partnership shall continue until December 31, 2037, unless terminated sooner.
Private equity funds: Substantially all of the Associations’ investments in private equity represent interests in multiple funds of funds private equity investment vehicles managed by the Associations’ principal investment manager and another designated investment manager. The investment funds typically pursue such strategies as investments in venture capital, buyouts, subordinated debt, restructuring and distressed debt and securities, recapitalizations and other situations.
NOTES TO CONSOLIDATED FINANCIAL STATEMENTS
Note 4. Fair Value Measurements (Continued)
Limited Partnership
Private Equity Funds
Private Realty And Resources
Funds Hedge Funds
Interest In Third-Party
Trusts
Interest In CRUTs With Third-Party
Trustees Total

2012 ANNUAL REPORT 29
In each underlying fund, securities with no readily available market are initially valued at cost, with subsequent adjustments to values which reflect either the basis of meaningful third party transactions in the private market or the fair value deemed appropriate by relevant market participants. The fund of funds then obtains and independently evaluates its share of the valuation from the underlying investment managers.
The private equity vehicles have terms ranging from 12 to 15 years with respective expiration dates from 2017 to 2025. The investment managers have up to three to five consecutive one-year extensions at their discretion. Interests in these vehicles are subject to significant restrictions on transferability.
Under the terms of these private equity investment contracts, the Associations are obligated to remit additional funding periodically as capital calls are exercised. At June 30, 2012, the Associations’ had uncalled commitments of $14,298,757, which represents 43 percent of the original commitments. The Associations expect the remaining commitments to be called over the next several years.
Private realty and resources funds: Substantially, all of the investments in private realty and resources are through fund of funds private realty and resources investment vehicles managed by the Associations’ principal investment manager. The investment funds typically pursue such strategies as investments in commercial and residential real estate, oil and natural gas exploration and production, timberland, and other natural resources. The valuation for underlying investments within each fund is determined in the same manner as private equity funds.
The invested private realty and resources vehicles have terms ranging from 13 to 15 years with respective expiration dates from 2017 to 2023. The investment manager has up to seven consecutive one-year extensions at their discretion. Interests in these vehicles are subject to significant restrictions on transferability.
The remaining commitments under the terms of the private realty and resources funds amounted to $3,360,000 as of June 30, 2012, representing 35 percent of the original commitments. The Associations expect the remaining commitments to be exercised over the next several years.
Hedge funds: The Associations invest in hedge funds through an offshore fund of funds vehicle managed by the Associations’ principal investment manager. This investment vehicle employs directly, or through other managers, in the following strategies: capital structure arbitrage, event arbitrage, fixed income arbitrage, hedged equity investing, special situations investing and possibly derivative investments, as well as buying and selling securities for hedging purposes. Valuation of interests in underlying investment funds is based on an amount equal to the vehicle’s pro-rata interest in the net assets, which are at fair value, as reported by the management of the investment fund monthly, as adjusted for manager and incentive fees, if applicable.
The vehicle has no set termination date. Following the initial three-year lock-up period, the Associations are currently subject to an additional three-year lock-up period, during which share redemptions are permitted on December 31 of each year with 100 days’ advance written notice. Early redemptions within a lock-up period are subject to a 20 percent gate, which prohibits redemption exceeding 20 percent of the total fund’s value. Shares in the vehicle are not registered for public sale. The Associations perform due diligence procedures to review the valuations of the alternative investments described above.
Interest in third-party trusts: The Associations’ staff estimates their beneficial interest in the third-party trusts using the discounted cash flow method of the expected future income for a specified term or in perpetuity based on the donors’ life expectancy and the expected investment return.
NOTES TO CONSOLIDATED FINANCIAL STATEMENTS
Note 4. Fair Value Measurements (Continued)

The United States Naval Academy Alumni Association and Foundation
2012 ANNUAL REPORT 30
Note 5. In-Kind Contributions
The Foundation contributes the use of its houses to the Naval Academy Athletic Association, which are valued at an annual amount of $339,055 and $418,747 in 2012 and 2011, respectively. Contributed services related to property management of the Foundation’s houses are donated by the Naval Academy Athletic Association and are valued at an annual amount of $59,310 and $62,919 in 2012 and 2011, respectively.
During 2012 and 2011, the Associations received non-cash donations of assets for use by the Naval Academy valued at $70,029 and $98,340, respectively, which have been shown as temporarily restricted contributions and support to the Naval Academy (program expense) in the accompanying consolidated statements of activities.
Note 6. Property And Equipment
Property and equipment at June 30, 2012 and 2011, is summarized as follows: 2012 2011Land $ 753,197 $ 753,197Buildings and improvements 8,051,776 8,007,070Furniture and equipment 1,195,619 1,151,592Computer equipment and software 845,575 614,124
10,846,167 10,525,983Less accumulated depreciation and amortization (4,249,540) (4,006,937)
$ 6,596,627 $ 6,519,046
Depreciation expense was $395,987 and $362,910 for the years ended June 30, 2012 and 2011, respectively.
Note 7. Life Memberships
In 1976, the Alumni Association started its life membership program, which enables midshipmen to pay a specified life membership fee prior to graduation. In exchange for this fee, members receive a subscription to Shipmate magazine and various other service benefits and opportunities. The Alumni Association records the midshipmen’s fees as deposits on life memberships until the respective class graduation. At June 30, 2012 and 2011, the Alumni Association held $568,365 and $596,418, respectively, of midshipmen life membership fees. After graduation, the fees are reclassified as unamortized life membership deferred revenue and are amortized over an assumed 61-year remaining life expectancy of the graduating midshipmen. During the years ended June 30, 2012 and 2011, $601,398 and $547,209, respectively, relating to the graduating classes of 2012 and 2011, were reclassified as unamortized life memberships deferred revenue. Payments from alumni who join the life membership program after graduation are recorded as deferred revenue and amortized over an assumed remaining life expectancy of 55 years.
The unamortized life memberships deferred revenue represents the deferred revenue from life membership cash receipts rather than the liability to service the life members over their life expectancies.
NOTES TO CONSOLIDATED FINANCIAL STATEMENTS

2012 ANNUAL REPORT 31
Note 8. Notes Payable And Revolving Line Of Credit
In October 2006, the Associations obtained an $8,000,000 note from a bank under an unsecured, open-end revolving line of credit that expired in October 2011. During fiscal year 2011, the Associations repaid $500,000 and satisfied the obligation in full. Interest expense of $862 was recorded during the year ended June 30, 2011.
The Foundation had a $10,000,000 note from a bank under an unsecured, open-end revolving line of credit for short term cash flow needs of restricted projects, which expired in December 2011. Principal was due on demand. Interest, which was due in monthly installments, was based on the 30-day London Interbank Offered Rate (LIBOR) index rate plus 0.6 percent. At June 30, 2011, the 30-day LIBOR index rate was .19 percent. Interest expense of $4,195 and $20,459 was recorded during the years ended June 30, 2012 and 2011, respectively. The Foundation repaid $1,000,000 and $1,890,000 of the principal in fiscal years 2012 and 2011, respectively. The note was repaid in full as of June 30, 2012. The outstanding balance of this note was $1,000,000 as of June 30, 2011.
On January 31, 2012, the Associations obtained a $10,000,000 note from a bank under an unsecured, open-end revolving line of credit expiring in January 2017 for use as an operating line of credit. Principal is due on demand and interest is based on the 30-day London Interbank Offered Rate (LIBOR) index rate plus 1.1 percent (1.34 percent at June 30, 2012) and is payable monthly. No draws on this line of credit were made during the fiscal year ended June 30, 2012. This line of credit replaced the $8,000,000 note described above.
On January 31, 2012, the Associations obtained a $10,000,000 note from a bank under a unsecured non-revolving line of credit expiring in January 2017 for short term cash flow needs on specific restricted projects. Principal is due on demand. Interest, which is due in monthly installments, is based on the 30-day LIBOR index rate plus 1.1 percent (1.34 percent at June 30, 2012). No draws on this note were made during the fiscal year ended June 30, 2012. This note replaced the $10,000,000 note described above that expired in December 2011.
Note 9. Net Assets Released From Restrictions And Changes In Donors’ Intent
Net assets of $12,762,657 and $11,872,998 for the years ended June 30, 2012 and 2011, respectively, were released from donor restrictions due to the passage of time or by incurring expenses satisfying the restricted purpose specified by the donors. Amounts shown as changes in donors’ intent for the year ended June 30, 2012, represent reclassifications of $781,933 from unrestricted net assets and $283,374 from permanently restricted net assets to temporarily restricted net assets. Amounts shown as changes in donors’ intent for the year ended June 30, 2011, represent reclassifications of $1,650,634 from unrestricted net assets and $414,389 from permanently temporarily restricted net assets to temporarily restricted net assets.
Note 10. Retirement Plans
403(b) savings plan: The Alumni Association maintains a deferred annuity retirement plan under Section 403(b) of the Internal Revenue Code for all eligible employees. On a discretionary basis, the Alumni Association matches employee’s contributions up to 5 percent of base salary. An independent trustee holds the assets of the Plan. During the years ended June 30, 2012 and 2011, the Alumni Association made contributions of $190,490 and $89,011, respectively, on behalf of its eligible employees.
NOTES TO CONSOLIDATED FINANCIAL STATEMENTS

The United States Naval Academy Alumni Association and Foundation
2012 ANNUAL REPORT 32
Note 10. Retirement Plans (Continued)
457 plans: The Alumni Association has agreements with seven key employees/former employees to provide certain retirement and other payments to them as part of retention planning. These non-qualified plans are administered under Sections 457(b), e(11) and (f ) of the Internal Revenue Code. The payments are either deferred or contingent on the employee meeting certain conditions. Total retirement expense under this plan for the years ended June 30, 2012 and 2011, was $160,000 and $116,500, respectively.
At June 30, 2012 and 2011, the Alumni Association’s liability for these plans was $830,141 and $728,153, respectively.
Note 11. Temporarily Restricted Net Assets
Temporarily restricted net assets represent funds to be received in future years from split-interest agreements, pledges, and amounts to be spent on behalf of the Naval Academy. A portion of net assets is restricted for use on projects specified by the donor. These purpose-restricted assets are released when expended on the specified project. In addition, pledges to be received in future years are classified as temporarily restricted based on an implied time restriction.
2012 2011Naval Academy Centers of Excellence: Academic $ 38,851,427 $ 39,081,574 Admissions 7,135,472 7,803,058 Athletics 15,430,149 11,655,391 Character (ethics) 11,388,148 12,018,509 Leadership 10,946,328 11,691,850Support to the Naval Academy
not yet assigned to a center of excellence 7,684,997 7,672,581
Purpose restricted assets 91,436,521 89,922,963Time restricted assets 9,183,740 10,928,632
Total temporarily restricted net assets $ 100,620,261 $ 100,851,595
Note 12. Permanently Restricted Net Assets
Permanently restricted net assets at June 30, 2012 and 2011, are invested to fund the following:2012 2011
Endowments supporting U.S. Naval Academy $ 50,304,248 $ 50,117,210Endowments supporting athletics and scholarship 5,997,515 6,137,561Endowments supporting operations 2,808,836 2,759,320
Total permanently restricted net assets $ 59,110,599 $ 59,014,091
NOTES TO CONSOLIDATED FINANCIAL STATEMENTS

2012 ANNUAL REPORT 33
Note 13. Endowment Funds
ASC 958-205, Endowments for Not-for-Profit Organizations: Net Asset Classification of Funds Subject to an Enacted Version of the Uniform Prudent Management of Institutional Funds Act, and the Enhanced Disclosures for All Endowment Funds provides guidance on net asset classification of donor-restricted endowment funds for a not-for-profit organization that is subject to an enacted version of the Uniform Prudent Management of Institutional Funds Act of 2006 (UPMIFA). ASC 958-205 also improves disclosures about an organization’s endowed funds (both donor restricted endowment funds and board designated endowment funds) whether or not the organization is subject to UPMIFA. The Associations have added the required disclosures in the consolidated financial statements, which is a requirement for any organization with endowment funds.
The Associations’ endowment consists of approximately 72 individual funds established for a variety of purposes. These endowment funds are donor-restricted. The Associations do not have any board-designated endowment funds. As required by generally accepted accounting principles, net assets associated with endowment funds are classified and reported based on the existence or absence of donor-imposed restrictions.
Interpretation of relevant law: The Board of Trustees of the Association and the Board of Directors of the Foundation have interpreted UPMIFA as requiring the preservation of the fair value of the original gift as of the gift date of the donor-restricted endowment funds absent explicit donor stipulations to the contrary. As a result of this interpretation, the Associations classify as permanently restricted net assets: (a) the original value of gifts donated to the permanent endowment; (b) the original value of subsequent gifts to the permanent endowment; and (c) accumulations to the permanent endowment made in accordance with the direction of the applicable donor gift instrument at the time the accumulation is added to the fund. The remaining portion of the donor-restricted endowment fund that is not classified in permanently restricted net assets is classified as temporarily restricted net assets until those amounts are appropriated for expenditure by the Associations in a manner consistent with the standard of prudence prescribed by UPMIFA. Accordingly, the Associations consider the following factors in making a determination to appropriate or accumulate donor-restricted endowment funds:
(1) The duration and preservation of the fund(2) The purposes of the Associations and the donor-restricted endowment fund(3) General economic conditions(4) The possible effect of inflation and deflation(5) The expected total return from income and the appreciation of investments(6) Other resources of the Associations(7) The investment policies of the Associations
Return objectives and risk parameters: The Associations’ return objective is to preserve and enhance the purchasing power of the endowment investments over time, net of costs and withdrawals. This goal is synonymous with the pursuit of time-weighted net return on the investments that equals or exceeds inflation (as measured by the Consumer Price Index), plus spending from the investments. To satisfy this return objective, the Associations utilize a multi-asset class diversified portfolio that relies on a total return strategy in which investment returns are achieved through both capital appreciation (realized and unrealized) and current yield (interest and dividends). The Associations are prepared to incur risks consistent with the pursuit of the return objective. Risk will be measured based on both an absolute and a relative basis. Absolute metrics relate to declines in the inflation-adjusted market value of the portfolio. On a relative basis, the portfolio will be measured against portfolios of similar size and composition.
NOTES TO CONSOLIDATED FINANCIAL STATEMENTS

The United States Naval Academy Alumni Association and Foundation
2012 ANNUAL REPORT 34
Note 13. Endowment Funds (Continued)
Endowment spending policy: The Associations operate a spending policy to regulate the use of proceeds from endowment investments. The policy provides for the spending of up to five percent of the 12-quarter moving average of the market value of pooled investment funds. The policy further states that when the average investment return of the most recent four quarters is negative, the spending rate will be reduced to four percent. The reduced spending rate of four percent was implemented during 2003 following an extended period of below-average investment performance and has continued through fiscal year 2012.
Changes in endowed net assets for the fiscal years ended June 30, 2012 and 2011, are as follows:
Year Ended June 30, 2012Temporarily Permanently
Unrestricted Restricted Restricted Total Endowment net assets, beginning of year $ (93,687) $ 21,406,090 $ 59,014,091 $ 80,326,494Interest and dividends – net of investment expense - 1,180,167 - 1,180,167Net appreciation (depreciation) 83,445 (714,764) (140,046) (771,365)Change in value - 6,738 5,114 11,852Contributions - - 514,814 514,814Amounts appropriated for expenditure - (2,532,058) - (2,532,058))Change in donor intent - (55,244) (283,374) (338,618)
Endowment net assets, end of year $ (10,242) $ 19,290,929 $ 59,110,599 $ 78,391,286
Year Ended June 30, 2011Temporarily Permanently
Unrestricted Restricted Restricted Total Endowment net assets, beginning of year $ (824,251) $ 12,258,746 $ 58,295,306 $ 69,729,801Interest and dividends – net of investment expense - 2,018,801 - 2,018,801Net appreciation 730,564 8,387,091 482,788 9,600,443Change in value - 6,747 126,083 132,830Contributions - - 524,303 524,303Amounts appropriated for expenditure - (1,162,018) - (1,162,018)Change in donor intent - (103,277) (414,389) (517,666)
Endowment net assets, end of year $ (93,687) $ 21,406,090 $ 59,014,091 $ 80,326,494
NOTES TO CONSOLIDATED FINANCIAL STATEMENTS

2012 ANNUAL REPORT 35
INDEPENDENT AUDITOR’S REPORT ON THE SUPPLEMENTARY INFORMATION
To the Board of TrusteesThe United States Naval Academy Alumni Association, Inc.
To the Board of DirectorsUnited States Naval Academy Foundation, Inc.Annapolis, Maryland
Our audits were conducted for the purpose of forming an opinion on the consolidated financial statements as a whole. Such information is presented for purposes of additional analysis rather than to present the financial position or results of activities of the individual entities and is not a required part of the consolidated financial statements. Such information is the responsibility of management and was derived from and relates directly to the underlying accounting and other records used to prepare the consolidated financial statements. The information has been subjected to the auditing procedures applied in the audits of the consolidated financial statements and certain additional procedures, including comparing and reconciling such information directly to the underlying accounting and other records used to prepare the consolidated financial statements or to the consolidated financial statements themselves, and other additional procedures in accordance with auditing standards generally accepted in the United States of America. In our opinion, the information is fairly stated, in all material respects, in relation to the consolidated financial statements as a whole.
Baltimore, MarylandOctober 12, 2012

The United States Naval Academy Alumni Association, Inc.
2012 ANNUAL REPORT 36
2012 2011AssetsCash and cash equivalents $ 1,399,556 $ 1,226,090Accounts receivable and other current assets 334,993 268,737Contributions receivable, net 1,225,234 1,239,109Investments 60,512,593 61,926,103Property and equipment, net 3,364,239 3,351,096Interest in third-party trusts 338,974 351,627Intercompany receivables 1,497,579 1,639,633 Total assets $ 68,673,168 $ 70,002,395
Liabilities And Net AssetsLiabilities
Accounts payable and accrued expenses $ 1,349,274 $ 1,315,555Deposits on life memberships 568,365 596,418Class savings accounts 2,497,440 2,591,093Deferred income and deposits 881,014 971,869Split-interest agreements 1,118,453 1,232,798Accrued key employees’ retirement 830,141 728,153Unamortized life memberships deferred revenue 14,604,238 14,188,831
Total liabilities 21,848,925 21,624,717
Net assetsUnrestricted 7,300,217 7,566,329Temporarily restricted 17,504,470 18,883,055Permanently restricted 22,019,556 21,928,294
Total net assets 46,824,243 48,377,678 Total liabilities and net assets $ 68,673,168 $ 70,002,395
STATEMENTS OF FINANCIAL POSITION June 30, 2012 and 2011

2012 ANNUAL REPORT 37
STATEMENT OF ACTIVITIES Year Ended June 30, 2012 Temporarily Permanently
Unrestricted Restricted Restricted TotalRevenue, gains, and other support: Contributions $ 512,335 $ 966,134 $ 56,860 $ 1,535,329 Membership dues 227,521 - - 227,521 Life member amortization 306,324 - - 306,324 Merchandise sales 35,317 - - 35,317 Net investment income 134,469 316,303 - 450,772 Publications and advertising 238,493 - - 238,493 House activities 189,002 - - 189,002 Intercompany support 1,503,587 - - 1,503,587 Career transition services 629,154 - - 629,154 Homecoming and conference fees 127,675 - - 127,675 Royalties 562,260 - - 562,260 Travel income 58,460 - - 58,460 Other 40,572 - - 40,572 Other support:
Change in value of split-interest agreements (42,797) (29,619) 37,489 (34,927)Changes in donors’ intent 58,520 6,300 (3,087) 61,733Equity loans to endowments 53 (53) - -
Net assets released from restrictions 2,637,650 (2,637,650) - -
Total revenue, gains and other support 7,218,595 (1,378,585) 91,262 5,931,272
Expenses: Support to the Naval Academy 1,891,579 - - 1,891,579 Audit and accounting 55,535 - - 55,535 Awards and gifts 16,243 - - 16,243 Bad debt expense 68,630 - - 68,630 Conferences 162,260 - - 162,260 Cost of goods 24,197 - - 24,197 Depreciation 205,882 - - 205,882 Equipment rental 258,412 - - 258,412 Insurance 94,044 - - 94,044 Legal fees 74,081 - - 74,081 Licenses 136,631 - - 136,631 Membership dues 3,998 - - 3,998 Miscellaneous 60,071 - - 60,071 Occupancy 175,109 - - 175,109 Postage and shipping 129,176 - - 129,176 Printing and publications 518,079 - - 518,079 Professional and contract services 883,144 - - 883,144 Salaries and benefits 2,780,733 - - 2,780,733 Shared information management (402,561) - - (402,561) Supplies 74,209 - - 74,209 Telephone 79,975 - - 79,975 Training 65,488 - - 65,488 Travel and transportation 129,792 - - 129,792 Total expenses 7,484,707 - - 7,484,707 Change in net assets (266,112) (1,378,585) 91,262 (1,553,435)Net assets at beginning of year 7,566,329 18,883,055 21,928,294 48,377,678Net assets at end of year $ 7,300,217 $ 17,504,470 $ 22,019,556 $ 46,824,243

The United States Naval Academy Foundation, Inc.
2012 ANNUAL REPORT 38
STATEMENTS OF FINANCIAL POSITION June 30, 2012 and 2011
2012 2011AssetsCash and cash equivalents $ 1,566,833 $ 1,576,572Accounts receivable and other current assets 221,755 92,713Contributions receivable, net 20,409,224 20,027,248Investments 102,945,085 104,661,457Property and equipment, net 3,232,388 3,167,950Interest in third-party trusts 2,723,199 2,863,245
Total assets $ 131,098,484 $132,389,185
Liabilities and Net AssetsLiabilities
Accounts payable and accrued expenses $ 288,845 $ 286,789Deferred income 4,529 7,148Notes payable - 1,000,000Split-interest agreements 5,925,049 6,151,165Intercompany payables 1,497,579 1,639,633
Total liabilities 7,716,002 9,084,735
Net assetsUnrestricted 8,038,177 9,088,773Temporarily restricted 78,253,262 77,129,880Permanently restricted 37,091,043 37,085,797
Total net assets 123,382,482 123,304,450 Total liabilities and net assets $ 131,098,484 $132,389,185

2012 ANNUAL REPORT 39
Temporarily Permanently Unrestricted Restricted Restricted Total
Revenue, gains, and other support: Contributions $ 7,536,089 $ 9,623,520 $ 457,954 $ 17,617,563 Fund administrative fee 1,140,958 - - 1,140,958 Net investment income (loss) 114,446 426,006 (140,046) 400,406 Intercompany support (1,503,587) - - (1,503,587) Other 116,834 - - 116,834Other support: Change in value of split-interest agreements (182,924) (362,469) (32,375) (577,768) Changes in donors’ intent (785,208) 1,003,762 (280,287) (61,733) Equity loans to endowments 83,392 (83,392) - - Net assets released from restrictions 9,484,045 (9,484,045) - - Total revenue, gains and other support 16,004,045 1,123,382 5,246 17,132,673
Expenses: Support to the Naval Academy 9,773,156 - - 9,773,156 Audit and accounting 67,876 - - 67,876 Awards and gifts 2,754 - - 2,754 Bad debt expense 1,079,190 - - 1,079,190 Conferences 81,530 - - 81,530 Consulting-Advantage 367,216 - - 367,216 Depreciation 194,908 - - 194,908 Donor cultivation 177,021 - - 177,021 Equipment rental 21,945 - - 21,945 Insurance 27,296 - - 27,296 Legal fees 39,345 - - 39,345 Membership dues 7,271 - - 7,271 Miscellaneous 152,666 - - 152,666 Occupancy 69,210 - - 69,210 Postage and shipping 63,479 - - 63,479 Printing and publications 91,495 - - 91,495 Professional and contract services 505,925 - - 505,925 Salaries and benefits 3,712,970 - - 3,712,970 Shared information management 402,561 - - 402,561 Supplies 24,670 - - 24,670 Training 22,254 - - 22,254 Travel and transportation 169,903 - - 169,903 Total expenses 17,054,641 - - 17,054,641 Change in net assets (1,050,596) 1,123,382 5,246 78,032Net Assests Beginning 9,088,773 77,129,880 37,085,797 123,304,450 Ending $ 8,038,177 $ 78,253,262 $ 37,091,043 $ 123,382,482
STATEMENT OF ACTIVITIES Year Ended June 30, 2012

The United States Naval Academy Alumni Association and Foundation
2012 ANNUAL REPORT 40
UNITED STATES NAVAL ACADEMY FOUNDATION, INC. (AS OF 30 JUNE 2012)
BOARD OF DIRECTORS
Vice Admiral John R. Ryan ’67, USN (Ret.)*, ChairmanMr. Daniel F. Akerson ’70Dr. Richard C. Atkinson Mr. Robert C. Bellas Jr. ’66Mr. Philip M. Bilden Mr. Michael R. Bonsignore ’63Mr. Thomas C. Brasco ’75 Mr. Peter F. de Vos ’71The Honorable Louis J. FreehGeneral Carlton W. Fulford Jr. ’66, USMC (Ret.)Mr. Charles S. Garber Jr. ’65*Ms. Linda R. GoodenMr. Eric P. Grubman ’80Colonel Walter P. Havenstein ’71, USMCR (Ret.)The Honorable Jon M. Huntsman Jr.Rear Admiral Thomas C. Lynch ’64, USN (Ret.)*Mr. Byron F. Marchant ’78*Mr. Corbin A. McNeill Jr. ’62Admiral Richard W. Mies ’67, USN (Ret.)*Mr. Jerrold L. Miller ’77Admiral Robert J. Natter ’67, USN (Ret.)*Mr. C. Michael Petters ’82
Mr. Paul B. Prager ’80Admiral Joseph W. Prueher ’64, USN (Ret.)*Mr. Thomas C. Schievelbein ’75Mr. Kevin W. Sharer ’70Mr. Roger T. Staubach ’65*Mr. Timothy P. Sullivan ’80Mr. Roger E. Tetrault ’63Commander Maurice B. Tose ’78, USNR (Ret.)*The Honorable Deborah Wince-Smith
Chairmen Emeritus
Admiral James L. Holloway III ’43, USN (Ret.)*Admiral Charles R. Larson ’58, USN (Ret.)*
Emeritus Members
Major General William A. Anders ’55, USAFR (Ret.)*Mr. James W. Kinnear III ’50 Captain James A. Lovell Jr. ’52, USN (Ret.)Mr. J. Willard Marriott Jr.Mr. John E. Nolan ’50Mr. Christian H. Poindexter ’60*The Honorable John E. Sheehan ’52*
*Indicates Trustee, Athletic & Scholarship Programs
THE UNITED STATES NAVAL ACADEMY ALUMNI ASSOCIATION, INC. (AS OF 30 JUNE 2012)
BOARD OF TRUSTEES
Admiral Robert Natter ’67, USN (Ret.), ChairmanLieutenant General Jack W. Klimp ’68, USMC (Ret.),
Vice ChairmanCaptain James Adkins ’58, USN (Ret.)Captain Heidi Berg ’91, USN Mr. Ples J. Bruce Jr. ’77 Christopher S. Cooke ’81, Esq. Captain Victor Delano ’41, USN (Ret) Commander Matthew P. Elias ’78, USN (Ret.) Captain Royce A. Engler ’73, USNR (Ret.) Captain Gerard M. Farrell ’70, USN (Ret.) Mr. Herbert D. Frerichs Jr. ’80Mr. Ingar A. Grev ’89 Mr. Warren G. Hahn ’60Commander Brian J. Horais ’71, USNR (Ret.)
Mr. Byron F. Marchant ’78 Mr. Joseph L. Moreno ’93 Mr. Michael Mowins ’79Vice Admiral Henry Mustin ’55, USN (Ret.)Mr. Gregg Nivala ’80Lieutenant Commander Richard R. Pace ’63, USNR (Ret.) Colonel Henry W. Papa ’60, USAFR (Ret.)Lieutenant Colonel Alex Plechash ’75, USMC (Ret.)Mrs. Veronica Rogers ’87Rear Admiral Jerome F. Smith Jr. ’61, USN (Ret.) Mrs. Jennifer S. Stillings ’96Mr. Jeffrey Webb ’95Lieutenant Commander Joshua W. Welle ’02, USN Captain Glen Woods ’78, USN (Ret.)
The United States Naval Academy Alumni Association and Foundation

Mission of the United States Naval Academy Foundation
To support, promote and advance the mission of the Naval Academy by working in conjunction with Academy leadership to identify strategic institutional priorities and by raising, managing and disbursing private gift funds that provide a margin of excellence in support of the nation’s premier leadership institution.
Mission of The United States Naval Academy Alumni Association
To serve and support the United States, the Naval Service, the Naval Academy, and its Alumni:
By furthering the highest standards at the Naval Academy;By seeking out, informing, encouraging and assisting outstanding, qualified
young men and women to pursue careers as officers in the Navy and Marine Corps through the Naval Academy; and
By initiating and sponsoring activities which will perpetuate the history, traditions, memories and growth of the Naval Academy and bind Alumni together in support of the highest ideals of command, citizenship and government.

www.usna.com 410.295.4100247 King George Street , Annapol is, MD 21402