2012 bond & mill levy planning - denver public...
TRANSCRIPT
Denver Public Schools
2012 Bond & Mill Levy Planning
Overview of Prior Mill Levy Investments
March 2012

Table of Contents
� Review of Mill Levy Override (MLO) Policy & History
� Summary of 1998 and 2003 MLO investments
� 2003 MLO Investment Details
� 2005 ProComp Investment Overview
- 2 -

- 3 -
Overview of Mill Levy Override
� Policy & History� Summary of MLO investments
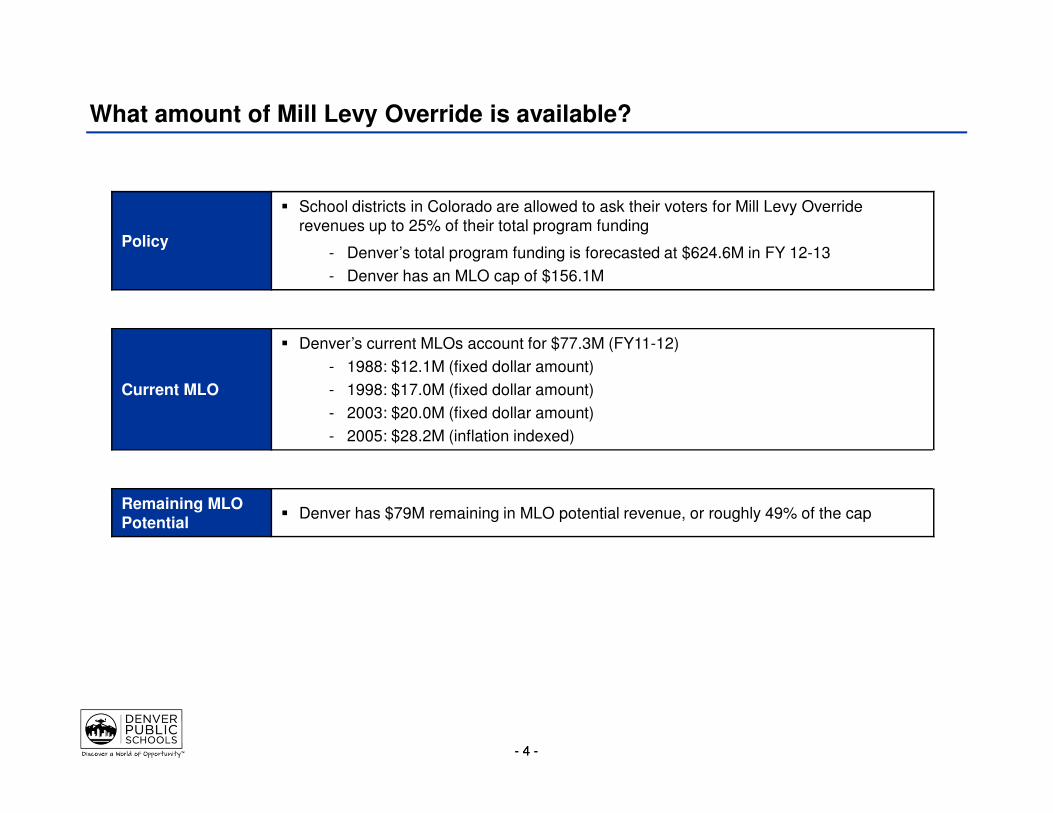
What amount of Mill Levy Override is available?
- 4 -- 4 -
Policy
� School districts in Colorado are allowed to ask their voters for Mill Levy Override revenues up to 25% of their total program funding
- Denver’s total program funding is forecasted at $624.6M in FY 12-13
- Denver has an MLO cap of $156.1M
Current MLO
� Denver’s current MLOs account for $77.3M (FY11-12)
- 1988: $12.1M (fixed dollar amount)
- 1998: $17.0M (fixed dollar amount)
- 2003: $20.0M (fixed dollar amount)
- 2005: $28.2M (inflation indexed)
Remaining MLO Potential
� Denver has $79M remaining in MLO potential revenue, or roughly 49% of the cap
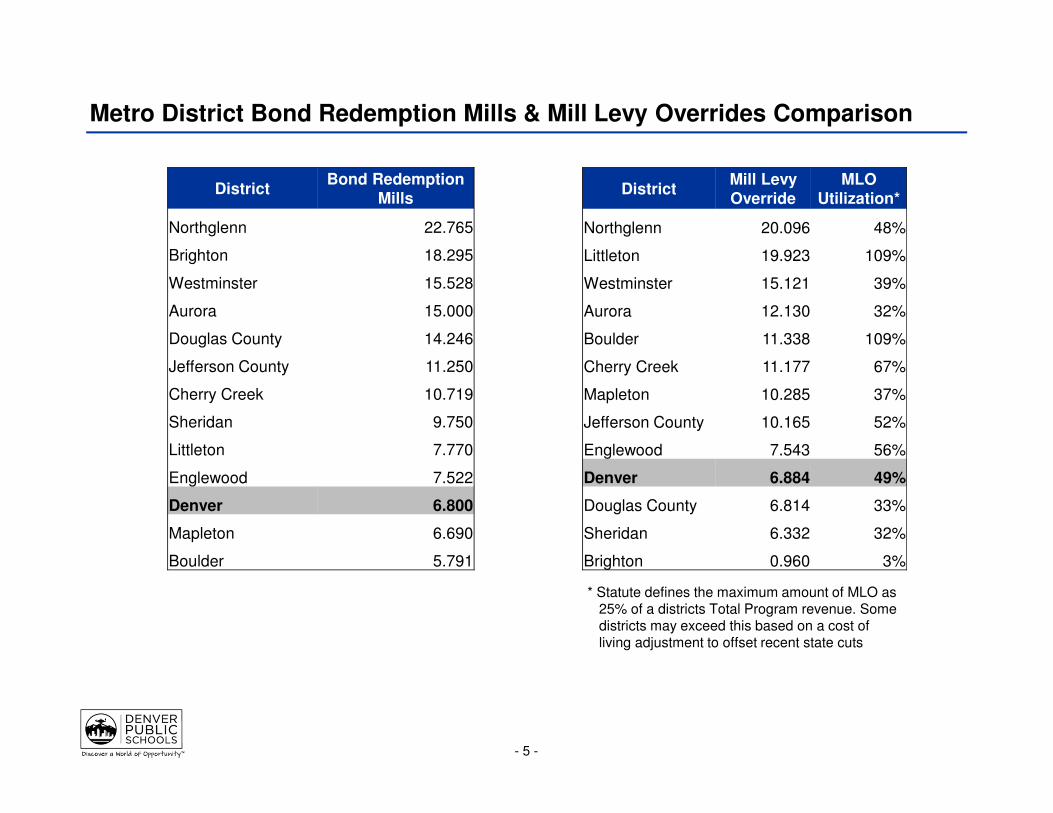
Metro District Bond Redemption Mills & Mill Levy Overrides Comparison
- 5 -
DistrictBond Redemption
Mills
Northglenn 22.765
Brighton 18.295
Westminster 15.528
Aurora 15.000
Douglas County 14.246
Jefferson County 11.250
Cherry Creek 10.719
Sheridan 9.750
Littleton 7.770
Englewood 7.522
Denver 6.800
Mapleton 6.690
Boulder 5.791
DistrictMill Levy Override
MLO Utilization*
Northglenn 20.096 48%
Littleton 19.923 109%
Westminster 15.121 39%
Aurora 12.130 32%
Boulder 11.338 109%
Cherry Creek 11.177 67%
Mapleton 10.285 37%
Jefferson County 10.165 52%
Englewood 7.543 56%
Denver 6.884 49%
Douglas County 6.814 33%
Sheridan 6.332 32%
Brighton 0.960 3%
* Statute defines the maximum amount of MLO as 25% of a districts Total Program revenue. Some districts may exceed this based on a cost of living adjustment to offset recent state cuts

$14,000,000
$16,000,000
$18,000,000
$20,000,000
$22,000,000
$24,000,000
$26,000,000
'09 '10 '11 '12 '13 '14 '15 '16 '17
2003 Mill Levy Override: $20M revenue
- 6 -- 6 -
� The 2003 MLO provides $20M annual revenue.
� Purchasing power is continually eroded due to both inflation and enrollment increases.
� Based on the latest budget projections, annual expenses will exceed revenues beginning in 2012, creating an operating deficit until current reserves are exhausted.
� Once reserves are exhausted, costs must be cut or subsidized from other revenue sources.
‘17 ‘18 ‘19
Fund Balance
Operating Surplus/Deficit
Operating Profit / Fund Reserve Balance
Operating Costs
Revenue
Key Observations
Revenue and Annual Operating Costs(Based on Actual Expenses)
Increasing operating costs against flat revenue will deplete our reserves and force continued student cuts
-$5,000,000
$0
$5,000,000
$10,000,000
$15,000,000
$20,000,000
$25,000,000
'09 '10 '11 '12 '13 '14 '15 '16 '17

- 7 -
Review of 2003 Mill Levy Investments

Overview of Mill Levy Investments
- 8 -
To provide background on key mill levy investments, three areas will be detailed:
Funding Overview:� 2009, 2010, 2011 actuals� 2012 budget� MLO funds vs. overall funds� Detailed FY11 actuals broken
out by funding source
Funding Purchases:Will be tailored to each investment� Categorized by expense type� Visibility may include:
� # schools� # subjects� # students impacted
Investment Outcomes:Will be tailored to each investment� Impact on test scores� Impact on graduation rates� Impact on SPF� Impact on facilities

Summary of Investments from the 2003 MLO
- 9 -
The 2003 MLO provide a fixed revenue source that has been allocated to the following projects:
SHALL DENVER PUBLIC SCHOOLS (SCHOOL DISTRICT NO. 1) TAXES BE INCREASED $20 MILLION ANNUALLY IN THE CURRENT BUDGET YEAR AND EACH BUDGET YEAR THEREAFTER TO· PROVIDE ART/MUSIC TEACHERS IN ALL
ELEMENTARY SCHOOLS
· PURCHASE NEW TEXTBOOKS
· INCREASE FUNDING FOR REPAIRS AND
MAINTENANCE
· EXPAND ALL DAY KINDERGARTEN AND EARLY
CHILDHOOD EDUCATION CLASSES
· IMPROVE HIGH SCHOOL GRADUATION RATES
· IMPROVE ACADEMIC ACHIEVEMENT IN UNDER-
PERFORMING SCHOOLS
BY AN ADDITIONAL PROPERTY TAX LEVY AT A RATE SUFFICIENT TO PRODUCE THE AMOUNTSPECIFIED ABOVE IN EACH SUCH YEAR, WHICH TAXES SHALL BE DEPOSITED INTO THEGENERAL FUND OF THE DISTRICT AND SHALL BE IN ADDITION TO THE PROPERTY TAXES THATOTHERWISE WOULD BE LEVIED FOR THE GENERAL FUND?
Ballot Language FY12 Budget Mill Levy Expenses
Project FY12 Budget
Arts & Music in Elem & K-8 $8,383,646
Textbooks $3,240,676
ECE & Full-Day Kinder $3,141,041
Improving Graduation Rates $2,721,225
Capital Improvements / Maint. $1,937,408
Approved SIG Grants $1,497,946
Improving Student Achievement $1,130,706
New School Start-up Grants $1,036,230
Other Projects $49,523
Total $23,138,041

Summary of Investments from the 2003 MLO
- 10 -
The following slides will review select investments from the 2003 MLO. Please note that deeper levels of
analysis for Arts & Music as well as ECE will be provided in the 2012 mill levy proposals.
Project FY12 Budget
Arts & Music in Elem & K-8 $8,383,646
Textbooks $3,240,676
ECE & Full-Day Kinder $3,141,041
Improving Graduation Rates $2,721,225
Capital Improvements / Maint. $1,937,408
Approved SIG Grants $1,497,946
Improving Student Achievement $1,130,706
New School Start-up Grants $1,036,230
Other Projects $49,523
Total $23,138,041

$2,835,744, 30%
$2,695,483, 29%
$969,340, 10%
$1,143,751, 12%
$352,461, 4%
$1,404,895, 15%
Overview of Funding for Textbooks
- 11 -
There are five primary sources of funding for textbooks in the FY11-12 budget
The Mill Levy Textbook funds district-wide purchases of adopted materials for student use
Historic Spending
2003 MLO
Title I / II
1998 MLO
General Fund
Grants Other Sources
FY11 Funding Sources
Period2003 MLO
FundsGeneral Funds
Mill %
FY09Actual
$1,192,513 $7,522,700 16%
FY10Actual
$4,289,372 $11,313,547 38%
FY11Actual
$2,835,744 $9,401,674 30%
FY12Budget
$4,289,372 $9,032,900 47%

Funding Uses and Benefits
35%
3%9%20%
14%
1%
1%
17%
Social Studies
ESL
MS Literacy
Springboard(Pre-AP)
World Language
CMP
FinancialLiteracy
Other topics, incl. library
The textbook purchases made using MLO funds change each year based on needs. In 2011, the $2.8M of funding were spent across a variety of subjects in each grade level
Class Purchases Benefits
� Ensures student access to district adopted materials
� Replenishes consumable resources as determined by adoption
� Supplies new schools with materials appropriate to their level and courses/contents taught
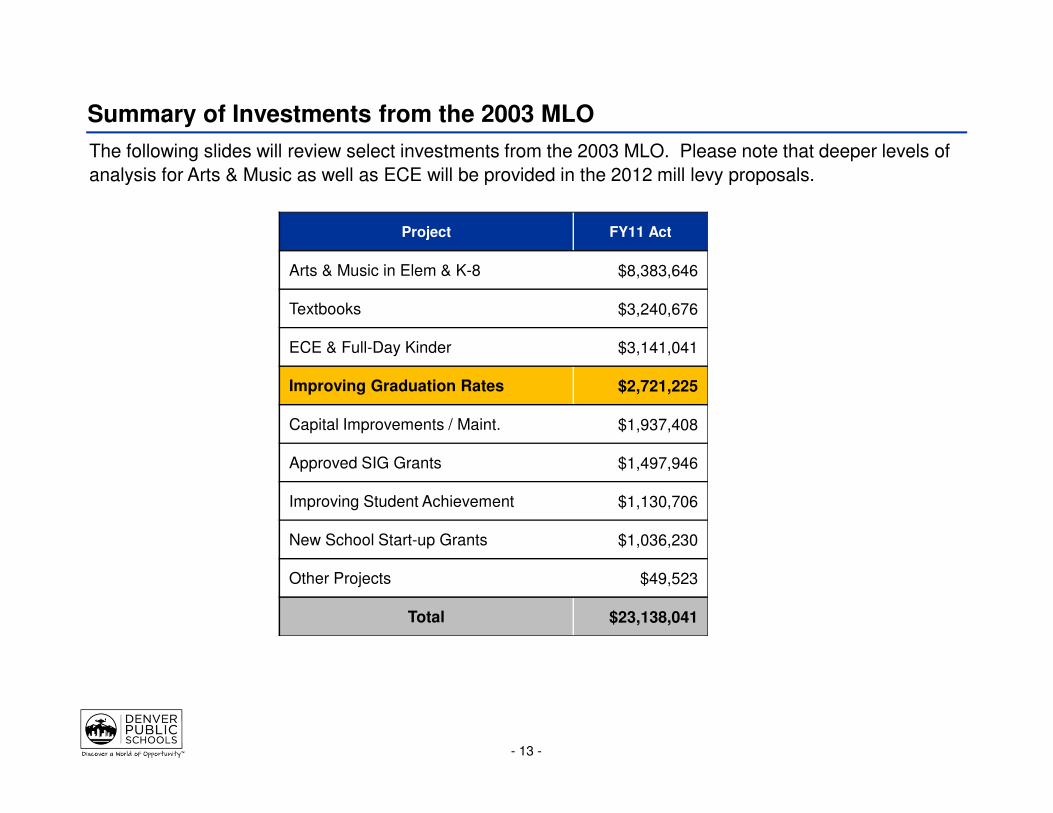
Summary of Investments from the 2003 MLO
- 13 -
Project FY11 Act
Arts & Music in Elem & K-8 $8,383,646
Textbooks $3,240,676
ECE & Full-Day Kinder $3,141,041
Improving Graduation Rates $2,721,225
Capital Improvements / Maint. $1,937,408
Approved SIG Grants $1,497,946
Improving Student Achievement $1,130,706
New School Start-up Grants $1,036,230
Other Projects $49,523
Total $23,138,041
The following slides will review select investments from the 2003 MLO. Please note that deeper levels of
analysis for Arts & Music as well as ECE will be provided in the 2012 mill levy proposals.

Overview of Funding for Improving Graduation Rates
There are five primary uses of funding for improving graduation from the 2003 MLO
Historic Spending Project Funding Breakdown
Period2003 MLO
Funds
FY09 Actual $1,341,325
FY10 Actual $1,835,265
FY11 Actual $2,064,916
FY12 Budget $2,721,225
100%
2003 MLO
- 14 -
26%
19%
3%
33%
19% Assessment Program
Post Secondary Education Options
CreditRecovery
SchoolProf. Dev.
College Readiness
Instructional Support

870954
1,061 1,071 1,175
1,462 1,504
0
200
400
600
800
1,000
1,200
1,400
1,600
2004-05 2005-06 2006-07 2007-08 2008-09 2009-10 2010-11
Graduation Rates Projects: College Readiness
- 15 -
Description� Provides counseling services and programs directly in schools that prepare students for college� Includes paying for 0.5 counselors in several high schools� Also pays for mentoring curriculum used in some high schools with mentoring programs
Benefits� Prepares under-represented students for college readiness by giving them access to advanced
classes with support
2011 Highlights� College Readiness Director coordinates efforts to improve AP, IB, and Concurrent Enrollment
Efforts across the district
Students Achieving Qualifying AP Scores

Graduation Rates Projects: Post-Secondary Education Options
- 16 -
Description� Leverages Colorado’s ASCENT program to provide increased concurrent enrollment
opportunities for students to earn college credit while enrolled in HS
Benefits� Prepares more students to be ready for college� Decreases college remediation� Opens college access to underserved students, increasing their drive to graduate
2011 Highlights � Concurrent enrollment has tripled over the past three years
576684
1,572
0
200
400
600
800
1,000
1,200
1,400
1,600
1,800
2008 2009 2010
Students Concurrently Enrolled in College Courses

Graduation Rates Projects: Credit Recovery
- 17 -
Description� Targeted to assist students that have failed classes recover those credits� Allows students to work at their own pace through study halls, after school programming, web-
based instruction, and Saturday school
Benefits
� Prevents failures through avenues of extra assistance� Prevents dropouts by engaging students� Recovers dropouts through Engagement Centers, which have expanded operating hours to
increase convenience
2011 Highlights
� Program has been expanded throughout the district; All HS have Credit Recovery tutoring� Adding new 6-12 grade schools Vista Academy and Denver Center for 21st Century (DC21)
Learning to increase options for students who need additional support towards graduation.
600
2,600 2,673
4,156
0
500
1,000
1,500
2,000
2,500
3,000
3,500
4,000
4,500
2008 2009 2010 2011
Students Concurrently Enrolled in College Courses

Summary of Investments from the 2003 MLO
- 18 -
Project FY11 Act
Arts & Music in Elem & K-8 $8,383,646
Textbooks $3,240,676
ECE & Full-Day Kinder $3,141,041
Improving Graduation Rates $2,721,225
Capital Improvements / Maint. $1,937,408
Approved SIG Grants $1,497,946
Improving Student Achievement $1,130,706
New School Start-up Grants $1,036,230
Other Projects $49,523
Total $23,138,041
The following slides will review select investments from the 2003 MLO. Please note that deeper levels of
analysis for Arts & Music as well as ECE will be provided in the 2012 mill levy proposals.

2012 SIG Approval Process
- 19 -
School Principals� Principals lead in preparing applications for SIG� Proposals involve school leadership team � Proposal process may involve CSCs, Parents’ Groups, and Student Groups
Asst. & Instructional Superintendents
� Facilitate internal application review process� Instructional Superintendents’ and CAO team reviews applications (minimum 2 reviewers for
each application)� Evaluation completed for each application (see ML School Improvement Grant Application
Evaluation Template)
Bond & Mill Levy Oversight Committee
� 3-member sub-group of the overall BMLOC – will serve on a SIG review committee and provide input on preliminary recommendations, in advance of final recommendations to the Superintendent.
Superintendent� Final decision on SIG recipients will be announced in February, 2012to accommodate
planning for 2012-2013 school year
Board of Education � Receive final information on recipients of SIGs following decision of the Superintendent

2011 – 2012 SIG Projects
School Project DescriptionTotal
AwardedStart Year
End YearAverage Median
Growth 2011
BarrettElementary
Professional development in writing, strengthen home/school connections and before and after school enrichment
$110,850 2011-12 2011-12 41
Fairview Elementary
Year 2 implementation of the Comprehensive Literacy Model $150,000 2011-12 2013-14 36
HallettElementary
Increase reading proficiency through small group instruction, professional development, books/materials, parent education programs
$122,355 2011-12 2013-14 60
Smith Elementary
Character education integrated into writing curriculum, Improve student discipline through PD for teachers and implementation of “Why Try” program for students
$128,222 2011-12 2013-14 26
Valdez School
Align assessment system with the new P-12 academic standards. Align curricular resources and instructional strategies to meet the school's targeted learning objectives
$145,8342011-12 2013-14 63
Greenwood K-8
Implement intensive vocabulary and oral language intervention through “Each One, Teach One” program
$149,040 2011-12 2013-14 55
Place Bridge K-8
Expands sheltered and differentiated instruction. Add consistency and frequency of progress monitoring for reading, writing and math, increase targeted small group instruction.
$44,000 2011-12 2011-12 54
- 20 -

SPF of Existing SIG Projects
School Project DescriptionTotal
AwardStartYear
End Year
‘09 SPF Growth
‘10 SPF Growth
’11 SPFGrowth
Cory Elementary
Promote Cory/MerrillCommunity Campus
$120,943 2009-10 11-12 Meets Exceeds Exceeds
Sabin Elementary School
Expand feeder program focused on IBimplementation (PYP, MYP and IB Diploma)
$403,300 2007-08 11-12 Approaching Meets Meets
SchenckElementarySchool
Literacy Squared Interventionpilot in partnership with UCD Bueno Center
$421,937 2010 2013 Approaching ApproachingDoes not
meet
Valdez ElementarySchool
Implement Dual Language & Montessori Program
$177,140 2007-08 11-12Does not
meetApproaching Meets
ValverdeElementary School
Literacy Squared Intervention Pilot with UCD Bueno Center
$120,000 2010 2012 Meets MeetsDoes not
meet
Bryant Webster K-8
Expand Dual Language program in grades 5-8
$120,000 2010 2013 Meets Meets Meets
Fairmont E-8Implement Dual Language Program
$420,000 2006-07 11-12 Approaching Meets Approaching
Bill RobertsE-8
Service Learning $164,536 2008-09 11-12 Approaching Exceeds Meets
- 21 -

SPF of Existing SIG Projects
School Project DescriptionTotal
AwardStartYear
End Year
‘09 SPF Growth
‘10 SPF Growth
‘11 SPF Growth
Henry Middle School
Expand feeder program focused on IB implementation (PYP, MYP and IB Diploma)
$331,500 2007-08 2011-12 ApproachingDoes not
meetDoes not
meet
Lake Middle School
Implement IB Program $458,300 2010 2012Does not
meetApproaching Meets
Skinner Middle School
Bolster key elements of academic program; core academics inc.honors, interventions and exploratory classes; marketing support
$479,432 2010 2013 ApproachingDoes Not
MeetMeets
Merrill MiddleSchool
Promote Merrill/Cory Community Campus
$144,943 2009-10 2013 Meets Meets Meets
Abraham Lincoln High School
Focus on feeder pattern development, dual language and instructional support for English Language Learners
$936,798 2010-11 12-13 Meets Approaching Approaching
Bruce Randolph 6-12
Build 6-12 school $369,162 2008 2011 Meets Meets Approaching
John F Kennedy High School
Expand feeder program focused on IB implementation (PYP, MYP and IB Diploma)
$473,180 2007-08 11-12 Meets Meets Meets
North HighSchool
Increase opportunities in World Arts and World Language to improve the overall educational program
$175,960 2007-08 11-12Does not
meetApproaching Approaching
Thomas Jefferson HS
Expand concurrent enrollment $233,000 2010-11 11-12 Approaching Approaching Meets
- 22 -

599
573 565
611
565
667
703
400
450
500
550
600
650
700
750
2006 2007 2008 2009 2010 2011 2012
Student Outcomes: Results of SIG: Sabin World School
- 23 -
Enrollment 2006 - 2012
Year SPF % Growth %
2008 21 10
2009 47 45
2010 73 79
2011 67 66
2010 2011
Reading 52 52
Writing 64 45
Math 58 63
School Performance Framework (SPF)
Median Growth
� Implementation of the Intl. Baccalaureate Primary Years Program
� Created IB feeder system in SW - Sabin World Elementary, Henry World Middle and Kennedy HS marketing and forming of a solid IB.
� IB consultant to assist in writing our Program of Inquiry; have all six planners written at authorization visit vs. normal three planners
� Purchased and implemented a supplemental writing program, Writing Alive, and provided professional development for teachers
� Increased student enrollment by over 100 students in the last several years, mostly neighborhood children returning to DPS
Key SIG Activities

Student Outcomes: Results of SIG: Hill Campus of Arts & Sciences
- 24 -
565
611
573599
667
Year SPF % Growth %
2008 57 59
2009 63 68
2010 57 59
2011 55 54
2010 2011
Reading 55 56
Writing 59 62
Math 56 58
School Performance Framework (SPF)
Median Growth
� Successful implementation of the new arts and sciences program
� Increased academic performance in achievement and growth
� Improved the climate and culture for teachers and students
� Increased student enrollment, which had been capped prior 2 years
� Received $25,000 grant from the Partnership of Great Schools in December due to the many positive changes at the school
Key SIG Activities
585
651
747
841826
875 875
400
450
500
550
600
650
700
750
800
850
900
2006 2007 2008 2009 2010 2011 2012
Enrollment 2006 - 2012
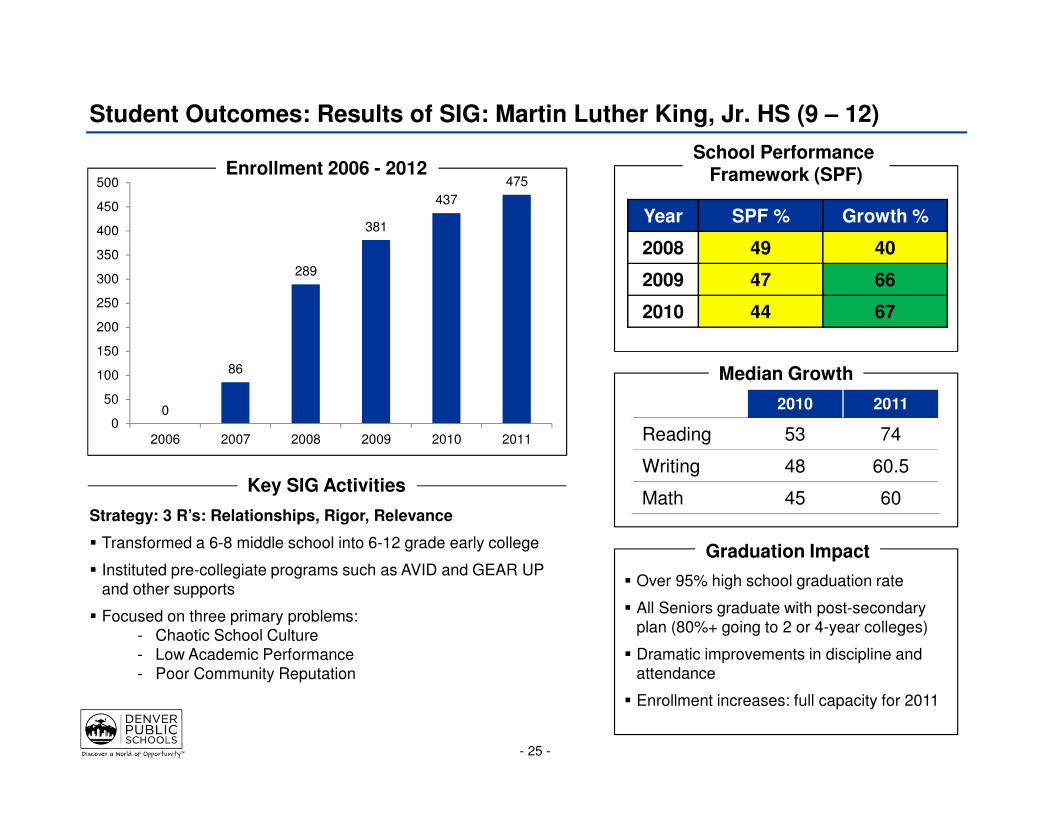
Student Outcomes: Results of SIG: Martin Luther King, Jr. HS (9 – 12)
- 25 -
565
611
573599
667
Year SPF % Growth %
2008 49 40
2009 47 66
2010 44 67
2010 2011
Reading 53 74
Writing 48 60.5
Math 45 60
School Performance Framework (SPF)
Median Growth
Strategy: 3 R’s: Relationships, Rigor, Relevance
� Transformed a 6-8 middle school into 6-12 grade early college
� Instituted pre-collegiate programs such as AVID and GEAR UP and other supports
� Focused on three primary problems:- Chaotic School Culture - Low Academic Performance- Poor Community Reputation
Key SIG Activities
Graduation Impact
� Over 95% high school graduation rate
� All Seniors graduate with post-secondary plan (80%+ going to 2 or 4-year colleges)
� Dramatic improvements in discipline and attendance
� Enrollment increases: full capacity for 2011
0
86
289
381
437
475
0
50
100
150
200
250
300
350
400
450
500
2006 2007 2008 2009 2010 2011
Enrollment 2006 - 2012

- 26 -
Review of 2005 ProComp

2005 ProComp Overview and Ballot Language
- 27 -
SHALL DENVER PUBLIC SCHOOLS (SCHOOL DISTRICT NO. 1) TAXES BE INCREASED $25 MILLION PER YEAR, ADJUSTED FOR INFLATION, SOLELY AND EXCLUSIVELY TO FUND THE PROFESSIONAL COMPENSATION SYSTEM FOR TEACHERS (PROCOMP), WHICH TAX SHALL TERMINATE IF PROCOMP TERMINATES, INCLUDING COMPENSATION TO TEACHERS FOR � TEACHING IN HARD TO STAFF SCHOOLS � TEACHING IN HARD TO FILL POSITIONS SUCH AS MATH, SCIENCE AND SPECIAL EDUCATION � INCREASING TEACHING KNOWLEDGE AND TEACHING SKILLS BY SUCCESSFULLY COMPLETING PROCOMP
APPROVED ADVANCED DEGREES, PROFESSIONAL TEACHING STANDARDS LICENSES AND ADDITIONAL TRAINING TO IMPROVE CLASSROOM SKILLS
� POSITIVE EVALUATIONS OF TEACHING PERFORMANCE � MEETING OR EXCEEDING OBJECTIVES FOR STUDENT LEARNING � ACHIEVING DISTINGUISHED SCHOOL STATUS
BY AN ADDITIONAL PROPERTY TAX LEVY THAT RESULTS IN THE DOLLAR AMOUNT OF REVENUES SET FORTH ABOVE IN THE CURRENT BUDGET YEAR AND THE SAME DOLLAR AMOUNT, ADJUSTED ANNUALLY IN EACH BUDGET YEAR THEREAFTER FOR INFLATION AS MEASURED BY THE DENVER-BOULDER-GREELEY CONSUMER PRICE INDEX, WHICH REVENUES SHALL BE USED SOLELY AND EXCLUSIVELY FOR, AND NONE OF WHICH WILL BE SPENT FOR ANY PURPOSE OTHER THAN, FUNDING PROCOMP?
Purpose
Ballot Language
� ProComp is designed to attract and retain highly effective teachers for DPS
� ProComp is the result of a productive collaboration between DCTA and DPS
� ProComp is intended to improve instructional practices and achieve professional growth for teachers through increased motivation by rewarding teachers with salary and bonus incentives awarded around several qualification elements

ProComp Participation and Average Payout
- 28 -
$2,898
$6,949 $7,133 $7,143
$-
$1,000
$2,000
$3,000
$4,000
$5,000
$6,000
$7,000
$8,000
2008 2009 2010 2011
Average ProComp Payout per Teacher
� ProComp was renegotiated in 2008 for 2009 payouts, which introduced and expanded several elements. This drastically increased the participation in ProComp as well as significantly increasing the average payout per participant
� DCTA Teachers who were employed by the district prior to 2006 are given the option of joining, while new employees are automatically enrolled in ProComp
� ProComp enrollment is currently at 81%. Please see the enrollment growth chart on slide 30 for more detals
Key Observations
Source: DPS ProComp
$6,753,016
$21,841,985
$28,640,724
$31,295,140
$0
$5,000,000
$10,000,000
$15,000,000
$20,000,000
$25,000,000
$30,000,000
$35,000,000
2008 2009 2010 2011
Total ProComp Payout

How is the funding allocated?
- 29 -
Component Element 2010-11 Amount
Knowledge and Skills
Professional Development Unit (PDU) $751
Advanced Degree / License $3,379
Tuition Reimbursement$1,000 year /
$4,000 lifetime max
ComprehensiveProfessional Evaluation
Probationary $376 once/year
Non-probationary $1,126 once/ 3 years
Market IncentivesHard to Serve Schools $2,403
Hard to Staff Assignments $2,403
Student Growth
Student Growth Objectives (SGO) $376
Exceeds CSAP Expectations $2,403
Top Performing Schools $2,403
High Growth School $2,403

ProComp Outcomes
- 30 -
17%
15%
18%
15%
13%
0%
2%
4%
6%
8%
10%
12%
14%
16%
18%
20%
2005 2006 2007 2008 2009
Teacher Attrition Rates
30%
45%
52%
68%74% 76%
81%
0%
10%
20%
30%
40%
50%
60%
70%
80%
90%
2006 2007 2008 2009 2010 2011 2012
ProComp Participation Rate