2012 first quarter earnings review - ford first quarter earnings review april 27, 2012 (preliminary...
TRANSCRIPT

2012 FIRST QUARTER EARNINGS REVIEW
APRIL 27, 2012 (PRELIMINARY RESULTS)
SLIDE 1
BUSINESS OVERVIEW
Alan Mulally President and Chief Executive Officer

SLIDE 2
TOTAL COMPANY AGENDA
• Business Overview of Financial Results and Highlights
• Details of Financial Results
• Our Plan -- and Outlook

SLIDE 3
2012 FIRST QUARTER SUMMARY
Strong Start To The Year Led By North America. On Track To Deliver 2012 Financial Guidance And Mid-Decade Outlook
• Eleventh consecutive quarterly pre-tax operating profit; positive Automotive operating-related cash flow
• First Quarter wholesale volume and revenue slightly lower than a year ago
• Highest operating profit in North America since at least 2000 and continued strong performance at Ford Credit; profitable in South America but losses in Europe and Asia Pacific Africa
• Reconfirming Total Company Full Year pre-tax operating profit to be about equal to 2011, driven by strong North America performance
• Announcing new actions to de-risk our pension obligations
• Continuing to invest for future growth and a stronger product lineup around the world; remain on track to achieve the mid-decade outlook

SLIDE 4
TOTAL COMPANY 2012 KEY FINANCIAL SUMMARY
B / (W)2012 2011
Wholesales (000) 1,358 (45) Revenue (Bils.) 32.4$ (0.7)$
Operating results*Pre-tax results (Mils.) 2,293$ (544)$ After-tax results (Mils.)** 1,578 (402) Earnings per share** 0.39 (0.08)
Special items pre-tax (Mils.) (255)$ (194)$
Net income / (loss) attributable to FordAfter-tax results (Mils.) 1,396$ (1,155)$ Earnings per share 0.35 (0.26)
AutomotiveOperating-related cash flow (Bils.)*** 0.9$ (1.3)$
Gross cash (Bils.)*** 23.0$ 1.7$ Debt (Bils.) (13.7) 2.9
Net cash (Bils.)*** 9.3$ 4.6$
* Excludes special items; see Appendix for detail and reconciliation to GAAP ** 2011 results for first three quarters reflect a more normalized operating tax rate, as though the
valuation allowance release in the Fourth Quarter 2011 had not been in place throughout the year*** See Appendix for reconciliation to GAAP; net cash is calculated as Automotive gross cash net of
Automotive debt
First Quarter

SLIDE 5
TOTAL COMPANY 2012 FIRST QUARTER HIGHLIGHTS • Introduced new EcoSport, Fusion, B-MAX, Fiesta ST, Kuga, as well as
Lincoln MKZ Concept and Tourneo Custom Concept
• Opened CFMA Chongqing Assembly, increasing Ford’s passenger car capacity in China by one third to 600,000 units
• Delivered 4 millionth SYNC system in the U.S. and announced SYNC in Europe beginning with new Ford B-MAX
• Paid first quarterly dividend since 2006 and declared a Second Quarter dividend
• Completed amendment and extension of revolving credit facility with a total of $9 billion committed to November 2015

SLIDE 6
FINANCIAL RESULTS
Bob Shanks Chief Financial Officer

SLIDE 7
TOTAL COMPANY 2012 FIRST QUARTER FINANCIAL RESULTS
First QuarterB / (W)
2012 2011(Mils.) (Mils.)
Pre-tax results (excl. special items) 2,293$ (544)$ Special items* (255) (194)
Pre-tax results (incl. special items) 2,038$ (738)$ (Provision for) / Benefit from income taxes (640) (420)
Net income / (Loss) 1,398$ (1,158)$ Less: Income / (Loss) attributable to non-controlling interests 2 (3)
Net income / (Loss) attributable to Ford 1,396$ (1,155)$
* See Appendix for details of special items

SLIDE 8
TOTAL COMPANY 2012 FIRST QUARTER PRE-TAX RESULTS BY SECTOR*
* Excludes special items; see Appendix for detail and reconciliation to GAAP
Memo: B / (W) 2011 1Q $ (544) $ (294) $(250) B / (W) 2011 4Q 1,189 1,251 (62)
Financial Services
Automotive
Millions
Total
$2,293
$1,837
$456
Ford Credit $452 Other 4

SLIDE 9
AUTOMOTIVE SECTOR -- TOTAL AUTOMOTIVE 2012 FIRST QUARTER KEY METRICS COMPARED WITH 2011*
* Excludes special items; see Appendix for detail and reconciliation to GAAP and definition of wholesales ** Automotive operating margin defined as Automotive pre-tax results, excluding special items and Other Automotive, divided by Automotive revenue
1,403 $31.0 $2,131 1,358 $30.5 $1,837
7.7%
6.4%
Revenue (Bils.) Pre-Tax
Results (Mils.)
2012 2011
Operating Margin (Pct.)**
2012 2011 2012 2011 2012 2011
Wholesales (000)

SLIDE 10
AUTOMOTIVE SECTOR 2012 FIRST QUARTER PRE-TAX RESULTS COMPARED WITH 2011*
* Excludes special items; see Appendix for detail and reconciliation to GAAP ** Cost changes are measured primarily at present-year exchange, and exclude special items and discontinued operations. In addition, costs that vary directly with volume, such as material, freight, and warranty costs, are measured at present-year volume and mix
$1.8 $2.1
2012 1Q
2011 1Q
Volume / Mix
Net Pricing
Other Costs**
Exchange
Industry $ 0.5 Share (0.3) Stocks (0.1) Mix / Other (0.1)
$ -
$(0.1)
$0.2 $0.2
$(0.2) $(0.4)
Contribution Costs**
Commodities Incl. Hedging $(0.2)
Mfg. / Engineering $(0.2) Pension / OPEB (0.1) Total Structural $(0.3) All Other $(0.1)
Billions
Net Interest /
Other
Market Factors Total Cost $(0.3)
Memo: B / (W) Than 2011 4Q $1.2 $(0.6) $(0.1) $0.7 $0.8 $ - $0.4
Pricing $ 0.7 Incentives (0.5)
SLIDE 11
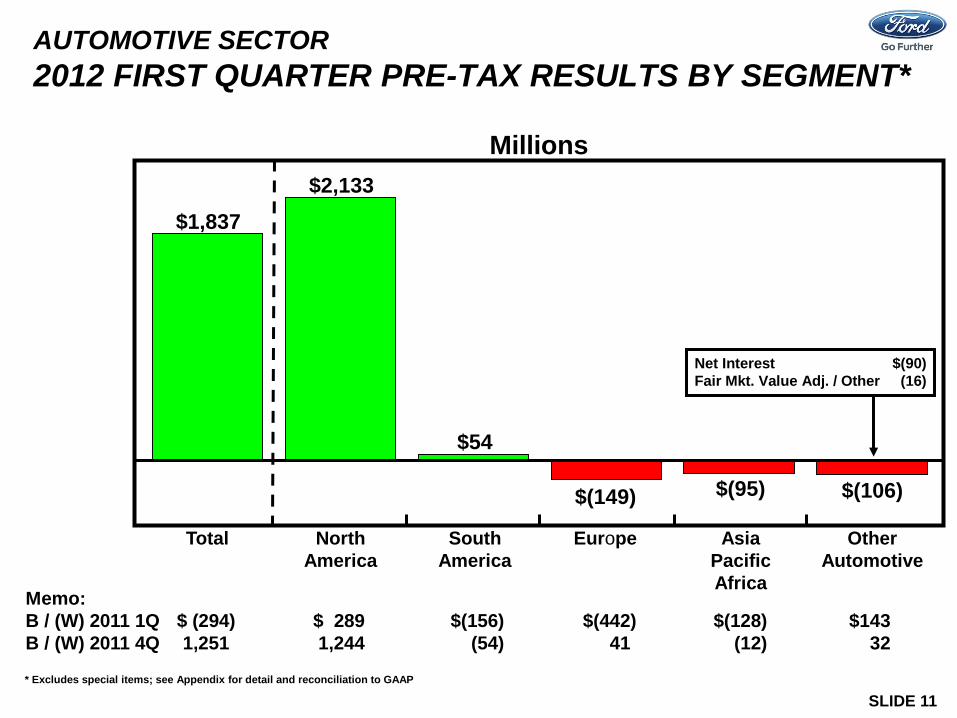
AUTOMOTIVE SECTOR 2012 FIRST QUARTER PRE-TAX RESULTS BY SEGMENT*
* Excludes special items; see Appendix for detail and reconciliation to GAAP
Millions
South America
Total North America
Other Automotive
Asia Pacific Africa
Europe
Net Interest $(90) Fair Mkt. Value Adj. / Other (16)
$1,837 $2,133
$54
$(149) $(95) $(106)
Memo: B / (W) 2011 1Q $ (294) $ 289 $(156) $(442) $(128) $143 B / (W) 2011 4Q 1,251 1,244 (54) 41 (12) 32

SLIDE 12
AUTOMOTIVE SECTOR -- NORTH AMERICA 2012 FIRST QUARTER KEY METRICS COMPARED WITH 2011
Revenue (Bils.) Pre-Tax
Results (Mils.) Operating
Margin (Pct.) Wholesales (000)
615 651 $17.9
$1,844
$18.6 $2,133
10.3% 11.5%
2012 2011 2012 2011 2012 2011 2012 2011 Memo: First Quarter (U.S. Market) U.S. Industry SAAR (Mils.) 13.4 14.9 U.S. Market Share 16.0% 15.2%

SLIDE 13
AUTOMOTIVE SECTOR -- NORTH AMERICA 2012 FIRST QUARTER PRE-TAX RESULTS COMPARED WITH 2011
Billions
2012 1Q
2011 1Q
Volume / Mix
Net Pricing
Other Costs*
U.S. Industry $ 0.6 U.S. Share (0.2) Mix / Other (0.2)
Exchange Other
$1.8
$0.2 $0.1
$(0.3)
$ - $0.2
B / (W) Than 2011 4Q $1.2 $(0.4) $(0.1) $0.6 $0.8 $ - $0.3
$0.1
Contribution Costs*
* Cost changes are measured primarily at present-year exchange, and exclude special items and discontinued operations. In addition, costs that vary directly with volume, such as material, freight, and warranty costs, are measured at present-year volume and mix
$2.1
Mfg. / Engineering $(0.1) Admin. & Selling / Other (0.1) Total Structural Costs $(0.2) All Other $(0.1)
Commodities Incl. Hedging $(0.2) Material Excl. Commod. 0.2 Warranty / Freight 0.1
$0.3
Pricing $ 0.4 Incentives (0.3)
SLIDE 14
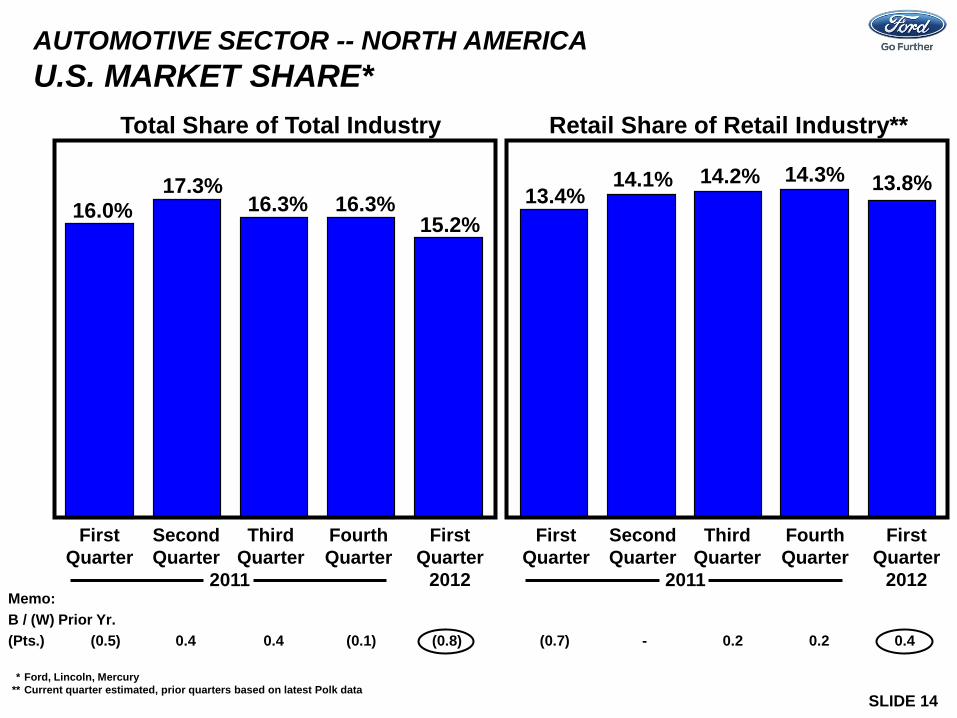
AUTOMOTIVE SECTOR -- NORTH AMERICA U.S. MARKET SHARE*
Memo: B / (W) Prior Yr. (Pts.) (0.5) 0.4 0.4 (0.1) (0.8) (0.7) - 0.2 0.2 0.4
Total Share of Total Industry Retail Share of Retail Industry**
* Ford, Lincoln, Mercury ** Current quarter estimated, prior quarters based on latest Polk data
16.0% 13.4% 17.3% 14.1% 16.3% 16.3%
14.2% 14.3%
15.2%
First Quarter
2012
First Quarter
Second Quarter
Third Quarter
Fourth Quarter
13.8%
First Quarter
2012
First Quarter
Second Quarter
Third Quarter
Fourth Quarter
2011 2011

SLIDE 15
AUTOMOTIVE SECTOR -- SOUTH AMERICA 2012 FIRST QUARTER KEY METRICS COMPARED WITH 2011
114 $2.3 $210
118 $2.4
$54
9.1%
2.3%
* South America industry SAAR and market share are based, in part, on estimated vehicle registrations for the six markets we track
Revenue (Bils.) Pre-Tax
Results (Mils.) Operating
Margin (Pct.) Wholesales (000)
Memo: First Quarter Industry SAAR (Mils.)* 5.3 5.4 Market Share* 9.5% 9.4%
2012 2011 2012 2011 2012 2011 2012 2011

SLIDE 16
AUTOMOTIVE SECTOR -- SOUTH AMERICA 2012 FIRST QUARTER PRE-TAX RESULTS COMPARED WITH 2011
Millions
Industry $ 28 Share (32) Stock 25 Mix / Other 43
2012 1Q
2011 1Q
Volume / Mix
Other Costs*
Exchange Other
B / (W) Than 2011 4Q $(54) $(77) $14 $(11) $81 $(32) $(29)
Net Pricing
Contribution Costs*
$210
$54 $64
$13
$(20)
$(93)
$(2)
* Cost changes are measured primarily at present-year exchange, and exclude special items and discontinued operations. In addition, costs that vary directly with volume, such as material, freight, and warranty costs, are measured at present-year volume and mix
$(156)
Commodities $(33) Material Excl. Commod. (77) Warranty / Freight (8) $(118)

SLIDE 17
AUTOMOTIVE SECTOR -- EUROPE 2012 FIRST QUARTER KEY METRICS COMPARED WITH 2011
432
372
Revenue (Bils.) Pre-Tax
Results (Mils.) Operating
Margin (Pct.) Wholesales (000)*
$8.7
$7.2
Memo: First Quarter Industry SAAR (Mils.)** 15.9 14.1 Market Share** 8.5% 8.5%
$293
$(149)
3.4%
(2.0)%
* Includes Ford Brand vehicles sold in Turkey by our unconsolidated affiliate (totaling about 17,000 and 11,000 units in First Quarter 2011 and 2012, respectively) and, beginning in 2011 Fourth Quarter, in Russia with the formation of our unconsolidated joint venture FordSollers (totaling about 30,000 units in First Quarter 2012), although revenue does not include these sales ** Europe industry SAAR and market share are based, in part, on estimated vehicle registrations for the 19 markets we track
2012 2011 2012 2011 2012 2011 2012 2011

SLIDE 18
Millions
2012 1Q
2011 1Q
Volume / Mix
Net Pricing
Contribution Cost*
Industry $(109) Share (13) Stocks (89) Mix / Other 13
AUTOMOTIVE SECTOR -- EUROPE 2012 FIRST QUARTER PRE-TAX RESULTS COMPARED WITH 2011
Exchange Other
$293
$(149) $(198)
$(32)
$(107)
$(1)
$(138)
Other Costs*
$34
B / (W) Than 2011 4Q $41 $(103) $(51) $68 $(14) $49 $92 * Cost changes are measured primarily at present-year exchange, and exclude special items and discontinued operations. In addition, costs that vary directly with volume, such as material, freight, and warranty costs, are measured at present-year volume and mix
$(442) Parts & Accessories $(97 ) Other (41 )
Commodities Incl. Hedging $ 8 Material Excl. Commod. (64) Warranty / Freight (51)
Mfg. / Engineering $ 61 Pension (43) Admin. & Selling / Other 50 Total Structural Costs $ 68 All Other $(34) Pricing $ 179
Incentives (211)

SLIDE 19
AUTOMOTIVE SECTOR -- ASIA PACIFIC AFRICA 2012 FIRST QUARTER KEY METRICS COMPARED WITH 2011
242
$2.1
$33
217 $2.3
$(95)
1.6%
(4.2)%
* Includes Ford brand and Jiangling Motors Corporation (JMC) brand vehicles sold in China by unconsolidated affiliates (totaling about 140,000 and 119,000 units in First Quarter 2011 and 2012, respectively), although revenue does not include these sales ** Asia Pacific Africa industry SAAR and market share, are based, in part, on estimated vehicle sales for the 12 markets we track; market share includes Ford brand and JMC brand vehicles sold in China by unconsolidated affiliates
Revenue (Bils.) Pre-Tax
Results (Mils.) Operating
Margin (Pct.) Wholesales (000)*
Memo: First Quarter Industry SAAR (Mils.)** 32.2 32.8 Market Share** 2.5% 2.3%
2012 2011 2012 2011 2012 2011 2012 2011

SLIDE 20
AUTOMOTIVE SECTOR -- ASIA PACIFIC AFRICA 2012 FIRST QUARTER PRE-TAX RESULTS COMPARED WITH 2011
Millions
B / (W) Than 2011 4Q $(12) $30 $26 $(7) $11 $(36) $(36)
$(110)
$(30) $(35)
$33 $16
$(95)
2012 1Q
2011 1Q
Volume / Mix
Other Costs*
Exchange Other Net Pricing
Contribution Costs*
$(112) Commodities $(13) Material Excl. Commod. (64) Warranty / Freight (35)
Mfg. / Engineering $ (67) Admin. & Selling / Other (38) Total Structural Costs $(105) All Other $ (5)
* Cost changes are measured primarily at present-year exchange, and exclude special items and discontinued operations. In addition, costs that vary directly with volume, such as material, freight, and warranty costs, are measured at present-year volume and mix
Pricing $87 Incentives 56
$(128)
Industry $ 9 Share (39) Stocks 5 Mix / Other (10)
$143

SLIDE 21
AUTOMOTIVE SECTOR 2012 PRODUCTION VOLUMES*

SLIDE 22
AUTOMOTIVE SECTOR 2012 CASH* First
Quarter(Bils.)
Gross CashMarch 31, 2012 23.0$ December 31, 2011 22.9
Change in gross cash 0.1$
Automotive pre-tax profits** 1.8$ Capital spending (1.1) Depreciation and amortization 0.9 Changes in working capital (0.1) Other / timing differences (0.6)
Automotive operating-related cash flow 0.9$
Separation payments (0.1) Receipts from Financial Services sector 0.3 Other (0.2)
Cash flow before other actions 0.9$
Changes in debt 0.5 Pension contributions (1.1) Dividends / Other Items (0.2)
Change in gross cash 0.1$
* See Appendix for reconciliation to GAAP ** Excludes special items; see Appendix for detail and reconciliation to GAAP
SLIDE 23
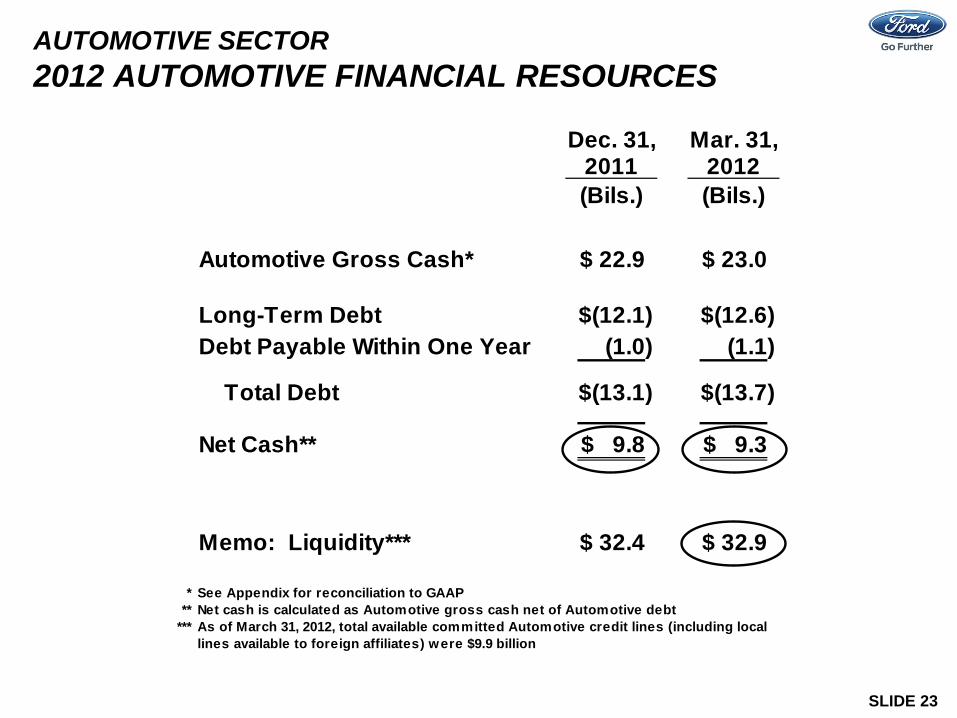
AUTOMOTIVE SECTOR 2012 AUTOMOTIVE FINANCIAL RESOURCES
Dec. 31, Mar. 31,2011 2012(Bils.) (Bils.)
Automotive Gross Cash* 22.9$ 23.0$
Long-Term Debt (12.1)$ (12.6)$ Debt Payable Within One Year (1.0) (1.1)
Total Debt (13.1)$ (13.7)$
Net Cash** 9.8$ 9.3$
Memo: Liquidity*** 32.4$ 32.9$
* See Appendix for reconciliation to GAAP** Net cash is calculated as Automotive gross cash net of Automotive debt
*** As of March 31, 2012, total available committed Automotive credit lines (including locallines available to foreign affiliates) were $9.9 billion
SLIDE 24
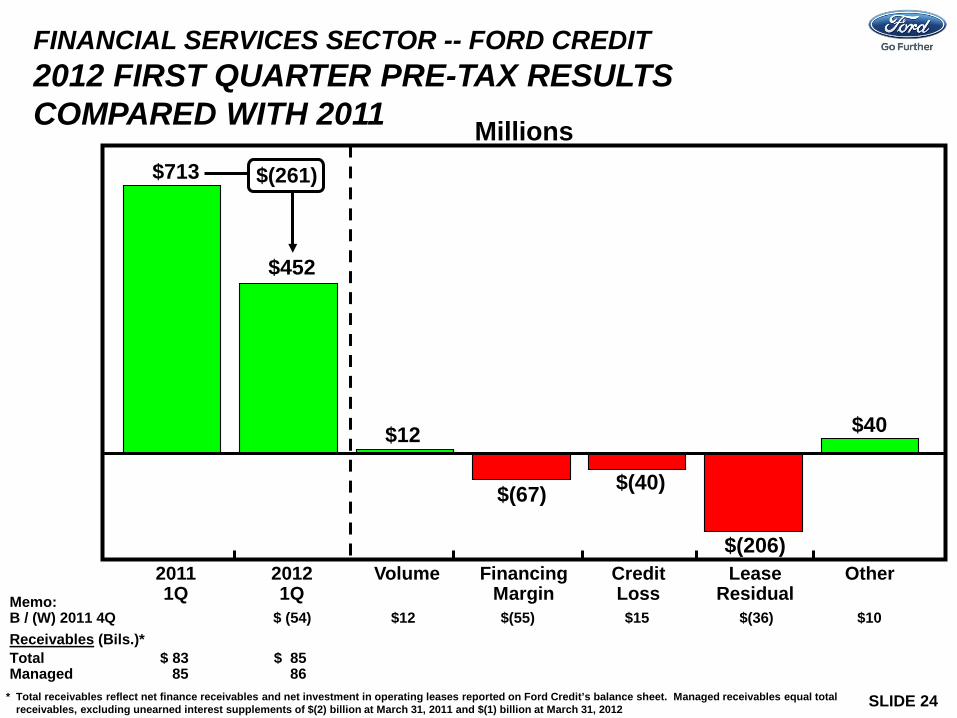
FINANCIAL SERVICES SECTOR -- FORD CREDIT 2012 FIRST QUARTER PRE-TAX RESULTS COMPARED WITH 2011
Memo: B / (W) 2011 4Q $ (54) $12 $(55) $15 $(36) $10
Receivables (Bils.)*
Total $ 83 $ 85 Managed 85 86
Lease Residual
Volume 2012 1Q
2011 1Q
Credit Loss
Other
Millions
Financing Margin
$713
$452
$12
$(67)
$40
$(206)
$(261)
$(40)
* Total receivables reflect net finance receivables and net investment in operating leases reported on Ford Credit’s balance sheet. Managed receivables equal total receivables, excluding unearned interest supplements of $(2) billion at March 31, 2011 and $(1) billion at March 31, 2012

SLIDE 25
TOTAL COMPANY PENSION DE-RISKING STRATEGY UPDATE
• Announced in January a long-term strategy to de-risk global funded pension plans
• Announcing today a voluntary lump-sum payout option to salaried U.S.
retirees and former employees that, if accepted, would settle our pension obligations to them
• Financial impact on Company:
− Pension obligation and balance sheet volatility reduced − Minimal impact to operating income − Non-cash, special item charges to profits − No impact to Company cash; lump-sum payments from plan assets − Future Company contributions to funded pension plans not
expected to be affected

SLIDE 26
OUR PLAN
Alan Mulally President and Chief Executive Officer
SLIDE 27
BUSINESS ENVIRONMENT OVERVIEW
Global Growth To Continue In 2012 Despite Europe Challenges
• 2012 global economic growth projected to be about 3%:
– U.S. economic growth projected between 2% - 3%
– Europe’s economies hampered by debt crisis and austerity measures
– Major emerging markets now in policy easing cycles
• Commodity prices expected to increase modestly in 2012 and continue to increase longer term given global demand growth
• Global automotive sales projected at about 80 million units for 2012. Supported by solid income growth and policy easing in emerging markets and improving U.S. fundamentals

SLIDE 28
TOTAL COMPANY 2012 PLANNING ASSUMPTIONS AND KEY METRICS
We Are On Track To Deliver Total Company Pre-Tax Operating Profit About The Same As 2011 And Strong Automotive Operating-Related Cash Flow
First Full Year Full YearQuarter Plan Outlook
Planning AssumptionsIndustry Volume (SAAR)* -- U.S. (Mils.) 14.9 13.5 - 14.5 14.5 - 15.0Industry Volume (SAAR)* -- Europe (Mils.)** 14.1 14.0 - 15.0 About 14
Operational MetricsCompared with Prior Year:Market Share -- U.S. 15.2% About Equal LowerMarket Share -- Europe** 8.5% About Equal On Track
Quality Mixed Improve Mixed
Financial Metrics Compared with Prior Year:- Automotive Pre-Tax Operating Profit*** $1.8 Bils. Higher- Ford Motor Credit Pre-Tax Operating Profit $0.5 Bils. Lower- Total Company Pre-Tax Operating Profit*** $2.3 Bils. About Equal- Automotive Structural Costs Increase**** $0.3 Bils. Less Than $2 Bils.- Automotive Operating Margin*** 6.4% Improve
Absolute Amount: - Capital Spending (Bils.) $1.1 $5.5 - $6
* Includes medium and heavy trucks** The 19 markets we track
*** Excludes special items; Automotive operating margin is defined as Automotive pre-tax results, excluding special items and Other Automotive, divided by Automotive revenue
**** Structural cost changes are measured primarily at present-year exchange, and exclude special items and discontinued operations
On Track

SLIDE 29
TOTAL COMPANY OUR PLAN --
• Continue implementation of our global
• Aggressively restructure to operate profitably at the current demand and changing model mix
• Accelerate development of new products our customers want and value
• Finance our Plan and improve our balance sheet
• Work together effectively as one team -- leveraging our global assets
+ + = Asia Pacific
Africa
Americas
Europe
Profits & Cash
PROFITABLE GROWTH FOR ALL
Profits & Cash
PROFITABLE GROWTH FOR ALL
Small Medium
Large
SLIDE 30
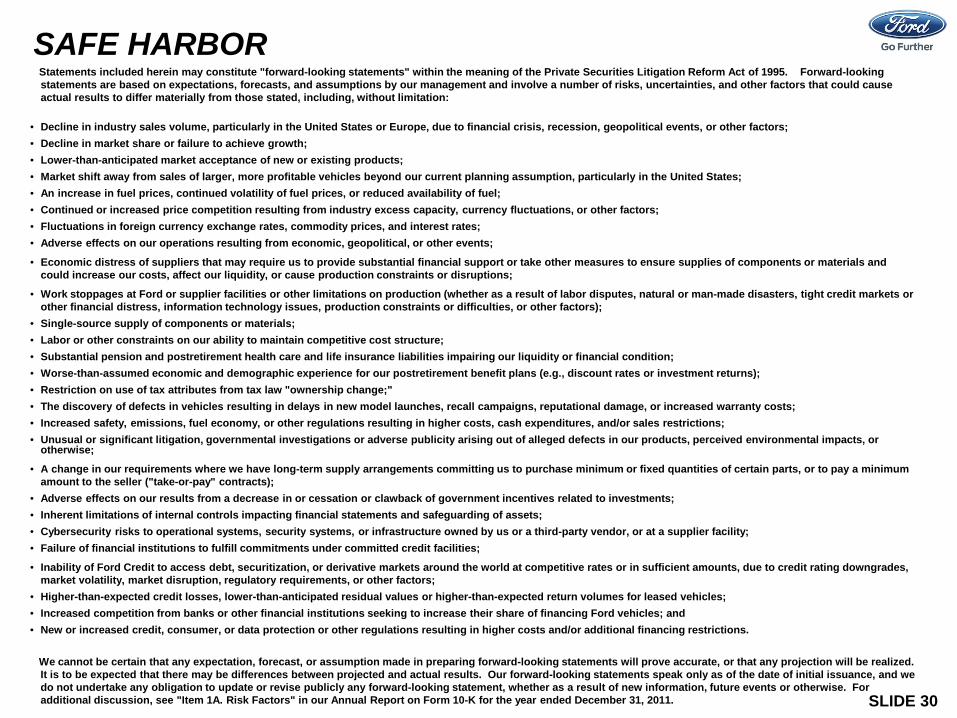
SAFE HARBOR Statements included herein may constitute "forward-looking statements" within the meaning of the Private Securities Litigation Reform Act of 1995. Forward-looking
statements are based on expectations, forecasts, and assumptions by our management and involve a number of risks, uncertainties, and other factors that could cause actual results to differ materially from those stated, including, without limitation:
• Decline in industry sales volume, particularly in the United States or Europe, due to financial crisis, recession, geopolitical events, or other factors; • Decline in market share or failure to achieve growth; • Lower-than-anticipated market acceptance of new or existing products; • Market shift away from sales of larger, more profitable vehicles beyond our current planning assumption, particularly in the United States; • An increase in fuel prices, continued volatility of fuel prices, or reduced availability of fuel; • Continued or increased price competition resulting from industry excess capacity, currency fluctuations, or other factors; • Fluctuations in foreign currency exchange rates, commodity prices, and interest rates; • Adverse effects on our operations resulting from economic, geopolitical, or other events;
• Economic distress of suppliers that may require us to provide substantial financial support or take other measures to ensure supplies of components or materials and could increase our costs, affect our liquidity, or cause production constraints or disruptions;
• Work stoppages at Ford or supplier facilities or other limitations on production (whether as a result of labor disputes, natural or man-made disasters, tight credit markets or other financial distress, information technology issues, production constraints or difficulties, or other factors);
• Single-source supply of components or materials; • Labor or other constraints on our ability to maintain competitive cost structure; • Substantial pension and postretirement health care and life insurance liabilities impairing our liquidity or financial condition; • Worse-than-assumed economic and demographic experience for our postretirement benefit plans (e.g., discount rates or investment returns); • Restriction on use of tax attributes from tax law "ownership change;" • The discovery of defects in vehicles resulting in delays in new model launches, recall campaigns, reputational damage, or increased warranty costs; • Increased safety, emissions, fuel economy, or other regulations resulting in higher costs, cash expenditures, and/or sales restrictions; • Unusual or significant litigation, governmental investigations or adverse publicity arising out of alleged defects in our products, perceived environmental impacts, or
otherwise;
• A change in our requirements where we have long-term supply arrangements committing us to purchase minimum or fixed quantities of certain parts, or to pay a minimum amount to the seller ("take-or-pay" contracts);
• Adverse effects on our results from a decrease in or cessation or clawback of government incentives related to investments; • Inherent limitations of internal controls impacting financial statements and safeguarding of assets; • Cybersecurity risks to operational systems, security systems, or infrastructure owned by us or a third-party vendor, or at a supplier facility; • Failure of financial institutions to fulfill commitments under committed credit facilities;
• Inability of Ford Credit to access debt, securitization, or derivative markets around the world at competitive rates or in sufficient amounts, due to credit rating downgrades, market volatility, market disruption, regulatory requirements, or other factors;
• Higher-than-expected credit losses, lower-than-anticipated residual values or higher-than-expected return volumes for leased vehicles; • Increased competition from banks or other financial institutions seeking to increase their share of financing Ford vehicles; and • New or increased credit, consumer, or data protection or other regulations resulting in higher costs and/or additional financing restrictions.
We cannot be certain that any expectation, forecast, or assumption made in preparing forward-looking statements will prove accurate, or that any projection will be realized. It is to be expected that there may be differences between projected and actual results. Our forward-looking statements speak only as of the date of initial issuance, and we do not undertake any obligation to update or revise publicly any forward-looking statement, whether as a result of new information, future events or otherwise. For additional discussion, see "Item 1A. Risk Factors" in our Annual Report on Form 10-K for the year ended December 31, 2011.

APPENDIX

2012 FIRST QUARTER EARNINGS -- APPENDIX INDEX
Total Company
• Calculation of Earnings Per Share 1
• Income / (Loss) from Continuing Operations 2
Automotive Sector
• Special Items 3
• Dealer Stocks and Definition of Wholesales 4
• Market Results 5
• 2012 First Quarter Pre-Tax Results Compared With 2011 Fourth Quarter 6
• Automotive Debt 7
Reconciliation to GAAP
Automotive Sector
• Net Interest 8
• Gross Cash 9
• Operating-Related Cash Flows 10
Slide

TOTAL COMPANY CALCULATION OF EARNINGS PER SHARE
APPENDIX 1 of 10
After-Tax Results (Mils.)After-tax results* 1,396$ 1,578$ Effect of dilutive 2016 Convertible Notes** 11 11 Effect of dilutive 2036 Convertible Notes** - -
Diluted after-tax results 1,407$ 1,589$
Basic and Diluted Shares (Mils.)Basic shares (Average shares outstanding) 3,803 3,803 Net dilutive options and warrants*** 154 154 Dilutive 2016 Convertible Notes 95 95 Dilutive 2036 Convertible Notes 3 3
Diluted shares 4,055 4,055
EPS (Diluted) 0.35$ 0.39$
* Excludes Income / (Loss) attributable to non-controlling interests; special items detailed on Appendix 3** As applicable, includes interest expense, amortization of discount, amortization of fees, and other changes in income or
loss that result from the application of the if-converted method for convertible securities*** Net dilutive effect includes approximately 93 million dilutive shares, representing the net share settlement methodology
for the 362 million warrants outstanding as of March 31, 2012
Net Income Operating
2012 First QuarterAfter-Tax
to Ford Special ItemsAttributable Excl.

TOTAL COMPANY INCOME / (LOSS) FROM CONTINUING OPERATIONS
APPENDIX 2 of 10
2011 2012(Mils.) (Mils.)
North America 1,844$ 2,133$ South America 210 54 Europe 293 (149) Asia Pacific Africa 33 (95)
Other Automotive (249) (106) Total Automotive (excl. special items) 2,131$ 1,837$
Special items -- Automotive (61) (255) Total Automotive 2,070$ 1,582$
Financial Services 706 456 Pre-tax results 2,776$ 2,038$
(Provision for) / Benefit from income taxes (220) (640)
Net income / (loss) 2,556$ 1,398$ Less: Income / (Loss) attributable to non-controlling interests 5 2
Net income / (loss) attributable to Ford 2,551$ 1,396$
Memo: Excluding special items
Pre-tax results 2,837$ 2,293$ (Provision for) / Benefit from income taxes (852) (713)
Less: Income / (Loss) attributable to non-controlling interests 5 2 After-tax results 1,980$ 1,578$
First Quarter
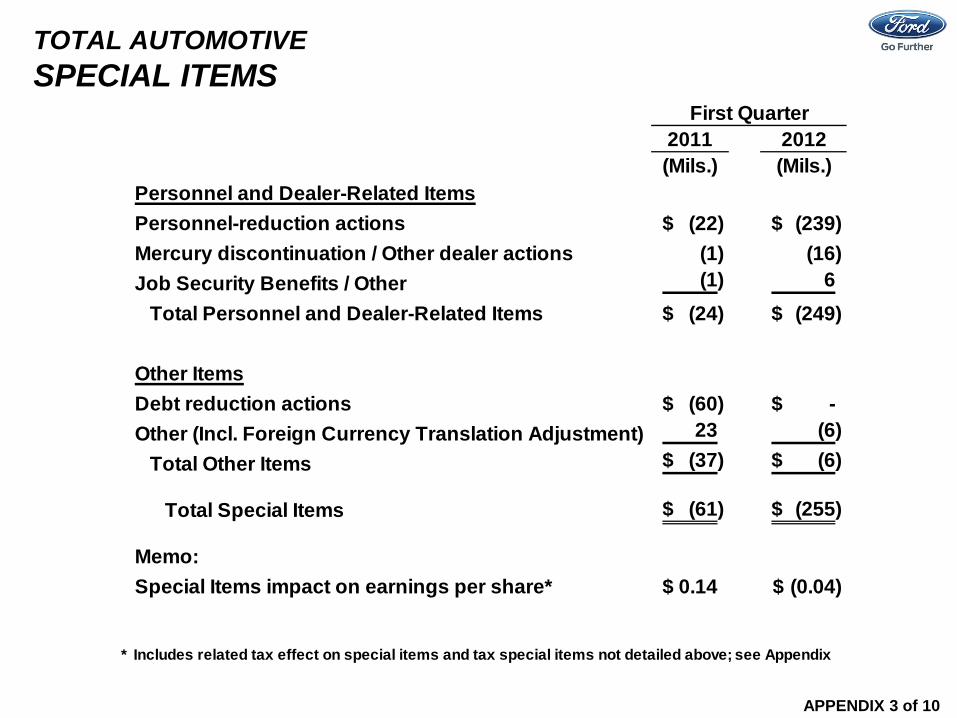
TOTAL AUTOMOTIVE SPECIAL ITEMS
APPENDIX 3 of 10
2011 2012(Mils.) (Mils.)
Personnel and Dealer-Related ItemsPersonnel-reduction actions (22)$ (239)$ Mercury discontinuation / Other dealer actions (1) (16) Job Security Benefits / Other (1) 6
Total Personnel and Dealer-Related Items (24)$ (249)$
Other ItemsDebt reduction actions (60)$ -$ Other (Incl. Foreign Currency Translation Adjustment) 23 (6)
Total Other Items (37)$ (6)$
Total Special Items (61)$ (255)$
Memo:Special Items impact on earnings per share* 0.14$ (0.04)$
* Includes related tax effect on special items and tax special items not detailed above; see Appendix
First Quarter

SELECTED MARKETS 2012 FIRST QUARTER DEALER STOCKS AND DEFINITION OF WHOLESALES*
APPENDIX 4 of 10
2011 2012(000) (000)
U.S. Dealer StocksMarch 31 407 477 December 31 -- Prior Year 394 469
1Q Stock Change H / (L) 13 8
South America Dealer Stocks**March 31 42 46 December 31 -- Prior Year 52 49
1Q Stock Change H / (L) (10) (3)
Europe Dealer Stocks***March 31 226 195 December 31 -- Prior Year 213 212
1Q Stock Change H / (L) 13 (17)
Asia Pacific Africa Dealer Stocks****March 31 94 93 December 31 -- Prior Year 75 87
1Q Stock Change H / (L) 19 6
TotalMarch 31 769 811 December 31 -- Prior Year 734 817
1Q Stock Change H / (L) 35 (6)
* Wholesale unit volumes include all Ford badged units (whether produced by Ford or by an unconsolidated affiliate), unitsmanufactured by Ford that are sold to other manufacturers and units distributed for other manufacturers, and local-brandvehicles produced by our Chinese joint venture Jiangling Motors Corporation (JMC). Revenue from certain vehicles in wholesaleunit volumes (specifically, Ford-badged vehicles produced and distributed by our unconsolidated affiliates, as well as JMC brandvehicles) are not included in our revenue. Vehicles sold to daily rental car companies that are subject to a guaranteedrepurchase option ("rental repurchase"), as well as other sales of finished vehicles for which the recognition of revenue isdeferred (e.g., consignments), also are included in wholesale unit volumes
** South America dealer stocks are based, in part, on estimated vehicle registrations for the six markets we track*** Europe dealer stocks are based, in part, on estimated vehicle registrations for the 19 markets we track
**** Asia Pacific Africa dealer stocks are based, in part, on estimated vehicle sales for the 12 markets we track
(5)
7
(30)
(41)
(13)

AUTOMOTIVE SECTOR MARKET RESULTS*
APPENDIX 5 of 10
2011 2012U.S.Industry SAAR (Mils.) 13.4 14.9 Market share 16.0 % 15.2 %
South America**Industry SAAR (Mils.) 5.3 5.4 Market share 9.5 % 9.4 %
Europe***Industry SAAR (Mils.) 15.9 14.1 Market share 8.5 % 8.5 %
Asia Pacific Africa****Industry SAAR (Mils.) 32.2 32.8 Market share 2.5 % 2.3 %
* Includes medium and heavy trucks** South America industry SAAR and market share are based, in part, on
estimated vehicle registrations for the six markets we track*** Europe industry SAAR and market share are based, in part, on estimated
vehicle registrations for the 19 markets we track**** Asia Pacific Africa industry SAAR and market share are based, in part, on
estimated vehicle sales for the 12 markets we track; market share includesFord brand and JMC brand vehicles sold in China by unconsolidated affiliates
First Quarter

AUTOMOTIVE SECTOR 2012 FIRST QUARTER PRE-TAX RESULTS COMPARED WITH 2011 FOURTH QUARTER*
* Excludes special items; see Appendix for detail and reconciliation to GAAP ** Cost changes are measured primarily at present-year exchange, and exclude special items and discontinued operations. In addition, costs that vary directly with volume, such as material, freight, and warranty costs, are measured at present-year volume and mix
$ -
$(0.6)
$0.4
Billions
$(0.1)
$0.7 $0.8
Industry $ 0.4 Share (0.4) Stocks (0.4) Mix / Other (0.2)
2012 1Q
2011 4Q
Volume / Mix
Net Pricing
Other Costs**
$1.8
$0.6
Net Interest /
Other
Exchange Contribution Costs**
Mfg. / Engineering $0.4 Advert. & Sales Promo. 0.2 Admin. Selling / Other 0.1 Total Structural Costs $0.7 Other Cost $0.1
Compensation $0.2 Other 0.2
$1.2
Pricing $ 0.1 Incentives / Other (0.2 )
Commodities Incl. Hedging $0.2 Material Excl. Commod. 0.2 Warranty / Freight 0.3
APPENDIX 6 of 10

AUTOMOTIVE SECTOR AUTOMOTIVE DEBT
APPENDIX 7 of 10

APPENDIX 8 of 10
AUTOMOTIVE SECTOR NET INTEREST RECONCILIATION TO GAAP
2011 2012(Mils.) (Mils.)
Interest expense (251)$ (185)$ Interest income 85 87
Subtotal (166)$ (98)$
Adjusted for items included / excluded from net interest Include: Gains / (Losses) on cash equiv. and marketable securities* (3) 26 Exclude: Special items (2) - Other (14) (18)
Net Interest (185)$ (90)$
* Excludes mark-to-market adjustments of our investment in Mazda
First Quarter

APPENDIX 9 of 10
AUTOMOTIVE SECTOR GROSS CASH RECONCILIATION TO GAAP
Mar. 31, Dec. 31, Mar. 31,2011 2011 2012(Bils.) (Bils.) (Bils.)
Cash and cash equivalents 12.6$ 7.9$ 7.3$ Marketable securities 8.8 15.0 15.8
Total cash and marketable securities 21.4$ 22.9$ 23.1$
Securities in transit* (0.1) - (0.1) Gross cash 21.3$ 22.9$ 23.0$
* The purchase or sale of marketable securities for which the cash settlement was not made by period-end and forwhich there was a payable or receivable recorded on the balance sheet at period end
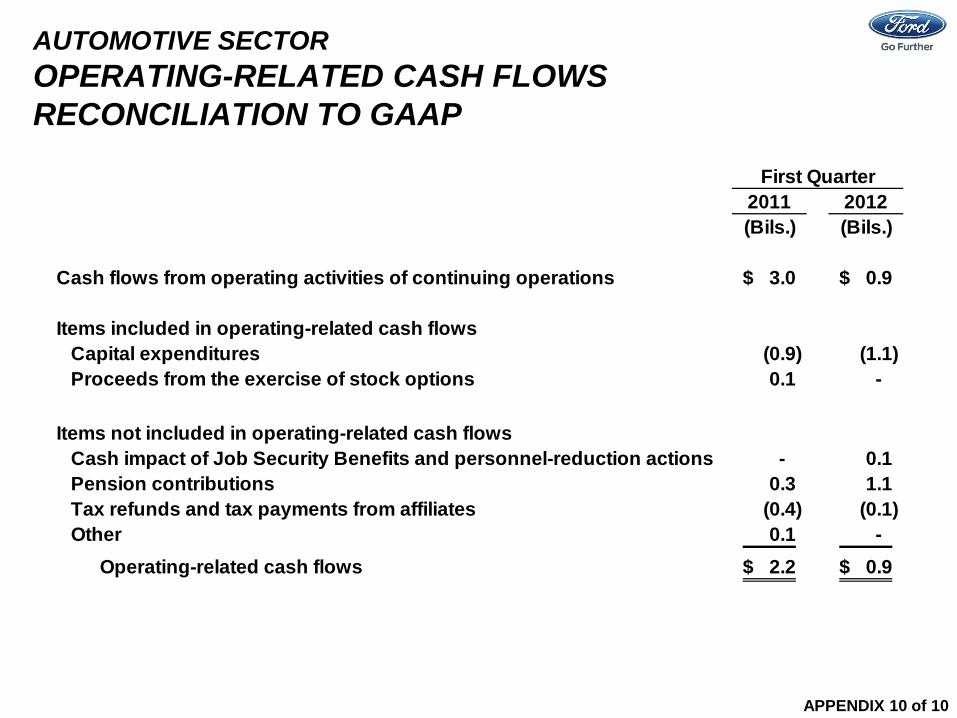
AUTOMOTIVE SECTOR OPERATING-RELATED CASH FLOWS RECONCILIATION TO GAAP
APPENDIX 10 of 10
2011 2012(Bils.) (Bils.)
Cash flows from operating activities of continuing operations 3.0$ 0.9$
Items included in operating-related cash flowsCapital expenditures (0.9) (1.1) Proceeds from the exercise of stock options 0.1 -
Items not included in operating-related cash flowsCash impact of Job Security Benefits and personnel-reduction actions - 0.1 Pension contributions 0.3 1.1 Tax refunds and tax payments from affiliates (0.4) (0.1) Other 0.1 -
Operating-related cash flows 2.2$ 0.9$
First Quarter