2016 state of the u.s. economy
TRANSCRIPT

2016 State of the U.S. Economy
Real Growth Stalls Despite Full Employment Conditions
Prepared by
William J. McConnell, P.E., J.D.
CEO
The Vertex Companies, Inc.

2016 State of the U.S. Economy
Page 2 of 21
I. Executive Summary
Economic conditions in the United States (“U.S.”) are mixed. While the Federal
Reserve Board (“Fed”) considers the economy to be at “full employment” in the first quarter
of 2016, and corporations are making near record profits, Real Gross Domestic Product
(“GDP”) is expanding at a sluggish pace. Slow growth over the past several years is attributed
to four issues: (1) further decline in commodity prices, particularly oil; (2) continued strength
in the U.S. dollar; (3) currency devaluation in China; and (4) the delay by the Fed to raise
interest rates until December of 2015.
A review of historical trends suggests that the mere fact that 2016 is an election year
should have little bearing on the U.S. economy. Dating back to 1928, the average growth of
the S&P 500 during an election year is only slightly less than S&P 500 performance during all
years (7% v. 7.5%).1 However, in an election year where a new president must be elected, as
is the case in 2016, the difference in market returns is significant, -4% versus 7.5%.2 That
said, more facts point to another year of slow economic growth.
In sum, 2016 will be similar to what was experienced in 2015—a slow growth year
despite a historically low unemployment rate that has hovered around 5%. The stock market
will see marginal growth, if any, as well due to flat profits. Once commodity prices rebound,
economic conditions should pick up, which might not happen until 2017.
II. U.S. Unemployment
The most recent peak in unemployment occurred in November of 2009, when the rate
stopped just shy of the 10% mark (9.9%) on the tail of the Great Recession. Since then,
employment conditions have steadily improved. In fact, in January of 2016, the unemployment
rate dipped below 5% for the first time since 2007. As of March of 2016, the unemployment
rate stands at 5.0%. Fed Chairwoman, Janet Yellen, considers an unemployment rate of 5.0%
to be “full employment” due to the transitional nature of the labor market. 3
While unemployment is at a historically low level—which is great for the economy,
history tells us that when unemployment bottoms out, it typically does so for a brief period of
1 http://www.marketwatch.com/story/2016-predictions-what-presidential-election-years-mean-for-stocks-2015-12-
29 2 Id. 3 http://fortune.com/2016/02/05/full-employment/

2016 State of the U.S. Economy
Page 3 of 21
time before it starts to transition upwards, as evidenced by the “V” shape cycles in the Federal
Reserve Economic Data (“FRED”) graph below. The bottom of the “V” almost always occurs
just before a recessionary cycle; however, because inflationary pressures remain low, which is
an oddity that is discussed in the next section; an economic downturn will likely be pushed
forward by several years.
Source Data: Bureau of Labor Statistics
III. Inflation
“Although the economy has continued to recover and the labor market is approaching
our maximum employment objective, inflation has been persistently below 2 percent,” said Fed
Vice Chairman Stanley Fischer on August 29, 2015.4 The reason for low inflation despite full
employment is threefold: (1) the drop in oil prices creates lower prices of gasoline and other
energy items; (2) the strengthening dollar allows for cheap imports and strains export volume;
and (3) China’s slowing demand for commodities is keeping items such as metals at lower
price points.5
For the past three years the Consumer Price Index (“CPI”) has held below 2%, as
noted in the chart below. Inflation figures are dropping in 2016 because the CPI remained
unchanged in January and dropped by 0.2% in February. Until oil prices rebound, the dollar
starts to weaken, and/or the global economy picks up, inflation will likely remain below the
4 https://www.weforum.org/agenda/2015/08/why-is-us-inflation-so-low/ 5 Id.

2016 State of the U.S. Economy
Page 4 of 21
2% mark. The International Monetary Fund (“IMF”) forecasts that inflation will remain below
2% in 2016 and just above the 2% mark from 2017 – 2020, as noted below.
Source Data: U.S. Bureau of Labor Statistics
Source Data: Bureau of Labor Statistics

2016 State of the U.S. Economy
Page 5 of 21
Source Data: IMF
IV. Federal Funds Rate
In December of 2015 the Fed made its first rate hike in nearly ten years (Jun. 29,
2006). In fact, it was the first rates move of any kind in exactly seven years, when the Fed
lowered the target rate to 0-0.25% on December 16, 2008. Some economists scrutinized the
Fed’s decision due to the slow economic growth over the past several years; regardless, the
rate hike was minimal as it raised the target rate from 0-0.25% to 0.25-0.50%.6
The Fed reasoned that the increase was based on full employment conditions and its
expectation that inflation was going to eclipse the 2% market in the near future. 7 As noted
above, this rationale was flawed because inflation fell below zero in February of 2016. Despite
6 http://www.cnbc.com/2015/12/16/fed-raises-rates-for-first-time-since-2006.html 7 Id.

2016 State of the U.S. Economy
Page 6 of 21
the move, the Federal Open Market Committee (“FOMC”) noted increases will likely be
gradual moving forward. 8
The Fed is concerned about the U.S. economy moving into a period of stagflation,
where real growth remains flat but wage and price pressures increase. Kathy Jones, the Chief
Fixed Income Strategist at Charles Schwab called the rate hike “dovish,” and noted that “…our
expectation is still a flatter yield curve, firmer dollar, weaker commodity prices, a very slow
and low pace of interest. Indeed, the Fed has its work cut out for it over the next several years
based on the mixed financial indicators—the past policy of lower rates coupled with $3.7
trillion in money printing (“quantitative easing”) resulted in a boost to the financial markets but
the economy never surpassed a 2.7 percent annualized gain throughout the period, which is the
worst recovery since the Great Depression.”
Source Data: The Federal Reserve
V. Real Gross Domestic Product
Since 1970, Real Gross National Product (“GNP”), (GDP minus inflation) has
increased at an average rate of 2.8 percent; annual growth above this mark is deemed strong.
In 2014 and 2015, Real GDP grew at an annualized rate of 2.4%, which is held to be sluggish
by the Bureau of Economic Analysis (“BEA”; $17,616 billion in 2014 and $17,947 billion in
8 Id.

2016 State of the U.S. Economy
Page 7 of 21
2015).9 Over the past year the BEA noted accelerations in imports due to the strong dollar,
personal consumption, residential fixed investments, and state and local government spending.
The gains were offset by decelerations in exports (due to the strong dollar) and federal
government spending.10 Economists forecast that Real GDP will slip down to the 2% mark in
2016.11
Source Data: U.S. Bureau of Economic Analysis
9 http://www.bea.gov/newsreleases/national/gdp/2016/gdp4q15_3rd.htm 10 Id. 11 file:///C:/Users/william/Downloads/20160303-the-forecasting-advisor-u-s-real-gdp-is-projected-to-post-a-slight-
decline-in-the-first-quarter-of-2016.pdf

2016 State of the U.S. Economy
Page 8 of 21
Source Data: U.S. Bureau of Economic Analysis
VI. Federal Deficit
As a result of the Great Recession, tax receipts slipped to $2.1 trillion in 2009—the
lowest level since 2004. As a result of limited tax income in 2009 and a $600 billion jump in
outlays due to the federal stimulus program, the federal deficit hit a record mark (by a factor of
three) of $1.4 trillion. While the deficit in 2015 was relatively high at $435 billion, it is 70%
less than the 2009 deficit and the deficit has trended downward for seven straight years.
However, as a result of the slow economic growth, the Congressional Budget Office expects
the deficit to increase in 2016 and 2017.12
2008 - $485 billion
2009 - $1.4 trillion
2010 - $1.3 trillion
2011 - $1.3 trillion
2012 - $1.1 trillion
12 http://www.forbes.com/sites/bobmcteer/2015/10/11/the-shrinking-budget-deficit-and-the-slowing-growth-of-
federal-debt/#5318d4f8adc0

2016 State of the U.S. Economy
Page 9 of 21
2013 - $680 billion
2014 - $483 billion
2015 - $435 billion
2016 - $463 billion (forecast)
2017 - $504 billion (forecast)
Source Data: U.S. Office of Management and Budget

2016 State of the U.S. Economy
Page 10 of 21
Source Data: U.S. Office of Management and Budget
VII. State Economies
Nationally, total state tax revenue recovered more than two years ago from its plunge
during the recession. However, state performance is mixed—20 states still collect less tax
revenue than pre-recession era peaks. Moreover, 22 states’ unemployment level still trail 2007
levels. Despite these issues, personal income in all states is now above pre-recession figures,
though growth is short of historic norms.13 This personal income increase in all states signals a
widespread U.S. economic recovery.
Even after overcoming the effects of the recession, states face financial pressures that
will affect budgets now and for years to come. A major issue for a number of states is how to
cope with an accumulation of unfunded public pension and retiree health care liabilities, which
total more than $1 trillion nationwide.14 This massive debt load will limit the funds available
for other priorities and raise borrowing costs.
13 http://www.pewtrusts.org/en/multimedia/data-visualizations/2014/fiscal-50#ind0 14 Id.

2016 State of the U.S. Economy
Page 11 of 21
Last year I noted that North Dakota and many other shale states were booming due to
the natural gas revolution. Due to a glut in supply, however, natural gas prices dropped and
production has slowed. Accordingly, taxes on corporate income, oil and mineral extraction
dropped considerably in 2015 (and this will continue in 2016), which has slowed economic
growth for these states—this impact is not reflected in Mercatus Center’s graph below.
Regardless, the northeast corridor, Illinois, West Virginia, and California continue to have the
weakest state economies.
Source Data: Mercatus.org
VIII. Bank Lending
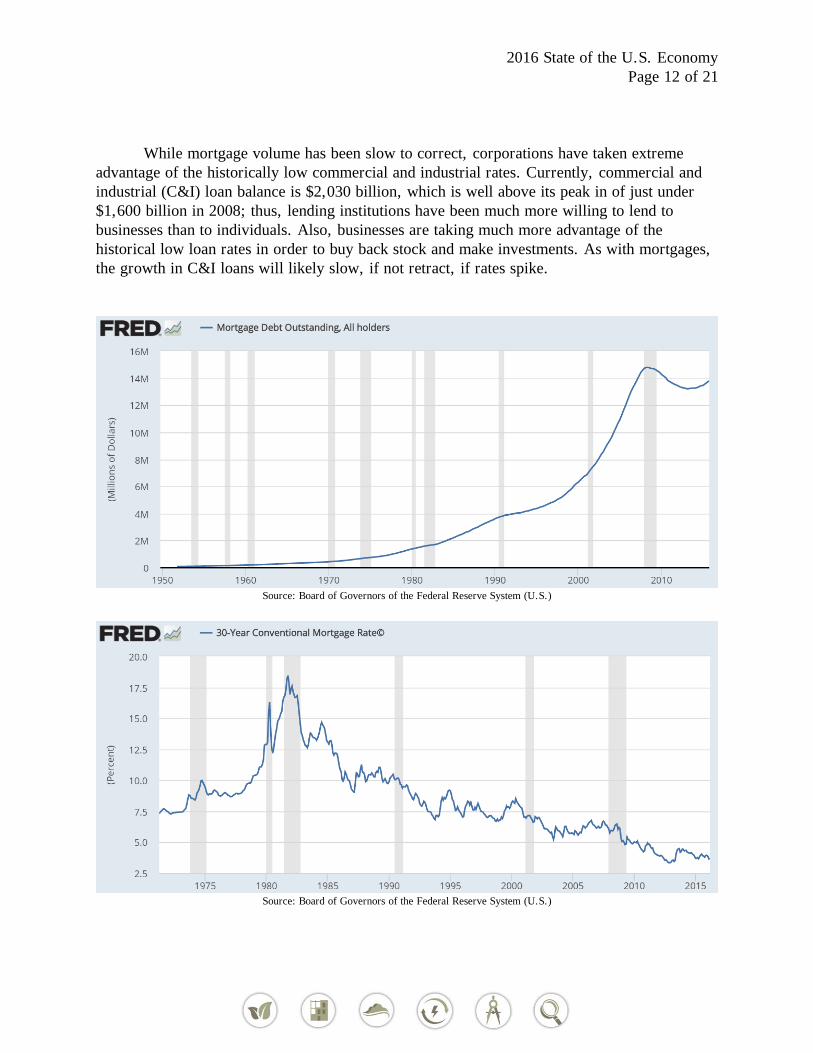
As of Q4 of 2015, the outstanding mortgage debt of all holders in the U.S. is
$13,795,835. This figure has risen steadily since it bottomed out in mid-2013 and is
remarkably high based on historical figures. The peak of mortgage lending occurred in early
2008 when total debt reached nearly $14,800,000. Although mortgage rates plummeted in
2009, U.S. citizens did not run to banks to get loans because banks tightened up underwriting
practices. It took a correction of household income to trigger an upward trend in outstanding
mortgage value over the past two years. If the historically low loan rates start to jump up
(following an increase to the Federal Funds Rate), mortgage volume will certainly diminish.
2016 State of the U.S. Economy
Page 12 of 21
While mortgage volume has been slow to correct, corporations have taken extreme
advantage of the historically low commercial and industrial rates. Currently, commercial and
industrial (C&I) loan balance is $2,030 billion, which is well above its peak in of just under
$1,600 billion in 2008; thus, lending institutions have been much more willing to lend to
businesses than to individuals. Also, businesses are taking much more advantage of the
historical low loan rates in order to buy back stock and make investments. As with mortgages,
the growth in C&I loans will likely slow, if not retract, if rates spike.
Source: Board of Governors of the Federal Reserve System (U.S.)
Source: Board of Governors of the Federal Reserve System (U.S.)

2016 State of the U.S. Economy
Page 13 of 21
Source: Board of Governors of the Federal Reserve System (U.S.)
Source: Board of Governors of the Federal Reserve System (U.S.)

2016 State of the U.S. Economy
Page 14 of 21
IX. Federal Debt
An ongoing issue that will continue for the foreseeable future is the national debt level,
which continues to increase at an alarming pace. Currently the U.S. debt is just over $18
trillion. As a percentage of the GDP, the U.S. debt level has increased from 54% in 2000 to
104% in 2015; it is unlikely that the percentage will fall below 100 in the near future.
Source Data: Federal Reserve Bank of St. Louis, OMB
Source Data: Federal Reserve Bank of St. Louis, OMB

2016 State of the U.S. Economy
Page 15 of 21
X. Energy
The drop in oil prices is the story of the past 20 months. Since June of 2014, the cost
per barrell of West Texas Crude Intermediate dropped from $106 to approximately $33
(February of 2016)—a 70% reduction. Natural gas prices have dropped as well, albiet not as
much. During this same time period, natrual gas in the U.S. has dropped from $3.86 per
gallon to $1.82 per gallon—a drop of 53%. As noted above, the drop in oil and gas prices has
tempered U.S. economic growth.
Source Data: U.S. Energy Information Administration
Source Data: U.S. Energy Information Association
2016 State of the U.S. Economy
Page 16 of 21
XI. Corporate Profits
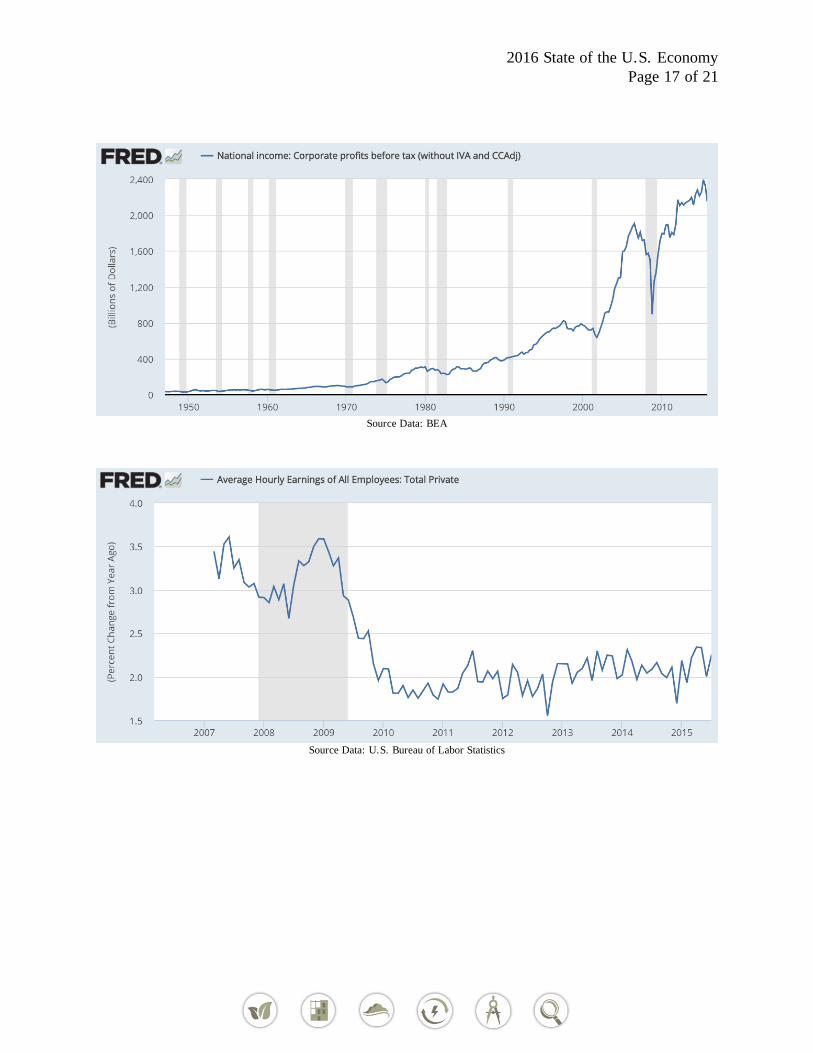
Corporate profits hit record levels in mid-2015 before contracting significantly in the
latter half of the year. Since the recession, corporations have boosted profits by employing as
few workers as possible and by keeping wage growth down—hourly wages are only growing at
a 2 percent nominal pace (growth is typically in the 3 to 4 percent range). 15
Rather than deploying borrowed funds for capital expenditures, corporation’s most
noted usage of funds between 2013-2015 has been the trillion dollars or so that have gone to
boost share prices through stock buy backs.16 Notwithstanding record debt levels,
corporation’s cash level also increased to a record level in 2014, according to Fed data. The
combination of hoarding cash while continuing to raise debt and not invest in growth has
spurred concern about whether companies are using the low-rate opportunity wisely. 17 Once
interest rates increase, buy back purchases will not be as attractive to corporations, so this
bonanza will likely wane in 2017.
Bank of America recently noted that more companies are now starting to use their cash
to invest in growth rather than simply returning money to shareholders. Wall Street analysts
predict capital expenditures will double in the near future. 18 Citigroup also believes that
companies will spend more of their borrowed money on capital expenditures and hiring over
the next year.19
15 Id. 16 http://www.trimtabs.com/global/index.htm 17 Id. 18 Id. 19 Id.
2016 State of the U.S. Economy
Page 17 of 21
Source Data: BEA
Source Data: U.S. Bureau of Labor Statistics

2016 State of the U.S. Economy
Page 18 of 21
Source Data: U.S. Bureau of Economic Analysis
XII. Stock Market
Because of record corporate profits in 2014 and early 2015, the stock market surged to
historic levels before it pulled back in the latter half of 2015, which caused a somewhat flat to
slight negative finish of 2015, as noted below.
Date Dow % NASDAQ % S&P 500 %
1/1/2010 10,428 2,269 1,115
1/1/2011 11,578 11% 2,653 17% 1,258 13%
1/1/2012 12,218 6% 2,605 -2% 1,258 0%
1/1/2013 13,104 7% 3,019 16% 1,426 13%
1/1/2014 16,576 26% 4,177 38% 1,848 30%
1/1/2015 17,823 8% 4,736 13% 2,059 11%
1/1/2016 17,128 -4% 4,923 4% 2,005 -3%
Four factors dogged the stock market this year: (1) further decline in commodity prices,
particularly oil; (2) continued strength in the U.S. dollar; (3) currency devaluation in China;
and (4) the delay by the Fed to raise interest rates until December of 2015.20
Specifically, plunging oil prices decimated energy stocks. The raging dollar hurt U.S.
corporations with overseas sales. China’s devaluation of the yuan, in large part, because of a
12% correction of the Asian market in August-September, sparked fears that growth had hit
20 http://www.barrons.com/articles/2015-stock-market-in-review-1450511098

2016 State of the U.S. Economy
Page 19 of 21
the wall. Lastly, despite the rise in the U.S. dollar by 12% in 2014 and 10% in 2015, the Fed
didn’t increase rates as quickly as expected.
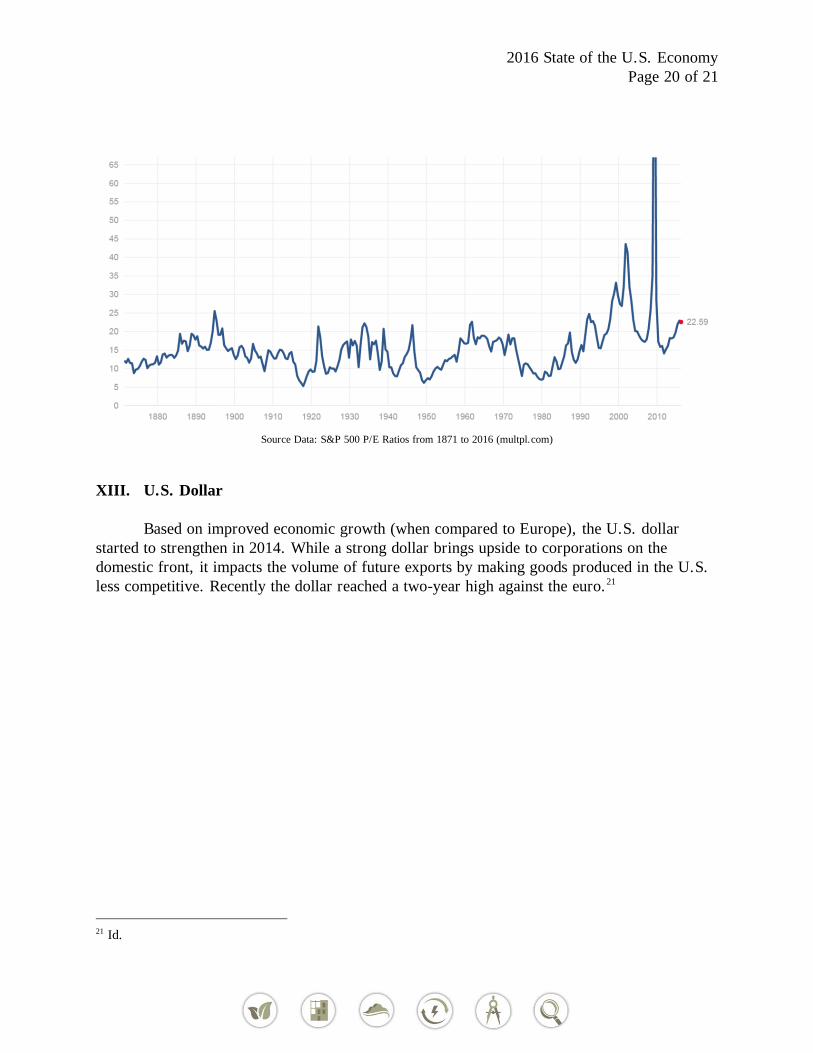
The average price-earnings (“P/E”) ratio for the S&P 500 over the past 25 years is
18.90; currently, the average P/E ratio is 22.6, up from 20.1 last year. Thus, public companies
appear to be slightly overvalued at this point. While stock prices are no longer cheap, they are
also not widely out of line with the pattern of the past several decades.
Source Data: S&P Dow Jones Indices LLC
2016 State of the U.S. Economy
Page 20 of 21
Source Data: S&P 500 P/E Ratios from 1871 to 2016 (multpl.com)
XIII. U.S. Dollar
Based on improved economic growth (when compared to Europe), the U.S. dollar
started to strengthen in 2014. While a strong dollar brings upside to corporations on the
domestic front, it impacts the volume of future exports by making goods produced in the U.S.
less competitive. Recently the dollar reached a two-year high against the euro. 21
21 Id.

2016 State of the U.S. Economy
Page 21 of 21
Source Data: Board of Governors of the Federal Reserve System