2018 jenny lind water system master plan final
TRANSCRIPT

2018 Jenny Lind Water System Master Plan
F I N A L
Calaveras County Water District
Prepared under the responsible charge of
Karl Brustad C 57869
80 Blue Ravine Road, Suite 280 Folsom, CA 95630

THIS PAGE LEFT INTENTIONALLY BLANK

Table of Contents Existing System .............................................................................................................................. 1
Introduction ................................................................................................................................. 1 Purpose and Specific Objectives ................................................................................................. 1 Existing Service Area ................................................................................................................. 1 Water Supply .............................................................................................................................. 2 Water Treatment Facilities .......................................................................................................... 2 Treated Water Distribution System ............................................................................................ 3
Treated Water Storage Facilities ............................................................................................. 4 Treated Water Pumping Stations & PRVs .............................................................................. 4 Treated Water Pipelines .......................................................................................................... 6
Baseline and Projected Demands .................................................................................................... 6 Baseline Average Daily Demands .............................................................................................. 6 Baseline Maximum Daily Demands ........................................................................................... 7 Baseline Water Demand Factors ................................................................................................. 8 Demand Projections .................................................................................................................. 11
Infill Growth ......................................................................................................................... 11 Buildout Average Daily Demand and Buildout Maximum Daily Demand .......................... 12 Buildout Year ........................................................................................................................ 15 Buildout Demand History ..................................................................................................... 15 System Demand Allocation .................................................................................................. 16
Existing and Future Regulations ................................................................................................... 19 Drinking Water Regulations ..................................................................................................... 19
Background ........................................................................................................................... 19 Existing and Proposed Federal Regulations ......................................................................... 19
State Regulations ...................................................................................................................... 22 Disinfection By-Products .......................................................................................................... 22 Water Age ................................................................................................................................. 24
System Evaluation ........................................................................................................................ 26 Treated Water Storage and Distribution ................................................................................... 26
Evaluation Criteria ................................................................................................................ 26 Raw Water Supply .................................................................................................................... 27
Calaveras River Intake and Pump Station ............................................................................ 27 Water Treatment ....................................................................................................................... 28 Treated Water Storage Evaluation ............................................................................................ 29 Treated Water Pumping Evaluation .......................................................................................... 30 Treated Water Pipeline Evaluation ........................................................................................... 31
Low System Pressure Areas.................................................................................................. 31 High System Pressure Areas ................................................................................................. 32 High Velocity Pipelines ........................................................................................................ 32 Fire Flow Deficiencies .......................................................................................................... 33
Recommended Improvements ...................................................................................................... 37 Raw Water Supply .................................................................................................................... 37 Intake Pump Station and Treatment Facility ............................................................................ 37 Treated Water Storage .............................................................................................................. 37 Treated Water Pumping ............................................................................................................ 38

Treated Water Distribution ....................................................................................................... 38 Low Pressure and High Velocity Improvements to Address Existing Deficiencies ............ 38 Improvements for Fire Flow Deficiencies ............................................................................ 41 PHD at Buildout .................................................................................................................... 42 Buildout MDD plus Fire Flow .............................................................................................. 43 New Developments ............................................................................................................... 44 Annual Pipe Replacement Program ...................................................................................... 44 Annual Infrastructure Repair and Replacement Program ..................................................... 44
Capital Improvement Plan ............................................................................................................ 44 Summary of Recommended Projects ........................................................................................ 45 Implementation Schedule ......................................................................................................... 47 Estimated Costs ......................................................................................................................... 47
Table of Tables Table 1. Jenny Lind Pressure Zones. .............................................................................................. 3 Table 2. Jenny Lind Water Storage Tanks. ..................................................................................... 4 Table 3. Jenny Lind Pump Stations. ............................................................................................... 4 Table 4. Jenny Lind PRVs. ............................................................................................................. 5 Table 5. Normally Closed Valves. .................................................................................................. 6 Table 6. Distribution System Characteristics.................................................................................. 6 Table 7: Baseline Average Daily Demand per the 2015 UWMP ................................................... 7 Table 8. Historic Connections and Demand. .................................................................................. 7 Table 9: Historic Maximum Daily Demand and Peaking Factors. ................................................. 8 Table 10: Baseline Maximum Daily Demand ................................................................................ 8 Table 11. Baseline Demand Factors. .............................................................................................. 9 Table 12. Planned/Proposed Developments. ................................................................................ 11 Table 13. Unplanned Area Growth. .............................................................................................. 12 Table 14. Subdivision Infill Growth. ............................................................................................ 12 Table 15. Infill Growth Summary. ................................................................................................ 12 Table 16: Buildout Average Daily and Maximum Daily Demand Factors .................................. 14 Table 17: Derivation of Residential GPCD .................................................................................. 14 Table 18: Water Loss Evaluation (AF/yr) .................................................................................... 15 Table 19. 2017 DOF Growth Rates for Calaveras County. .......................................................... 15 Table 20. Baseline Demand by Pressure Zone. ............................................................................ 16 Table 21. Baseline Demand by Tank Zone. .................................................................................. 17 Table 22. Recently Adopted and Proposed Federal Regulations. ................................................. 20 Table 23. Schedule for Promulgation of Safe Water Drinking Act Regulations (Current as of 2015). ............................................................................................................................................ 21 Table 24. Fire Flow Requirements. ............................................................................................... 27 Table 25. Evaluation of Available Storage under Baseline Demand Scenario. ............................ 29 Table 26. Evaluation of Available Storage at Buildout without Improvements. .......................... 29 Table 27. Evaluation of Treated Water Pumping. ........................................................................ 30 Table 28. Low Pressure Deficiencies under Baseline PHD. ......................................................... 32 Table 29: Pipe Improvements to Address Existing Low Pressure Deficiencies ........................... 39 Table 30. Improvements to Address High Velocity Deficiencies. ............................................... 41

Table 31. Recommended Projects to Improve Fire Flows at Deficient Nodes. ............................ 41 Table 32: Additional Improvements to the Buildout Pipe System to Address Remaining High Velocity and Low Pressure Deficiencies. ..................................................................................... 42 Table 33: Annual R&R Program Summary .................................................................................. 44 Table 34: Recommend Projects .................................................................................................... 45 Table 35: Estimated Costs for Capital Improvement Projects ...................................................... 48
Table of Figures Figure 1. Existing System Map. .................................................................................................... 10 Figure 2. Buildout System Map and Land Use Designations. ...................................................... 13 Figure 3: System Demand of Alternative Buildout Scenarios. ..................................................... 16 Figure 4: System Pressure Zones .................................................................................................. 18 Figure 5. TTHM Concentrations (MCL 80 ppb). ......................................................................... 23 Figure 6. HAA5 Concentrations (MCL 60 ppb). .......................................................................... 23 Figure 7. System Water Age Baseline ADD. ............................................................................... 25 Figure 8. Historic Storage Data for New Hogan Reservoir. ......................................................... 28 Figure 9. Low Pressure Nodes Baseline PHD. ............................................................................. 34 Figure 10. High Pressure Areas Baseline ADD. ........................................................................... 35 Figure 11. High Velocity Pipes Baseline PHD ............................................................................. 36 Figure 12. Recommended Projects ............................................................................................... 46
Appendices Appendix A – System Map Book Appendix B – Model Programming Appendix C – Baseline Node, Pipe, and Fire Flow Reports Appendix D – Buildout Node, Pipe, and Fire Flow Reports Appendix E – Recommended Projects

THIS PAGE LEFT INTENTIONALLY BLANK

2017 Jenny Lind Water Master Plan Calaveras County Water District 1 | P a g e
Existing System
Introduction The Calaveras County Water District (District) is updating the Jenny Lind Water Master Plan (WMP). The most recent WMP was published in 2006. This master plan report presents a summary of the results and findings for the 2017 Jenny Lind Water Master Plan update. The intent of this report is to provide a basis for managed upgrade of the water supply, treatment, storage, and distribution systems and develop a capital improvement plan. Construction of the first Jenny Lind Water Treatment Plant (WTP) was initiated in 1967 and given to the District for operation and maintenance in 1970. The treatment plant’s capacity was one million gallons per day (mgd) and served approximately 30 connections in the Rancho Calaveras area. By 1988, the Rancho Calaveras subdivision had expanded and a new La Contenta subdivision was added. La Contenta consumed water in excess of the treatment plant’s capacity. In 1988, the District completed the first Water System Master Plan for the area. Based on the master plan recommendations, the WTP was to be expanded to two mgd and subsequently five mgd to meet projected demand through 2010. The WTP’s second phase of expansion was completed in fall of 1997, expanding the WTP capacity to five mgd. In 2005, the Jenny Lind Water Master Plan was updated. The recommendations lead to the expansion of the WTP from five mgd to its current capacity of six mgd, which was completed in 2008.
Purpose and Specific Objectives The purpose of this master plan report is to describe water supply, treatment, storage, and distribution system improvements required to meet current and future service area needs. In particular, this master plan report provides the following information:
Delineation of the service area.
Characterization of historic water demands, including existing and projected average day, maximum day, and peak hourly demands (PHDs).
Description and evaluation of the existing facilities.
Identification of the improvements needed to meet growth, improve operations, comply with current and known future regulations, and correct deficiencies.
Recommendations for system improvements needed to serve buildout conditions.
Timelines and cost information for constructing the recommended improvements.
Existing Service Area The service area encompasses the community of Jenny Lind, the Rancho Calaveras Subdivision, and the La Contenta Subdivision. The service area is defined by the Sphere of Influence (SOI) presented in the 2017 Calaveras County Water District Sphere of Influence Report, in addition to the existing connections already being served outside the SOI. The topography ranges in elevations from approximately 200 feet in the

2017 Jenny Lind Water Master Plan Calaveras County Water District 2 | P a g e
southwestern portion of Rancho Calaveras to approximately 800 feet in the northeastern portion of the La Contenta subdivision. Hot summers and cool winters characterize the region, with temperatures ranging from the low 50's to the mid 90's. The elevation of the watershed is generally in the 4,000 ft range and one of the highest tributaries of the watershed is approximately 5,800 in elevation. Snow accounts for little of the precipitation in the watersheds supplying the study area.
These communities include a total of 3,755 existing connections spread out across the 8,068 acre service area. The current facilities include one raw water reservoir (the New Hogan Reservoir, owned and operated by others), one raw water diversion facility (Calaveras River pumped supply), one water treatment plant (Jenny Lind WTP), four pump stations, five treated water storage tanks, three hydropneumatic systems, and the associated distribution system. Appendix A provides a complete map book of the modelled distribution for reference.
Water Supply The Jenny Lind water system has one source of supply: the Calaveras River downstream of the New Hogan Reservoir. No groundwater sources are available. Historically, the water supply is of generally good quality and is easily treated to potable standards, with the exception of winter 2015 to summer 2016. The 2015 Butte Fire, in combination with the 2014 to 2016 drought, released significant levels of organics and manganese as rains washed the ash and debris into the reservoir. High concentrations of manganese in the raw water have required additional treatment and were enhanced by low water levels in the new Hogan Reservoir. The District has been allocated water for municipal, industrial, and agricultural use. The District obtains water from New Hogan Reservoir pursuant to agreements with the U.S. Bureau of Reclamation (USBR) and the Stockton East Water District (SEWD). This agreement allocates 43.5 percent of the New Hogan Project “conservation storage” yield to CCWD, typically estimated at 30,928 acre feet per year plus 350 acre feet per year in downstream riparian demand from New Hogan, for a total of 31, 278 acre feet per year. The Jenny Lind WTP draws its water from the Calaveras River approximately one mile downstream of the New Hogan Dam. For this reason, the raw water supply has qualities which are associated with both lake and river sources. The New Hogan Dam and Reservoir are owned and operated by the U.S. Army Corps of Engineers.
Water Treatment Facilities Raw water delivered to the WTP is collected via 12-inch-diameter perforated collector pipes installed in the Calaveras River. The collection pipes are bedded in drain rock and set one to three feet below the river channel. The raw water flows from the collector pipes by gravity to the intake manifold and is delivered to the influent pumps. The influent pump station includes three multi-stage vertical turbine pumps equipped with variable speed drives. Two of the pumps are rated for 1,900 gallons per minute (gpm) and the third pump is rated at 1,560 gpm; all three pumps deliver raw water to the treatment plant. The Jenny Lind WTP was upgraded in 2008 and has an ultimate capacity of 6.0 mgd. For consideration of treated water availability, this master plan uses 92.5 percent of the

2017 Jenny Lind Water Master Plan Calaveras County Water District 3 | P a g e
ultimate capacity of the WTP to account for water losses during backwash events. This equates to a firm capacity of approximately 5.55 mgd for planning purposes. The system includes chemical addition for taste and odor control, coagulation, and corrosion control. The water is first treated with ozone in two vertical baffled ozonation tanks. Potassium permanganate is then added at the base of the second ozone tower for additional pretreatment of manganese and organics. After further chemical addition for coagulation and disinfection, the water is passed through six parallel 1-mgd Microfloc treatment trains. The trains are prefabricated adsorption clarification/filtration units. After a corrosion control chemical is added, the treated water is sent to the clearwells and pumped from the clearwells to the A Tank. From A Tank, water enters the distribution system. The contact time is achieved in the clearwells at the WTP site, the dedicated pipeline to A Tank, and in A Tank. To address the increased organics and turbidity following the 2015 Butte Fire, the District is currently in the process of adding pretreatment at the WTP.
Treated Water Distribution System The distribution system is operationally divided into 14 pressure zones. The pressure zones allow water to be delivered at acceptable pressures to customers at a range of elevations. All the pressure zones are served by one of the five storage supply reservoirs. Apart from E Tank and 602 Tank, all the pressure zones are supplied by gravity via their respective storage tank. The pressure zones are summarized in Table 1 which presents the elevation ranges and the pressure ranges. The high pressure condition is given under static pressure conditions. The low pressure condition is given under the peak hour demand conditions.
Table 1. Jenny Lind Pressure Zones.
Pressure Zone Storage Supply
Elevation Range Low Pressure
(psi) – PHD Condition
High Pressure
(psi) – Static Condition Low (ft) High (ft)
A1 A Tank 356 712 17 162 A2 A Tank 382 427 79 82 A3 A Tank 299 575 17 166 A4 A Tank 257 361 62 107 A5 A Tank 216 306 55 112 A6 A Tank 298 414 47 132 B1 B Tank 513 747 30 1801 B2 B Tank 423 618 36 129 B3 B Tank 419 690 73 159 B4 B Tank 706 727 55 64 B5 B Tank 543 671 51 107 E E/F Tank 738 787 16 38 F F Tank 596 793 21 104
602 602 Tank 617 778 27 133 1 Pressure at lowest distribution node is 170. Pressure at pump station discharge is 180 psi.

2017 Jenny Lind Water Master Plan Calaveras County Water District 4 | P a g e
Treated Water Storage Facilities The existing water system includes five storage tanks in addition to the two clearwells that provide water storage for fire flow, emergency, and operational needs. These tanks are summarized in Table 2.
Table 2. Jenny Lind Water Storage Tanks.
Name Model
ID
Nominal Volume (gallons)
Ground Elevation
(ft) Diameter
(ft)
Maximum Water
Depth (ft)
Overflow Elevation
(ft) B Tank T2 1,000,000 898 78 31 929 602 Tank T5 150,000 821 40 17 838 E Tank T3 500,000 811 69 19 830 F Tank T4 1,000,000 811 98 19 830 A Tank T1 2,000,000 699 108 30 729 WTP Clearwell
T7009 80,000 538 46 7 545
WTP Clearwell 165,000 534 52 11 545 Treated Water Pumping Stations & PRVs
The boundaries between these pressure zones are defined by booster pumping stations, pressure regulating valves (PRVs), and isolation valves. Information about the booster pumping stations is summarized in Table 3. Information about the PRVs is summarized in Table 4.
Table 3. Jenny Lind Pump Stations.
Station Description Model ID Shutoff Head
(ft) Design Head
(ft) Design Flow
(gpm)
Pump Station A
Clear Well to A Tank
Pump 8 270 218 1,388 Pump 7 280 225 2,082 Pump 6 280 225 2,082
Pump Station B
A Tank to Zone B
Pump 5 560 341 600 Pump 4 560 341 600
Pump 3a1 560 341 600
Pump Station E &
F
A Tank to Zone E & F
Pump 3b1 560 138 820 Pump 2 210 138 834 Pump 1 210 138 834
Pump Station 602
Zone A to Zone 602
Pump 135 - 305 200 Pump 136 - 305 200
1 Pumps 3a and 3b are one pump which is modelled as two pumps because the pump operates as a swing pump in the event the primary pumps at Pump Station B or Pump Station E & F fail. The pump has two different operating points depending on if its pumping to Zone B or Zones E & F based on the zones HGL.

2017 Jenny Lind Water Master Plan Calaveras County Water District 5 | P a g e
Table 4. Jenny Lind PRVs.
Model ID
CCWD ID Location
From Zone
To Zone
Diameter (in)
Elevation (ft)
Effective HGL (ft)
Setting (psi)
401 JL-015 Baldwin & Rippon B1 B2 4 547 720 75
402 JL-014 Bergsma & Treosti B1 B2 4 618 701 36
403 JL-011 West Hill B1 B3 6 614 787 75
404 JL-012 Usher & Treosti B1 B3 6 618 786 73
406 JL-019 Baldwin & Garner A1 A3 6 419 680 113
408 JL-009 Friedman & Hironymous A1 A2 6 409 559 65
409 JL-010 Friedman & Coultrup A1 A2 6 409 571 70
410 JL-016 Friedman & Garner A1 A2 4 382 569 81
411 JL-005 Baldwin & Mann A3 A5 8 347 474 55
415 JL-007 Highway 26 & Garner A1 A3 10 353 683 143
420 - Jenny Lind Vista A3 - 6 379 610 100
4014 JL-007 Jenny Lind & Kirby A3 A5 8 301 469 73
403B - Baldwin & Treosti B3 A3 6 453 682 99
404B - Anderson & Yost B3 A3 6 496 669 75
New01 - Pardini & Sparrowk A3 A6 4 431 602 74
New02 - Hautly & Siegal A3 A6 4 482 583 44
New03 - Thornicroft & Cox B1 B4 4 727 854 55
New04 - Thornicroft & Cox B1 B4 4 706 831 54
New05 - Dunn & Bane B1 B5 6 607 790 79
New06 - Dunn B1 B5 6 671 785 49
New07 - O'Reilly & McAtee A3 A4 6 331 504 75
New08 - Goggin & McAtee A3 A4 6 392 503 48
New09 - Goggin & Redman A3 A4 6 409 502 40
1 Elevations and settings from InfoWater model, unless updated values were provided by the District.

2017 Jenny Lind Water Master Plan Calaveras County Water District 6 | P a g e
The District keeps some valves in the closed position to define pressure zone boundaries or to improve water quality. The normally closed valves are listed in Table 5.
Table 5. Normally Closed Valves.
Model ID Location Reason P17 Treosti Normally Closed P200 Ganer & Westhill Isolate Zone A1 and A3 P202 Conner Maintain Pressure P270 Coultrup & Friedman Isolate Zone A2 and A3 P531 Berkesey and Vista del Lago Isolate Zone A1 and F
P600 McAtee & Sparrowk Closed for Water Quality P90 Marsden & Heinemann Closed for Water Quality 900 Highway 26, West of Patridge Isolate Zone A1 and F 901 Huckleberry & Delin Isolate Zone A1 and F 902 Antonovich & Huckleberry Isolate Zone A1 and F
Treated Water Pipelines The distribution system model includes approximately 90 miles of distribution pipe ranging from four inches to 18 inches in diameter as shown previously in Figure 1. The Jenny Lind system is composed mainly of six-inch diameter mains. The smallest distribution pipe diameter found in the model is four inches. Figure 1 does not show some distribution lines in many of the cul-de-sacs, which in many cases are two inches in diameter. Table 6 summarizes the distribution system characteristics from the distribution system model.
Table 6. Distribution System Characteristics.
Pipe Diameters
18 inches - 71 feet 12 inches – 5.0 miles 10 inches - 7.5 miles 8 inches – 19.7 miles 6 inches – 57.6 miles 4 inches- 0.25 miles
Baseline and Projected Demands
Baseline Average Daily Demands The baseline average daily demands (ADD) presented in the 2015 UWMP have been adopted and used to represent the existing system for the Jenny Lind service area in this WMP. The baseline water demands developed in the 2015 UWMP are presented in Table 7. For comparison, Table 8 presents a summary of the annual WTP production records. The baseline water demand is less than 1% lower than the highest annual average daily demand on record. Use of the baseline demands presented in the 2015 UWMP provides consistency between planning documents and an accurate distribution of water demand by user type.

2017 Jenny Lind Water Master Plan Calaveras County Water District 7 | P a g e
Table 7: Baseline Average Daily Demand per the 2015 UWMP
Water User Type Baseline ADD (MGD/yr) Residential1 1.36 Commercial 0.03
Public Service 0.03 Landscape (Treated Water) 0.01
Losses + Other 0.50 Total 1.94
1Residential demands represent both the single family and multifamily water demands.
Table 8. Historic Connections and Demand.
Year New
Connections Number of
Connections
Treated Water (MG)
Average Daily Demand (MGD)
Average Demand Per Connection
(gpd/conn.) 2004 - 3,324 666 1.82 548 2005 1001 3,424 678 1.86 543 2006 1001 3,524 713 1.95 570 2007 1001 3,624 631 1.73 477 2008 23 3,647 640 1.75 479 2009 8 3,655 626 1.72 469 2010 14 3,669 567 1.55 423 2011 8 3,677 570 1.70 425 2012 4 3,681 667 1.83 495 2013 1 3,682 707 1.94 526 2014 6 3,688 577 1.58 429 2015 30 3,718 492 1.35 363 2016 37 3,755 - - -
1 New connections were not provided prior to 2007. It has been assumed that 100 new connections were added each year to present a conservative estimate of the demand per connection during peak water use years.
Baseline Maximum Daily Demands A maximum daily demand (MDD) of 4.65 MGD is used to model the existing system demand. The MDD was developed by applying the average maximum day peaking factor (2.4) to the baseline demand. While there are several days on record with demands peaking above 4.65 MGD, these peaks were isolated incidents were high demands were not sustained. The highest 2-day and 3-day average demands occurred in 2007 and were 4.44 MGD and 4.24 MGD respectively (see Table 9). The deviation between the MDD and the 2-day average demand is the result of delayed operator responses to low tank levels. Using 4.65 MGD as a baseline MDD better reflects the true maximum daily demand of the system. The baseline MDD by user type used to represent the system are presented in Table 10.
.

2017 Jenny Lind Water Master Plan Calaveras County Water District 8 | P a g e
Table 9: Historic Maximum Daily Demand and Peaking Factors.
Year
Average Daily
Demand (MGD)
Maximum Daily
Demand (MGD)
Maximum 2-Day
Average Demand
Maximum 3-Day
Average Demand
Maximum Day
Peaking Factor
2004 1.8 4.3 - - 2.4 2005 1.9 4.7 - - 2.5 2006 2.0 4.7 - - 2.4 2007 1.7 5.0 4.44 4.24 2.9 2008 1.8 4.4 3.94 3.75 2.5 2009 1.7 4.2 3.77 3.59 2.5 2010 1.6 4.1 3.66 3.47 2.6 2011 1.6 3.9 3.56 3.28 2.5 2012 1.8 3.8 3.58 3.56 2.1 2013 1.9 4.2 3.85 3.73 2.1 2014 1.6 3.2 2.90 2.75 2.0 2015 1.4 2.8 2.48 2.42 2.1
Average 1.7 4.1 - - 2.4
Table 10: Baseline Maximum Daily Demand
Water User Type Baseline MDD (MGD) Residential 3.25 Commercial 0.07
Public Service 0.08 Landscape (Treated Water) 0.03
Losses + Other 1.20 Total 4.65
Baseline Water Demand Factors The 2015 UWMP baseline water demands have been adapted to develop user type based demand factors (DF). The baseline water demand factors are presented in Table 11 and are used to model the existing system. The baseline demands were developed by dividing the user demand by user type by the total area of corresponding user type.
Areas were determined by mapping the District’s current list of connections (using APNs provided by the District) to the County’s Land Use Map. Of the 3,755 connections provided by the District, 3,657 matched the County records. These 3,657 connections are used to model the extent of the existing system area and land use types. Figure 1 presents the existing system map.

2017 Jenny Lind Water Master Plan Calaveras County Water District 9 | P a g e
Table 11. Baseline Demand Factors.
User Type Baseline
Area (Acre)
Baseline ADD
(MGD)
Baseline ADD Demand Factor
(gpm/Acre)
Baseline MDD
(MGD)
Baseline MDD
Demand Factor
(gpm/Acre) Residential 42171 1.355 0.22 3.25 0.54 Commercial 72 0.029 0.29 0.07 0.69 Public Service 7 0.035 3.58 0.08 8.60 Landscape 4 0.014 2.41 0.03 5.78 Losses + Other 42992 0.502 0.08 1.20 0.19 Total 4299 1.94 - 4.65 - 1 Existing Residential area is the sum of low density, medium density, rural residential and transition residential parcels. 2 Losses and Other demands applied evenly across the total area of the existing system.

THIS PAGE LEFT INTENTIONALLY BLANK

"M
"M"M"M
"M"M"M!¬̂
!!̂
!!̂
!!̂
!!̂
!!̂
FIGURE
1JENNY LIND WATER MASTER PLAN
1180 Iron Point Rd., Suite 260Folsom, CA 95630
Phone: (916) 608-2212Fax: (916) 608-2232
0 0.75Miles
p 1" = 0.75 mi.
Legend
!!̂ Tank
"M Pump
Existing Connections
Notes:1. The service area has been adopted from the Local Agency Formulation Comission (LAFCO) boundary
for the Jenny Lind water service area.
B Tank
Jenny Lind WTP and Pump Station A
E Tank
F Tank
602 Tank
602 Pump Station
A Tank, Pump Station B,and Pump Station E&F
New Hogan Reservoir

THIS PAGE LEFT INTENTIONALLY BLANK

2017 Jenny Lind Water Master Plan Calaveras County Water District 11 | P a g e
Demand Projections Buildout water demands have been developed assuming complete infill of the Jenny Lind service area. The following subsections document the means and methods for assessing developments and demands.
Infill Growth The Jenny Lind service area has not reached buildout and has considerable room to support future developments. Of the 8,068 acres within the service area, 6,805 acres are zoned for development with only 4,299 acres developed to date. This leaves approximately 2,250 acres available for future connections residential connections, and 256 acres available for future non-residential connections. An estimated 6,533 residential connections are anticipated to fill the area zoned for residential development at buildout. The infill connections were determined through the combined effort of using planned/proposed developments provided by the District, estimating the number of parcels in unplanned areas, and estimating the number of new connections from existing parcel subdivisions. The District identified 10 proposed/planned developments. These developments and the associated number of planned connections is presented in Table 12.
Table 12. Planned/Proposed Developments.
Development Area (acre)
Planned/Proposed Infill Connections Land Use Type
North Vista Plaza 28 156 Residential Low Density Old Golden Oaks
116 96 Residential Low Density
Mission Ranch 219 Residential Low Density Hogan Oaks I 41 122 Residential Low Density Hogan Oaks II 40 122 Residential Low Density Hogan Oaks III 27 29 Transition Golden Creek Estate III 45 100 Residential Low Density New Hogan Lakes 29 83 Residential Low Density Del Verde 40 91 Residential Low Density Spring Valley Springs 71 71 Residential Low Density West Gate 7 45 Residential Low Density Total 444 1,134 -
The unplanned areas are assumed to be developed at buildout based on the existing average parcel density size by zoned land use type. Table 13 summarizes the number of homes anticipated in unplanned areas.

2017 Jenny Lind Water Master Plan Calaveras County Water District 12 | P a g e
Table 13. Unplanned Area Growth.
Land Use Type
Existing Parcel Density
(parcels/acre) Unplanned
Area Unplanned Infill
Connections Residential Low Density 2.61 80 208
Residential Medium Density 4.01 3 13 Transition Residential 0.14 454 65
Rural Residential 0.78 1,269 1,001 Total - 1,806 1,287
Large parcels were assumed to be subdivided at buildout if the lot was three or more times greater than the average density. The number of infill connections associated with parcel subdivisions is presented in Table 14.
Table 14. Subdivision Infill Growth.
Land Use Type Parcel Density (parcels/acre) Subdivision Infill Connections Residential Low Density 2.61 261
Residential Medium Density 4.01 5 Transition 0.14 1
Rural 0.78 233 Total - 500
The service area is estimated to support 6,533 residential connections at buildout. The total number of connections is summarized in Table 15.
Table 15. Infill Growth Summary.
Infill
Residential Low
Density
Residential Medium Density Transition Rural Total
Existing Connections Modelled 901 29 81 2,601 3,6571
Planned/Proposed Connections 1,105 0 29 0 1,134
Unplanned/Undeveloped Connections 208 13 65 1,001 1,287
Subdivision Infill Connections 261 5 1 233 500
Total 2,475 47 176 3,835 6,533
Buildout Average Daily Demand and Buildout Maximum Daily Demand Buildout water demands are used to model the future demands of the Jenny Lind service area assuming complete infill (see Figure 2). The buildout ADD and MDD demand factors are summarized in Table 16. The sources and rational for the demand factors are presented in detail below.

FIGURE
2JENNY LIND WATER MASTER PLAN
BUILDOUT CONNECTIONS AND LANDUSE DESIGNATIONS1180 Iron Point Rd., Suite 260
Folsom, CA 95630Phone: (916) 608-2212
Fax: (916) 608-2232
0 0.75Milesp 1" = 0.75 mi.
LegendSERVICE AREA BOUDNARY
COMMUNITY CENTER
RESIDENTIAL LOW DENSITY
RESIDENTIAL MEDIUM DENSITY
RURAL RESIDENTIAL
RESIDENTIAL TRANSITION
PUBLIC SERVICE
IRRIGATION
COMMERCIAL
RESOURCE PRODUCTION
Notes:1. Parcel data provided by Calaveras County was used to designate land use at buildout.2. Parcels west of Valley Springs are zoned as Community Center or Industrial. Water demand for these parcels is assumed to equal low density residential demand. 3. Refer to the most recent General Plan for the most current land use data.
2

THIS PAGE LEFT INTENTIONALLY BLANK

2017 Jenny Lind Water Master Plan Calaveras County Water District 14 | P a g e
Table 16: Buildout Average Daily and Maximum Daily Demand Factors
User Type
Buildout Area
(Acre)
Buildout ADD
(MGD)
Buildout ADD Demand Factor
(gpm/Acre)
Buildout MDD1 (MGD)
Buildout MDD Demand Factor
(gpm/Acre) Residential 6,466 2.22 0.24 5.34 0.57 Commercial 163 0.09 0.36 0.20 0.87 Public Service 100 0.04 0.26 0.09 0.62 Landscape 76 0.06 0.56 0.15 1.35 Losses + Other 6,805 0.84 0.09 2.02 0.21 Total 6,805 3.25 - 7.80 - 1The build ADD demand was scaled by max day peaking factor (2.4) to estimate the buildout MDD. The derivation of the max day peaking factor is described in Baseline Maximum Daily Demand subsection.
The average residential demand is estimated at 2.2 mgd based on the buildout population and a gallons per capita day (GPCD) demand of 141.2 for residential users. The residential GPCD was determined by evaluating demand per capita used in the recommended 2015 UWMP demand projections. The recommended demand approach in 2015 UWMP used a common demand per capita to project future demands. Table 17 presents the data used to derive the GPCD from the data presented in the 2015 UWMP.
The infill analysis presented in the previous section identified 6,533 potential residential connections at buildout. Utilizing the 2.41 capita per connection from the County’s General Plan, the buildout population is estimated to be 15,745; therefore, the average buildout water demand for residential water users is approximately 2.2 mgd.
Table 17: Derivation of Residential GPCD
Year Baseline 2020 2025 2030 2035 2040
Jenny Lind Population1 9,592 10,226 10,739 11,136 11,469 11,671
UWMP Single Family Demand2 (AF/yr) 1,515 1,615 1,696 1,759 1,811 1,843 UWMP Multi Family Demand2 (AF/yr) 3 3 3 3 3 3 UWMP Residential (AF/yr) 1,518 1,618 1,699 1,762 1,814 1,846 Residential Demand (AF/yr-person) 0.1583 0.1582 0.1582 0.1582 0.1582 0.1582 Mean Residential Demand (AF/person-yr) 0.1582 Mean Residential-GPCD (gal/person-day) 141.2 12015 UWMP Table 3-4 22015 UWMP Table E-3
The commercial, landscape, and public service buildout demand factors were adopted directly from Appendix F of the 2015 UWMP. Losses at buildout were developed by deriving the percentage of water losses presented in the 2015 UWMP. Similar to the residential GPCD, losses are consistently 35 percent of the residential and non-residential (commercial, irrigation, and landscape) demands for all future demand projections. To be consistent with the 2015, this relationship was used to calculate the average daily loss demand at buildout. Table 18 presents demand data from the 2015 UWMP to support the water loss evaluation.

2017 Jenny Lind Water Master Plan Calaveras County Water District 15 | P a g e
Table 18: Water Loss Evaluation (AF/yr)
Year 2015 2020 2025 2030 2035 2040 Single Family 1,515 1,615 1,696 1,759 1,811 1,843 Multi-Family 3 3 3 3 3 3 Commercial 33 35 36 38 39 40 Public Service 39 41 43 45 46 47 Landscape 16 17 18 19 19 19 Other 6 6 6 6 6 6 Losses 556 592 622 645 664 675 Total 2,168 2,309 2,424 2,515 2,588 2,633 Percent Losses (of Res. and Non. Res.) 35% 35% 35% 35% 35% 35%
Buildout Year
Buildout is anticipated to occur in year 2150 when the District population grows to 15,745 residents. The buildout year was determined based on the 2017 Department of Finance (DOF) population growth rates for Calaveras County. Growth rates are projected until year 2060 in five year increments. Projections beyond 2060 were assumed to equal the 2055-2060 growth rate. Table 19 presents the DOF population growth rates.
Table 19. 2017 DOF Growth Rates for Calaveras County.
Years 2016-2020
2021-2025
2026-2030
2031-2035
2036-2040
2041-2045
2046-2050
2051-2055
2056-2060
2061 - 2150
Growth Rate 0.59% 2.17% 2.14% 1.53% 0.82% 0.46% 0.64% 1.28% 2.17% 2.17%
Population at End of Period 9,648 9,858 10,068 10,223 10,306 10,354 10,420 10,553 10,782 15,745
Number of Connections at End of Period
3777 3859 3941 4002 4035 4053 4079 4131 4221 6,533
Buildout Demand History The buildout demand used in this WMP differs from the methods used for prior water master plans. Traditionally, water master plans will base buildout demands on the historical demand per connection observed over a period of record. Others will use a district standard which provides an added factor of safety. This WMP aligns the system demands with SB X7-7 20x2020 Water Conservation Plan presented in the 2015 UWMP. The selected method is expected to accurately represent the future demands given that the District is complying with SB X7-7 goals and that it will need to continue complying with these goals in order to remain eligible for State water grants and loans.
While the District is expected to remain in compliance with the 2015 UWMP, it is still important to understand alterative demand scenarios. Figure 3 compares the three alternative buildout demand scenarios. The “UWMP Approach” scenario presents the future demand based on the 2015 UWMP, which is used to model the buildout system. The “Historic Approach” scenario presents future demand based on the highest historical

2017 Jenny Lind Water Master Plan Calaveras County Water District 16 | P a g e
ADD of 570 GPCD (see Table 8 for derivation of “Historic Approach” GPCD). The “2005Approach” scenario presents the future demand based on CCWD’s design standard of 750 GPCD, which was used to model the buildout system in the 2005 WMP.
The comparison of demand approaches in buildout ADD is as follows: UWMP 497 GPCD, Historic 570 GPCD, 2005 750 GPCD. The recommended demand approach is consistent with long term conservation goals and represents a significant reduction in demands from the other approaches.
Figure 3: System Demand of Alternative Buildout Scenarios.
System Demand Allocation The existing system is divided into pressure zones so that water can be delivered at acceptable pressures to customers at a range of elevations. Baseline and buildout demands were allocated throughout the model and summed to estimate the demand within each pressure zone. This process was repeated to estimate the demand by tank zone. Subtotals were calculated for the A Tank and B Tank zones, which serve lower pressure zones that have no storage of their own. The allocations of demands by pressure zone are shown in Table 20 and by tank zone in Table 21. Figure 4 presents a map of the system pressure zones.
Table 20. Baseline Demand by Pressure Zone.
Pressure Zone Acres Percent of Total
Area Baseline MDD
(mgd) Buildout MDD
(mgd) A1 1,764 21.9% 1.03 1.74 A2 74 0.9% 0.07 0.09 A3 1,112 13.8% 0.78 1.14 A4 132 1.6% 0.12 0.17 A5 707 8.8% 0.41 0.59 A6 303 3.8% 0.10 0.16 B1 896 11.1% 0.70 0.99 B2 383 4.7% 0.30 0.46 B3 494 6.1% 0.34 0.51 B4 60 0.7% 0.02 0.04
0
2
4
6
8
10
12
14
2015 2035 2055 2075 2095 2115 2135 2155
Syst
em D
eman
d (M
GD
)
Year
2005 Approach - MDD
Historic Approach - MDD
UWMP Approach - MDD
2005 Approach - ADD
Historic Approach - ADD
UWMP Approach - ADD

2017 Jenny Lind Water Master Plan Calaveras County Water District 17 | P a g e
Pressure Zone Acres Percent of Total
Area Baseline MDD
(mgd) Buildout MDD
(mgd) B5 39 0.5% 0.02 0.03
E1 & F1 1,684 20.9% 0.52 1.60 602 420 5.2% 0.31 0.32
Total 8,068 100 % 4.65 7.8 1 Demands by pressure zone are outputs from the model allocation and are subject to rounding error due to model precision.
Table 21. Baseline Demand by Tank Zone.
Tank Zone Acres Percent of Total
Area Baseline MDD
(mgd) Buildout MDD
(mgd) A Tank 8070 100.0 percent 4.65 7.8 B Tank 1,872 23.2 percent 1.37 2.0
E & F Tank 1,684 20.9 percent 0.52 1.6 602 Tank 420 5.2 percent 0.31 0.3
1 Demands by pressure zone are outputs from the model allocation and are subject to rounding error due to model precision.

A
A
AA
A
A
A
A
A
AAA
A
A
A
A
AA
A A
AA
AA
A AA
^
^
^
^
^
^
FIGURE
42017 Jenny Lind Water Master Plan
Pressure Zones1180 Iron Point Rd., Suite 260Folsom, CA 95630
Phone: (916) 608-2212Fax: (916) 608-2232
0 0.75Milesp 1" = 0.75mi
Legend^ Tank
Status
A Active
A Isolation
602
A1
A2
A3
A4
A5
A6
B1
B2
B3
B4
B5
E
FNotes:1. Isolation valves shown are PRVs that have been closed by the district due to water quality concerns.
F ZoneElevation Range: 596 - 793 ftPressure Range: 21 - 104 psi
A1 ZoneElevation Range: 356 -712 ftPressure Range: 17 -162 psi
602 ZoneElevation Range: 617 - 778 ftPressure Range: 27 -133 psi
B5 ZoneElevation Range: 543 - 671 ftPressure Range: 51 - 107 psi
B4 ZoneElevation Range: 706 - 727 ftPressure Range: 55 - 64 psi
B1 ZoneElevation Range: 513 - 747 ftPressure Range: 30 - 170 psi
E ZoneElevation Range: 738 - 787 ftPressure Range: 16 - 38 psi
B3 ZoneElevation Range: 419 - 690 ftPressure Range: 73 - 159 psi
A3 ZoneElevation Range: 299 - 575 ftPressure Range: 17 - 166 psi
A6 ZoneElevation Range: 298 - 414 ftPressure Range: 47 - 132 psi
A5 ZoneElevation Range: 216 - 306 ftPressure Range: 55 - 112 psi
A4 ZoneElevation Range: 257 - 361 ftPressure Range: 62 - 107 psi
A2 ZoneElevation Range:382 - 427 ftPressure Range: 79 - 82 psi
Isolation valve not shown isolates E Zone from A1 Zone
Isolation valve not shown isolates A1 Zone from A2 Zone

THIS PAGE LEFT INTENTIONALLY BLANK

2017 Jenny Lind Water Master Plan Calaveras County Water District 19 | P a g e
Existing and Future Regulations
Drinking Water Regulations The quality of the water provided by existing and any future facilities must meet all existing and proposed regulatory requirements. A summary of the existing and proposed drinking water quality regulations covering surface water and groundwater sources is below.
Background The Safe Drinking Water Act (SDWA) of 1974 gave the United States Environmental Protection Agency (EPA) the authority to set standards for contaminants in drinking water supplies. The EPA established primary regulations for the control of contaminants that affect public health and secondary regulations for compounds that affect the taste, odor or aesthetics of drinking water. Under the provisions of the SDWA, the California Department of Drinking Water (DDW) has the primary enforcement responsibility. Title 22 of the California Administrative Code establishes DDW authority and stipulates State drinking water quality and monitoring standards.
Existing and Proposed Federal Regulations The EPA has recently finalized and is in the process of finalizing several new regulations since the 1986 and 1996 Amendments to the SDWA. These regulations address both surface water and groundwater. Significant final and proposed regulations are shown in Table 22. The schedule for promulgation of the Safe Water Drinking Act Regulations (Current as of 2015) is shown in Table 23.

2017 Jenny Lind Water Master Plan Calaveras County Water District 20 | P a g e
Table 22. Recently Adopted and Proposed Federal Regulations.
Regulations Year Rule Finalized Targeted Contaminants
National Interim Primary Drinking Water Regulations 1975 Set maximum levels for a wide variety of
contaminants Total Trihalomethanes 1979 Trihalomethanes Fluoride Rule 1986 Fluoride limits
Surface Water Treatment Rule 1989 Giardia lamblia, viruses, Legionella and heterotrophic plate count
Total Coliform Rule 1989 Representative sampling of the distribution system for total and fecal coliform
Phase II Rule (organics) 1991 VOCs, SOCs and IOCs Lead and Copper Rule 1991 Lead and copper corrosion products Phase V Rule (organics) 1992 VOCs, SOCs and IOCs
Source Water Protection 1997 Delineate boundaries and determine origins and susceptibility of water supplies to contamination
Stage 1 Disinfection/Disinfection By-products Rule (D/DBPR) 1998
Disinfection Byproducts (THMs and HAAs); compliance date for systems serving greater than 10,000 was January 2002
Interim Enhanced Surface Water Treatment Rule (IESWTR) 1998 Giardia, Cryptosporidium, Turbidity, DBPR profiling
Variance and Exemptions Rule 1998 Variance and exceptions to help public water systems achieve compliance with MCLs
Arsenic Rule 2001 Arsenic Filter Backwash Rule 2001 Filter backwash recycle Long-term 1 Enhanced Surface Water Treatment Rule 2002 Microbiological, Turbidity and control of DBPs
Public Health Security and Bioterrorism Prevention and Response Act 2002 Vulnerability Assessments
Radon Rule 2004 Radon
Contaminant Candidate List 2 2004 CCL1 required no new regulated contaminants, CCL2 may include perchlorate, metolachor and MTBE
Stage 2 Disinfectants/Disinfection Byproducts Rule 2004 Introduces locational running annual average
compliance for the 80/60 TTHM/HAA5 requirements Long-term 2 Enhanced Surface Water Treatment Rule 2006 Introduction of microbial toolbox for control of
Cryptosporidium Groundwater Rule 2004 Microbial protection of groundwater supplies Reduction of Lead in Drinking Water Act (RLDWA) 2011 Use of lead free pipes, fittings, fixtures, solder and
flux for drinking water Revised Total Coliform Rule 2014 E Coli and Total Coliforms Drinking Water Protection Act (DWPA) 2015 Algal Toxins1
1 The DWPA is an amendment to the SWDA. It requires Congress to develop a strategic plan to assess and manage the risks associated with algal toxins in public drinking water supplies. No new regulations were imposed with the amendment to the SWDA.

2017 Jenny Lind Water Master Plan Calaveras County Water District 21 | P a g e
Table 23. Schedule for Promulgation of Safe Water Drinking Act Regulations (Current as of 2015). Regulation Proposed Final Effective
Fluoride 11/85 4/86 10/87 Trihalomethanes 2/78 11/79 11/83 8 VOCs (Phase I) 11/85 7/87 1/89 Surface Water Treatment Rule (SWTR) 11/87 6/89 6/93 Coliform Rule 11/87 6/89 12/90 Lead and Copper 8/88 6/91 1/921 Minor Revisions to Lead and Copper 4/98 1/00 1/01 26 Synthetic Contaminants8, Seven Inorganic Contaminants (Phase II) 5/89 1/912 7/92 MCLs for barium, pentachlorophenol (Phase II) 1/91 7/91 1/93 Phase V Organics, Inorganics 7/90 7/92 1/94 Radionuclides (Phase III) Except Radon 4/00 12/00 12/03 Radionuclides (Phase III) Radon 11/99 8/013 8/044
Sulfate 12/94 Decision on whether to regulate due 8/01
MCLs for aldicarb, aldicarb sulfoxide, aldicarb sulfone Administrative hold; no current schedule available Disinfectants/Disinfection Byproducts, Stage 1 DBPR 7/94 12/983 1/026,7 Disinfectants/Disinfection Byproducts, Stage 2 DBPR 9/01 5/02 5/05 Information Collection Rule 2/94 5/96 Completed Interim ESWTR 7/94 12/983 1/026 Interim ESWTR, Stage 1 Long Term Enhanced SWTR 4/00 8/01 1/04 Interim ESWTR, Stage 2 Long Term Enhanced SWTR 9/01 5/02 5/05 Filter Backwash Recycle Rule 4/00 6/01 12/03 Consumer Confidence Reports Rule 2/98 8/98 9/98 Ground Water Rule (GWR) 5/00 11/01 6/04 Operator Certification, State Guidance 3/98 2/99 2/01 Unregulated Contaminants, Monitoring Only9 2/99 9/99 1/01 Five New Drinking Water Contaminants 8/00 8/01 8/04 Chlorine Gas as Restricted Use 9/00 10/01 10/03 Source Water Protection Program, Guidance5 8/97 Completed Completed Arsenic Rule 6/00 1/01 1/06 Revised Total Coliform Rule - 4/14 4/16 Notes: 1 Start date for tap monitoring in systems of more than 50,000 consumers. 2 Maximum Contaminant Level (MCL), MCL + Goal (MCLG) for atrazine to be reconsidered. 3 Dates mandated by district court 4 Assumes regulation in effect three years after final promulgation. 5 Program required as part of 1996 amendment. 6 For Public Water Systems (PWS) serving more than 10,000 consumers 7 Effective January 2004 for PWS serving more than 10,000 consumers. 8 MCL for atrazine to be revisited. 9 Tiered monitoring approach pending availability of analytical methods.

2017 Jenny Lind Water Master Plan Calaveras County Water District 22 | P a g e
State Regulations The State of California retains primacy for enforcement of drinking water regulations. In this role, the state must adopt regulations equal to or more stringent than federal regulations. For the most part, state regulations are equal to federal regulations with the following exceptions: Cryptosporidium Action Plan - The State set additional more stringent standards
for the recycle of filter backwash and other recycle streams. California IESWTR - The State has increased the required level of monitoring for
filters and may require additional inspections, monitoring and reporting. Source Water Assessment - The State has structured its SWAP program to allow
water utilities to conduct their own assessments to help improve and preserve water quality of the public water supply sources.
Disinfection By-Products
Starting on January 1, 2004, trihalomethane (TTHM) and haloacetic acids (HAA5) monitoring and compliance is required under the Federal Environmental Protection Agency (EPA) regulations for systems with service populations of 500 to 9,999 that use treated surface water supplies. There are four monitoring points for disinfection byproducts (DBPs) within the Jenny Lind WTP distribution system. Monitoring records indicate that total TTHM (Figure 5) and HAA5 (Figure 6) levels have increased since September 2014. When DBPs are observed at levels close to or above their respective maximum contaminant level (MCL), they can be minimized by periodically flushing fire hydrants to reduce the water age. Minimizing the water age reduces the time for DBPs to form, thus keeping levels low. While flushing fire hydrants may be appropriate during normal conditions, it is not appropriate during drought conditions. Recent samples have measured DBPs above the 80 parts per billion (ppb) (TTHM) and 60 ppb (HAA5) MCLs. No violations have occurred as the quarterly average has remained below the MCL, however, the data shows a trend of increasing levels. The new pretreatment system at the WTP is expected to lower the DBP levels. No added treatment is expected to be necessary to remain in compliance with DBP requirements.

2017 Jenny Lind Water Master Plan Calaveras County Water District 23 | P a g e
Figure 5. TTHM Concentrations (MCL 80 ppb).
Figure 6. HAA5 Concentrations (MCL 60 ppb).
0
10
20
30
40
50
60
70
80
90
100
Jan-11 Jan-12 Jan-13 Jan-14 Jan-15 Jan-16 Jan-17
TTH
M C
once
ntra
tion
(ppb
)
Oak Ridge
Danaher
Honda
Myrtyle
0
10
20
30
40
50
60
70
Jan-11 Jan-12 Jan-13 Jan-14 Jan-15 Jan-16 Jan-17
HA
A5
Con
cent
ratio
n (p
pb)
Oak Ridge
Danaher
Honda
Myrtle

2017 Jenny Lind Water Master Plan Calaveras County Water District 24 | P a g e
Water Age An extended period simulation water age analysis has been performed on the existing distribution and storage system under average day demands. The WTP is not detailed in the hydraulic model so water coming from the clearwell is considered “new” water (i.e., zero hours old). The hydraulic model water age analysis then calculates the age of the water after leaving the WTP (clearwell). Pump controls were added to the model as provided by the WTP operator, indicating at what tank levels pumps cycle on or off. Based on the analysis, water is oldest in the 602/A-1 Tank Zones and nodes in the E&F Zone with zero existing demands. Figure 7 shows the range of values of water age, in hours, throughout the distribution system. 602 Zone is known to have existing water quality issues due to water age.

>
^
^
^
^
^
48.0
0
72.0
0
24.0
0
96.00
120.00144.0
0
168.00
192.0
0
48.0
0
168.00
144.0
0
48.0
0
96.0
0
48.0
0
96.00
48.00
72.0
0
96.0
0
48.0
0
72.00
96.00
72.0
0
72.00
72.0
0
120.0
0
72.00
120.00
FIGUREJenny Lind Water Master Plan
System Water AgeBaseline 1180 Iron Point Rd., Suite 260
Folsom, CA 95630Phone: (916) 608-2212
Fax: (916) 608-2232 p 1" = 0.75 mi.
Max. Water Age (Hours)0
24
48
72
96
120
144
168
192
216
240
0 0.75Miles

THIS PAGE LEFT INTENTIONALLY BLANK

2017 Jenny Lind Water Master Plan Calaveras County Water District 26 | P a g e
System Evaluation
The Jenny Lind water system was evaluated to identify deficiencies in meeting current District standards. The infrastructure for raw water supply, water treatment, storage, and distribution were evaluated using District and other criteria.
Treated Water Storage and Distribution Evaluation Criteria
The Jenny Lind water system will be evaluated for its ability to meet existing and future water demands and to comply with the District’s Design and Construction Standards. Two different scenarios will be analyzed as part of the 2017 WMP: 1. Existing System 2. Future System at Build-out The system will be divided into five categories for this evaluation: water supply, water treatment, storage, pumping, and piping. The district provided a system-wide hydraulic model that was updated in 2013 to analyze the system’s distribution facilities, including storage, pumping, and piping. The system model has been updated to capture new demand criteria and any new or replacement water mains installed since the last model update. A comprehensive list of model programming is included as Appendix B. A summary of the system evaluation planning criteria is presented below. System Model Criteria: • Baseline Demand (ADD) = 1.94 MGD • Buildout Demand (ADD) = 3.25 MGD • MDD Factor = 2.4 • PHD Factor = 1.5 Water Treatment Design Criteria: • Treatment Plant Capacity: Hydraulic and treatment capacity sized to meet MDD. Water Storage Design Criteria1:1 • Storage tank sizing shall be equal to the sum of the following three components:
o Fire Storage Reservation: A minimum of four hours times the appropriate fire flow demand (presented in Table 24 below).
o System Peaking Storage: Equal to 20 percent of the maximum day flow. o Emergency Storage: Equal to four hours of the MDD.
• Fire Storage may be supplemented by pumps. Water Pumping Criteria2: • Pump stations shall be able to deliver the MDD with the largest pump out of service.
Peak hour demands and fire flows are expected to be supplied by storage without additional pumping. If the uphill zone does not have adequate storage for fire flow,
1 Per the Construction and Design Standards (January 2009) 2 Per the Jenny Lind Water System Master Plan (June 2005)

2017 Jenny Lind Water Master Plan Calaveras County Water District 27 | P a g e
the booster pump station should have the ability to deliver the fire flow to the higher zone.
Existing System Piping System Design Criteria1: • Transmission Lines: Hydraulic capacity sized to pass PHD at a maximum velocity of
five feet per second (ft/s) and/or MDD plus fire demand, while maintaining 20 psi residual pressure in the system.
• Hazen Williams “C” Factor: Pipes shall use a “C” factor of 130 for new pipe and 110 for existing pipe.
• Fire Flow Requirements5: A maximum velocity of 12 ft/s shall apply to fire flow conditions and the minimum velocity shall be two ft/s. The existing Jenny Lind Fire District minimum fire flow requirements are listed in Table 24.
• System Pressure: o System shall maintain a minimum pressure of 40 psi under PHD. o System shall maintain a maximum pressure of 120 psi under static conditions.
Table 24. Fire Flow Requirements2.
Development Required Fire Flow
(gpm) Residential Districts and/or Individual Dwellings < 3,600 Sq. Ft.2,4 1,000 Commercial/Industrial Districts and/or Individual Dwellings > 3,600 Sq. Ft.2,4 1,500 Undeveloped Commercial/Industrial Districts 1,500
Raw Water Supply The existing facilities and infrastructure used by the District to collect raw water have been evaluated for ability to convey the existing and projected demand discussed previously.
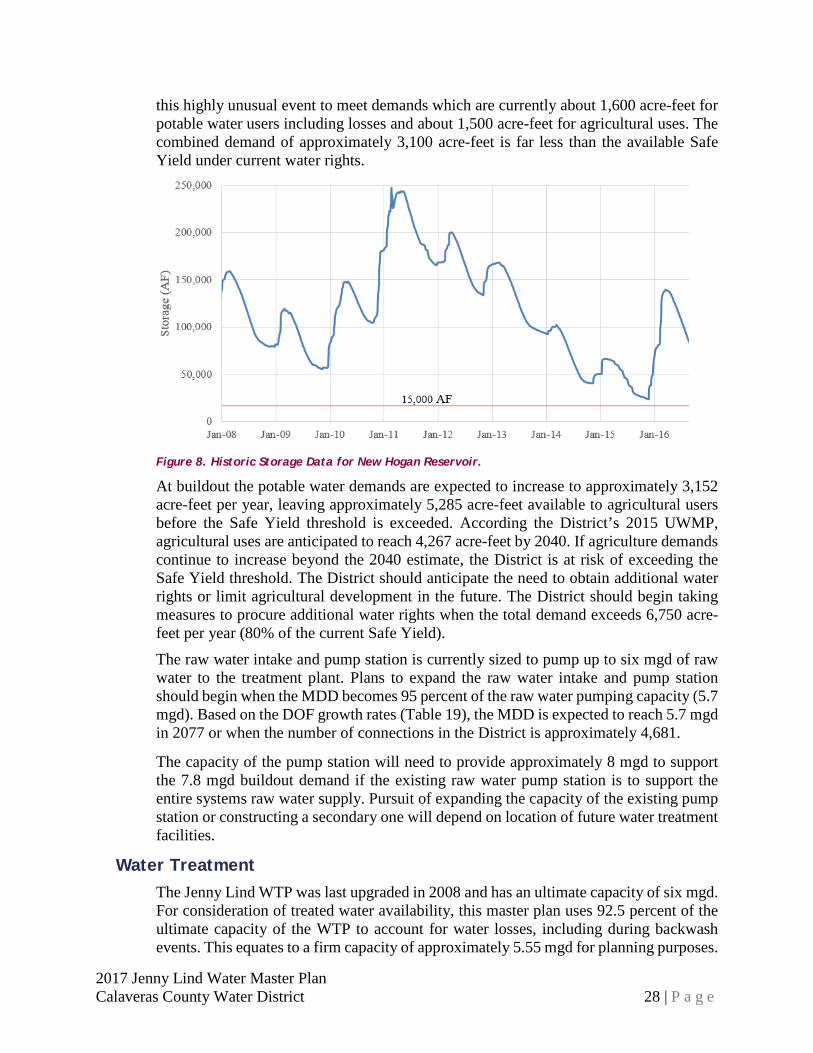
Calaveras River Intake and Pump Station The raw water supply to the Jenny Lind WTP is located on the Calaveras River just down stream of the New Hogan Reservoir. The New Hogan Reservoir provides year round raw water storage for Jenny Lind Community. The New Hogan Reservoir has a capacity of 325,000 acre-feet; however, the Army Corps of Engineers limits the maximum storage volume to 250,000 acre-feet. During dry years, the minimum delivery quantity or Safe Yield under the current rights is 8,437 acre-feet per year. During 2014-2015 drought period, the New Hogan Reservoir approached “minimum pool”, or about 15,000 acre-feet of storage (See Figure 8). While there were water quality issues, there was still adequate water supply available during
1 Per the Construction and Design Standards (January 2009) 2 Residential homes within the service area were surveyed and no homes greater than 3,600 Sq. Ft. were identified
the exception of multi-family units. 3 All commercial and industrial land uses have been assumed to be greater than 3,600 Sq. Ft. 4 Per Central Calaveras Fire – Building Requirements (April 2010) 5 Existing piping is not required to be replaced immediately to meet fire flow demands. As existing piping is replaced,
new piping will be constructed to meet buildout demands.
2017 Jenny Lind Water Master Plan Calaveras County Water District 28 | P a g e
this highly unusual event to meet demands which are currently about 1,600 acre-feet for potable water users including losses and about 1,500 acre-feet for agricultural uses. The combined demand of approximately 3,100 acre-feet is far less than the available Safe Yield under current water rights.
Figure 8. Historic Storage Data for New Hogan Reservoir.
At buildout the potable water demands are expected to increase to approximately 3,152 acre-feet per year, leaving approximately 5,285 acre-feet available to agricultural users before the Safe Yield threshold is exceeded. According the District’s 2015 UWMP, agricultural uses are anticipated to reach 4,267 acre-feet by 2040. If agriculture demands continue to increase beyond the 2040 estimate, the District is at risk of exceeding the Safe Yield threshold. The District should anticipate the need to obtain additional water rights or limit agricultural development in the future. The District should begin taking measures to procure additional water rights when the total demand exceeds 6,750 acre-feet per year (80% of the current Safe Yield). The raw water intake and pump station is currently sized to pump up to six mgd of raw water to the treatment plant. Plans to expand the raw water intake and pump station should begin when the MDD becomes 95 percent of the raw water pumping capacity (5.7 mgd). Based on the DOF growth rates (Table 19), the MDD is expected to reach 5.7 mgd in 2077 or when the number of connections in the District is approximately 4,681.
The capacity of the pump station will need to provide approximately 8 mgd to support the 7.8 mgd buildout demand if the existing raw water pump station is to support the entire systems raw water supply. Pursuit of expanding the capacity of the existing pump station or constructing a secondary one will depend on location of future water treatment facilities.
Water Treatment The Jenny Lind WTP was last upgraded in 2008 and has an ultimate capacity of six mgd. For consideration of treated water availability, this master plan uses 92.5 percent of the ultimate capacity of the WTP to account for water losses, including during backwash events. This equates to a firm capacity of approximately 5.55 mgd for planning purposes.

2017 Jenny Lind Water Master Plan Calaveras County Water District 29 | P a g e
The existing MDD is approximately 4.65 mgd. The MDD projected at buildout is approximately 7.80 mgd. Plans to expand the treatment capacity of the system should begin when the MDD becomes 95 percent of the WTP’s firm capacity (5.25 mgd). Based on the DOF growth rates (Table 19), the MDD is expected to reach 5.25 mgd in 2057 or when the number of connections in the District is approximately 4,284. There is no need to expand the WTP capacity within the next 15 years; therefore, expansion of the treatment capacity has not been included in the CIP. Plans for expanding the treatment capacity of the system need to consider the space availability for future expansion. The Jenny Lind WTP is currently built-out and has no space available on site for future growth. A new site will need to be selected. Based on the pressure zone demands, the new site should be selected to directly serve Zones E & F or Zone B. The firm capacity evaluation assumes that the Jenny Lind WTP operates on a 24-hour per day cycle. The WTP is currently only operated part of the day. Operations will need to be adjusted in the future to allow the facility to keep up with demand.
Treated Water Storage Evaluation The tank capacity in each zone was compared to the required storage based on the water storage design criteria and the fire flow criteria. Evaluations are presented for baseline demands and buildout demands in Table 25 and Table 26 respectively. Table 25. Evaluation of Available Storage under Baseline Demand Scenario.
Criteria A Tank B Tank E & F Tank 602 Tank Tank capacity (gallons) 2,000,000 1,000,000 1,500,000 150,000 Highest FF requirement in zone (gpm) 1,500 1,000 1,500 1,000 Required FF storage (gallons) 360,000 240,000 240,000 144,0002 Baseline MDD (mgd) 4.65 1.37 0.52 0.31 Required emergency storage (gallons) 420,5001 228,800 87,200 52,000 Required operational storage (gallons) 930,000 274,600 104,700 62,300 Total required storage (gallons) 1,710,200 743,400 551,900 258,300 Storage deficit (gallons) - - - 108,3003 1 Only required to support emergency storage volume needed to serve downhill zones served by A Tank. 2 A portion of the 240,000 gallon fire flow storage requirement is supplemented by the 602 Pump Station. 3 Due to water quality concerns associated with water age in the 602 Tank Zone, fire flow storage cannot be provided in addition to emergency and operational storage requirements. 4 Total Required Storage = Required FF storage (4 hours) + Emergency storage (4 hours of MDD) + Operational storage (20 percent of MDD)
Table 26. Evaluation of Available Storage at Buildout without Improvements. Criteria A Tank B Tank E & F Tank 602 Tank
Tank capacity (gallons) 2,000,000 1,000,000 1,500,000 150,000 Highest FF requirement in zone (gpm) 1,500 1,000 1,500 1,000 Required FF storage (gallons) 360,000 240,000 360,000 144,0002 Buildout MDD (mgd) 7.80 2.02 1.60 0.32 Required emergency storage (gallons) 631,3001 337,500 267,200 53,300 Required operational storage (gallons) 1,568,100 405,000 320,600 64,000

2017 Jenny Lind Water Master Plan Calaveras County Water District 30 | P a g e
Criteria A Tank B Tank E & F Tank 602 Tank Total required storage (gallons) 2,559,400 982,500 947,800 261,300 Storage deficit (gallons) 559,400 - - 111,300 1 Only required to support emergency storage volume needed to serve downhill zones served by A Tank. 2 A portion of the 240,000 gallon fire flow storage requirement is supplemented by the 602 Pump Station. 3 Total Required Storage = Required FF storage (4 hours) + Emergency storage (4 hours of MDD) + Operational storage (20 percent of MDD)
A Tank distributes water to the entire system which requires A Tank to support the operational storage demand for the entire system. A Tank is only required to support an emergency storage volume to serve the downhill zones served by A Tank (Zones A1-A6). A Tank has been identified as having storage deficiencies at buildout and will require an additional 559,400 gallons of storage to meet the design criteria. The total required storage is expected to exceed the capacity of A Tank (2.0 mgd) when the system reaches 4,695 connections in year 2078.
The storage capacity of 602 Tank is insufficient to meet the storage requirements under baseline and buildout conditions. Due to water quality concerns associated with water age in Zone 602, additional fire flow is not recommended in addition to emergency and operation storage requirements. In order to sustain water quality in this zone, fire flow pumps are recommended as an alternative to fire flow storage.
Adding a 1,000 gpm fire flow pump at buildout will address the fire flow requirement, thereby eliminating any storage deficiency at buildout. Given that the demand of Zone 602 is projected to increase by only 0.01 mgd upon buildout, the conditions of the 602 Zone are not expected to worsen within the planning horizon of this study. Timing for adding the additional fire flow pump the 602 Pump Station is at the District’s discretion.
Tanks B, E & F are all expected to be large enough to support their respective zones. Other than regular maintenance, no improvements are expected for these tanks.
Treated Water Pumping Evaluation Each booster pumping station should have a firm capacity equal to the zones MDD given that each zone is supported by at least one tank. Firm capacity assumes the largest pump is out of service. In addition, if the uphill zone does not have adequate storage for fire flow, the booster pumping station should have the ability to deliver fire flow to the higher zone. The MDD for each pumping zone are presented in Table 27.
Table 27. Evaluation of Treated Water Pumping.
Pump Station Distribution Pump ID
Design Flow (gpm)
Firm Capacity
(gpm)
Baseline MDD (gpm)
Buildout MDD (gpm)
Pump Station A
Clearwell to A Tank
Pump 8 2,082 3,470 3,285 5,4402 Pump 7 2,082
Pump 6 1,388
Pump Station B
A Tank to Zone B
Pump 5 600 1,200 950 1,410 Pump 4 600
Pump 31 600

2017 Jenny Lind Water Master Plan Calaveras County Water District 31 | P a g e
Pump Station Distribution Pump ID
Design Flow (gpm)
Firm Capacity
(gpm)
Baseline MDD (gpm)
Buildout MDD (gpm)
Pump Station E & F
A Tank to Zones E & F
Pump 31 820 1,654 360 1,110 Pump 2 834
Pump 1 834
Pump Station 602
Zone A to Zone 602
Pump 135 200 200 215 220
Pump 136 200 1 Pump 3 is a swing pump and operates as a backup for Zone B and Zones E & F. 2 Buildout MDD assumes that Pump Station A continues to be the only treated water supply.
The pumping evaluation identified a baseline deficiency at Pump Station 602 and buildout deficiencies at Pump Station A & B.
No immediate improvements are recommended to Pump Station 602 despite the deficiency. While this analysis identified a deficiency, the District has reported no problems serving the existing system demands. Furthermore, the demand of Zone 602 is only expected to increase by 5 gpm upon buildout. The existing Zone 602 Pump Station is expected to be capable of continuing to serve the Zone 602 demands. Improvements can be deferred until the end of the useful life of the existing pumps or upon an increase in the Zone 602 demand.
The firm capacity of Pump Station B is inadequate to serve the 1,410 gpm MDD at buildout. Based on the growth rates presented in Table 19, the pump station will require an upgrade when the system expands to 5,265 connections in year 2108.
The firm capacity of Pump Station A is inadequate to serve the 5,440 gpm MDD at buildout if the system is to continue delivering all water from the Jenny Lind facility. Based on the growth rates presented in Table 19, the pump station will require an upgrade when the system expands to 3,993 connections in year 2042. However, upgrades to Pump Station A will depend on whether the District pursues an expansion of the Jenny Lind facility, which is not recommended. The District will need to construct a new pump station to deliver water from future water treatment facilities when the system demand exceeds the capacity of the existing WTP.
Treated Water Pipeline Evaluation The InfoWater hydraulic model was used to evaluate the distribution system. Several model scenarios were developed to identify low system pressure areas, high system pressure areas and fire flow deficient nodes.
Low System Pressure Areas The first set of model scenarios was created to represent baseline PHD. Under PHD, several areas do not maintain a minimum pressure of 40 psi. These problems are typically not due to excessive head loss, but are caused by inadequate elevation difference between storage tanks and the areas served. These problems can be addressed by adjusting pressure zone boundaries, adding a hydropneumatic pressure system, or providing individual booster pumps to homes or developments. The nodes identified as low

2017 Jenny Lind Water Master Plan Calaveras County Water District 32 | P a g e
pressure are presented in Figure 9 and summarized in Table 28. With the exception of some of the nodes served by A Tank and the nodes in the vicinity of the old Tank C, all of the low pressure nodes are within the vicinity of their respective water tank supply and should be supplied by booster pumps or hydropneumatic tanks if they are not already.
Table 28. Low Pressure Deficiencies under Baseline PHD.
Area Model Node IDs Comments
A1 Zone
J16, J18, J86, J94, J1111, J403, J404, J405, J414, J416, J423, J426, J427, J428, J429, J431, J433, J435, J439, J1120, J1125, J1126, J1128, J1129, J1033, J1034, J1035, J1040, J1050, J1041, J1043, J1044, J1048, J1053, J1054, J1056, J1057, J1064, J1129, J1133, J1148, J2034
Nodes J431, J439, J1148, J416, and J414 are in the immediate vicinity of A Tank, these nodes do not serve any connections and are not an issue.
E&F Zone J714, J1147, J723 J1146, J1134, J730
Nodes J730 and J1134 are in the immediate vicinity of E and F Tank respectively.
602 Zone J801, J802 J1131, J5002 Nodes served by 602 Tank Vicinity of WTP Clearwell J123, J125, J127 No demands served from these nodes.
B2 Zone J4002 PRV is set to 36 psi
A3 Zone
J22, J24, J26, J28, J72, J80, J82 J402, J601, J608, J2010, J2019, J2024, J2025, J2034, J2037, J2039, 9997,
J80, J82, J440, J510, J512, and J514 are all located at the old C Tank Site. Node J608 is the location of the old D Tank Site
1 Node distributes water to B Pump Station and E/F Pump Station. 2 Node ID locations are mapped in the System Map Book (See Appendix A)
The nodes in the hydraulic model were marked in the model with an “LP” designation, for low pressure, to indicate that low pressures at these nodes are due to insufficient static head.
High System Pressure Areas Areas of high system pressure were identified using the baseline ADD scenario. Areas where the system pressure exceeds 120 psi are considered high pressure areas according to the Districts design standards. Some high pressure areas cannot be avoided due to the ranging elevations within individual pressure zones. Zones A1 and B1 have the highest susceptibility to high pressure due to pockets of low elevations along pipe mains. Figure 10 presents a map of the areas under high pressure. The District is aware of these high pressure issues and equips all new connections with a PRV.
High Velocity Pipelines High velocity pipelines were identified using the baseline PHD scenario. Pipelines conveying water at a rate exceeding 5 ft/s do not comply with the existing District standard and were flagged. The majority of deficiencies occur in Zone A1, but the most alarming is the AB Transmission Main deficiency. Recommendations for addressing these deficiencies are discussed in detail in the following sections. Figure 11 presents a map of the pipeline deficiencies.

2017 Jenny Lind Water Master Plan Calaveras County Water District 33 | P a g e
Fire Flow Deficiencies The model was used to calculate the available MDD plus fire flow for the baseline conditions. Nodes throughout the system were programmed to support either a 1,000 gpm fire flow, or a 1,500 gpm fire flow depending on the user type. All nodes within 300 feet of medium residential, commercial, industrial, or community center parcels were assigned a 1,500 gpm fire flow. All other nodes were assigned 1,000 gpm. Approximately three-quarters of nodes are able to deliver 1,000 gpm fire flow demands. The other quarter of nodes have some deficiency, ranging from marginally to severely deficient. Zero nodes serving 1,500 gpm fire flow demands were identified as deficient.

M
MMM
MMM
M
MMM
MM
>
^
^
^
^
^
!(
!(!(!(
!(
!(
!(
!(
!(
!(
!(
!(
!(
!(!(
!(
!(
!(
!(
!(!(
!(
!(
!(
!(!(
!( !(
!(!(
!(
!(
!(
!(!(
!(!(!(
!(
!(
!(
!(
!(
!(
!(
!(
!(!(
!(!(!(
!(
!(
!(
!(
!(
!(
!(
!(
!(
!(
!(
!(
!(!(
!(
!(
!(
!(
!( !(!( !(
!(
!(
!(
!(!(!( !(
!(
!(
!(
!(
!(
!(!(!(
!(
!(
!(!(
!(
!(
!(
!(
!(
!(
!(
!(
!(!(
!( !(
!(
!(
!(
!(
!(!(!(
!( !(
!(
!(!(
!(
!(!(
!(
!(
!(
!(
!(
!(!(
!(
!( !(
!(!(
!( !(!(
!(!(
!(!(
!(
!( !(
!( !(
!(
!(
!(
!(!(
!(!(
!(
!(
!(!(
!(!(!(
!(
!(!(!(
!(!(
!(!(
!(!(
!(
!(
!(
!(!( !(
!(
!( !(
!(
!(
!(
!(
!(
!(
!(
!(
!(
!(
!(
!(
!(!(
!(
!(
!(
!(
!(
!(
!(!(
!(!(
!(
!(
!(
!(
!(
!(
!(
!(
!(
!(
!(
!(
!(
!(!(
!(
!(
!(
!(
!(
!(
!(!(
!(
!(
!(
!(!(
!(
!(
!(
!(
!(
!(!(
!(
!(
!(
!(
!(
!(!(
!(
!(
!( !(
!(
!(
!(
!(
!(
!(
!(
!(
!(
!(!(!( !(
!(
!(
!(
!(!(
!(
!(
!(!(
!( !(
!(!(
!(!(
!(
!(!(!(
!(
!( !(
!(
!(
!(
!(
!(
!(
!(
!(
!( !( !(
!(
!(
!(
!(
!(
!(
!(
!(
!(
!(!(
!(
!(
!(
!(
!(
!(
!(
!(
!(!(
!(
!(!(
!(
!(
!(!(!( !(
!(
!(
!(
!(
!(
!(
!(
!(!(!(!(!(
!(!(!(!(!(!(
!(
!(
!(!(!(!(
!(
!(
!(
!(
!(
!(
!(
!(!(
!(
!(
!(
!(
!(
!(!(
!(
!(!(
!(
!(
!(
!(!( !(!(
!(!(
!(!(
!(!(
!(!(
!(!(!(!(!(
!(
!(
!(
!(
!(
!(!( !(
!(
!(
!(!(
!(
!(
!(
!(
!(
!(
!(
!(!(
!(!(
!(
!(
!( !(
!(
!(!(
!(!(!(
!(!(!(!(
!(
!(!(!(!(
!(
!(
!(!(
!(
!(
!(
F Tank
E Tank
B Tank
A Tank
602 Tank
FIGUREJenny Lind Water Master Plan
Low Pressure Nodes1180 Iron Point Rd., Suite 260Folsom, CA 95630
Phone: (916) 608-2212Fax: (916) 608-2232
0 0.75Miles
p 1" = 0.75 mi.
Legend!( > 40psi
!( < 40psi
Inactive

THIS PAGE LEFT INTENTIONALLY BLANK

A
A
A
A
A
A
A
A
A
A
AA
A
A
A
A
AA
A A
AA
AA
A
A
AA
A
A
A
AA
AA
>
^
^
^
^
^
180
160
120
140
180
140120
120
180
160
140
120
160
120
120
FIGUREJenny Lind Water Master Plan
High Pressure AreasBaseline ADD1180 Iron Point Rd., Suite 260
Folsom, CA 95630Phone: (916) 608-2212
Fax: (916) 608-2232
0 0.75Milesp 1" = 0.75 mi.
Pressure
120 PSI
140 PSI
160 PSI
180 PSI

THIS PAGE LEFT INTENTIONALLY BLANK

FIGURE
11Jenny Lind Water Master Plan
High Velocity PipesBaseline PHD1180 Iron Point Rd., Suite 260
Folsom, CA 95630Phone: (916) 608-2212
Fax: (916) 608-2232
0 0.75Miles
p 1" = 0.75 mi
Legend< 5.00 ft/s
> 5.01 ft/s

THIS PAGE LEFT INTENTIONALLY BLANK

2017 Jenny Lind Water Master Plan Calaveras County Water District 37 | P a g e
Recommended Improvements Based on the system evaluation, the District will need to address a number of system deficiencies to supply future demands and comply with district and other standards. The District will need to provide a new tank, pumps and pipelines throughout the Jenny Lind Water System. For the study area to achieve a sustainable treated water supply and to be assured fire protection meets fire flow requirements, some recommended projects must be in place in the immediate future, and others must be in place before buildout.
Raw Water Supply The existing water rights are expected to provide adequate supply for the Jenny Lind area through buildout assuming agricultural water rights do not exceed those presented in the 2015 UWMP. Recommendations for improvements to portions of the raw water supply infrastructure are detailed below.
Intake Pump Station and Treatment Facility The raw water pumping and treatment capacity of the system will both need to be expanded to 7.8 mgd to meet the future demands of treated water. The space constraints at the Jenny Lind WTP exclude the possibility of expanding the existing facilities to meet the buildout demand; therefore, an entirely new pump station and treatment facility will need to be developed to provide the additional two mgd demand. This will require an additional point of diversion from the Calaveras River or an intake at the reservoir. The need to expand the treated water capacity will not occur until the system MDD exceeds 5.25 mgd, and the system demand is not expected to exceed this point until the year 2057. Construction of expanded facilities is not recommend in the planning horizon of this master plan. A planning level cost estimate has been provide so the District can adjust rates and begin allocating funds to support future improvements. At a planning level estimate of $4/gallon, a new 2.5 mgd facility with an intake system is anticipated to cost approximately $10 million to construct, plus an additional $3 million for contingency, design, environmental review, administration and land acquisition. The total cost to build a new facility is estimated at $13 million.
Treated Water Storage Based on the storage system evaluation criteria stated previously, A Tank requires additional storage. A second tank in parallel to A Tank is recommended to support the buildout storage requirements and should be online by year 2078. A new 1.0 mgd tank will provide redundancy and allow the District to rehabilitate A Tank when the need arises and support storage demands through buildout. The new tank for A Zone will not be necessary within the planning horizon of this master plan. Aerial survey of the area surrounding A Tank did not identify an open space that would support a second tank at the same HGL. Areas of similar elevation were surveyed along the path of pipeline to determine if it would be cost effective to pipe to a new location.

2017 Jenny Lind Water Master Plan Calaveras County Water District 38 | P a g e
The closest location was approximately one mile away and will require cross country piping. The most cost effective approach for the District storage at buildout is to procure a nearby property to A Tank at approximately the same elevation. No tank improvements are recommended within the planning horizon of this master plan.
Treated Water Pumping Several pump station improvements are recommended to meet baseline and buildout design criteria. Recommendations are presented to support firm capacities greater than or equal to the buildout MDD. Individual pump station improvement projects should be reviewed to consider the projected demand at the end of the pumps design life. Future pump station improvements are recommended for Pump Station 602 and Pump Station B. Pump Station 602 does not provide the full firm capacity necessary under baseline and buildout conditions according to this study; however, the existing deficiency is minor and the demand is only expected to increase by 0.01 mgd upon buildout. Improvements to the existing 602 Pump Station pumps can be deferred based on the insignificant increase in demand and the reliability of the existing water supply in 602 Zone. The pumps should be replaced with higher capacity pumps when the existing pumps reach the end of their useful life, or if system demand increases beyond that projected. Pump Station B meets the existing system criteria and requires only future improvements. The pump station provides sufficient capacity to support Zones E & F until year 2107 when the District is anticipated to grow to 5,265 connections. At which point, the Pump Station will need be upgraded so support future growth. The two existing 600 gpm pumps should be replaced entirely, or have their motors replaced, such that each pump is capable of delivering 825 gpm or greater. When combined with the existing 600 gpm swing pump, these improvements will provide a future firm capacity of 1425; thus, exceeding the 1410 gpm required at buildout. Pump Station A will require future improvements if Pump Station A is expected to continue conveying all the treated water supply to system; although, this is unlikely. The Jenny Lind WTP does not have the space to provide additional treatment capacity and it is likely that a new WTP and a new pump station will be constructed at a new location to support buildout demands. No pump station improvements are recommended within the planning horizon of this master plan.
Treated Water Distribution Recommended improvements to the distribution system reflect the results of the hydraulic model and the need to meet the system design criteria. The pipeline improvements are summarized in the paragraphs below and in the following tables.
Low Pressure and High Velocity Improvements to Address Existing Deficiencies Deficient nodes in the northern portion of Zone A1 require significant piping improvements to provide pressures of 40 psi or greater to the homes in the area. Any pipe improvements recommended to address current deficiencies will be sized to

2017 Jenny Lind Water Master Plan Calaveras County Water District 39 | P a g e
accommodate buildout conditions. Pipes were targeted due to their high headloss and need for high capacity flows at buildout. Table 29 presents the pipe schedule recommended to improve the immediate system deficiencies in upper portion of Zone A1.
Table 29: Pipe Improvements to Address Existing Low Pressure Deficiencies
Pipe ID Location Length
(ft)
Baseline Headloss
per 1000 ft
Existing Diameter
(in)
Buildout Diameter
(in) P387 Anderson St (Loop) 538 - - 12 P489 Westhill Rd (Loop) 669 - - 8 P391 Hanley Dr (Loop) 427 - - 8 P397 Bergsma Ln (Loop) 1830 - - 8 P437 Hart Vickson Ln 544 24.2 10 18 P435 Hart Vickson Ln 235 24 10 18 P155 Marsden Ln 662 21.3 6 10 P351 Farris Dr 76 19 6 8 P92 Silver Rapids Rd 407 18.8 10 16 P431 Dennis Ln 294 16.4 6 141 P93 Silver Rapids Rd 423 15.7 10 16 P89 Hart Vickson Ln 452 14.3 10 16 P420 Hart Vickson Ln 487 14.1 10 16 P82 Silver Rapids Rd 482 12.5 10 141 P83 Silver Rapids Rd 942 9.9 10 141 P74 Hart Vickson Ln 427 8.3 10 16 P129 Heney Ln 264 7.9 6 12 P125 Dennis Ln 732 6.6 6 141 P126 Heney Ln 547 6.3 6 12 P75 Silver Rapids Rd 622 5.8 10 12 P120 Butter Ln & Blake
Ln 973 5.7 6 8
P432 Heney Ln 218 5.2 6 12 P94 Berkesey Dr 623 2.4 8 12 P128 Emereff Ln 1056 2.3 6 12 P402 Heney Ln 434 2 6 12 P127 Gallius Ln 1941 1.7 6 12 P119 Blake Ln 760 1.2 6 10 P113 Berkesey Dr 776 1.2 8 10 P111 Silver Rapids Rd 1681 1.2 10 141 P112 Blake Ln 1424 0.8 6 10 P114 Berkesey Dr 450 0.8 8 10 P130 Heney Ln 320 0.7 10 12 P84 Hart Vickson Ln 784 0.5 10 12
1 Due to limited availability, 14-in pipes will be upsized to 16-in 2 Pipe ID locations are mapped in the System Map Book (See Appendix A)

2017 Jenny Lind Water Master Plan Calaveras County Water District 40 | P a g e
Making the recommended improvements will resolve pressure issues at all but two of the deficient nodes at buildout. Further pipe improvements will not resolve the low static pressure at these nodes, thus the District will need to serve the surrounding homes using booster pumps. These nodes include; J1040 and J428. Low pressures located at the southern end of Zone A1, can be resolved by installing a new 8” pipe between node J18 and pipe P453 with a new PRV on Pipe 213 set to 80 psi. This improvement also addresses fire flow deficiencies described in the following section. Low pressures located in Zone A3 can be improved by installing two new loop pipes. The low pressure located in the northwest portion can be improved by installing a loop pipe between nodes J2006 and J008 (Anderson St Loop). Installing this pipe significantly reduces pressure losses from flow entering from Zone B3 and raises the overall system pressure in this area. Similarly, the low pressures located at the southern end of the Zone A3 near the old tank sites can be improved by installing a loop pipe between node J612 and J438 (Westhill Rd Loop). The Westhill Rd Loop will effectively bypasses the old Tank C site. Low pressures located in the lower portion of Zone A can be improved by installing a new 8” loop between nodes J18 and P453 along Bergsma Lane (Bergsma Ln Loop). This will provide a looped pipe network to this subsection of the District and resolve fire flow deficiencies described in the following section. Low pressures located in the upper portion of Zone B2 can be improved by installing a new 8” loop between nodes J508 and J1090 along Hanley Drive (Hanley Dr Loop). This will provide a looped pipe network to this subsection of the District and resolve fire flow deficiencies described in the following section. The five ft/s maximum pipe velocity is the other governing requirement for immediate pipe improvements. The baseline PHD model scenario identified 34 pipes that have velocities greater than the maximum pipe velocity. Most pipe improvements will be addressed by upsizing existing pipe, while others can be improved by adjusting pressure reducing valve (PRV) settings for better flow distribution through the network. Replacing the existing AB Transmission Main was identified as the highest priority project among the pipes recommended for improvement. The AB Transmission Main is the primary source of water for the Zones B1, B2, B3, B4 and B5, and the AB Transmission Main supports fire flow demands to Zones A1, A2, A3, A4, A5, and A6. During peak events, the velocity through the AB Transmission Main exceeds the District standard which makes it susceptible to failure. The majority of the Jenny Lind service area relies on the AB Transmission Main; therefore, it is recommended that replacement of the AB Transmission Main be listed as the highest priority in Phase I of the CIP. Similarly, The E&F Zone Transmission Main should be improved in the immediate future due to high velocity concerns. A summary of the recommended pipeline improvements is presented in Table 30. Appendix C presents the full report of baseline and buildout pipe velocities under PHD.

2017 Jenny Lind Water Master Plan Calaveras County Water District 41 | P a g e
Table 30. Improvements to Address High Velocity Deficiencies.
Location Description
Model ID
Existing Buildout Diameter
(in) Length
(ft) Velocity
(ft/s) Diameter
(in) Velocity
(ft/s) Hart Vickson Ln P172 8 3382 9.3 143 4.7
Usher Dr P507 8 139 8.6 143 3.7 Hart Vickson Ln P732 10 227 7.3 18 3.5 Hart Vickson Ln P161 10 637 7.3 18 3.4 Hart Vickson Ln P158 10 416 6.4 18 3.3
Usher Dr P13 8 582 6.2 143 3.6 Hart Vickson Ln P162 10 431 6.0 16 3.1
McCauley Rd P204 6 375 5.6 143 3.2 Baldwin St P508 8 617 5.6 143 3.5
Hart Vickson Ln P64 8 1491 5.4 12 4.5 Usher Dr P282 8 229 5.3 143 3.4
Westhill Rd P604 6 403 0.112 8 4.7 Westhill Rd P404 8 682 5.2 10 3.0
Wind River Ct P10 8 1740 5.1 143 1.4 602 Pump Station
Discharge P2006 4 665 10.6 141,3 3.7 1 Assumes fire flow pumps are installed at buildout to address storage deficiencies. 2 Installing the 10” loop pipe along Westhill Road requires improvements to P604 as flow will largely bypass the old C Tank Site. 3 Due to limited availability, 14-in pipes will be upsized to 16-in 4 Pipe ID locations are mapped in the System Map Book (See Appendix A)
Improvements for Fire Flow Deficiencies The baseline MDD plus fire flow scenario was run to discover any potentially deficient fire flow nodes. The simulation identified 125 nodes that do not meet the user demands plus the fire flow demands. Many of these nodes are within the immediate vicinity of an existing water tank and are known to have low pressure; therefore, no improvements are recommended at these nodes. The full report of total demand and available flows for each system node is presented in Appendix C. The majority of deficient nodes were found in groups or at dead end nodes. Grouped deficiencies can be targeted and remedied through a single project. Table 24 presents recommended projects and lists the deficient nodes improved.
Table 31. Recommended Projects to Improve Fire Flows at Deficient Nodes.
Recommended Project Improved Deficient Nodes Hanley Dr Loop - Install new pipe
between J508 and J1090 with new PRV set at 80 psi
J551, J1124, J550, J554, J1123, J552
Bergsma Ln Loop - Install new 8” pipe between node J18 and pipe P453 with a
new PRV on Pipe 213 set to 80psi J409, J406, J2048, J401, 2055
Install PRV on P135 set to open during FF events, and open P434
J16, J1126, J1040, J404, J1125, J1034, J1133, J1056, J2043, J403, J1120, J1054, J1043, J2046, J1044, J1127

2017 Jenny Lind Water Master Plan Calaveras County Water District 42 | P a g e
Recommended Project Improved Deficient Nodes Westhill Rd Loop - Install new 10” loop
pipe between J612 and J438 J22, 9997, J510, J2039, J2025, J512, J2040, J2041A,
J2019, J2024, J2038, J2037, J2041, J603, J612 Remove valve 409 (not necessary to maintain A-2 HGL), open P270 to
eliminated A2 and provide fire flow J434, J2047, J601, J4016
Replace valve 901 with a PRV (set to 80 psi) to open during fire flow events J433, J1050, J1053, J413, J415, J708, J1057
Replace valve 902 with a PRV set to open during fire flow events J423
Set PRV 402 to 75 PSI or open P17 J555 Upsize P19 to 8 inches J553
Install Booster Pumps to Service Low Pressure Nodes
Old Tank C Site: J82, J514, J440, J611, J422, J442 Known Low Pressure Nodes: J405, J439, J427, J1129,
J28, J402, J714, J26, J700, J18, J608, J428, J1128 Dead End Nodes: J425, 9995, J429, J411, J24, J678,
J407, J683, J1002.2, J709, J2044, J34, J715, J606A, J621, J681, J606, J604, J36
1 Node ID locations are mapped in the System Map Book (See Appendix A)
Industry standard does not require improvements to existing systems for purpose of meeting fire flow demands. When the identified pipes reach the end of the useful life they should be replaced with the buildout pipe sizes presented in Appendix D to meet fire flow.
PHD at Buildout For the buildout scenario, PHD pressure and velocity design criteria were still the governing design criteria for future system improvements. Under peak hour buildout demands velocities and headloss increased significantly in some portions of the system. The District will need to make additional improvements to the pipe network as the system demands increase. The buildout PHD model scenario identified 34 pipes that will need to be upsized to meet buildout conditions. These 34 pipes are presented in Table 32. The pipe improvements recommended assume that improvements to existing pipe and PRV settings/installations previously recommended are in place.
Table 32: Additional Improvements to the Buildout Pipe System to Address Remaining High Velocity and Low Pressure Deficiencies.
ID Location Length
(ft)
Buildout without Improvements Buildout with Improvements
Diameter (in)
Velocity (ft/s)
Diameter (in)
Flow (gpm)
Velocity (ft/s)
P802 Ross Dr 649 6 19.0 12 1676 4.8 P2004 Ross Dr 616 6 18.7 12 1652 4.7 P125 Dennis Ct 732 6 18.6 12 1638 4.7 P137 Ross Dr 1656 6 18.3 12 1612 4.6 P129 Heney Ln 264 6 17.3 12 1527 4.3

2017 Jenny Lind Water Master Plan Calaveras County Water District 43 | P a g e
ID Location Length
(ft)
Buildout without Improvements Buildout with Improvements
Diameter (in)
Velocity (ft/s)
Diameter (in)
Flow (gpm)
Velocity (ft/s)
P126 Heney Ln 547 6 16.9 12 1491 4.2 P136 Ross Dr 984 8 11.1 12 1733 4.9 P168 Hwy 26 2372 6 9.7 143 857 1.8 P163 Grouse Dr 1613 6 9.1 12 802 2.3 P56 Hart Vickson Ln 616 8 8.8 12 1381 3.9
P207 Westhill Rd 1868 8 8.5 12 1336 3.8 P208 Westhill Rd 1546 8 8.4 12 1317 3.7
P315 Grouse Dr & Huckleberry Ln 483 6 8.3 12 727 2.1
P167 Hwy 26 241 6 8.1 143 714 1.5 P18 Baldwin St 967 8 7.8 12 1226 3.5
P504 Baldwin St 662 8 7.7 12 1209 3.4 P509 Baldwin St 644 8 7.5 12 1176 3.3 P67 Milton Rd 254 8 7.5 10 1175 4.8 P68 Hart Vickson Ln 1074 8 7.4 10 1163 4.8 P69 Hart Vickson Ln 452 8 7.3 10 1151 4.7
P312 Vista del Lago Dr 1117 8 7.3 16 1141 1.8 P14 Baldwin St 2450 8 7.3 12 1139 3.2 P23 Rippon Rd 529 6 6.8 8 601 3.8
P183 Vista del Lago Dr 243 8 6.2 12 978 2.8 P54 Hart Vickson Ln 353 8 6.2 12 966 2.7 P26 Hart Vickson Ln 960 8 5.9 12 920 2.6
P300 Vista del Lago Dr 495 8 5.9 12 918 2.6 P714 Vista del Lago Dr 415 10 3.6 12 880.7 2.5 P165 Vista del Lago Dr 424 10 3.2 12 776 2.2 P721 Vista del Lago Dr 244 10 3.6 12 870 2.5 P722 Vista del Lago Dr 659 10 3.8 12 933 2.2 P55 Hanley Dr 1370 6 6.7 8 593 3.8 P26 Hart Vickson Ln 960 8 5.2 12 812 2.3
P197 Vista del Lago Dr 1518 8 5.4 12 846 2.4 1 Pipe ID locations are mapped in the System Map Book (See Appendix A) 2 Pipe improvements identified in this table have no order of priority. The District should use this table to select pipe sizes as existing pipes are replaced. 3 Due to limited availability, 14-in pipes will be upsized to 16-in 4 Pipe ID locations are mapped in the System Map Book (See Appendix A)
Buildout MDD plus Fire Flow Improvements to the existing system have been sized to address buildout fire flow conditions. No additional improvements are necessary to meet the system design criteria beyond those previously identified.

2017 Jenny Lind Water Master Plan Calaveras County Water District 44 | P a g e
New Developments For distribution lines in cul-de-sacs with pipe size currently two inches in diameter and known to be made of asbestos cement, the pipes should be replaced with four inch polyvinyl chloride or ductile iron pipe. The new pipe should be no longer than 300 feet and have no more than 12 residential services connected. If additional length is required, if the pipe is not in cul-de-sac (dead end), or if more than 12 residential services must be connected, the pipe should be a minimum of six inches in diameter.
Annual Pipe Replacement Program The District currently maintains 90 miles of distribution lines 4 inches and greater. The average useful life of pipe is approximately 100 years. To avoid deferring maintenance, the District should plan to replace approximately 0.9 miles of pipeline each year. The District should begin with making the recommended pipe improvements to Zone A1 in the first four years following the release of this WMP update. Subsequently, the District should replace aging asbestos-concrete pipes as they are likely to be the oldest and most likely to fail.
Annual Infrastructure Repair and Replacement Program A condition assessment of District assets was not included as part of the scope of this WMP. Instead, the annual cost of repair and replacement (R&R) of District assets has been considered. A life cycle assessment was prepared to update the annual budget required to maintain the existing facilities. Based on the value of existing assets, the District should allocate $396,500 annually for R&R. Table 33 presents a summary of District assets, their value, their lifetime and the annual cost of R&R. Table 33: Annual R&R Program Summary
Asset Present Value Lifetime (years) Annual R&R Cost ($/year) Jenny Lind WTP $12,000,000 30 $400,000
A Pump Station $500,000 30 $16,700
B Pump Station $250,000 30 $8,300
E&F Pump Station $200,000 30 $6,700
602 Pump Station $100,000 30 $3,300
A Tank $2,700,000 50 $54,000
B Tank $1,350,000 50 $27,000
E Tank $675,000 50 $13,500
F Tank $1,350,000 50 $27,000
Annual Cost of R&R Program $556,500 1This is a ANSI Class 3 Estimate and should be considered 20% low to 30% high.
Capital Improvement Plan Recommendations for a CIP have been developed based on the assessment of the Jenny Lind water system described in the Recommended Improvements chapter above. The

2017 Jenny Lind Water Master Plan Calaveras County Water District 45 | P a g e
following section summarizes project recommendations, estimates costs and presents a prioritized implementation schedule.
Summary of Recommended Projects The recommended improvements associated with a 10-year planning horizon only include improvements to the distribution system. The individual distribution system improvements identified in the previous section have been grouped to specific projects and summarized in Table 34. Figure 12 maps the locations of the proposed projects. Individual project figures for each of the recommended projects are provided in Appendix E. Table 34: Recommend Projects
Project Project Description
Project Goals
Improved Pipe Segments1
AB Transmission
Main
Replace pipeline connecting A Tank to
B Tank
Reduce pipe velocity and headloss. P172, P64
E&F Transmission
Main
Replace pipeline connecting A Tank to Zone F and E Tank
Reduce pipe velocity and headloss; Increase available
fire flows P158, P161, P162, P732
Westhill Rd Loop
Install New 8" Loop Pipe and improve adjacent piping
Reduce pipe velocity and headloss; Increase available
fire flows
P604, P404
Anderson St Loop
Install New 12" Loop Pipe
Reduce pipe velocity and headloss; Increase available
fire flows
Hanley Dr Loop Install New 8" Loop Pipe and install new
PRV
Reduce pipe velocity and headloss; Increase available
fire flows
Bergsma Ln Loop
Install New 8" Loop Pipe and install new
PRV
Reduce pipe velocity and headloss; Increase available
fire flows
Lower B Zones Improvements
Replace pipeline loops within Upper B
Zones
Reduce pipe velocity and headloss; Increase available
fire flows
P10, P13, P204, P282, P507, P508,
A1 Transmission
Main
Replace pipeline connecting A Tank to
Zone A1 and Zone 602
Reduce pipe velocity and headloss; Increase available
fire flows
P111, P125, P126, P127, P128, P129, P130, P155, P402, P420, P431, P432, P435, P437, P74, P75, P82, P83, P84, P89, P92, P93
A1 Zone Improvements
Replace pipeline loops within A1 Zone
Reduce pipe velocity and headloss; Increase available
fire flows
P112, P113, P114, P119, P120, P94
Fire Flow Improvements
Remaining Fire Flow Projects Presented in
Table 32. Increase available fire flows

THIS PAGE LEFT INTENTIONALLY BLANK

A
A
AA
A
A
A
A
A
A
AA
A
A
A
A
AA
A A
AA
AA
A
A
AA
A
A
A
AA
AA
^
^
^
^
^
FIGURE
12Jenny Lind Water Master Plan
Recommended Projects1180 Iron Point Rd., Suite 260Folsom, CA 95630
Phone: (916) 608-2212Fax: (916) 608-2232
0 0.75Miles
p 1" = 0.75 mi.
LegendImproved
Existing Pipe
Recommended Improvements
Westhill Rd Loop
Anderson St Loop
Lower B Zone Improvements
Bergsma Ln Loop
AB Transmission Main
A1 Transmission Main
A1 Zone Improvements
E&F Transmission Main
Hanley Dr Loop

THIS PAGE LEFT INTENTIONALLY BLANK

2017 Jenny Lind Water Master Plan Calaveras County Water District 47 | P a g e
Implementation Schedule Projects are grouped in phases such that Phase I addresses the highest priority projects first. The highest priority projects are those high velocity and low pressure deficiencies. Once these projects are complete, the District can then begin addressing the lesser system deficiencies and implement an annual pipe replacement program to replace system piping at a rate of one percent per year. Phases are intended to be implemented over 5 year periods according to the following schedule:
• Phase I – (2019-2023) AB Transmission Main E&F Transmission Main Westhill Rd Loop Anderson St Loop Hanley Dr Loop Bergsma Ln Loop Lower B Zone Improvements R&R
• Phase II – Fire Flow Improvements & Low Pressure Improvements (2024-2028) A1 Transmission Main A1 Zone Improvements Miscellaneous Fire Flow Improvements R&R
• Phase III – Annual Pipe Replacement Program (2029-2033)
Annual Replacement of 1% of Existing Pipe Network R&R Projects
Estimated Costs Planning-level cost estimates are included for each of the recommended capital improvements. The cost of pipeline projects is based on a $23 per linear foot per inch diameter estimate based on cost estimates prepared for other recent pipeline projects. The cost of PRVs are based on a $2,250 per inch diameter estimate. The cost of pump stations is based on a $8,000/hp estimate. The estimated cost of the proposed tanks was discussed in the Recommend Improvements chapter above due the necessary consideration for site selection. The following contingencies and allowances were added to the base cost:
• 20% Estimated Contingency • 10% Allowance for Engineering/Design • 10% Allowance for Construction Management • 10% Allowance for Bonds/Insurance/Mobilization
The recommended projects, estimated costs, and proposed schedule were developed through a planning-level analysis that was appropriate for the WMP update and should be revaluated in further detail prior to implementation. Table 35 presents the infrastructure improvements for the recommended CIP and provides a planning-level estimate for each project.

Table 35: Estimated Cost of Capital Improvement Projects
Project Recommened ImrovementsExisting
Diameter, inches
Recommended Diameter,
inches
Length, lineal feet
Component Cost
Project Cost
Upsize P172 8 14 3382 $1,634,000Upsize P64 8 12 1491 $618,000Upsize P155 6 10 662 $229,000Upsize P158 10 18 416 $259,000Upsize P161 10 18 637 $396,000Upsize P162 10 16 431 $238,000Upsize P732 10 18 227 $141,000New 8" Pipe - 8 669 $185,000Upsize P404 8 10 682 $236,000Upsize P604 6 8 403 $112,000
Anderson St Loop New 12" Pipe - 12 538 $223,000 $223,000New 8" Pipe - 8 427 $118,000New PRV - - - $14,000New 8" Pipe - 8 1830 $506,000New PRV - - - $14,000Improve P10 8 14 1740 $841,000Improve P13 8 14 582 $282,000Improve P204 6 14 375 $182,000Improve P282 8 14 229 $111,000Improve P507 8 14 139 $68,000Improve P508 8 14 617 $299,000
$6,706,000
Project Recommened ImrovementsExisting
Diameter, inches
Recommended Diameter,
inches
Length, lineal feet
Component Cost
Project Cost
Improve P111 10 14 1681 $812,000Improve P125 6 14 732 $354,000Improve P126 6 12 547 $227,000Improve P127 6 12 1941 $804,000Improve P128 6 12 1056 $438,000Improve P129 6 12 264 $110,000Improve P130 10 12 320 $133,000Improve P155 6 10 662 $229,000Improve P402 6 12 434 $180,000Improve P420 10 16 487 $269,000Improve P431 6 14 294 $143,000Improve P432 6 12 218 $91,000Improve P435 10 18 235 $146,000Improve P437 10 18 544 $338,000Improve P74 10 16 427 $236,000Improve P75 10 12 622 $258,000Improve P82 10 14 482 $233,000Improve P83 10 14 942 $455,000Improve P84 10 12 784 $325,000Improve P89 10 16 452 $250,000Improve P92 10 16 407 $225,000Improve P93 10 16 423 $234,000Improve P112 6 10 1424 $492,000Improve P113 8 10 776 $268,000Improve P114 8 10 450 $156,000Improve P119 6 10 760 $263,000Improve P120 6 8 973 $269,000Improve P94 8 12 623 $258,000
$8,196,000
Project Recommened ImrovementsExisting
Diameter, inches
Recommended Diameter,
inches
Length, lineal feet
Component Cost
Project Cost
Annual Pipe Replacement Program 1% of Pipe per Year - -- 23760 $9,837,000 $9,837,000Annual R&R Program Miscellaneous R&R - - - $2,782,500 $2,782,500
Phase III Total -- -- 23,760 $12,619,500
$27,521,500
Phase II Total
$1,706,000A1 Zone Improvements
Lower B Zone Improvemetns $1,783,000
Phase II: 2024-2028
Phase I Total
Phase I: 2019-2023
Phase III: 2029-2034
TOTAL COST OF CIP IMPLEMENTATION
AB Transmission Main $2,481,000
E&F Transmission Main $1,034,000
Weshill Rd Loop $533,000
$132,000Hanley Dr Loop
$520,000Bergsma Ln Loop
$6,490,000A1 Transmission Main

2017 Jenny Lind Water Master Plan Calaveras County Water District
APPENDIX A
System Map Book

THIS PAGE LEFT INTENTIONALLY BLANK

I6 I9I8I7
J9J8J7J6J5
L5 L9L8L7L6
F8 F9
K9K8K7K6K5
E9E8
B8
N9N8N7N6N5N4N3N2N1
H9H8H7
D9D8
C7 C8 C9
I11
O9
G7 G8 G9
O1 O2 O3 O6 O7 O8
M8M7M6M5
I10
J11J10
F11
K11
E11
F10 F12
C11
H11
D11
K10
E15E14E13E12E10
B15B14B13B12
A15A14A13
G11
H12H10
D15D14D13D12D10
C15C14C13C12C10
G10
PAGE ID
No Scale2017 Jenny Lind Water Master Plan
System Map1180 Iron Point Rd., Suite 260Folsom, CA 95630
Phone: (916) 608-2212Fax: (916) 608-2232 p Key

!(
!(
!(
!(
!(
!(
!(
P171
P297
P171.13
P171.14
P309
P171.01
P170
P171.11
P171.12
J38
J1002
J1001
J1002.019
J1002.016
J1002.001
PAGE ID
No Scale2017 Jenny Lind Water Master Plan
System Map1180 Iron Point Rd., Suite 260Folsom, CA 95630
Phone: (916) 608-2212Fax: (916) 608-2232 p A13

!(
!(
!(
P309
P171
P297J38
J1001
J1002.019
PAGE ID
No Scale2017 Jenny Lind Water Master Plan
System Map1180 Iron Point Rd., Suite 260Folsom, CA 95630
Phone: (916) 608-2212Fax: (916) 608-2232 p A14

P309
PAGE ID
No Scale2017 Jenny Lind Water Master Plan
System Map1180 Iron Point Rd., Suite 260Folsom, CA 95630
Phone: (916) 608-2212Fax: (916) 608-2232 p A15

!(
!(
^
P137
P801
P200
4
P802
J801
J5008
PAGE ID
No Scale2017 Jenny Lind Water Master Plan
System Map1180 Iron Point Rd., Suite 260Folsom, CA 95630
Phone: (916) 608-2212Fax: (916) 608-2232 p B8

!(
!(
!(
P168
P169C
P173
P169
P170
P715
J1003
J1002.2
J1002.1
PAGE ID
No Scale2017 Jenny Lind Water Master Plan
System Map1180 Iron Point Rd., Suite 260Folsom, CA 95630
Phone: (916) 608-2212Fax: (916) 608-2232 p B12

!( !(
!(
!(
!(
!(
!(
!(!(
!(
!(
!(
!(
!(
!(!(
!(!(
!(
!(
!(
!(!(
P170
P310
P171
P337
P323
P175
P297
P173
P299
P171
.11
P715
P335
P169C
P171.13
P171.14
P171
.02
P171
.09
P171
.05
P716
P169
P174P171
.08
P171.01
P325P329
P171.10
P333
P331
P327
P321
P171.12
P171.07 J56
J54
J52
J50
J48J46
J44
J42 J40
J38
J717
J1002
J1005J1004
J1002.1
J1002.019
J1002.016
J1002.014
J1002.010
J1002.007
J1002.005
J1002.004
J1002.001
PAGE ID
No Scale2017 Jenny Lind Water Master Plan
System Map1180 Iron Point Rd., Suite 260Folsom, CA 95630
Phone: (916) 608-2212Fax: (916) 608-2232 p B13

!(
!(
!(!(
!(
P323
P299
P297
P325
P327
P329
J48J46
J44
J38
J1002.019
PAGE ID
No Scale2017 Jenny Lind Water Master Plan
System Map1180 Iron Point Rd., Suite 260Folsom, CA 95630
Phone: (916) 608-2212Fax: (916) 608-2232 p B14

!(
!(
^
P309
P306
P307P3
08
J1134
J1146
PAGE ID
No Scale2017 Jenny Lind Water Master Plan
System Map1180 Iron Point Rd., Suite 260Folsom, CA 95630
Phone: (916) 608-2212Fax: (916) 608-2232 p B15

!(
!(
P800
P801J802
J800
PAGE ID
No Scale2017 Jenny Lind Water Master Plan
System Map1180 Iron Point Rd., Suite 260Folsom, CA 95630
Phone: (916) 608-2212Fax: (916) 608-2232 p C7

!(
!(
!(
!(
!(
!(
!(
!(
!(
!(
M
20
P800
P136
P430
P124
P801
P802
P2006
P200
4
P125
P431
P402
P137
PMP1352
J427
J426
J801
J5010
J5008
J1129J1130
J1131
J11
PAGE ID
No Scale2017 Jenny Lind Water Master Plan
System Map1180 Iron Point Rd., Suite 260Folsom, CA 95630
Phone: (916) 608-2212Fax: (916) 608-2232 p C8

!(
!(
!(
!(
!(
!(
!(
P123
P124
P121
P433
P125
P122
P126
P157
P127
P402
P432
J429
J428
J1127
J1128
J1126
J1129
J1133
PAGE ID
No Scale2017 Jenny Lind Water Master Plan
System Map1180 Iron Point Rd., Suite 260Folsom, CA 95630
Phone: (916) 608-2212Fax: (916) 608-2232 p C9

!(
!(
!(
!(
!(!(
!(
!(
P123
P120
P115
P149
P119
P118
P117
P339P121
P317P4
34
P116 P159
P112
J430
J1120
J1043
J1042
J1125
J1044
J1041
PAGE ID
No Scale2017 Jenny Lind Water Master Plan
System Map1180 Iron Point Rd., Suite 260Folsom, CA 95630
Phone: (916) 608-2212Fax: (916) 608-2232 p C10

!(
!(
!(
!( !(
!(
!(
!(
!(
!(
P313
P201
P135
P339
P168
P163
P181P1
61
P314
P162
P166
P159
P714
P167
P723
P712
J14
J12
J10
J712
J1022
J1024
J1025
J1023
PAGE ID
No Scale2017 Jenny Lind Water Master Plan
System Map1180 Iron Point Rd., Suite 260Folsom, CA 95630
Phone: (916) 608-2212Fax: (916) 608-2232 p C11

!(
!(
!(
!(
!( !(
!(
!(
!(
!(
!(
!(
!(
!(
!(
P168
P719
P173
P717
P163
P177P722
P715
P314
P165
P720
P162
P714
P178
P164
P182
P718
P311
P166
P176
P716
P721
P169
P723
P712
P183
J720
J719
J71
J716
J713J712
J1022
J1021
J1008
J1007
J1024
J1003
J1020
J1026
J1025
PAGE ID
No Scale2017 Jenny Lind Water Master Plan
System Map1180 Iron Point Rd., Suite 260Folsom, CA 95630
Phone: (916) 608-2212Fax: (916) 608-2232 p C12

!(
!(
!(
!(
!( !(
!(
!(
!(
!(
!(
!(
P310
P311
P178
P179
P305
P717
P175
P173
P716
P715
P180
P177
P718
P176
P719
P174
P702
P182 P199
P171
.08
P183
J719
J718
J717
J711
J1008
J1007
J1006
J1005J1004
J1009
J1010
J1020
PAGE ID
No Scale2017 Jenny Lind Water Master Plan
System Map1180 Iron Point Rd., Suite 260Folsom, CA 95630
Phone: (916) 608-2212Fax: (916) 608-2232 p C13

!(
!(
P305
P701
P713
P700
J714
J700
PAGE ID
No Scale2017 Jenny Lind Water Master Plan
System Map1180 Iron Point Rd., Suite 260Folsom, CA 95630
Phone: (916) 608-2212Fax: (916) 608-2232 p C14

!(
!(
P304
P306
P305J1145
PAGE ID
No Scale2017 Jenny Lind Water Master Plan
System Map1180 Iron Point Rd., Suite 260Folsom, CA 95630
Phone: (916) 608-2212Fax: (916) 608-2232 p C15

!(
!(
!(!(
!( !(!(!(
20
24P460
P134
P463
P133
P402
P128
P461 P462A
J463 J4J464
J466 J461
J404
J1139
J11
PAGE ID
No Scale2017 Jenny Lind Water Master Plan
System Map1180 Iron Point Rd., Suite 260Folsom, CA 95630
Phone: (916) 608-2212Fax: (916) 608-2232 p D8

!(
!(
!(
!(!(
!(
!(
!(
!(
!(
!( M
24
P111
P127
P128
P131
P433
P415
P126
P95
P125
P402
P133
P130
P129
P432
P157
P416
PMP131A2
J429
J428
J460
J404
J465A
J1128
J1138
J1137
J1136
J1135
J1133
PAGE ID
No Scale2017 Jenny Lind Water Master Plan
System Map1180 Iron Point Rd., Suite 260Folsom, CA 95630
Phone: (916) 608-2212Fax: (916) 608-2232 p D9

!(
!(
!(
!(
!(
!(
!(
!(
!(
!(
!(
!(
P91
P112
P95
P116
P111
P149
P115
P113
P119
P154
P94
P159
P85P93
P92
P153
P114
P417
P118
P117
P82
J16
J1042
J1036
J10
J1111
J1037
J1038
J1044
J1040
J1039
J1041
PAGE ID
No Scale2017 Jenny Lind Water Master Plan
System Map1180 Iron Point Rd., Suite 260Folsom, CA 95630
Phone: (916) 608-2212Fax: (916) 608-2232 p D10

A
!(
!(
!(
!(
!(
!(
!(
!(
!(!(
!(
!(
!(
!(
!( !(
!(
!(
!(
!(!(!(!(!(
!(!(
!(
MMM^
P172
P313
P85
P108
0
P91
P90
P87
P88
P163
P439
P154
P181
P155
P151
P159
P161
P89
P422
P420
P285
P421
P437
P162
P158
P436
P201
P316
P714
P435
P732
P166
P86
P423
P1090
P510
900U
J14
J12
J705
J119
J501
J500J701
J111
J435
J431
J417
J416
J415
J414
J1024
J1045
J1036
J1033 J1148
J1048
J1031
J1035
J1115
J1025
J1034
PAGE ID
No Scale2017 Jenny Lind Water Master Plan
System Map1180 Iron Point Rd., Suite 260Folsom, CA 95630
Phone: (916) 608-2212Fax: (916) 608-2232 p D11

A
!(
!(
!(
!(
!(
!(
!(
!(
!( !(
!( !(!(
!(
!(
!( !(
!(
!(
!(
!(
!(
!(
!(
!(
!(
!(!(!(!(
P163
P189
P195
P188
P172
P151P418
P177P722
P436
P196
P164
P185
P108
0
P315
P187
P186
P184
P165
P720
P162
P714
P421
P710
P178
P182
P319
P721
P183
P176
P166
P180
P150
902D
J119
J423
J439
J431
J720
J716
J415
J708
J707
J1021
J1008
J1024
J1050J1051
J1030
J1029
J1028
J10
J1020
J1143
J1026
J1027
J1025
PAGE ID
No Scale2017 Jenny Lind Water Master Plan
System Map1180 Iron Point Rd., Suite 260Folsom, CA 95630
Phone: (916) 608-2212Fax: (916) 608-2232 p D12

!(
!(
!(
!(
!(
!(
!(
!(
!(
!(
!(
!(
!(
!(
!(
!(
!(
!(
!(
!(
P197
P190
P192
P178
P179
P196
P199
P195
P189
P706
P198
P180
P300
P319 P194
P702
P177
P184
P301
P709
P707
P191P1
93
P183
P176
P182
P701
P312
P708
P710J708
J707
J731
J711
J710
J703
J1008
J1009
J1017
J1016
J1015
J1144
J1018
J1011
J1013
J1019
J1012
J1010J1020
PAGE ID
No Scale2017 Jenny Lind Water Master Plan
System Map1180 Iron Point Rd., Suite 260Folsom, CA 95630
Phone: (916) 608-2212Fax: (916) 608-2232 p D13

!(
!(
!(
!(
!(
!(
!(
!(
!(
!(
!(
!(
!(
!(
!(
!(
!(
!(
P312 P302
P701
P700
P709
P706
P730
P705
P301
P731
P704
P724
P300
P191
P713
P725
P703
P726
P708
P192
P190
P728 P727
J729
J728
J727
J726
J725J724
J714
J706
J731
J704
J715
J703
J702
J700
J1016
J1015
J1013
J1147
PAGE ID
No Scale2017 Jenny Lind Water Master Plan
System Map1180 Iron Point Rd., Suite 260Folsom, CA 95630
Phone: (916) 608-2212Fax: (916) 608-2232 p D14

!(
!(!(
!( !(
^
P304
P302 P303
P730
P731
P729
P728 P727
J730J729
J728J724
J723
PAGE ID
No Scale2017 Jenny Lind Water Master Plan
System Map1180 Iron Point Rd., Suite 260Folsom, CA 95630
Phone: (916) 608-2212Fax: (916) 608-2232 p D15

!(!(
!(
24P460
P416
P96
P463
J411
J466 J461
PAGE ID
No Scale2017 Jenny Lind Water Master Plan
System Map1180 Iron Point Rd., Suite 260Folsom, CA 95630
Phone: (916) 608-2212Fax: (916) 608-2232 p E8

!(
!(
!(
!(
!(
!(
!(
!( M
24
P95
P96
P416
P111
P79
P424
P131
P78
P81
P80
P130
PMP131A1
J418
J411
J465A
J1067
J10
J1138
J1137
J1068
PAGE ID
No Scale2017 Jenny Lind Water Master Plan
System Map1180 Iron Point Rd., Suite 260Folsom, CA 95630
Phone: (916) 608-2212Fax: (916) 608-2232 p E9

!(
!(
!(
!(
!(
!(
!(
!(
!(
!(
!( P81
P71
P76
P73
P95
P91
P111
P77
P78
P154
P417
P85P82
P94
P83
P80
P93
P92
P153
J418
J412
J1066
J1065
J1046
J1036
J10
J1111
J1037
J1038
PAGE ID
No Scale2017 Jenny Lind Water Master Plan
System Map1180 Iron Point Rd., Suite 260Folsom, CA 95630
Phone: (916) 608-2212Fax: (916) 608-2232 p E10

A
!(
!(
!(
!(
!(
!(
!(!(
!(
!(
!(
!(!(
!(
!(
!( !( !(
P172
P1080
P73
P71
P76
P85
P83
P84
P63P141
P90
P87
P88
P64
P75
P154
P155
P151
P86
P89
P74
P91
P140
P420
P421
269
P147
P423
P435
P61
P422
J417
J415
J414
1001510013
J1062
J1063
J1064
J1047
J1045
J1036
J1033 J1148
J1048
J1049
J1060
PAGE ID
No Scale2017 Jenny Lind Water Master Plan
System Map1180 Iron Point Rd., Suite 260Folsom, CA 95630
Phone: (916) 608-2212Fax: (916) 608-2232 p E11

A
A
A
!( !(
!( !(
!(!(
!(
!(
!(
!(
!(
!(
!(
!(
(
!(
!(
!(
!( !(
P1080
P189
P140
P148
P143
P188
P711
P146
P151P418
P156
P141
P150
P147
P172
P139
P145
P144
P421
P710
269
P319
P438
P187
P61
901U
902D
J621
J423
J433
J415
J7
J708
J707
1001510013
J1057
J1060
J1054
J1056
J1050
J1053
J1052
J1051
J1030
PAGE ID
No Scale2017 Jenny Lind Water Master Plan
System Map1180 Iron Point Rd., Suite 260Folsom, CA 95630
Phone: (916) 608-2212Fax: (916) 608-2232 p E12

!(
!(
!(
!(
!(
!(
!(
!(
!(
P190
P192
P189
P319
P711
P143
P301
P709
P191P1
93P1
94
P708
P710
J709
J708
J707
J731
J1017
J1016
J1015
J1144
PAGE ID
No Scale2017 Jenny Lind Water Master Plan
System Map1180 Iron Point Rd., Suite 260Folsom, CA 95630
Phone: (916) 608-2212Fax: (916) 608-2232 p E13

!(
!(
!(
!(
!(
!(
!(
!(
!(
!(
!(
!(
!(
P312
P709
P730
P705
P731
P301
P302
P724
P191
P725
P726
P708
P192
P190
P728 P727
J729
J728
J727
J726
J725J724
J706
J731
J704
J1016
J1015
J1147
PAGE ID
No Scale2017 Jenny Lind Water Master Plan
System Map1180 Iron Point Rd., Suite 260Folsom, CA 95630
Phone: (916) 608-2212Fax: (916) 608-2232 p E14

!(!(
!( !(
^
P730
P303
P731
P729
P728 P727
J730J729
J728J724
PAGE ID
No Scale2017 Jenny Lind Water Master Plan
System Map1180 Iron Point Rd., Suite 260Folsom, CA 95630
Phone: (916) 608-2212Fax: (916) 608-2232 p E15

!(
!(
!(
!(
!(
P97
P99
P96
P98
P551
P555
J5
J1069
J1070
J1124
PAGE ID
No Scale2017 Jenny Lind Water Master Plan
System Map1180 Iron Point Rd., Suite 260Folsom, CA 95630
Phone: (916) 608-2212Fax: (916) 608-2232 p F8

!(!(
!(
!(
!(
!(
!(
!(
!(!(
!(
P96
P78
P79
P55
P555
P425
P81
P22
P80
P550
P424
P501
P551
P71
P25
J420
J419J551
J508J1090
J1088
J1080
J1067
J10
J1124
PAGE ID
No Scale2017 Jenny Lind Water Master Plan
System Map1180 Iron Point Rd., Suite 260Folsom, CA 95630
Phone: (916) 608-2212Fax: (916) 608-2232 p F9

!(
!(
!(
!(
!(!( !(
!(
!(
!(
!(
!(
!(
!(
P71
P78
P73
P68
P55
P51
P66
P52
P77
P56
P25
P49
P81
P53
P50
P80
P69
P70
P76
P54
P65
P26
P501
P67
J420
J1092
J1093
J1091
J1086
J1085
J10
J10
J1087
J1088
J1066
J1065
J1089
PAGE ID
No Scale2017 Jenny Lind Water Master Plan
System Map1180 Iron Point Rd., Suite 260Folsom, CA 95630
Phone: (916) 608-2212Fax: (916) 608-2232 p F10

A
A
!(
!(
!(
!(
!(
!(
!(
!(
!(
!(!(
!( !(
P58
P64
P71
P62
P51
P60
P59
P63
P57
P50
P66
P1080P140
P172
P73
269
P65
P67P68
P61
263
1001510013
1001110009
J1094
J1085
J1083
J1084
J1062
J1082
J1081
J1063
PAGE ID
No Scale2017 Jenny Lind Water Master Plan
System Map1180 Iron Point Rd., Suite 260Folsom, CA 95630
Phone: (916) 608-2212Fax: (916) 608-2232 p F11

A
!(
!(
!(
!(
!(
!(!(
!(
(
!(!(!(!(
!(!(
!( !(
MM
M
^
P1080
P140
P143
P60
269
P146
P502
P139
P419
P144
P145
P1088
P61
P1104
J133J131
J127
J123J121J503
J413
1001510013
J1061
J1058
J1057
J1054
PAGE ID
No Scale2017 Jenny Lind Water Master Plan
System Map1180 Iron Point Rd., Suite 260Folsom, CA 95630
Phone: (916) 608-2212Fax: (916) 608-2232 p F12

!(
!(
!(!(
!(
!(
P97
P107
P110
P100
P108
P109
P102
P414
P101
P103
J410
J1072
J1073
J1076
J1074
J1075
PAGE ID
No Scale2017 Jenny Lind Water Master Plan
System Map1180 Iron Point Rd., Suite 260Folsom, CA 95630
Phone: (916) 608-2212Fax: (916) 608-2232 p G7

!(
!(
!(
!(
!(
!(
!(
P99
P97
P551
P101
P100
P552
P102
P553
P555
P110
J554
J553
J5
J550
J1071
J1074
J11
PAGE ID
No Scale2017 Jenny Lind Water Master Plan
System Map1180 Iron Point Rd., Suite 260Folsom, CA 95630
Phone: (916) 608-2212Fax: (916) 608-2232 p G8

!(!(
!(
!(!(
!(
P22
P25
P55P5
51P5
55
P550
P425 J419
J550
J508J1090
J1124
PAGE ID
No Scale2017 Jenny Lind Water Master Plan
System Map1180 Iron Point Rd., Suite 260Folsom, CA 95630
Phone: (916) 608-2212Fax: (916) 608-2232 p G9

A
!(
!(
!(
!(
!(
!(
!(
!(
!(
!(
!(!(
P25
P27
P28
P26
P55
P51
P50P49
P52
P48
P47
P30
P53
P56
P43
P54
P32
257
P46
P22
P29
259
NEW032100
10001
J10
J1104
J1103
J1142
J1096
J1092
J1095
J1091
J1089
PAGE ID
No Scale2017 Jenny Lind Water Master Plan
System Map1180 Iron Point Rd., Suite 260Folsom, CA 95630
Phone: (916) 608-2212Fax: (916) 608-2232 p G10

A
A!(
!(
!(
!(
!(
!(!(
!( !(
!(!(
!(!(
257
P39
P58
P51
P59
P38
P57
P50
P47
P42
P45
P43
P32
P28P48
P30
P44
P46
259
P41P40
NEW032
NEW042 10007
10005
1000310001
J1100
J1113J1098
J1097
J1103
J1096
J1094
J1082
PAGE ID
No Scale2017 Jenny Lind Water Master Plan
System Map1180 Iron Point Rd., Suite 260Folsom, CA 95630
Phone: (916) 608-2212Fax: (916) 608-2232 p G11

!(
!(
!(
!(
!(
!(!(
P105
P104
P278
P107
P102
P103
P414
P106
P108
J410 J1076
J1075
J1079
J1077
J1078
PAGE ID
No Scale2017 Jenny Lind Water Master Plan
System Map1180 Iron Point Rd., Suite 260Folsom, CA 95630
Phone: (916) 608-2212Fax: (916) 608-2232 p H7

!(
!(
!(
!(
!(
P17
P19
P552
P556
P102
P553
J554
J553
J552
J1123
PAGE ID
No Scale2017 Jenny Lind Water Master Plan
System Map1180 Iron Point Rd., Suite 260Folsom, CA 95630
Phone: (916) 608-2212Fax: (916) 608-2232 p H8

!(
P19
P22
P17
P21
P25
J1122
PAGE ID
No Scale2017 Jenny Lind Water Master Plan
System Map1180 Iron Point Rd., Suite 260Folsom, CA 95630
Phone: (916) 608-2212Fax: (916) 608-2232 p H9

A
!(
!(
!(
!(
!(
!(
!(
!(
!(
!(
P25
P34
P27
P31
P28
P22
P20
P18
P24
P29
P21
P30
P23
P32
P43
P19
P40
401U
J4001
J1141
J10
J1108
J1106
J1105
J1104
J1103
J1107
J1122
PAGE ID
No Scale2017 Jenny Lind Water Master Plan
System Map1180 Iron Point Rd., Suite 260Folsom, CA 95630
Phone: (916) 608-2212Fax: (916) 608-2232 p H10

!(
!(
!(!(
!(
!(
!(
!(
!(
!(
!(
P39
P37
P38
P33
P36
P34
P31
P35
P42
P45
P32
P40
P43P28
P30
P44
P41
J1102
J1101
J1100
J1099
J1141
J1110
J1113J1098
J1103
PAGE ID
No Scale2017 Jenny Lind Water Master Plan
System Map1180 Iron Point Rd., Suite 260Folsom, CA 95630
Phone: (916) 608-2212Fax: (916) 608-2232 p H11

!(
P39
P38
P36
J1099
PAGE ID
No Scale2017 Jenny Lind Water Master Plan
System Map1180 Iron Point Rd., Suite 260Folsom, CA 95630
Phone: (916) 608-2212Fax: (916) 608-2232 p H12

A
A
!(
!(
!(
!(
!(
!(
!(
P278
P275
P277 P272
P276
P274
P406
P273P271
241
415U
410U
J400
J4016
J2054
J2046
J4010
J2050
J4015
PAGE ID
No Scale2017 Jenny Lind Water Master Plan
System Map1180 Iron Point Rd., Suite 260Folsom, CA 95630
Phone: (916) 608-2212Fax: (916) 608-2232 p I6

!(!(
!(
!(
!(
!(
!(
!(
!(
!(
P278
P213
P263
P275
P264
P106
P274
P265
P413
P105
P409
P273
P412
P400
241
P104
J409
J408
J407J406J4016
J1079
J1078
J2045
J2046
J2044
PAGE ID
No Scale2017 Jenny Lind Water Master Plan
System Map1180 Iron Point Rd., Suite 260Folsom, CA 95630
Phone: (916) 608-2212Fax: (916) 608-2232 p I7

!(
P213
P17
J
PAGE ID
No Scale2017 Jenny Lind Water Master Plan
System Map1180 Iron Point Rd., Suite 260Folsom, CA 95630
Phone: (916) 608-2212Fax: (916) 608-2232 p I8

!(
!(
P17
P554
P213J18
J555
PAGE ID
No Scale2017 Jenny Lind Water Master Plan
System Map1180 Iron Point Rd., Suite 260Folsom, CA 95630
Phone: (916) 608-2212Fax: (916) 608-2232 p I9

A
!( !(
!(
!(
!(
!(
!(
!(
P34
P18
P14
P20
P554
P503
P500
P504
P509
402U
J509
J5
J502J4002
J1112
J1108
J1109
PAGE ID
No Scale2017 Jenny Lind Water Master Plan
System Map1180 Iron Point Rd., Suite 260Folsom, CA 95630
Phone: (916) 608-2212Fax: (916) 608-2232 p I10

!(
!(
!(
!(
!(
P36
P34P1
4
P35
P503
P509
P37
P33
J509
J504
J1112
J1102
J1101
PAGE ID
No Scale2017 Jenny Lind Water Master Plan
System Map1180 Iron Point Rd., Suite 260Folsom, CA 95630
Phone: (916) 608-2212Fax: (916) 608-2232 p I11

!(
!(
!(
18
P215
P237
P480
J30
J4
J20
PAGE ID
No Scale2017 Jenny Lind Water Master Plan
System Map1180 Iron Point Rd., Suite 260Folsom, CA 95630
Phone: (916) 608-2212Fax: (916) 608-2232 p J5

A
A
A
!(
!(!(
!(
!(
!(
!(
!(!(
!(!(!(
!(
!(
P277
18
P237
P269
P275
P411
P271
P272
P279
P276
P267
P273
P270
P274
P239
241
P480 P4
81
P268
410D
J20
J481 J434
J480
J4009
J4016 J2046
J4010
J2047
J2050
J2049J2052
PAGE ID
No Scale2017 Jenny Lind Water Master Plan
System Map1180 Iron Point Rd., Suite 260Folsom, CA 95630
Phone: (916) 608-2212Fax: (916) 608-2232 p J6

A
!( !(
!(!(
!(
!(
!(
!(
!(
!(
!(
!(
!(
!(
!(
!(
P261
P265
P401
P267
P263
P275
P264
P262
P266
P273P269
P279
P410
P274
P413
P400
P213
P409
P411
P283
P412
241
J28
J409
J408
J407J406
J403
J4008
J4016
J2045
J2046
J2048
J2047
J2042
J2043
J2044
PAGE ID
No Scale2017 Jenny Lind Water Master Plan
System Map1180 Iron Point Rd., Suite 260Folsom, CA 95630
Phone: (916) 608-2212Fax: (916) 608-2232 p J7

!(
!(
!(
P427
P213
P401
P403
J
J4
J405
PAGE ID
No Scale2017 Jenny Lind Water Master Plan
System Map1180 Iron Point Rd., Suite 260Folsom, CA 95630
Phone: (916) 608-2212Fax: (916) 608-2232 p J8

A
!(
!(
!(
!(
!(
!(
229
P427
P426
P403
P213
P15
P428
403D
J18
J422
J421
J436
J4003
J1117
PAGE ID
No Scale2017 Jenny Lind Water Master Plan
System Map1180 Iron Point Rd., Suite 260Folsom, CA 95630
Phone: (916) 608-2212Fax: (916) 608-2232 p J9

A
A
!(
!(
!(
!(
!(
!(
!(!(
!(
!(!(
P14
P15
P10
P12
P16
P13
P508
P426
P282
P509
P505
229
P507
403U
404D
J507
J424
J421
J505
J1114
J1118
J4004
J4003
J1117
J1116
J1112
PAGE ID
No Scale2017 Jenny Lind Water Master Plan
System Map1180 Iron Point Rd., Suite 260Folsom, CA 95630
Phone: (916) 608-2212Fax: (916) 608-2232 p J10

!(
!(
^
P10
P14
P12
P509J1114
J1112
PAGE ID
No Scale2017 Jenny Lind Water Master Plan
System Map1180 Iron Point Rd., Suite 260Folsom, CA 95630
Phone: (916) 608-2212Fax: (916) 608-2232 p J11

!(
!(
!(
!(
P215
18
P686
P289
P237
P318
P257
J30
J24
J677
J2012
PAGE ID
No Scale2017 Jenny Lind Water Master Plan
System Map1180 Iron Point Rd., Suite 260Folsom, CA 95630
Phone: (916) 608-2212Fax: (916) 608-2232 p K5

!(
!(
!(
!(
!(
P291
P237
P257
18
P239
P279
P618
P287
J24
J22
J20
J6
PAGE ID
No Scale2017 Jenny Lind Water Master Plan
System Map1180 Iron Point Rd., Suite 260Folsom, CA 95630
Phone: (916) 608-2212Fax: (916) 608-2232 p K6

!(
!(
!(
!(
!(
!(
P261
P287 P408
P205
P279
P618
P283
P242
P407
P208
J28
J26
J601
J402
J401
PAGE ID
No Scale2017 Jenny Lind Water Master Plan
System Map1180 Iron Point Rd., Suite 260Folsom, CA 95630
Phone: (916) 608-2212Fax: (916) 608-2232 p K7

A
A
!(
!(
!(
!(
!(
!(!(
!(
P207
P208
P205
P403
P407
P200P261
P427
P408
P995
P601
403B2
J600
J401
J610
J437
J4006
J2004
J2055
J2004.1
PAGE ID
No Scale2017 Jenny Lind Water Master Plan
System Map1180 Iron Point Rd., Suite 260Folsom, CA 95630
Phone: (916) 608-2212Fax: (916) 608-2232 p K8

A
!(
!(!(
!(
!(
!(
229
P282
P202
P206
P207
P427
P203
P403
P428
P204
P426
P15
403U
J436
J2001
J2002
J2003
J4003 J1117
PAGE ID
No Scale2017 Jenny Lind Water Master Plan
System Map1180 Iron Point Rd., Suite 260Folsom, CA 95630
Phone: (916) 608-2212Fax: (916) 608-2232 p K9

A
A
!(!(
!(!(
!(
!(!(
P202
P12
P10
P15
P282
P13
P508
P426
229403U
404D J424
J1118
J4004
J4003
J1117
PAGE ID
No Scale2017 Jenny Lind Water Master Plan
System Map1180 Iron Point Rd., Suite 260Folsom, CA 95630
Phone: (916) 608-2212Fax: (916) 608-2232 p K10

A!(
!(
!(
!(
^
P10
P202
P12
P506
405U
J506
J5004
J1121
PAGE ID
No Scale2017 Jenny Lind Water Master Plan
System Map1180 Iron Point Rd., Suite 260Folsom, CA 95630
Phone: (916) 608-2212Fax: (916) 608-2232 p K11

A
A
!(
!(
!(
!(
!(!(
!(
!(
!(
!(
P318
P289
P259
P244
P686
P291
P251
P243
P252
297
P250
P241
P254
307
287
4014
U
NEW
071
J32
J688
10051
10033
J4013 J2017
J2016
J2014
J2015
J2012
PAGE ID
No Scale2017 Jenny Lind Water Master Plan
System Map1180 Iron Point Rd., Suite 260Folsom, CA 95630
Phone: (916) 608-2212Fax: (916) 608-2232 p L5

A
!(
!(
!(
!(
!(!(
!(!(
!(
P244
P291
P621
P240
P249
P241
P618
P250
P287
P254
P289
P238
P251
287
J32
J6
1005310033 J2018
J2017
J2011
J20
PAGE ID
No Scale2017 Jenny Lind Water Master Plan
System Map1180 Iron Point Rd., Suite 260Folsom, CA 95630
Phone: (916) 608-2212Fax: (916) 608-2232 p L6

!(
!(
!(
!(
!(
!(
!(
!(
!(
!(
P245
P240
P205
P244
P242P2
46
P404
P238
P405
P618
P287
P208
P211
P621
P604
P210
P209
J601
J612
J438
J2013
J2006
J2008
J2009
J2010
J2007
PAGE ID
No Scale2017 Jenny Lind Water Master Plan
System Map1180 Iron Point Rd., Suite 260Folsom, CA 95630
Phone: (916) 608-2212Fax: (916) 608-2232 p L7

AA
!( !(
!(
!(
!(!(
!(
!(
!(
P208
P405
P210
P205
P429P209
P211
P404
P1075
P200 P207
404B2
403B2
J82
J2005
J2006
J2004
J2007
J2005.1
J2004.1
PAGE ID
No Scale2017 Jenny Lind Water Master Plan
System Map1180 Iron Point Rd., Suite 260Folsom, CA 95630
Phone: (916) 608-2212Fax: (916) 608-2232 p L8

!(
!(P429P206
P202
J425
J2001
PAGE ID
No Scale2017 Jenny Lind Water Master Plan
System Map1180 Iron Point Rd., Suite 260Folsom, CA 95630
Phone: (916) 608-2212Fax: (916) 608-2232 p L9

A
A
!(
!(
!(
!(!(
!(
!(
!(
!(
!(
!(
!(
!(
!(
!(
P259
299
287
301
P244
285
283
P251
P243
297
P252
303P253
P250
P254
281
307
4014
U
NEW
071
J688
10051
10049
10047
10045
10043
10033
10031
10029
100
J4013 J2017
J2016
J2014J2015
PAGE ID
No Scale2017 Jenny Lind Water Master Plan
System Map1180 Iron Point Rd., Suite 260Folsom, CA 95630
Phone: (916) 608-2212Fax: (916) 608-2232 p M5

A
A
!(
!(
!(
!(
!(
!(
!(
!(!(
!(
!(!(!(!(
!(
!(
!(
!(
!(
!(
!(
!(!(
!(
!(
!(
P244
P256
P249
289
P651
311
P233
287285
P619
279
P280
283
P253
P250
293
P248
291P2
58
P650
295
P281
271
281
277
P255
P254
313
P222
P251
273275
303
J605
J650
10055
10053
10049
1004110039
10037
10035
10033
10031
10029
10027
10025 10023
1002110017
J4012
J2019J2018
J2028
J2029
J2017
J2030
J2031
PAGE ID
No Scale2017 Jenny Lind Water Master Plan
System Map1180 Iron Point Rd., Suite 260Folsom, CA 95630
Phone: (916) 608-2212Fax: (916) 608-2232 p M6

!(
!(
!(
!(
!(
!(
!(
!(
!(
!(
!(
P218
P280
P2113
P244
P600
P232
P220
P233
P246
P217
P221
P248
P405
P222
P247
P224
P245
P604
P619
P281
P404
J605
J612
J438
J2019
J2028
J2027
J2020
J2026
J2022
J2013
J2021
PAGE ID
No Scale2017 Jenny Lind Water Master Plan
System Map1180 Iron Point Rd., Suite 260Folsom, CA 95630
Phone: (916) 608-2212Fax: (916) 608-2232 p M7

!( !(
!(
!(
!(
!(
!(
!( !(
!(
P405
P600
P220
P218
P2113
P602P219
P441
P603
P1075P442
P223
P514 239
P512
J82J80J442
J440
J514J512
J510
J611
J2025
J2024
PAGE ID
No Scale2017 Jenny Lind Water Master Plan
System Map1180 Iron Point Rd., Suite 260Folsom, CA 95630
Phone: (916) 608-2212Fax: (916) 608-2232 p M8

!(
!(
P670
P672
P671
J684
J682
PAGE ID
No Scale2017 Jenny Lind Water Master Plan
System Map1180 Iron Point Rd., Suite 260Folsom, CA 95630
Phone: (916) 608-2212Fax: (916) 608-2232 p N1

!(!(P673
P670
P676
P675
P674J680 J679
PAGE ID
No Scale2017 Jenny Lind Water Master Plan
System Map1180 Iron Point Rd., Suite 260Folsom, CA 95630
Phone: (916) 608-2212Fax: (916) 608-2232 p N2

!(P674
P675
P673J679
PAGE ID
No Scale2017 Jenny Lind Water Master Plan
System Map1180 Iron Point Rd., Suite 260Folsom, CA 95630
Phone: (916) 608-2212Fax: (916) 608-2232 p N3

P674
PAGE ID
No Scale2017 Jenny Lind Water Master Plan
System Map1180 Iron Point Rd., Suite 260Folsom, CA 95630
Phone: (916) 608-2212Fax: (916) 608-2232 p N4

!(
!(
!(
!(
!(
!(
P259
P260
P674 P236
301
303P253
283
P650
281
299
J651
10049
10047
10045
100
J2036
PAGE ID
No Scale2017 Jenny Lind Water Master Plan
System Map1180 Iron Point Rd., Suite 260Folsom, CA 95630
Phone: (916) 608-2212Fax: (916) 608-2232 p N5

A
!(
!(
!(
!(
!(
!(
!(
!(
!(
!(
!(
!(
!(
!(
!(
!(!(!(!(
!(
!(
!(
P236
P233
P235
P684
P651
311
P635
P260
P677
279
P253
P678
P650
P258
P231
P679
283
P680
P281
271
281
277
313
P222
273275
303
P681
411U
J651
J650
J672
J671
J670
J687
10049
10027
10025 10023
1002110017
J4012
J4011
J2032
J2028
J2030
J2031
J2035
J2034
PAGE ID
No Scale2017 Jenny Lind Water Master Plan
System Map1180 Iron Point Rd., Suite 260Folsom, CA 95630
Phone: (916) 608-2212Fax: (916) 608-2232 p N6

A
!(
!(
!(
!(
!(
!(
!(
!(
!(
!(
!(
!(!(
!(
P232
P230
P224
P233
P218
P220
P653
P231
P221
P222
P646
P635
P654A
P643
P281
P680
J606
J604
J607
J522
J672
J522A
J606A
J2032
J2028
J2033
J2027
J2026
PAGE ID
No Scale2017 Jenny Lind Water Master Plan
System Map1180 Iron Point Rd., Suite 260Folsom, CA 95630
Phone: (916) 608-2212Fax: (916) 608-2232 p N7

A
A
!(
!(
!(
!(!(
!(
!(
!(
!(!(
!(
P225
P220
P230
P218
253
P224
P65324
9
P223
P661
P219
P655
P229
P226
P228P603
NEW
022
99959993
J609
J2038J20
J2037
J2025
J2024
PAGE ID
No Scale2017 Jenny Lind Water Master Plan
System Map1180 Iron Point Rd., Suite 260Folsom, CA 95630
Phone: (916) 608-2212Fax: (916) 608-2232 p N8

A
!(
!(
!(
!(
253
P661
P225
P226
NEW
022 9999
9997
J608
J2039
PAGE ID
No Scale2017 Jenny Lind Water Master Plan
System Map1180 Iron Point Rd., Suite 260Folsom, CA 95630
Phone: (916) 608-2212Fax: (916) 608-2232 p N9

!(
!(
!(
P671
P670
P672J684
J683
J682
PAGE ID
No Scale2017 Jenny Lind Water Master Plan
System Map1180 Iron Point Rd., Suite 260Folsom, CA 95630
Phone: (916) 608-2212Fax: (916) 608-2232 p O1

!(!(
!(
!(
P676
P673P675
P293
P670P674
P295J34
J681
J680 J679
PAGE ID
No Scale2017 Jenny Lind Water Master Plan
System Map1180 Iron Point Rd., Suite 260Folsom, CA 95630
Phone: (916) 608-2212Fax: (916) 608-2232 p O2

!(
!(
!( !(
P674
P293
P675
P295
P673
J36J34
J679
J678
PAGE ID
No Scale2017 Jenny Lind Water Master Plan
System Map1180 Iron Point Rd., Suite 260Folsom, CA 95630
Phone: (916) 608-2212Fax: (916) 608-2232 p O3

!(
!(
!(
!(
!(
!(!(
!(
!(
P684
P235P260
P677
P678
P679
P687
P682
P680
P685
P681
J676
J675 J67
J673
J672
J671
J670
J687
J2035
PAGE ID
No Scale2017 Jenny Lind Water Master Plan
System Map1180 Iron Point Rd., Suite 260Folsom, CA 95630
Phone: (916) 608-2212Fax: (916) 608-2232 p O6

!(
!(
!(
!(
!(
!(
!(
!(
!(
!(!(
P659
P653
P230
P654A
P682P687
P680
P681
P646
P685P6
55
J606
J604
J603
J607
J676
J674
J673
J672
J606A
J20
J2041A
PAGE ID
No Scale2017 Jenny Lind Water Master Plan
System Map1180 Iron Point Rd., Suite 260Folsom, CA 95630
Phone: (916) 608-2212Fax: (916) 608-2232 p O7

A
A
!(
!(
!(!(
!(
!(!(
!(
253
P227
P65324
9
P655
P230
P659 245
NEW
022
J609
J2040
J2041
J2041A
PAGE ID
No Scale2017 Jenny Lind Water Master Plan
System Map1180 Iron Point Rd., Suite 260Folsom, CA 95630
Phone: (916) 608-2212Fax: (916) 608-2232 p O8

A
!(
!(
253
NEW
022 9999
PAGE ID
No Scale2017 Jenny Lind Water Master Plan
System Map1180 Iron Point Rd., Suite 260Folsom, CA 95630
Phone: (916) 608-2212Fax: (916) 608-2232 p O9

THIS PAGE LEFT INTENTIONALLY BLANK

2017 Jenny Lind Water Master Plan Calaveras County Water District
APPENDIX B
Model Programming

THIS PAGE LEFT INTENTIONALLY BLANK

Appendix B 1 of 3
NameID (Char) TYPE (Int)
ELEVATION (ft)
MIN_LEVEL (ft)
MAX_LEVEL (ft)
INIT_LEVEL (ft)
DIAMETER (ft)
Allow Overflow (Boolean)
A Tank T1 0: Cylindrical 698.7 1 30.5 19 108 NoB Tank T2 0: Cylindrical 897.7 1 30.5 18 78 NoE Tank T3 0: Cylindrical 810.73 1 19 13 69 NoF Tank T4 0: Cylindrical 811.08 1 19 13 98 No602 Tank T5 0: Cylindrical 820.6 1 17.5 11 40 No
Tank Modeling Parameters

Appe
ndix
B2
of 3
ID (C
har)
TYPE
(Int
)EL
EVAT
ION
(ft
)DI
AMET
ER
(in)
SHU
T_HE
AD
(ft)
DSGN
_HEA
D (ft
)DS
GN_F
LOW
(g
pm)
HIGH
_HEA
D (ft
)HI
GH_F
LOW
(g
pm)
PMP1
352:
Exp
onen
tial 3
-Poi
nt C
urve
616.
943
850
750
200
550
300
PMP2
2: E
xpon
entia
l 3-P
oint
Cur
ve70
88
300
138
820
120
900
PMP3
2: E
xpon
entia
l 3-P
oint
Cur
ve70
8.34
840
034
160
012
592
5PM
P42:
Exp
onen
tial 3
-Poi
nt C
urve
706.
828
400
341
600
125
925
PMP6
2: E
xpon
entia
l 3-P
oint
Cur
ve54
310
270
217.
91,
388.
0012
02,
000.
00PM
P72:
Exp
onen
tial 3
-Poi
nt C
urve
543
1028
022
4.9
2,08
2.00
160
2,80
0.00
PMP8
2: E
xpon
entia
l 3-P
oint
Cur
ve54
310
280
224.
92,
082.
0016
02,
800.
00U
7000
2: E
xpon
entia
l 3-P
oint
Cur
ve61
73
850
750
200
550
300
U70
022:
Exp
onen
tial 3
-Poi
nt C
urve
708
1021
013
883
450
1,34
0.00
U70
042:
Exp
onen
tial 3
-Poi
nt C
urve
708
830
013
883
450
1,34
0.00
U70
062:
Exp
onen
tial 3
-Poi
nt C
urve
708
856
034
160
022
080
0U
7008
1: D
esig
n Po
int C
urve
708
1020
030
050
012
01,
000.
00U
7010
2: E
xpon
entia
l 3-P
oint
Cur
ve70
88
200
136
834
120
1,00
0.00
Base
line
Pum
p M
odel
ing
Para
met
ers

Appendix B 3 of 3
ID (Char) TYPE (Int) ELEVATION (ft) DIAMETER (in) SETTING (Double) Notes401 0: Pressure Reducing Valve 546.98 4 75
4014 0: Pressure Reducing Valve 300.83 8 73402 0: Pressure Reducing Valve 617.95 4 36403 0: Pressure Reducing Valve 613.78 6 75
403B 0: Pressure Reducing Valve 453.42 6 99404 0: Pressure Reducing Valve 617.64 6 73
404B 0: Pressure Reducing Valve 495.76 6 75405 0: Pressure Reducing Valve 689.51 6 30406 0: Pressure Reducing Valve 419.42 6 113408 0: Pressure Reducing Valve 408.89 6 65409 0: Pressure Reducing Valve 408.84 6 70410 0: Pressure Reducing Valve 382.27 4 81411 0: Pressure Reducing Valve 347.34 8 55415 0: Pressure Reducing Valve 352.57 10 143416 0: Pressure Reducing Valve 472 6 73420 0: Pressure Reducing Valve 379.38 6 100900 0: Pressure Reducing Valve 646.9 6 0 Closed 901 0: Pressure Reducing Valve 640.49 6 0 Closed 902 0: Pressure Reducing Valve 640.44 6 0 Closed
NEW01 0: Pressure Reducing Valve 430.6 4 74NEW02 0: Pressure Reducing Valve 481.52 4 44NEW03 0: Pressure Reducing Valve 727.09 4 55NEW04 0: Pressure Reducing Valve 706.28 4 54NEW05 0: Pressure Reducing Valve 607.01 6 79NEW06 0: Pressure Reducing Valve 671.46 6 49NEW07 0: Pressure Reducing Valve 330.98 6 75NEW08 0: Pressure Reducing Valve 392.36 6 48NEW09 0: Pressure Reducing Valve 409.33 6 40
Baseline PRV Model Settings

THIS PAGE LEFT INTENTIONALLY BLANK

2017 Jenny Lind Water Master Plan Calaveras County Water District
APPENDIX C
Baseline Node, Pipe, and Fire Flow Reports

THIS PAGE LEFT INTENTIONALLY BLANK

Appendix C 1 of 34
ID Demand (gpm) Elevation (ft) Head (ft) Pressure (psi)10001 1.63 727.09 954.1 98.3610003 8.05 727.09 854.02 5510005 0.79 706.28 949.53 105.410007 16.96 706.28 853.87 63.9510009 1.29 607.01 980.56 161.8610011 7.72 607.01 789.33 7910013 2.17 671.46 996 140.6310015 6.18 671.46 789.27 51.0510017 1.78 352 502.81 65.3510019 1.69 350 502.81 66.2110021 1.21 340 502.82 70.5510023 1.68 337 502.83 71.8510025 2.91 327 502.86 76.210027 2.74 319 502.88 79.6710029 5.11 329 502.93 75.3610031 7.78 344 503 68.910033 4.29 334 503.13 73.2810035 4.77 400 540.1 60.710037 5.38 398 540.02 61.5410039 3.7 403 539.99 59.3610041 1.25 404 539.97 58.9210043 9.13 310 503.77 83.9610045 18.71 276 503.16 98.4310047 19.75 257 503.02 106.610049 4.92 276 503 98.3610051 2.3 330.98 542.71 91.7410053 5.1 392.36 503.86 48.3110055 2.74 409.33 502.8 40.59993 1.91 430.6 536.63 45.949995 5.4 430.6 536.62 45.949997 1.6 481.52 536.23 23.719999 31.78 481.52 536.23 23.71J10 1.56 622 850.86 99.16
J1001 79.99 633.86 828.34 84.27J1002 1.77 620.65 830.86 91.09
J1002.001 9.2 617.08 831.02 92.7J1002.004 3.62 615.31 831.24 93.56J1002.005 1.42 612.24 831.47 94.99J1002.007 2.14 614.49 831.52 94.04J1002.010 3.56 620.13 831.23 91.47J1002.014 2.05 624.09 831.04 89.67J1002.016 2.81 620.97 831.03 91.02J1002.019 29.7 624.35 831.01 89.55
J1002.1 5.66 611.77 831.18 95.07J1002.2 15.64 707.26 831.13 53.67
Baseline PHD Node Report

Appendix C 2 of 34
ID Demand (gpm) Elevation (ft) Head (ft) Pressure (psi)Baseline PHD Node Report
J1003 4.07 606.58 831.78 97.58J1004 2.75 611.94 831.79 95.26J1005 4.55 621.81 831.96 91.06J1006 3.12 693.41 829.97 59.17J1007 9.77 614.72 834.94 95.42J1008 2.26 623.18 836.51 92.44J1009 5.28 664.06 836.43 74.69J1010 7.98 670.62 836.38 71.82J1011 4.33 673.77 834.22 69.52J1012 7.73 708.15 834.06 54.56J1013 6.2 715.85 832.63 50.6J1015 4.19 737.58 833.77 41.68J1016 2.85 741.06 833.97 40.26J1017 9.72 662.17 835.49 75.1J1018 8.68 666.78 836.68 73.62J1019 5.56 665.31 836.67 74.25J1020 1.87 645.73 837.57 83.13J1021 4.03 610.93 838.65 98.67J1022 3.11 608.47 850.02 104.66J1023 3.1 612.59 850.86 103.24J1024 2.35 624.7 850.99 98.05J1025 6.75 630.06 856.4 98.07J1026 2.73 600.02 843.36 105.44J1027 7.88 596.68 843.13 106.79J1028 6.45 605.2 837.83 100.8J1029 4.23 595.68 837.37 104.73J1030 7.92 607.36 836.52 99.29J1031 4.46 726.11 873.61 63.91J1033 5.49 616.66 684.79 29.52J1034 7.18 598.17 661.28 27.34J1035 8.23 577.15 662.49 36.98J1036 6.45 546.8 665.1 51.26J1037 3.36 531.43 656.47 54.18J1038 11.78 507.24 648.84 61.35J1039 16.65 531.5 647.34 50.2J1040 11.82 605.85 646.4 17.57J1041 18.84 556.73 646.22 38.78J1042 14.1 533.38 645.34 48.51J1043 5.99 559.87 644.28 36.57J1044 9.18 564.85 645.42 34.91J1045 4.62 561.27 679.64 51.29J1046 14.61 515.5 669.15 66.58J1047 8.46 552.19 678.44 54.7J1048 5.79 627.63 685.57 25.1J1049 6.55 598.24 682.04 36.31

Appendix C 3 of 34
ID Demand (gpm) Elevation (ft) Head (ft) Pressure (psi)Baseline PHD Node Report
J1050 8.07 607.94 684.11 33J1051 3.31 633.21 836.23 87.97J1052 5.95 619.66 836.13 93.8J1053 3.68 627.26 682.4 23.89J1054 6.13 597.82 682.42 36.66J1056 10.76 613.62 682.57 29.88J1057 4.8 594.57 682.4 38.06J1058 8.33 553.92 682.39 55.67J1060 6.18 578.88 682.39 44.85J1061 5.9 618.39 789.27 74.04J1062 8.6 671.46 996 140.63J1063 16.49 670.33 996.27 141.23J1064 9.11 622.17 681.66 25.78J1065 20.16 536.64 678.4 61.43J1066 6.28 521.59 677.55 67.58J1067 11.22 484.65 677.17 83.42J1068 6.53 464.59 633.11 73.02J1069 31.99 425.15 614.73 82.14J1070 5.53 440.14 613.42 75.08J1071 12.42 414.62 604.09 82.1J1072 25.39 433.41 604.19 74J1073 17.21 418.51 601.74 79.39J1074 10.56 406.83 601.26 84.24J1075 20.74 402.24 596.76 84.28J1076 8.73 422.93 599.72 76.6J1077 13.39 393.47 593.43 86.64J1078 17.13 381.83 588.38 89.5J1079 24.63 410.28 589.3 77.57J1080 13.95 550.41 677.35 55J1081 8.47 607.01 980.57 161.86J1082 39.26 631.17 972.79 148.02J1083 5.92 710.77 973.36 113.78J1084 10.69 718.31 976.6 111.92J1085 10.79 707.72 975.42 115.99J1086 13.61 740.4 970.6 99.75J1087 4.86 739.32 968.68 99.38J1088 7.73 665.42 971.22 132.5J1089 6.59 722.42 962.73 104.13J1090 10.66 616.28 962.71 150.11J1091 9.35 717.07 959.47 105.03J1092 7.31 698.32 961.28 113.94J1093 10.18 682.58 967.23 123.34J1094 13.14 618.52 967.23 151.1J1095 9.02 665.16 960.88 128.14J1096 7.27 727.09 954.49 98.53

Appendix C 4 of 34
ID Demand (gpm) Elevation (ft) Head (ft) Pressure (psi)Baseline PHD Node Report
J1097 4.37 706.28 949.53 105.4J1098 13.22 710.45 945.41 101.81J1099 37.02 613.31 942.4 142.6J1100 26.18 747.27 943.02 84.82J1101 13.65 663.75 941.42 120.31J1102 17.66 687.64 939.49 109.13J1103 4.93 722.31 944.78 96.39J1104 11.25 671.12 944.55 118.48J1105 14.54 620.12 944.04 140.36J1106 11.6 595.3 939.25 149.03J1107 10.69 552.32 930.75 163.97J1108 18.74 550.69 930.08 164.39J1109 7.92 569.06 920.55 152.3J111 0.31 698.87 717.48 8.06
J1110 4.38 743.5 943.29 86.57J1111 1.46 528.11 663.11 58.49J1112 41.69 559.56 910.34 151.99J1113 2.7 715.91 944.8 99.18J1114 29.18 708.49 894.47 80.58J1115 7.53 695.66 867.8 74.59J1116 14.02 610.98 881.54 117.23J1117 12.62 619.32 867.01 107.33J1118 14.44 652.95 880 98.38J1120 3.03 572.53 645.1 31.44J1121 19.88 697.84 879.14 78.56J1122 55.74 509.5 717.26 90.02J1123 15.61 422.55 714.2 126.37J1124 21.18 510.2 715.36 88.89J1125 9.7 556.95 638.76 35.45J1126 10.52 558.79 636.5 33.67J1127 9.29 547.63 636.68 38.58J1128 5.79 584.27 636.59 22.67J1129 9.38 578.13 631.77 23.24J1130 6.73 616.94 917.94 130.42J1131 13.2 768.69 845.8 33.41J1133 10.33 565.2 641.18 32.92J1134 0 793.84 824.36 13.22J1135 13.28 538.66 644.53 45.87J1136 7.64 543.35 646.62 44.75J1137 22.56 552.21 646.84 41.01J1138 13.21 513.1 646.25 57.69J1139 5.04 670.56 848.03 76.9J1141 6.88 715.21 943.3 98.83J1142 33.17 709.78 951.29 104.65J1143 6.55 638.77 837.59 86.15

Appendix C 5 of 34
ID Demand (gpm) Elevation (ft) Head (ft) Pressure (psi)Baseline PHD Node Report
J1144 6.08 678.41 835.51 68.07J1145 0 705.22 824.67 51.76J1146 0 736.48 824.51 38.14J1147 7.15 737.76 825.79 38.14J1148 1.7 682.21 698.89 7.23J119 1.86 711.38 1,118.96 176.61J121 0 543 781.16 103.19J123 0.08 543 550 3.03J125 0 543 547.45 1.93J127 2.8 543 546.65 1.58J131 0 543 783.44 104.18J133 1.53 543 784.13 104.48J16 4.76 592 646.06 23.42J18 17.35 565 565.49 0.21J20 18.76 417 547.31 56.46
J2001 38.82 560.25 776.21 93.58J2002 21.77 531.25 783.08 109.12J2003 10.07 515.99 775.56 112.47J2004 10.5 453.42 681.87 98.99
J2004.1 15.18 453.42 758.56 132.22J2005 14.64 495.76 668.85 75
J2005.1 22.78 495.76 757.58 113.45J2006 12.1 391.7 668.76 120.05J2007 13.02 399 664.82 115.18J2008 14.92 360.71 547.85 81.09J2009 15.63 378.54 547.09 73.03J2010 23.02 502.68 546.98 19.2J2011 22.07 383.46 546.73 70.74J2012 12.88 309.61 545.2 102.08J2013 15.67 362.75 543.77 78.44J2014 4.71 305.73 543.79 103.15J2015 3.38 299.23 544.1 106.1J2016 0.82 330.98 504.07 75J2017 6.12 354.54 503.86 64.7J2018 0.82 392.36 540.36 64.13J2019 13.85 455.11 540.66 37.07J2020 7.71 434.3 541.9 46.62J2021 10.21 443.48 546.39 44.59J2022 16.77 434.22 552.7 51.34J2024 11.55 472.67 553.58 35.06J2025 21.69 499.19 543.39 19.15J2026 27.6 439.39 538.95 43.14J2027 8.54 415.53 538.53 53.29J2028 6.25 381.22 538.6 68.19J2029 2.68 409.33 539.96 56.6

Appendix C 6 of 34
ID Demand (gpm) Elevation (ft) Head (ft) Pressure (psi)Baseline PHD Node Report
J2030 4.1 352.31 502.8 65.21J2031 7.9 350.63 502.79 65.93J2032 9.96 361.99 535.76 75.29J2033 9.68 352.99 536.78 79.64J2034 5.37 347.34 474.27 55J2035 16.56 229.78 473.11 105.44J2036 52.47 226.5 472.04 106.39J2037 22.85 447.62 538.7 39.46J2038 6.56 430.6 537.4 46.28J2039 7.7 481.52 538.09 24.51J2040 10.64 402.95 535.93 57.62J2041 42.6 372.34 535.84 70.84
J2041A 9.22 395.79 535.93 60.72J2042 10.51 429.2 564.15 58.47J2043 21.34 482.32 564.27 35.51J2044 5.33 430.76 565.76 58.49J2045 6.75 430.21 567.13 59.33J2046 2.79 437.84 566.75 55.86J2047 10.94 426.01 568.73 61.84J2048 3.58 410.35 564.14 66.64J2049 7.28 400.53 568.8 72.91J2050 12.71 383.53 568.86 80.31J2052 2.32 370.21 557.67 81.23J2054 0.64 356.03 574.92 94.85J2055 2.59 423.72 557.79 58.09
J22 14.02 460 547.17 37.77J24 14.08 469 547.14 33.86J26 15.46 527 547.11 8.71J28 18.14 529 547.08 7.83J30 24.9 335 548.38 92.46J32 14.18 327 546.54 95.13J34 33.57 244 460.18 93.67J36 22.13 258 452.99 84.49J38 3.15 691 831.05 60.68J40 2.23 678 831.06 66.32
J400 3.25 376.91 573.11 85.01J4001 6.17 546.98 720.04 74.99J4002 12.06 617.95 701.03 36J4003 17.65 613.78 786.86 75J4004 8.07 624.96 871.22 106.7J4006 11.2 417.18 557.41 60.76J4008 11.96 408.89 568.76 69.27J4009 0.32 408.84 568.8 69.31J401 27.19 410.39 559.08 64.43
J4010 5.93 382.27 569.2 81

Appendix C 7 of 34
ID Demand (gpm) Elevation (ft) Head (ft) Pressure (psi)Baseline PHD Node Report
J4011 8.49 351.28 532.72 78.62J4012 4.78 361.02 502.79 61.43J4013 3 334.6 503.99 73.4J4015 1.88 352.57 574.92 96.35J4016 7.76 427.04 568.76 61.41J402 17.73 502.08 559.03 24.67J403 5.47 475.76 564.52 38.46J404 11.3 590.2 642.06 22.47J405 23.73 501.07 564.46 27.47J406 4.4 460.39 564.83 45.25J407 9.81 471.84 564.82 40.29J408 4.02 436.69 566.75 56.36J409 5.51 453.6 565.7 48.57J410 10.01 429.21 599.71 73.88J411 47.35 530.35 645.78 50.02J412 15.45 489.13 663.08 75.37J413 5.43 540.44 682.39 61.51J414 5.37 670.96 692.44 9.31J415 4.49 602.94 692.44 38.78J416 5.24 689.83 684.79 -2.18J417 5.5 570.78 681.49 47.97J418 9.87 473.88 677.16 88.08J419 10.91 509.88 677.33 72.56J42 1.94 678 831.06 66.32
J420 6.8 628.41 971.21 148.54J421 22.85 535.97 786.75 108.66J422 43.08 536.61 777.33 104.31J423 5.49 640.44 684.1 18.92J424 31.12 617.64 786.07 72.98J425 59.12 610.41 767.41 68.03J426 12.8 626.85 626.93 0.03J427 3.93 601.64 626.95 10.97J428 5.81 590.51 637.72 20.46J429 20.42 572.14 637.68 28.4J430 2.79 614.51 850.86 102.41J431 2.71 698.74 704.54 2.51J433 2.33 640.49 682.4 18.16J434 10.25 414.66 568.71 66.75J435 3.23 646.9 661.28 6.23J436 20.46 515.53 777.71 113.6J437 14.17 481.13 777.69 128.5J438 15.49 394.18 656.19 113.53J439 5.69 641.36 704.53 27.37J44 0.82 656 831.08 75.86
J440 0 537 589.31 22.66

Appendix C 8 of 34
ID Demand (gpm) Elevation (ft) Head (ft) Pressure (psi)Baseline PHD Node Report
J442 18.82 532.86 635.52 44.48J46 0.72 656 831.09 75.86
J460 7.58 716.58 848.03 56.96J461 11.67 730.8 848.03 50.79J463 5.75 719.89 848.03 55.52J464 15.92 725.52 848.04 53.09
J465A 12.63 523.63 646.25 53.13J466 15.07 719.2 848.01 55.81J48 0.24 656 831.09 75.86
J480 5.61 351.46 556.54 88.86J481 3.04 399.22 568.8 73.48J50 1.51 652 831.09 77.6
J500 0 708.34 1,119.14 178J5004 11.73 689.51 758.75 30J5008 19.31 777.98 838.71 26.31J501 0 706.82 1,119.20 178.69
J5010 20.66 741.82 848.1 46.05J502 6.83 612.75 920.31 133.26J503 6.13 604.24 789.27 80.17J504 24.76 512.64 915.04 174.36J505 22.86 609.26 881.52 117.97J506 50.75 682.11 879.03 85.32J507 4.36 691.93 890.07 85.85J508 9.22 567.3 715.53 64.23J509 13.44 548.71 915.09 158.75J510 4.31 529.43 570.92 17.98J512 7.32 519.04 565.46 20.11J514 1.9 537.35 584.27 20.33J52 1.24 654 831.09 76.73
J522 13.16 378.62 536.79 68.54J522A 4.02 379.38 536.79 68.21
J54 2.54 658 831.09 75J550 27.86 463.99 715.23 108.86J551 6.05 482.54 715.35 100.88J552 57.24 454.22 714.32 112.7J553 14.24 506.54 714.17 89.97J554 24.11 436.24 714.18 120.43J555 30.34 591.94 700.86 47.19J56 3.85 661 831.09 73.7J58 4.25 617 918.15 130.49J60 0 708 877.83 73.59
J600 0.39 419.42 557.78 59.95J601 20.5 472.26 547.02 32.39J603 6.72 334.12 535.92 87.44J604 7.5 297.52 536.03 103.34

Appendix C 9 of 34
ID Demand (gpm) Elevation (ft) Head (ft) Pressure (psi)Baseline PHD Node Report
J605 7.01 390.28 539.41 64.62J606 9.02 337.4 536.03 86.07
J606A 2.29 336.06 536.03 86.65J607 11.11 336.52 536.78 86.77J608 62.79 557.25 538.06 -8.32J609 19.78 414.09 536.12 52.87J610 7.2 436.35 557.78 52.62J611 2.11 521.55 635.53 49.39J612 9.9 452.03 546.38 40.88J62 1.13 708 877.87 73.6
J621 5.64 636.44 836.13 86.52J64 0.71 708 1,120.40 178.69
J650 6.74 279.76 502.79 96.64J651 14.84 283.13 502.78 95.17J66 0 708 877.8 73.57
J670 9.98 306.1 473.67 72.61J671 1.87 267.65 473.3 89.11J672 10.52 298.36 473.29 75.8J673 2.43 267.97 473.25 88.95J674 7.39 269.55 473.24 88.26J675 3.77 249.75 473.21 96.83J676 1.67 243.75 473.21 99.43J677 32.34 317.44 546.22 99.13J678 28.84 275.32 460.01 80.03J679 67.72 229.65 461.11 100.29J680 35.95 226.11 460.28 101.47J681 60.46 262.84 459.42 85.18J682 34.34 216.32 460.07 105.62J683 26.98 233.38 459.87 98.14J684 6.89 223.6 460.07 102.46J687 6.55 263.66 473.39 90.88J688 0.37 300.83 472.04 74.18J70 8.95 425 540.44 50.02
J700 8.88 736.44 834.09 42.31J701 0.73 712.05 877.73 71.79J702 6.95 700.46 834.1 57.9J703 4.74 669.44 834.11 71.35J704 3.09 731.42 825.79 40.89J705 3.92 648.28 850.85 87.78J706 6 696.19 833.96 59.7J707 9.2 695.67 835.51 60.59J708 6.37 660.02 836.22 76.35J709 27.29 646.48 836.11 82.17J710 5.03 690.18 834.74 62.64J711 3.81 667.27 834.74 72.56

Appendix C 10 of 34
ID Demand (gpm) Elevation (ft) Head (ft) Pressure (psi)Baseline PHD Node Report
J712 1.73 622.41 850.78 98.95J713 1.47 624.62 850.78 97.99J714 9.82 745.41 834.09 38.42J715 7.28 691.64 834.09 61.73J716 4.47 631.53 847.66 93.65J717 5.03 609.41 833.18 96.96J718 6.24 611.2 833.71 96.42J719 6.19 614.13 835.74 96.02J72 6.21 455 540.41 37.01
J720 5.12 616.72 845.28 99.04J723 15.22 774.88 824.61 21.55J724 2.91 754.37 823.72 30.05J725 1.43 738.62 823.72 36.87J726 2.39 756.68 823.72 29.05J727 1.03 737.7 823.72 37.27J728 0.61 741.16 823.72 35.77J729 1.85 739.4 823.72 36.54J730 13.63 786.77 823.72 16.01J731 6.75 740.48 833.97 40.51J74 3.92 660 848.03 81.47J76 8.01 660 646.24 -5.96J80 7.29 545.81 635.53 38.88
J800 55.72 746.34 845.37 42.91J801 8.48 776.96 841.8 28.1J802 18.43 754.46 841.77 37.83J82 2.62 575.06 617.66 18.46J84 8.2 600 700.91 43.72J86 13.89 480 565.54 37.07J94 4.14 645 682.4 16.21

Appendix C 11 of 34
IDFrom Node To Node
Length (ft)
Diameter (in) Roughness
Flow (gpm)
Velocity (ft/s)
Headloss (ft)
HL/1000 (ft/k-ft) Status
18 J480 J30 1,031.26 6 140 321.74 3.65 8.16 7.92 Open20 J5010 J464 2,457.92 12 100 64.94 0.18 0.06 0.03 Open
229 J436 J4003 1,292.43 6 130 -281.27 3.19 9.15 7.08 Open239 J514 J440 109.08 6 130 -774.04 8.78 5.03 46.15 Open24 J465A J76 1,115.54 6 130 8.01 0.09 0.01 0.01 Open
241 J2046 416 35.63 6 130 0 0 0 0 Open243 J606 J606A 9.58 6 130 9.78 0.11 0 0.01 Open245 J2040 J2041A 57.71 6 130 15.94 0.18 0 0.03 Open249 9995 J609 715.22 6 130 81.26 0.92 0.51 0.71 Open253 9999 J2041 4,389.29 6 130 26.49 0.3 0.39 0.09 Open257 10003 10007 3,814.74 6 130 16.95 0.19 0.15 0.04 Open259 10005 J1097 106.38 6 130 -0.8 0.01 0 0 Open263 10009 J1081 71.29 6 130 -27.24 0.31 0.01 0.09 Open269 10015 J1061 818.83 12 130 -6.18 0.02 0 0 Open271 10017 J2030 178.81 6 130 18.09 0.21 0.01 0.04 Open273 10019 10017 121.65 6 130 19.87 0.23 0.01 0.05 Open275 10021 10019 100.79 6 130 21.55 0.24 0.01 0.06 Open277 10023 10021 153.08 6 130 22.76 0.26 0.01 0.07 Open279 10025 10023 411.58 6 130 24.45 0.28 0.03 0.08 Open281 10027 10025 178.3 6 130 27.35 0.31 0.02 0.09 Open283 10029 10027 409.25 6 130 30.09 0.34 0.05 0.11 Open285 10031 10029 500.77 6 130 35.2 0.4 0.08 0.15 Open287 10033 10031 574.79 6 130 42.99 0.49 0.13 0.22 Open289 10035 10037 682.69 6 130 31.01 0.35 0.08 0.12 Open291 10037 10039 281.65 6 130 25.63 0.29 0.02 0.08 Open293 10039 10041 285.51 6 130 21.93 0.25 0.02 0.06 Open295 10041 J2029 209.1 6 130 20.68 0.23 0.01 0.06 Open297 10043 J4013 356.68 6 130 -75.54 0.86 0.22 0.62 Open299 10045 10043 1,238.08 6 130 -66.4 0.75 0.6 0.49 Open301 10047 10045 522.45 6 130 -47.69 0.54 0.14 0.26 Open303 10049 10047 293.5 6 130 -27.94 0.32 0.03 0.1 Open307 J4013 J2016 119.81 6 130 -78.53 0.89 0.08 0.67 Open311 10055 J2030 551.73 6 130 -2.74 0.03 0 0 Open313 J4012 J2031 140.26 6 130 6.46 0.07 0 0.01 Open
4014D 4014 J688 1 8 150 0 0 0 0 Open4014U J2015 4014 1 8 150 0 0 0 0 Open401D 401 J4001 1 4 150 237.42 6.06 0.03 28.63 Open401U J1107 401 1 4 150 237.42 6.06 0.03 28.63 Open402D 402 J4002 1 4 150 50.6 1.29 0 1.65 Open402U J502 402 1 4 150 50.6 1.29 0 1.65 Open403B1 J2004.1 403B 1 6 150 671.42 7.62 0.03 27.22 Open403B2 403B J2004 1 6 150 671.42 7.62 0.03 27.22 Open403D 403 J4003 1 6 150 321.77 3.65 0.01 6.96 Open403U J1117 403 1 6 150 321.77 3.65 0.01 6.96 Open
Baseline PHD Pipe Report

Appendix C 12 of 34
IDFrom Node To Node
Length (ft)
Diameter (in) Roughness
Flow (gpm)
Velocity (ft/s)
Headloss (ft)
HL/1000 (ft/k-ft) Status
Baseline PHD Pipe Report
404B1 J2005.1 404B 1 6 150 199.2 2.26 0 2.87 Open404B2 404B J2005 1 6 150 199.2 2.26 0 2.87 Open404D 404 J424 1 6 150 865.91 9.83 0.04 43.58 Open404U J4004 404 1 6 150 865.91 9.83 0.04 43.58 Open405D 405 J5004 1 6 150 11.73 0.13 0 0 Open405U J1121 405 1 6 150 11.73 0.13 0 0.06 Open406D 406 J600 1 6 150 276.81 3.14 0.01 5.31 Open406U J2055 406 1 6 150 276.81 3.14 0.01 5.25 Open408D 408 J4008 1 6 150 0 0 0 0 Open408U J2048 408 1 6 150 0 0 0 0 Open409D 409 J4009 1 6 150 0 0 0 0 Open409U J434 409 1 6 150 0 0 0 0 Open410D 410 J4010 1 4 150 70.19 1.79 0 2.99 Open410U J400 410 1 4 150 70.19 1.79 0 2.99 Open411D 411 J2034 1 8 150 435.82 2.78 0 2.99 Open411U J4011 411 1 8 150 435.82 2.78 0 2.99 Open415D 415 J4015 1 10 150 331.54 1.35 0 0.61 Open415U J2054 415 1 10 150 331.54 1.35 0 0.61 Open420D 420 J522A 1 6 150 15.13 0.17 0 0 Open420U J522 420 1 6 150 15.14 0.17 0 0.06 Open900D 900 J435 1 6 150 0 0 0 0 Open900U J705 900 1 6 150 0 0 0 0 Open901D 901 J433 1 6 150 0 0 0 0 Open901U J621 901 1 6 150 0 0 0 0 Open902D 902 J423 1 6 150 0 0 0 0 Open902U J1051 902 1 6 150 0 0 0 0 Open
NEW011 9993 NEW01 1 4 150 86.67 2.21 0 4.39 OpenNEW012 NEW01 9995 1 4 150 86.67 2.21 0 4.46 OpenNEW021 9997 NEW02 1 4 150 58.27 1.49 0 2.08 OpenNEW022 NEW02 9999 1 4 150 58.27 1.49 0 2.14 OpenNEW031 10001 NEW03 1 4 150 25 0.64 0 0.43 OpenNEW032 NEW03 10003 1 4 150 25 0.64 0 0.43 OpenNEW041 10005 NEW04 1 4 150 0 0 0 0 OpenNEW042 NEW04 10007 1 4 150 0 0 0 0 OpenNEW051 10009 NEW05 1 6 150 25.94 0.29 0 0.06 OpenNEW052 NEW05 10011 1 6 150 25.94 0.29 0 0.06 OpenNEW061 10013 NEW06 1 6 150 0 0 0 0 OpenNEW062 NEW06 10015 1 6 150 0 0 0 0 OpenNEW071 10051 NEW07 1 6 150 137.84 1.56 0 1.46 OpenNEW072 NEW07 J2016 1 6 150 137.84 1.56 0 1.46 OpenNEW081 J2018 NEW08 1 6 150 0 0 0 0 OpenNEW082 NEW08 10053 1 6 150 0 0 0 0 OpenNEW091 J2029 NEW09 1 6 150 0 0 0 0 OpenNEW092 NEW09 10055 1 6 150 0 0 0 0 Open

Appendix C 13 of 34
IDFrom Node To Node
Length (ft)
Diameter (in) Roughness
Flow (gpm)
Velocity (ft/s)
Headloss (ft)
HL/1000 (ft/k-ft) Status
Baseline PHD Pipe Report
P10 T2 J1114 1,739.74 8 130 804.32 5.13 21.23 12.2 OpenP100 J1072 J1071 821.74 6 130 30.74 0.35 0.1 0.12 OpenP101 J1071 J1074 614.47 6 130 223.21 2.53 2.84 4.61 OpenP102 J1074 J1075 635.12 6 130 281.38 3.19 4.5 7.08 OpenP103 J1075 J1077 631.53 10 130 919.56 3.76 3.33 5.27 OpenP104 J1077 J1078 1,384.58 10 130 752.72 3.07 5.04 3.64 OpenP105 J1077 J1079 1,791.66 6 130 153.45 1.74 4.13 2.3 OpenP106 J1079 J1078 546.2 6 130 128.82 1.46 0.91 1.67 OpenP107 J1076 J1075 1,040.42 10 130 658.93 2.69 2.96 2.85 Open
P1075 J80 J82 384.81 6 130 776.66 8.81 17.87 46.44 OpenP108 J1073 J1076 674.65 10 130 677.67 2.77 2.02 3 Open
P1080 J121 T1 5,067.59 16 130 5,049.06 8.06 63.46 12.52 OpenP1088 T7009 J123 64.18 99 130 5,053.48 0.21 0 0 OpenP109 J1072 J1073 655.18 10 130 763.61 3.12 2.45 3.74 Open
P1090 T1 J111 70.77 18 130 3,244.66 4.09 0.22 3.11 OpenP110 J1073 J1074 926.26 6 130 68.72 0.78 0.48 0.52 Open
P1102 J123 J125 34.97 10 130 3,799.44 15.52 2.55 72.99 OpenP1104 J125 J127 39.97 10 130 1,888.62 7.71 0.8 20 OpenP1106 J133 J131 34.97 10 130 1,884.29 7.7 0.7 19.91 OpenP1108 J131 J121 31.29 10 130 3,795.11 15.5 2.28 72.83 OpenP111 J1038 J1137 1,681.24 10 130 410.74 1.68 1.99 1.19 OpenP112 J1039 J1041 1,424.14 6 130 85.95 0.98 1.12 0.79 OpenP113 J1039 J1040 775.87 8 130 231.3 1.48 0.94 1.21 OpenP114 J1040 J16 450.25 8 130 180.41 1.15 0.34 0.77 OpenP115 J1044 J1042 806.09 6 130 28.07 0.32 0.08 0.1 OpenP116 J1040 J1041 986.01 6 130 39.07 0.44 0.18 0.18 OpenP117 J1044 J1120 683.43 8 130 138.39 0.88 0.32 0.47 OpenP118 J1042 J1043 722.09 6 130 120.17 1.36 1.06 1.47 OpenP119 J1041 J1042 760.36 6 130 106.19 1.2 0.89 1.17 OpenP12 J1118 J1121 1,184.17 6 130 82.37 0.93 0.86 0.73 Open
P120 J1043 J1125 973.08 6 130 249.54 2.83 5.52 5.67 OpenP121 J1125 J1126 1,167.09 6 130 139.8 1.59 2.26 1.94 OpenP122 J1127 J1126 570.65 6 130 52.65 0.6 0.18 0.32 OpenP123 J1125 J1127 1,995.15 6 130 100.04 1.14 2.08 1.04 OpenP124 J1126 J1129 1,494.83 6 130 181.93 2.06 4.72 3.16 OpenP125 J1128 J1129 731.65 6 130 270.51 3.07 4.82 6.59 OpenP126 J1133 J428 546.92 6 130 264.43 3 3.45 6.31 OpenP127 J1135 J1133 1,940.77 6 130 131.33 1.49 3.35 1.73 OpenP128 J1135 J404 1,055.74 6 130 154.73 1.76 2.47 2.34 OpenP129 J1136 J1135 263.51 6 130 299.34 3.4 2.09 7.94 OpenP13 J507 J1118 582 8 130 970.79 6.2 10.06 17.29 Open
P130 J1137 J1136 319.77 10 130 306.99 1.25 0.22 0.69 OpenP131 J1137 J1138 840.43 6 130 81.2 0.92 0.6 0.71 OpenP133 J1139 J460 757.79 10 130 7.58 0.03 0 0 Open

Appendix C 14 of 34
IDFrom Node To Node
Length (ft)
Diameter (in) Roughness
Flow (gpm)
Velocity (ft/s)
Headloss (ft)
HL/1000 (ft/k-ft) Status
Baseline PHD Pipe Report
P135 J10 J1023 967.85 10 130 -4.35 0.02 0 0 OpenP136 J5010 J1131 983.72 8 130 329.75 2.1 2.3 2.34 OpenP137 J5008 T5 1,656.49 6 130 214.61 2.44 7.11 4.29 OpenP139 J1057 J1058 585.02 6 130 7.71 0.09 0.01 0.01 OpenP14 J1112 J1114 2,450.48 8 130 571.29 3.65 15.87 6.48 Open
P140 J1060 J1057 1,215.75 6 130 -5.24 0.06 0.01 0 OpenP141 J1049 J1060 987.59 6 130 -56.15 0.64 0.35 0.36 OpenP143 J1053 J1058 1,397.22 6 130 6.06 0.07 0.01 0.01 OpenP144 J1054 J1053 445.17 6 130 16.2 0.18 0.02 0.04 OpenP145 J1054 J1057 442.22 6 130 17.74 0.2 0.02 0.04 OpenP146 J1056 J1054 818.82 6 130 40.07 0.45 0.16 0.19 OpenP147 J1056 J1060 490.52 6 130 57.09 0.65 0.18 0.37 OpenP148 J1050 J1056 1,277.98 6 130 107.92 1.22 1.53 1.2 OpenP149 J16 J1044 880.33 8 130 175.65 1.12 0.64 0.73 OpenP15 J1116 J1117 1,489.37 6 130 334.39 3.79 14.53 9.75 Open
P150 J1051 J1052 518.22 6 130 38.87 0.44 0.09 0.18 OpenP151 J1048 J1050 977.04 6 130 121.48 1.38 1.46 1.5 OpenP153 J1036 J1111 509.09 6 130 204.48 2.32 2 3.92 OpenP154 J1035 J1036 752.58 6 130 -191.63 2.17 2.62 3.48 OpenP155 J1148 J1033 662.18 6 130 509.71 5.78 14.1 21.29 OpenP156 J621 J1052 651.52 6 130 -5.64 0.06 0 0.01 OpenP157 J1127 J1128 488.26 6 130 38.1 0.43 0.09 0.17 OpenP158 J1031 J1115 416.43 10 130 1,554.99 6.35 5.81 13.95 OpenP16 J507 J1116 720.34 6 130 371.27 4.21 8.53 11.84 Open
P161 J1115 J1025 636.71 10 130 1,779.41 7.27 11.4 17.91 OpenP162 J1025 J1024 431.33 10 130 1,467.67 6 5.41 12.54 OpenP163 J1025 J1027 1,612.93 6 130 304.99 3.46 13.27 8.22 OpenP164 J1026 J1027 564.27 6 130 59.19 0.67 0.22 0.39 OpenP165 J716 J720 423.7 10 130 951.45 3.89 2.38 5.62 OpenP166 J1024 J1023 413.12 10 130 202.71 0.83 0.13 0.32 OpenP167 J1023 J1022 240.98 6 130 191.33 2.17 0.84 3.47 OpenP168 J1022 J1003 2,372.01 6 130 294.14 3.34 18.24 7.69 OpenP169 J1003 J1002.1 1,926.70 12 130 322.67 0.92 0.6 0.31 Open
P169C J1002.1 J1002.2 1,296.31 6 130 15.64 0.18 0.04 0.03 OpenP17 J555 J1123 4,963.51 6 130 0 0 0 0 Closed
P170 J1002.1 J1002 1,148.46 12 130 301.36 0.85 0.32 0.27 OpenP171 J1002 J1001 3,089.69 12 130 542.02 1.54 2.52 0.82 Open
P171.01 J1002 J1002.001 345.09 10 130 -242.42 0.99 0.15 0.45 OpenP171.02J1002.001J1002.004 562.37 10 130 -225.34 0.92 0.22 0.39 OpenP171.05J1002.004J1002.005 517.41 10 130 -243.04 0.99 0.23 0.45 OpenP171.07J1002.005J1002.007 124.63 10 130 -244.46 1 0.06 0.45 OpenP171.08J1002.007 J1004 365.77 10 130 -315.18 1.29 0.27 0.73 OpenP171.09J1002.007J1002.010 571.03 6 130 68.58 0.78 0.3 0.52 OpenP171.10J1002.010J1002.004 272.5 6 130 -14.07 0.16 0.01 0.03 Open

Appendix C 15 of 34
IDFrom Node To Node
Length (ft)
Diameter (in) Roughness
Flow (gpm)
Velocity (ft/s)
Headloss (ft)
HL/1000 (ft/k-ft) Status
Baseline PHD Pipe Report
P171.11J1002.010J1002.014 909.45 6 130 41.26 0.47 0.18 0.2 OpenP171.12J1002.014J1002.016 156.33 8 130 58.79 0.38 0.02 0.1 OpenP171.13J1002.016J1002.001 587.2 8 130 26.28 0.17 0.01 0.02 OpenP171.14J1002.016J1002.019 576.2 8 130 29.7 0.19 0.02 0.03 Open
P172 J119 J1063 3,381.68 8 130 1,448.52 9.25 122.69 36.28 OpenP173 J1004 J1003 993.12 10 130 32.6 0.13 0.01 0.01 OpenP174 J1005 J1004 194.86 10 130 350.52 1.43 0.17 0.88 OpenP175 J717 J1005 850.35 10 130 454.06 1.85 1.21 1.43 OpenP176 J1008 J719 267.12 10 130 665.12 2.72 0.77 2.89 OpenP177 J1021 J1008 691.35 10 130 689.95 2.82 2.14 3.1 OpenP178 J1008 J1009 1,265.90 6 130 22.57 0.26 0.08 0.07 OpenP179 J1009 J1010 1,321.22 6 130 17.29 0.2 0.05 0.04 OpenP18 J1108 J1109 966.91 8 130 716.53 4.57 9.53 9.85 Open
P180 J1019 J1010 602.06 8 130 140.35 0.9 0.29 0.48 OpenP182 J1021 J1020 341.43 8 130 388 2.48 1.08 3.16 OpenP183 J1020 J1019 243.03 8 130 424.79 2.71 0.91 3.74 OpenP184 J1020 J1143 437.45 8 130 -38.66 0.25 0.02 0.04 OpenP185 J1028 J1143 495.67 8 130 140.51 0.9 0.24 0.48 OpenP186 J1028 J1029 456.28 8 130 209.33 1.34 0.46 1.01 OpenP187 J1029 J1030 457.35 6 130 137.15 1.56 0.86 1.87 OpenP188 J1030 J1051 1,062.92 6 130 48.55 0.55 0.29 0.27 OpenP189 J1030 J1017 1,470.69 6 130 80.68 0.92 1.03 0.7 OpenP19 J1122 J552 2,319.87 6 130 111.19 1.26 2.94 1.27 Open
P190 J1017 J1016 1,428.16 6 130 101.07 1.15 1.52 1.06 OpenP191 J1016 J1015 254.47 6 130 85.46 0.97 0.2 0.78 OpenP192 J1144 J1015 1,422.64 6 130 109.19 1.24 1.75 1.23 OpenP193 J1144 J1017 254.37 6 130 30.11 0.34 0.03 0.11 OpenP194 J1018 J1144 499.09 6 130 154.57 1.75 1.17 2.34 OpenP195 J1029 J1018 1,357.62 6 130 67.95 0.77 0.69 0.51 OpenP196 J1143 J1018 957.5 6 130 95.31 1.08 0.91 0.95 OpenP197 J1019 J1012 1,518.12 8 130 278.88 1.78 2.61 1.72 OpenP198 J1011 J1012 620.75 8 130 98.82 0.63 0.16 0.25 OpenP199 J1010 J710 743.2 6 130 149.66 1.7 1.64 2.2 OpenP20 J1107 J1108 797.58 8 130 189.84 1.21 0.67 0.84 Open
P200 J2055 J2004 549.27 8 130 0 0 0 0 ClosedP2004 J801 J5008 615.77 6 130 233.92 2.65 3.1 5.03 OpenP2006 J1130 J5010 665.02 4 130 415.36 10.6 69.84 105.02 OpenP202 J5004 J2001 4,409.17 6 130 0 0 0 0 ClosedP203 J2001 J2002 764.27 6 130 -319.92 3.63 6.87 8.99 OpenP204 J2002 J2003 375.28 6 130 493.11 5.6 7.51 20.02 OpenP205 J4006 J2008 1,584.42 6 130 258.02 2.93 9.56 6.03 OpenP206 J2001 J425 1,244.92 6 130 281.1 3.19 8.8 7.07 OpenP207 J2003 J2004.1 1,867.64 8 130 686.6 4.38 17 9.1 OpenP208 J2004 J2006 1,545.67 8 130 660.93 4.22 13.11 8.48 Open

Appendix C 16 of 34
IDFrom Node To Node
Length (ft)
Diameter (in) Roughness
Flow (gpm)
Velocity (ft/s)
Headloss (ft)
HL/1000 (ft/k-ft) Status
Baseline PHD Pipe Report
P209 J2005 J2006 998.39 6 130 26.35 0.3 0.09 0.09 OpenP21 J4001 J1122 564.39 6 130 231.25 2.62 2.78 4.93 Open
P210 J2005 J2007 1,649.87 6 130 158.2 1.8 4.02 2.44 OpenP211 J2006 J2007 445.94 8 130 675.18 4.31 3.94 8.83 Open
P2113 J512 J2022 1,953.26 6 130 269.36 3.06 12.76 6.53 OpenP213 J409 J86 1,331.42 6 130 31.24 0.35 0.16 0.12 OpenP215 J30 J677 1,482.51 6 140 128.82 1.46 2.15 1.45 OpenP217 J2022 J2021 742.22 6 130 310.4 3.52 6.31 8.5 OpenP218 J2022 J2024 2,347.52 6 130 -57.81 0.66 0.89 0.38 OpenP219 J2024 J2025 680.13 6 130 421.79 4.79 10.2 14.99 OpenP22 J1122 J508 3,762.35 6 130 64.32 0.73 1.73 0.46 Open
P220 J2025 J2026 1,659.04 6 130 166.16 1.89 4.43 2.67 OpenP221 J2026 J2027 674.06 6 130 76.42 0.87 0.43 0.63 OpenP222 J2028 J2027 638.63 6 130 30.15 0.34 0.07 0.11 OpenP223 J2025 J2037 931.36 6 130 233.94 2.65 4.69 5.03 OpenP224 J2026 J2037 2,410.11 8 130 62.14 0.4 0.26 0.11 OpenP225 J2037 J2039 1,440.76 8 130 130.37 0.83 0.6 0.42 OpenP226 J2039 9997 4,608.25 6 130 59.88 0.68 1.86 0.4 OpenP227 J2040 J2041 2,583.70 6 130 16.1 0.18 0.09 0.04 OpenP228 J2038 9993 922.24 6 130 88.58 1.01 0.77 0.83 OpenP229 J2037 J2038 642.78 6 130 142.86 1.62 1.3 2.02 OpenP23 J1106 J1107 528.53 6 130 437.95 4.97 8.5 16.07 Open
P230 J522 J2038 2,293.56 6 130 -47.72 0.54 0.61 0.26 OpenP231 J2033 J2032 855.49 6 130 107.77 1.22 1.02 1.2 OpenP232 J2027 J2033 1,738.52 6 130 98.03 1.11 1.75 1.01 OpenP233 J2028 J2032 1,108.75 8 130 346.5 2.21 2.84 2.57 OpenP235 J670 J2035 855.54 8 130 164.87 1.05 0.55 0.65 OpenP236 J2034 J2036 2,466.79 8 130 197.36 1.26 2.23 0.9 OpenP237 J30 J20 1,592.58 8 130 168.02 1.07 1.07 0.67 OpenP238 J2009 J2010 755.02 6 130 34.56 0.39 0.11 0.15 OpenP239 J20 J22 953.18 8 130 72.54 0.46 0.14 0.14 OpenP24 J1105 J1106 597.73 6 130 301.02 3.42 4.8 8.03 Open
P240 J2009 J2011 2,358.98 6 130 35.64 0.4 0.36 0.15 OpenP241 J2011 J32 712.88 6 130 47.72 0.54 0.19 0.26 OpenP242 J2008 J2009 959.21 6 130 85.84 0.97 0.75 0.79 OpenP243 J2015 J2014 512.44 8 130 158.2 1.01 0.31 0.6 OpenP244 J2013 J2014 3,086.61 8 130 -13.35 0.09 0.02 0.01 OpenP245 J2008 J2013 1,689.14 6 130 157.26 1.78 4.07 2.41 OpenP246 J2013 J2020 796.68 6 130 154.94 1.76 1.87 2.35 OpenP247 J2021 J2020 597.97 6 130 290.29 3.29 4.49 7.51 OpenP248 J2020 J2019 651.85 6 130 138.58 1.57 1.24 1.91 OpenP249 J2019 J70 713.65 6 130 51.77 0.59 0.22 0.31 OpenP25 J1091 J1105 3,333.66 6 130 223.6 2.54 15.43 4.63 Open
P250 J2017 10053 605.82 6 130 5.09 0.06 0 0 Open

Appendix C 17 of 34
IDFrom Node To Node
Length (ft)
Diameter (in) Roughness
Flow (gpm)
Velocity (ft/s)
Headloss (ft)
HL/1000 (ft/k-ft) Status
Baseline PHD Pipe Report
P251 J2016 J2017 533.4 6 130 58.49 0.66 0.21 0.39 OpenP252 J2014 10051 551.8 6 130 140.14 1.59 1.08 1.95 OpenP253 J650 10049 2,951.45 6 130 -23.02 0.26 0.2 0.07 OpenP254 J2017 10033 2,827.92 6 130 47.27 0.54 0.74 0.26 OpenP255 J2018 10035 1,664.19 6 130 35.78 0.41 0.26 0.16 OpenP256 J2019 J2029 1,193.72 6 130 72.96 0.83 0.69 0.58 OpenP257 J22 J24 1,146.73 6 130 14.08 0.16 0.03 0.03 OpenP258 J2030 J4012 363.81 6 130 11.25 0.13 0.01 0.02 OpenP259 J2036 J688 4,332.12 8 130 0.37 0 0 0 OpenP26 J1091 J1142 959.94 8 130 662.58 4.23 8.18 8.52 Open
P260 J2035 J2036 1,526.05 8 130 172.36 1.1 1.07 0.7 OpenP261 J2042 J401 2,229.77 8 130 324.33 2.07 5.06 2.27 OpenP262 J2043 J2042 583.9 6 130 43.23 0.49 0.13 0.22 OpenP263 J2044 J406 772.7 6 130 107.98 1.23 0.93 1.2 OpenP264 J2045 J2044 622.28 6 130 150.07 1.7 1.38 2.21 OpenP265 J408 J2042 1,368.21 8 130 295.18 1.88 2.61 1.91 OpenP266 J2048 J2042 576.36 6 130 -3.57 0.04 0 0 OpenP267 J2047 J4008 779.18 6 130 0 0 0 0 ClosedP268 J4009 J481 65.56 6 130 -0.32 0 0 0 OpenP269 J2049 J4008 1,617.60 6 130 11.96 0.14 0.03 0.02 OpenP27 J1142 J1104 1,951.36 6 130 190.94 2.17 6.74 3.45 Open
P270 J2049 J2052 453.94 6 130 0 0 0 0 ClosedP271 J2050 J481 964.27 6 130 22.61 0.26 0.06 0.07 OpenP272 J4016 J2050 1,019.88 6 130 -28.94 0.33 0.11 0.1 OpenP273 J2047 J4016 544.77 6 130 -21.19 0.24 0.03 0.06 OpenP274 J408 J2046 518.42 6 130 2.79 0.03 0 0 OpenP275 J400 J2045 1,385.15 8 130 458.8 2.93 5.98 4.31 OpenP276 J4010 J2050 739.49 6 130 64.26 0.73 0.34 0.46 OpenP277 J2052 J4015 1,816.14 6 130 -329.66 3.74 17.25 9.5 OpenP278 J1078 J2054 2,862.03 10 130 864.42 3.53 13.46 4.7 OpenP279 J20 J26 1,270.64 8 130 76.72 0.49 0.2 0.16 OpenP28 J1142 J1103 1,642.66 8 130 438.47 2.8 6.52 3.97 Open
P280 J2020 J605 1,278.03 8 130 298.94 1.91 2.49 1.95 OpenP281 J605 J2028 261.45 8 130 382.9 2.44 0.81 3.09 OpenP282 J424 J2002 229 8 130 834.79 5.33 2.99 13.07 OpenP283 J26 J28 679.78 6 130 18.14 0.21 0.03 0.04 OpenP285 J1031 J1115 1,172.94 6 130 231.95 2.63 5.81 4.95 OpenP287 J26 J601 1,561.24 8 130 43.11 0.28 0.08 0.05 OpenP289 J32 J2012 2,035.94 6 130 77.98 0.88 1.34 0.66 OpenP29 J1104 J1105 567.49 6 130 91.96 1.04 0.51 0.89 Open
P291 J32 J22 2,724.41 6 130 -44.44 0.5 0.63 0.23 OpenP293 J34 J678 1,566.15 6 130 28.84 0.33 0.16 0.1 OpenP295 J34 J36 533.74 2 130 22.13 2.26 7.19 13.46 OpenP297 J1002.014 J38 677.35 8 130 -19.57 0.12 0.01 0.01 Open

Appendix C 18 of 34
IDFrom Node To Node
Length (ft)
Diameter (in) Roughness
Flow (gpm)
Velocity (ft/s)
Headloss (ft)
HL/1000 (ft/k-ft) Status
Baseline PHD Pipe Report
P299 J38 J40 609.25 8 130 -22.73 0.15 0.01 0.02 OpenP30 J1103 J1104 540.92 6 130 60.8 0.69 0.22 0.41 Open
P300 J1012 J1013 495.29 8 130 369.97 2.36 1.43 2.9 OpenP301 J1015 J1013 332.36 6 130 190.47 2.16 1.14 3.44 OpenP302 J1147 J723 1,435.34 12 130 544 1.54 1.18 0.82 OpenP303 J723 T3 882.31 12 130 603.75 1.71 0.88 1 OpenP304 J1145 J723 3,077.81 12 130 74.98 0.21 0.06 0.02 OpenP305 J1006 J1145 3,069.48 8 130 279.7 1.79 5.3 1.73 OpenP306 J1146 J1145 1,241.63 12 130 -204.72 0.58 0.17 0.13 OpenP307 J1134 J1146 1,108.54 12 130 -204.72 0.58 0.15 0.13 OpenP308 T4 J1134 231.53 12 130 -666.75 1.89 0.28 1.2 OpenP309 J1001 J1134 6,572.51 12 130 462.03 1.31 3.99 0.61 OpenP31 J1104 J1106 2,444.78 6 130 148.53 1.69 5.3 2.17 Open
P310 J1005 J1006 1,947.97 6 130 98.98 1.12 1.99 1.02 OpenP311 J1007 J1006 1,542.38 6 130 183.83 2.09 4.97 3.22 OpenP312 J1013 J1147 1,116.89 8 130 554.24 3.54 6.84 6.12 OpenP313 J1023 J705 1,528.40 6 130 3.92 0.04 0 0 OpenP314 J712 J1022 649.79 6 130 105.92 1.2 0.75 1.16 OpenP315 J1027 J1028 483.15 6 130 356.29 4.04 5.3 10.97 OpenP316 J1035 J1034 376.78 6 130 183.4 2.08 1.21 3.21 OpenP317 J1120 J1043 447.59 6 130 135.36 1.54 0.82 1.83 OpenP318 J2012 J2015 1,763.11 8 130 161.58 1.03 1.1 0.62 OpenP319 J1144 J707 475.56 6 130 9.2 0.1 0.01 0.01 OpenP32 J1103 J1141 454.78 8 130 393.93 2.51 1.48 3.25 Open
P321 J40 J42 120.91 6 130 1.94 0.02 0 0 OpenP323 J40 J44 773.41 8 130 -26.9 0.17 0.02 0.02 OpenP325 J44 J46 208.71 8 130 -27.72 0.18 0 0.02 OpenP327 J46 J48 132.42 8 130 0.24 0 0 0 OpenP329 J46 J50 194.45 8 130 -28.68 0.18 0 0.03 OpenP33 J1141 J1102 1,255.54 8 130 379.12 2.42 3.81 3.03 Open
P331 J50 J52 141.54 6 130 7.63 0.09 0 0.01 OpenP333 J52 J54 147.78 6 130 2.54 0.03 0 0 OpenP335 J52 J56 408.35 6 130 3.85 0.04 0 0 OpenP337 J50 J1002.010 802.07 6 130 -37.82 0.43 0.14 0.17 OpenP339 J430 J10 1,211.84 10 130 -2.79 0.01 0 0 OpenP34 J1102 J1108 1,583.40 8 130 545.42 3.48 9.41 5.94 Open
P341 J427 U7000 84.05 6 1,300.00 213.01 2.42 0 0.06 OpenP343 U7000 J58 32.26 6 130 213.01 2.42 0.14 4.23 OpenP345 J58 J1130 50.61 6 130 208.76 2.37 0.21 4.08 OpenP347 J111 U7006 52.99 8 130 480.6 3.07 0.25 4.7 OpenP349 U7006 J64 43.83 6 130 480.6 5.45 0.84 19.09 OpenP35 J1101 J1102 597.56 6 130 183.96 2.09 1.93 3.22 Open
P351 J64 J119 75.63 6 130 479.89 5.45 1.44 19.04 OpenP353 J111 U7002 63.58 10 130 562.78 2.3 0.14 2.12 Open

Appendix C 19 of 34
IDFrom Node To Node
Length (ft)
Diameter (in) Roughness
Flow (gpm)
Velocity (ft/s)
Headloss (ft)
HL/1000 (ft/k-ft) Status
Baseline PHD Pipe Report
P355 U7002 J60 24.56 10 130 562.78 2.3 0.05 2.12 OpenP357 J60 J701 45.14 10 130 562.78 2.3 0.1 2.12 OpenP359 J111 U7004 84.11 10 130 561.8 2.29 0.18 2.12 OpenP36 J1099 J1101 897.75 6 130 102.83 1.17 0.99 1.1 Open
P361 U7004 J62 25.68 10 130 561.8 2.29 0.05 2.12 OpenP363 J62 J701 63.81 10 130 560.67 2.29 0.13 2.11 OpenP365 J66 J701 28.48 10 150 668.68 2.73 0.06 2.24 OpenP367 416 J4016 52.01 6 130 0 0 0 0 OpenP37 J1100 J1101 1,697.65 6 130 94.78 1.08 1.6 0.94 Open
P373 J70 J2018 499.7 6 130 36.61 0.42 0.08 0.16 OpenP375 J70 J72 620.78 4 130 6.21 0.16 0.03 0.04 OpenP377 J1139 J463 555.13 10 130 -16.53 0.07 0 0 OpenP379 J1137 J460 801.05 10 130 0 0 0 0 ClosedP38 J1100 J1099 2,081.84 6 130 50.7 0.58 0.62 0.3 Open
P381 J74 J1139 509.09 6 130 -3.92 0.04 0 0 OpenP383 J76 V8002 47.47 6 130 0 0 0 0 OpenP385 V8002 J74 32.39 6 130 0 0 0 0 OpenP39 J1098 J1099 3,565.79 6 130 89.15 1.01 3.01 0.84 Open
P395 J84 J555 467.52 6 130 30.34 0.34 0.05 0.11 OpenP40 J1110 J1141 425.03 6 130 -7.93 0.09 0 0.01 Open
P400 J406 J403 330.66 6 130 93.78 1.06 0.31 0.93 OpenP401 J403 J405 822.58 6 130 23.73 0.27 0.06 0.07 OpenP402 J404 J1133 433.55 6 130 143.43 1.63 0.88 2.03 OpenP403 J436 J437 953.44 6 130 14.17 0.16 0.03 0.03 OpenP404 J2007 J438 682.43 8 130 820.37 5.24 8.64 12.66 OpenP405 J438 J80 1,690.34 8 130 804.87 5.14 20.66 12.22 OpenP406 J2054 J400 319.24 8 130 532.24 3.4 1.81 5.68 OpenP407 J401 J2055 750.52 8 130 279.4 1.78 1.29 1.72 OpenP408 J401 J402 1,403.49 6 130 17.73 0.2 0.06 0.04 OpenP409 J406 J407 324.18 6 130 9.81 0.11 0 0.01 OpenP41 J1110 J1100 95.56 6 130 171.66 1.95 0.27 2.84 Open
P410 J403 J2043 533.54 6 130 64.58 0.73 0.25 0.46 OpenP411 J2047 J434 1,130.43 6 130 10.25 0.12 0.02 0.02 OpenP412 J2045 J408 190.7 8 130 301.98 1.93 0.38 1.99 OpenP413 J2044 J409 331.67 6 130 36.76 0.42 0.05 0.16 OpenP414 J1076 J410 586.2 6 130 10.01 0.11 0.01 0.01 OpenP416 J1138 J411 1,801.65 6 130 47.35 0.54 0.47 0.26 OpenP417 J1111 J412 671.15 6 130 15.45 0.18 0.02 0.03 OpenP418 J1050 J423 728.22 6 130 5.49 0.06 0 0 OpenP419 J1058 J413 545.51 6 130 5.43 0.06 0 0 OpenP42 J1113 J1110 552.47 6 130 168.12 1.91 1.51 2.73 Open
P420 J414 J1048 487.29 10 130 1,563.84 6.39 6.87 14.1 OpenP421 J414 J415 565.33 6 130 4.49 0.05 0 0 OpenP422 J1033 J416 601.05 8 130 5.24 0.03 0 0 Open

Appendix C 20 of 34
IDFrom Node To Node
Length (ft)
Diameter (in) Roughness
Flow (gpm)
Velocity (ft/s)
Headloss (ft)
HL/1000 (ft/k-ft) Status
Baseline PHD Pipe Report
P423 J417 J1045 168.91 8 130 758.11 4.84 1.85 10.94 OpenP424 J1067 J418 1,141.52 6 130 9.87 0.11 0.02 0.01 OpenP425 J1080 J419 850.07 6 130 10.91 0.12 0.01 0.02 OpenP426 J4003 J421 1,628.55 6 130 22.85 0.26 0.11 0.07 OpenP427 J436 J422 1,736.24 6 130 43.08 0.49 0.38 0.22 OpenP428 J2003 J436 553.06 6 130 -203.56 2.31 2.15 3.89 OpenP429 J425 J2005.1 2,151.61 6 130 221.98 2.52 9.83 4.57 OpenP43 J1113 J1103 411.14 6 130 21.2 0.24 0.02 0.06 Open
P430 J427 J426 888.78 6 130 12.8 0.15 0.02 0.02 OpenP431 J1129 J427 293.85 6 130 443.06 5.03 4.83 16.42 OpenP432 J428 J1128 217.61 6 130 238.2 2.7 1.13 5.2 OpenP433 J428 J429 797.16 6 130 20.42 0.23 0.04 0.05 OpenP435 J431 J1148 235.15 10 130 2,085.10 8.52 5.65 24.02 OpenP436 J431 J439 673.08 6 130 5.69 0.06 0 0.01 OpenP437 T1 J431 543.85 10 130 2,093.50 8.55 13.16 24.2 OpenP438 J1053 J94 80.09 6 130 6.47 0.07 0 0.01 OpenP439 J1034 J435 820.31 6 130 3.23 0.04 0 0 OpenP44 J1098 J1113 174.76 6 130 192.02 2.18 0.61 3.49 Open
P441 J82 J440 614.31 6 130 774.04 8.78 28.35 46.15 OpenP442 J80 J442 310.22 6 130 18.82 0.21 0.01 0.05 OpenP45 J1097 J1098 534.8 6 130 294.39 3.34 4.12 7.7 OpenP46 J1096 10001 4,311.06 6 130 26.64 0.3 0.39 0.09 Open
P460 J461 J466 686.64 6 130 15.07 0.17 0.02 0.03 OpenP461 J463 J464 141.33 6 130 -22.28 0.25 0.01 0.06 OpenP463 J464 J461 485.54 8 130 26.74 0.17 0.01 0.02 OpenP47 J1096 J1097 623.01 6 130 299.56 3.4 4.96 7.96 OpenP48 J1095 J1096 658.98 6 130 333.47 3.78 6.39 9.7 Open
P480 J2052 J480 120.71 6 130 327.35 3.71 1.13 9.38 OpenP481 J481 J2049 107.94 6 130 19.25 0.22 0.01 0.05 OpenP49 J1092 J1095 778.25 6 130 68.29 0.77 0.4 0.51 Open
P495 J94 J433 131.31 6 130 2.33 0.03 0 0 OpenP50 J1094 J1095 940.31 6 130 274.19 3.11 6.35 6.75 Open
P500 J1109 J502 661.16 6 130 57.43 0.65 0.25 0.37 OpenP501 J1088 J420 396.81 6 130 6.8 0.08 0 0.01 OpenP502 J1061 J503 640.99 12 130 6.13 0.02 0 0 OpenP503 J509 J504 717.91 6 130 24.76 0.28 0.06 0.08 OpenP504 J1109 J509 661.71 8 130 651.17 4.16 5.46 8.25 OpenP505 J1116 J505 303.21 6 130 22.86 0.26 0.02 0.07 OpenP506 J1121 J506 386.95 6 130 50.75 0.58 0.11 0.3 OpenP507 J1114 J507 138.91 8 130 1,346.43 8.59 4.4 31.69 OpenP508 J1118 J4004 617.46 8 130 873.99 5.58 8.79 14.23 OpenP509 J509 J1112 644.14 8 130 612.98 3.91 4.75 7.38 OpenP51 J1094 J1093 1,011.02 6 130 4.61 0.05 0 0 Open
P510 J501 J119 50.42 8 130 485.18 3.1 0.24 4.79 Open

Appendix C 21 of 34
IDFrom Node To Node
Length (ft)
Diameter (in) Roughness
Flow (gpm)
Velocity (ft/s)
Headloss (ft)
HL/1000 (ft/k-ft) Status
Baseline PHD Pipe Report
P511 J500 J119 37.77 8 130 485.3 3.1 0.18 4.79 OpenP512 J510 J512 119.98 6 130 767.83 8.71 5.46 45.47 OpenP514 J514 J510 290.69 6 130 772.14 8.76 13.36 45.94 OpenP52 J1093 J1092 847.71 6 130 279.86 3.18 5.95 7.01 OpenP53 J1092 J1091 461.51 6 130 204.26 2.32 1.81 3.91 Open
P531 J430 J1120 365.7 6 130 0 0 0 0 ClosedP533 J86 J18 1,372.40 6 130 17.35 0.2 0.06 0.04 OpenP54 J1089 J1091 353.44 8 130 691.26 4.41 3.26 9.22 OpenP55 J1089 J1090 1,369.44 6 130 10.66 0.12 0.02 0.02 Open
P550 J508 J1124 495.27 6 130 55.09 0.63 0.17 0.35 OpenP551 J1124 J550 1,322.00 6 130 27.86 0.32 0.13 0.1 OpenP552 J552 J553 725.07 4 130 14.24 0.36 0.15 0.2 OpenP553 J1123 J554 273.23 6 130 24.11 0.27 0.02 0.07 OpenP554 J4002 J84 677.84 6 130 38.54 0.44 0.12 0.18 OpenP555 J1124 J551 855.4 6 130 6.05 0.07 0 0.01 OpenP556 J552 J1123 638.41 6 130 39.72 0.45 0.12 0.19 OpenP56 J1087 J1089 616.38 8 130 708.5 4.52 5.95 9.65 OpenP57 J1082 J1094 732.59 6 130 291.94 3.31 5.56 7.58 OpenP58 J1082 J1083 1,542.95 6 130 -57.47 0.65 0.58 0.37 OpenP59 J1081 J1082 1,156.00 6 130 273.72 3.11 7.78 6.73 OpenP60 J1061 10011 1,432.23 6 130 -18.22 0.21 0.06 0.04 Open
P600 J510 J2021 2,229.59 6 130 0 0 0 0 ClosedP601 J600 J4006 57.61 6 130 269.22 3.05 0.38 6.53 OpenP602 J80 J611 722.67 6 130 2.11 0.02 0 0 OpenP603 J512 J2024 597.5 6 130 491.14 5.57 11.88 19.88 OpenP604 J2021 J612 403.43 6 130 9.9 0.11 0.01 0.01 OpenP61 J1062 10013 1,017.36 12 130 2.17 0.01 0 0 Open
P618 J601 J2010 613.73 6 130 22.61 0.26 0.04 0.07 OpenP619 J2029 J605 635.48 6 130 90.97 1.03 0.56 0.88 OpenP62 J1062 J1081 1,827.24 6 130 309.43 3.51 15.44 8.45 Open
P621 J2010 J2011 1,781.01 6 130 34.15 0.39 0.25 0.14 OpenP63 J1063 J1062 869.2 12 130 320.21 0.91 0.27 0.31 Open
P635 J2032 J4011 747.04 8 130 444.31 2.84 3.04 4.07 OpenP64 J1063 J1084 1,491.26 8 130 838.75 5.35 19.67 13.19 Open
P643 J2033 J522 258.4 6 130 -19.42 0.22 0.01 0.05 OpenP646 J522A J607 501.53 6 130 11.11 0.13 0.01 0.02 OpenP65 J1084 J1083 307.16 6 130 348.84 3.96 3.24 10.55 Open
P650 J650 J651 485.93 6 130 14.84 0.17 0.01 0.03 OpenP651 J2031 J650 821.85 6 130 -1.44 0.02 0 0 OpenP653 J609 J606 1,838.81 6 130 18.8 0.21 0.09 0.05 Open
P654A J606A J604 424.98 6 130 7.5 0.09 0 0.01 OpenP655 J609 J2040 856.84 6 130 42.68 0.48 0.18 0.22 OpenP659 J2041A J603 926.61 6 130 6.72 0.08 0.01 0.01 OpenP66 J1083 J1093 843.54 6 130 285.44 3.24 6.14 7.28 Open

Appendix C 22 of 34
IDFrom Node To Node
Length (ft)
Diameter (in) Roughness
Flow (gpm)
Velocity (ft/s)
Headloss (ft)
HL/1000 (ft/k-ft) Status
Baseline PHD Pipe Report
P661 J608 J2039 960.75 10 130 -62.79 0.26 0.04 0.04 OpenP67 J1084 J1085 253.98 8 130 479.23 3.06 1.19 4.68 Open
P670 J680 J682 1,703.96 8 130 68.21 0.44 0.22 0.13 OpenP671 J682 J683 2,192.14 6 130 26.98 0.31 0.2 0.09 OpenP672 J682 J684 688.13 8 130 6.89 0.04 0 0 OpenP673 J679 J680 1,282.58 8 130 164.62 1.05 0.83 0.65 OpenP674 J2036 J679 5,024.95 8 130 316.88 2.02 10.93 2.17 OpenP675 J679 J34 1,224.38 6 130 84.53 0.96 0.94 0.76 OpenP676 J680 J681 2,108.79 6 130 60.46 0.69 0.87 0.41 OpenP677 J670 J687 719.92 6 130 58.24 0.66 0.28 0.38 OpenP678 J2034 J670 489.44 8 130 233.09 1.49 0.6 1.23 OpenP679 J687 J671 311.3 6 130 51.69 0.59 0.1 0.31 OpenP68 J1085 J1086 1,073.79 8 130 468.44 2.99 4.82 4.48 Open
P680 J671 J672 273.32 6 130 10.52 0.12 0 0.02 OpenP681 J671 J673 265.79 6 130 39.3 0.45 0.05 0.18 OpenP682 J673 J674 276.75 6 130 7.39 0.08 0 0.01 OpenP684 J2035 J675 1,358.92 6 130 -24.04 0.27 0.1 0.07 OpenP685 J675 J676 265.47 6 130 1.67 0.02 0 0 OpenP686 J2012 J677 1,047.71 6 130 -96.47 1.09 1.02 0.98 OpenP687 J673 J675 303.5 6 130 29.48 0.33 0.03 0.11 OpenP69 J1086 J1087 452.27 8 130 454.83 2.9 1.92 4.25 OpenP70 J1088 J1087 418.97 6 130 258.54 2.93 2.54 6.06 Open
P700 J702 J700 911.02 6 130 7.06 0.08 0.01 0.01 OpenP701 J703 J700 1,270.27 6 130 11.64 0.13 0.02 0.02 OpenP702 J710 J711 446.9 6 130 3.81 0.04 0 0 OpenP703 J702 J715 220.69 6 130 7.28 0.08 0 0.01 OpenP704 J703 J702 297.09 6 130 21.29 0.24 0.02 0.06 OpenP705 J1147 J704 352.82 6 130 3.09 0.04 0 0 OpenP706 J1011 J703 595.47 6 130 37.67 0.43 0.1 0.17 OpenP707 J710 J1011 266.76 6 130 140.82 1.6 0.52 1.97 OpenP708 J1016 J731 188.11 6 130 6.75 0.08 0 0.01 OpenP709 J1016 J706 548.45 6 130 6 0.07 0 0.01 OpenP71 J1063 J1088 3,738.36 6 130 273.07 3.1 25.05 6.7 Open
P710 J1051 J708 363.82 6 130 6.37 0.07 0 0.01 OpenP711 J1052 J709 863.34 8 130 27.29 0.17 0.02 0.02 OpenP712 J712 J713 166.67 6 130 1.47 0.02 0 0 OpenP713 J700 J714 249.08 6 130 9.82 0.11 0 0.01 OpenP714 J1024 J716 414.9 10 130 1,153.49 4.71 3.33 8.03 OpenP715 J718 J717 948.55 6 130 71.91 0.82 0.54 0.57 OpenP716 J718 J717 505.44 10 130 387.18 1.58 0.54 1.06 OpenP717 J1007 J718 818.67 10 130 465.34 1.9 1.22 1.49 OpenP718 J719 J1007 341.91 10 130 594.24 2.43 0.8 2.35 OpenP719 J719 J1007 1,725.47 6 130 64.7 0.73 0.8 0.47 OpenP720 J716 J720 646.73 6 130 197.57 2.24 2.38 3.68 Open

Appendix C 23 of 34
IDFrom Node To Node
Length (ft)
Diameter (in) Roughness
Flow (gpm)
Velocity (ft/s)
Headloss (ft)
HL/1000 (ft/k-ft) Status
Baseline PHD Pipe Report
P721 J720 J1026 243.66 10 130 1,143.90 4.67 1.93 7.9 OpenP722 J1026 J1021 659.45 10 130 1,081.99 4.42 4.7 7.13 OpenP723 J1024 J712 174.91 6 130 109.12 1.24 0.21 1.23 OpenP724 J728 J727 270.52 8 130 4.85 0.03 0 0 OpenP725 J727 J726 226.77 8 130 2.39 0.02 0 0 OpenP726 J727 J725 198.89 8 130 1.43 0.01 0 0 OpenP727 J724 J728 124.84 8 130 7.3 0.05 0 0 OpenP728 J728 J729 135.77 6 130 1.85 0.02 0 0 OpenP729 T3 J730 425.8 8 130 23.84 0.15 0.01 0.02 OpenP73 J1064 J1065 2,411.03 8 130 244.92 1.56 3.25 1.35 Open
P730 J730 J724 1,310.21 8 130 4.17 0.03 0 0 OpenP731 J730 J724 659.73 8 130 6.04 0.04 0 0 OpenP732 J701 J1031 227.31 10 130 1,791.40 7.32 4.12 18.13 OpenP74 J1048 J1049 427.19 10 130 1,171.94 4.79 3.53 8.26 OpenP75 J1049 J1047 621.58 10 130 967.52 3.95 3.6 5.79 OpenP76 J1047 J1065 2,276.96 8 130 21.25 0.14 0.03 0.01 OpenP77 J1065 J1066 624.38 8 130 246 1.57 0.85 1.36 OpenP78 J1066 J1080 2,441.09 8 130 54.69 0.35 0.21 0.08 OpenP79 J1080 J1067 1,583.37 6 130 29.84 0.34 0.18 0.11 OpenP80 J1066 J1067 474.45 8 130 185.04 1.18 0.38 0.8 Open
P800 J1131 J800 1,209.62 6 130 55.72 0.63 0.43 0.35 OpenP801 J801 J802 787.58 6 130 18.43 0.21 0.04 0.05 OpenP802 J1131 J801 649.01 6 130 260.83 2.96 4 6.16 OpenP81 J1067 J1046 2,258.24 6 130 193.79 2.2 8.02 3.55 OpenP82 J1046 J1111 482.27 10 130 1,467.92 6 6.05 12.54 OpenP83 J1047 J1046 941.96 10 130 1,288.74 5.26 9.28 9.85 OpenP84 J1049 J1064 784.28 10 130 254.02 1.04 0.38 0.49 OpenP85 J1045 J1036 1,056.96 6 130 402.56 4.57 14.54 13.75 OpenP86 J1045 J1047 457.49 8 130 350.93 2.24 1.2 2.63 OpenP87 J1033 J417 655.76 8 130 498.98 3.18 3.31 5.04 OpenP88 J1048 J417 645.75 6 130 264.63 3 4.08 6.32 OpenP89 J1148 J414 452.06 10 130 1,573.70 6.43 6.45 14.27 OpenP90 J1033 J1035 714.43 6 130 0 0 0 0 ClosedP91 J1034 J1037 1,669.83 6 130 172.99 1.96 4.81 2.88 OpenP92 J1037 J1038 406.67 10 130 1,825.11 7.46 7.63 18.77 OpenP93 J1111 J1037 423.37 10 130 1,655.49 6.76 6.63 15.67 OpenP94 J1038 J1039 623.39 8 130 333.91 2.13 1.49 2.4 OpenP95 J1038 J1068 2,258.09 10 130 1,068.68 4.37 15.73 6.97 OpenP96 J1068 J1069 2,668.39 10 130 1,062.14 4.34 18.38 6.89 OpenP97 J1069 J1072 2,472.44 10 130 819.74 3.35 10.54 4.26 OpenP98 J1069 J1070 317.12 6 130 210.42 2.39 1.31 4.14 OpenP99 J1070 J1071 2,368.44 6 130 204.9 2.32 9.32 3.94 Open
P995 J610 J600 337.3 6 130 -7.2 0.08 0 0.01 OpenMP131A J1138 J465A 188.11 10 150 20.64 0.08 0 0 Open

Appendix C 24 of 34
IDFrom Node To Node
Length (ft)
Diameter (in) Roughness
Flow (gpm)
Velocity (ft/s)
Headloss (ft)
HL/1000 (ft/k-ft) Status
Baseline PHD Pipe Report
PMP135 J427 PMP135 1 6 150 213.32 2.42 0 3.23 OpenPMP135 PMP135 J1130 1 6 150 213.32 2.42 0 3.23 Open
PMP21 J111 PMP2 1 10 150 668.68 2.73 0 2.26 OpenPMP22 PMP2 J66 20.62 10 150 668.68 2.73 0.05 2.24 OpenPMP31 J111 PMP3 1 8 150 485.3 3.1 0 3.66 OpenPMP32 PMP3 J500 1 8 150 485.3 3.1 0 3.66 OpenPMP41 J111 PMP4 1 8 150 485.18 3.1 0 3.66 OpenPMP42 PMP4 J501 1 8 150 485.18 3.1 0 3.66 OpenPMP61 J123 PMP6 1 10 150 1,253.96 5.12 0.01 7.2 OpenPMP62 PMP6 J121 1 10 150 1,253.96 5.12 0.01 7.2 OpenPMP71 J125 PMP7 1 10 150 1,910.81 7.81 0.02 15.69 OpenPMP72 PMP7 J131 1 10 150 1,910.81 7.81 0.02 15.69 OpenPMP81 J127 PMP8 1 10 150 1,885.82 7.7 0.02 15.26 OpenPMP82 PMP8 J133 1 10 150 1,885.82 7.7 0.02 15.32 Open

Appendix C 25 of 34
IDTotal Demand
(gpm)Available Flow at
Hydrant (gpm)Critical
Node IDCritical Node Pressure (psi)
Critical Node Head (ft)
Design Flow (gpm)
10001 1,001.09 645.78 10001 20 773.25 645.8310003 1,005.37 983.57 10003 20 773.25 983.6110005 1,000.53 1,705.62 10005 20 752.44 1,705.6210007 1,011.30 1,752.15 10003 18.39 769.53 1,732.7810009 1,000.86 2,048.52 10009 20 653.17 2,048.5210011 1,005.15 2,436.44 J1100 0.3 747.9510013 1,001.45 2,454.06 J1100 -0.01 747.24 2,138.9410015 1,004.12 2,473.61 J1100 -1.25 744.4 2,140.8610017 1,001.19 1,127.99 J608 -48.18 446.0610019 1,001.13 1,116.99 J608 -47.24 448.2310021 1,000.80 1,138.44 J608 -49.07 44410023 1,001.12 1,130.49 J608 -48.35 445.6510025 1,001.94 1,125.35 J608 -47.82 446.8810027 1,001.83 1,137.47 J608 -48.85 444.52 121.1310029 1,003.41 1,085.96 J608 -44.38 454.8410031 1,005.19 1,026.29 J608 -39.31 466.53 125.3010033 1,002.86 1,049.45 J608 -41.35 461.82 124.2410035 1,003.18 838.79 J608 -30.17 487.61 113.1910037 1,003.59 875.36 J608 -33.31 480.38 113.4410039 1,002.47 876.34 J608 -33.54 479.84 112.2410041 1,000.84 910.87 J608 -35.46 475.42 110.5210043 1,006.09 1,268.52 J608 -59.32 420.35 129.6910045 1,012.48 1,228.24 J608 -55.37 429.47 135.4410047 1,013.16 1,250.02 J608 -57.26 425.1110049 1,003.28 1,178.75 J608 -51.96 437.3410051 1,001.53 1,113.80 J608 -42.96 458.1 125.1410053 1,003.40 1,032.85 J608 -39.97 46510055 1,001.82 988.12 J608 -37.46 470.89993 1,001.28 629.13 J608 -18.5 514.55 104.879995 1,003.60 659.14 J608 -21.53 507.56 107.199997 1,001.07 312.71 J608 4.38 567.36 97.979999 1,021.19 410.89 J608 -0.74 555.54 232.64J10 1,501.04 4,347.67 J10 20 668.16 4,347.67
J1001 1,553.33 5,995.59 J1002.2 14.17 739.96 5,510.91J1002 1,501.18 6,390.40 J1002.2 -13.66 675.74 4,416.93
J1002.001 1,006.14 6,147.78 J1002.2 -6.8 691.57 4,502.79J1002.004 1,002.42 6,009.22 J1002.2 -3.28 699.69 4,545.23J1002.005 1,000.95 6,149.21 J1002.2 -5 695.71 4,579.12J1002.007 1,001.43 6,230.37 J1002.2 -6.12 693.15 4,594.49J1002.010 1,002.37 4,691.40 J38 6.1 705.08 3,999.25J1002.014 1,001.36 4,270.89 J38 -5.91 677.35 3,248.40J1002.016 1,001.87 4,443.13 J38 -4.73 680.08 3,418.40J1002.019 1,519.80 3,000.78 J1002.019 20 670.51 3,000.78
J1002.1 1,503.77 6,141.28 J1002.2 -21.38 657.91 3,997.00
Baseline MDD plus Fire Flow Report

Appendix C 26 of 34
IDTotal Demand
(gpm)Available Flow at
Hydrant (gpm)Critical
Node IDCritical Node Pressure (psi)
Critical Node Head (ft)
Design Flow (gpm)
Baseline MDD plus Fire Flow Report
J1002.2 1,010.43 844.92 J1002.2 20 753.42 844.98J1003 1,502.71 6,239.83 J1002.2 -12.23 679.05 4,366.43J1004 1,001.83 6,731.01 J1002.2 -12.79 677.75 4,695.14J1005 1,003.04 6,548.72 J1002.2 -5.46 694.67 4,863.88J1006 1,002.08 2,783.66 J1006 20 739.57 2,783.66J1007 1,506.51 7,034.40 J723 18.3 817.11 4,866.56J1008 1,001.51 7,078.02 J723 18.14 816.74 4,743.53J1009 1,003.52 2,123.05 J1009 20 710.22 2,123.05J1010 1,005.32 3,888.08 J714 10.17 768.87 3,079.41J1011 1,002.88 3,281.76 J714 -11.07 719.87 1,835.06J1012 1,005.15 3,594.69 J714 5.78 758.76 2,576.05J1013 1,004.14 3,693.27 J714 15.41 780.98 3,248.84J1015 1,002.79 1,885.01 J1016 19.71 786.56 1,869.60J1016 1,001.90 1,426.41 J1016 20 787.22 1,426.41J1017 1,006.48 2,835.70 J1016 9.15 762.17 2,189.21J1018 1,005.79 2,993.64 J1016 18.69 784.19 2,889.07J1019 1,003.70 5,160.29 J714 -3.32 737.76 3,338.54J1020 1,001.25 6,263.50 J714 -9.4 723.71 3,769.05J1021 1,002.69 7,894.47 J714 -17.03 706.1 4,417.81J1022 1,502.07 4,946.59 J1022 20 654.63 4,946.59J1023 1,502.07 6,572.70 J714 10.11 768.75 5,239.49J1024 1,501.57 7,557.87 J714 1.52 748.91 5,212.90J1025 1,504.50 7,703.65 J714 4.51 755.82 5,504.75J1026 1,001.82 7,959.72 J714 -11.72 718.36 4,687.45J1027 1,005.25 4,912.34 J1016 16.26 778.58 4,490.01J1028 1,004.30 5,319.80 J1016 -2.82 734.55 3,542.45J1029 1,002.82 4,613.94 J1016 1.96 745.59 3,270.52J1030 1,005.28 2,907.95 J708 -2.88 653.38 2,401.47J1031 1,002.97 5,646.19 J1031 20 772.27 5,646.20J1033 1,003.66 1,057.01 J94 10.78 669.88 262.52J1034 1,004.78 645.33 J427 12.34 630.11 200.34J1035 1,005.49 926.41 J427 7.25 618.37 205.95J1036 1,004.30 1,670.09 J427 -6.33 587.03 217.23J1037 1,002.24 1,937.98 J427 -17.69 560.81 185.84J1038 1,007.86 2,070.94 J427 -26.25 541.06 170.16J1039 1,011.10 1,395.04 J427 -13.24 571.08 160.36J1040 1,007.88 357.19 J427 15.15 636.61 149.49J1041 1,012.56 914.77 J427 -1.01 599.32 152.53J1042 1,009.40 1,102.29 J427 -9.74 579.16 142.43J1043 1,003.99 799.43 J427 -1.14 599 128.87J1044 1,006.12 808.76 J427 0.76 603.38 139.86J1045 1,003.08 2,251.99 J94 -8.56 625.23 238.8J1046 1,009.74 2,635.96 J427 -24.9 544.17 243.34J1047 1,005.64 2,464.90 J94 -13.55 613.74 233.91

Appendix C 27 of 34
IDTotal Demand
(gpm)Available Flow at
Hydrant (gpm)Critical
Node IDCritical Node Pressure (psi)
Critical Node Head (ft)
Design Flow (gpm)
Baseline MDD plus Fire Flow Report
J1048 1,003.86 932.21 J94 11.84 672.33 243.48J1049 1,004.36 1,590.72 J94 0.58 646.35 223.08J1050 1,005.38 823.18 J94 8.21 663.94 200.65J1051 1,002.21 1,199.60 J708 8.38 679.37 1,075.69J1052 1,003.96 1,058.13 J709 8.37 665.81 958.84J1053 1,002.45 402.13 J94 12.31 673.42 143.71J1054 1,004.08 759.91 J94 -0.3 644.32 155.75J1056 1,007.17 707.72 J94 6.84 660.78 178.74J1057 1,003.20 781.95 J94 -0.73 643.33 156.39J1058 1,005.55 982.91 J94 -12.96 615.1 154.33J1060 1,004.12 1,128.05 J94 -7.73 627.17 178.35J1061 1,003.94 2,702.82 J1100 -17.29 707.36 2,140.46J1062 1,005.73 2,533.80 J1100 -5.12 735.46 2,143.22J1063 1,010.99 2,601.12 J1100 -9.16 726.13 2,149.95J1064 1,006.07 855.23 J94 12.06 672.84 225.91J1065 1,013.44 2,149.21 J94 -7.96 626.63 239.97J1066 1,004.18 2,048.01 J94 -6.16 630.79 231.62J1067 1,007.48 2,314.26 J94 -10.89 619.86 235.37J1068 1,004.36 1,912.46 J427 -17.91 560.3 174.95J1069 1,021.32 1,797.81 J427 -11.89 574.2 202.69J1070 1,003.68 1,461.61 J427 -3.98 592.47 186.17J1071 1,008.28 1,565.85 J427 -5.15 589.76 196.88J1072 1,016.92 1,569.41 J427 -4.99 590.11 205.32J1073 1,011.48 1,597.97 J427 -6.02 587.75 201.67J1074 1,007.04 1,582.16 J427 -5.67 588.55 197.76J1075 1,013.83 1,602.59 J427 -6.08 587.6 207.87J1076 1,005.82 1,536.74 J427 -4.35 591.6 197.57J1077 1,008.93 1,586.26 J427 -5.74 588.39 205.72J1078 1,011.42 1,565.33 J427 -5.04 590.02 212.62J1079 1,016.42 1,349.14 J427 1.3 604.64 217.09J1080 1,009.30 1,311.16 J94 5.98 658.81 236.92J1081 1,005.65 2,128.16 J1100 18.24 789.36 2,098.70J1082 1,026.17 2,328.00 J1100 4.1 756.73 2,078.58J1083 1,003.95 2,085.81 J1100 17.48 787.62 2,045.04J1084 1,007.13 2,181.54 J1100 12.53 776.19 2,061.08J1085 1,007.19 2,206.68 J1100 10.51 771.53 2,054.23J1086 1,009.07 1,964.02 J1086 20 786.56 1,964.03J1087 1,003.24 1,986.03 J1087 20 785.48 1,986.03J1088 1,005.16 2,086.03 J1087 15.78 775.73 2,024.91J1089 1,004.39 2,089.28 J1100 14.57 780.9 2,002.78J1090 1,007.10 1,433.05 J1090 20 662.44 1,433.06J1091 1,006.23 2,141.10 J1100 10.31 771.06 1,990.25J1092 1,004.87 2,123.95 J1100 12.12 775.23 2,000.31J1093 1,006.79 2,138.59 J1100 13.05 777.39 2,028.16

Appendix C 28 of 34
IDTotal Demand
(gpm)Available Flow at
Hydrant (gpm)Critical
Node IDCritical Node Pressure (psi)
Critical Node Head (ft)
Design Flow (gpm)
Baseline MDD plus Fire Flow Report
J1094 1,008.76 2,417.99 J1100 -5.57 734.42 2,031.88J1095 1,006.01 2,188.37 10001 0.49 728.23 1,939.46J1096 1,004.85 1,700.93 10001 20 773.25 1,700.93J1097 1,002.91 1,815.99 10005 20 752.44 1,815.99J1098 1,008.81 1,960.43 J1100 14.38 780.46 1,876.37J1099 1,024.68 2,189.43 J1100 -6.42 732.46 1,832.51J1100 1,017.46 1,740.44 J1100 20 793.43 1,740.45J1101 1,009.10 2,111.11 J1100 0.42 748.25 1,839.78J1102 1,011.78 2,186.51 J1100 1.43 750.57 1,922.29J1103 1,003.29 2,037.17 J1100 10.77 772.13 1,899.69J1104 1,007.50 2,233.48 J1100 1.55 750.84 1,955.01J1105 1,009.69 2,376.16 J1100 -7.59 729.75 1,966.19J1106 1,007.74 2,494.41 J1100 -16.55 709.07 1,975.05J1107 1,007.13 2,765.72 J1100 -34.4 667.87 2,026.70J1108 1,012.49 2,975.49 J1100 -47.57 637.47 2,070.83J1109 1,005.28 2,910.74 J1100 -25.06 689.44 2,242.71J111 1,000.21 -47,253.44 J64 195.25 1,158.60 61,582,868.00
J1110 1,002.92 1,791.26 J1100 19.06 791.26 1,777.69J1111 1,000.98 2,207.73 J427 -19.76 556.04 208J1112 1,027.79 3,100.66 J1100 -12.3 718.88 2,554.06J1113 1,001.80 1,978.52 J1100 12 774.97 1,860.83J1114 1,019.45 2,558.12 J1114 20 754.65 2,558.16J1115 1,005.02 6,301.20 J1031 18.68 769.23 6,184.80J1116 1,009.35 1,757.90 J1117 16.38 657.12 1,724.71J1117 1,008.41 1,104.35 J1117 20 665.48 1,104.36J1118 1,009.62 2,258.71 J1121 0.37 698.7 1,935.87J1120 1,002.02 687.88 J427 4 610.86 132.85J1121 1,013.26 1,033.80 J1121 20 744 1,033.80J1122 1,037.16 1,965.15 J508 -5.4 554.84 1,524.06J1123 1,010.41 909.85 J553 1.37 509.7 794.82J1124 1,014.12 613.26 J508 2.14 572.24 506.69J1125 1,006.47 655.18 J427 -1.96 597.12 101.41J1126 1,007.02 579.41 J427 -0.64 600.17 93.34J1127 1,006.19 692.95 J427 -5.47 589.01 93.42J1128 1,003.86 372.64 J427 8.94 622.28 90.83J1129 1,006.25 329.32 J427 7.92 619.91 76.99J1130 1,004.48 1,199.97 J427 3.42 609.53 706.93J1131 1,008.80 610.6 J801 17.78 818 546.97J1133 1,006.89 650.25 J427 1.07 604.11 114.35J1134 1,000.00 -6,290.42 J94 22.37 696.63 11,921.92J1135 1,008.85 1,067.67 J427 -9.87 578.85 137.15J1136 1,005.10 1,216.54 J427 -8.61 581.76 150.72J1137 1,015.04 1,148.96 J427 -5.41 589.15 162.76J1138 1,008.80 909.31 J427 1.41 604.9 156.53

Appendix C 29 of 34
IDTotal Demand
(gpm)Available Flow at
Hydrant (gpm)Critical
Node IDCritical Node Pressure (psi)
Critical Node Head (ft)
Design Flow (gpm)
Baseline MDD plus Fire Flow Report
J1139 1,003.36 1,017.06 J801 -4.99 765.45 545.09J1141 1,004.59 2,046.77 J1100 8.72 767.39 1,881.28J1142 1,022.12 2,122.42 J1100 10.13 770.64 1,970.79J1143 1,004.37 5,210.25 J1016 0.04 741.15 3,611.49J1144 1,004.05 2,791.76 J1016 12.62 770.18 2,315.77J1145 1,000.00 7,565.85 J723 16.04 811.91 4,198.02J1146 1,000.00 6,254.22 J723 19.69 820.31 5,765.22J1147 1,004.77 4,258.75 J723 16.95 814.01 2,434.44J1148 1,001.13 -3,183.06 J723 21.61 824.76 406.81J119 1,001.24 3,394.71 J1100 8.55 766.99 3,151.33J121 1,000.01 16,801.36 J121 20 589.16 16,801.43J123 1,000.05 -2,413,669.00 J723 21.61 824.76J125 1,000.01 -21,151.27 J723 21.61 824.76J127 1,001.86 -14,226.59 J723 21.61 824.76J131 1,000.00 16,463.39 J131 20 589.16 16,463.46J133 1,001.02 15,605.31 J133 20 589.16 15,605.36J16 1,003.17 516.66 J427 10.53 625.94 141.8J18 1,011.57 132.19 J18 20 611.16 132.19J20 1,012.51 979.18 J608 -28.95 490.43 144.33
J2001 1,025.88 1,585.72 J425 -1.92 605.98 1,395.08J2002 1,014.51 2,747.11 J1121 -13.32 667.11 2,001.43J2003 1,006.71 2,476.47 J82 -0.51 573.88J2004 1,007.00 2,445.88 J608 -25.3 498.86 1,588.04
J2004.1 1,010.12 2,107.02 J608 10.4 581.25 1,641.43J2005 1,009.76 1,897.16 J608 -1.99 552.66 1,172.37
J2005.1 1,015.19 844.22 J2005.1 20 541.92 844.23J2006 1,008.06 2,628.73 J608 -51.11 439.28 1,191.79J2007 1,008.68 2,515.78 J608 -48.61 445.05 995.32J2008 1,009.95 1,280.91 J608 -51.29 438.87 141.68J2009 1,010.42 1,137.49 J608 -41.11 462.38 141.66J2010 1,015.35 519.72 J608 0.15 557.6 146.56J2011 1,014.71 1,082.76 J608 -36.59 472.81 145.16J2012 1,008.58 1,405.54 J608 -62.92 412.03 135.3J2013 1,010.44 1,257.50 J608 -56.38 427.13 132.73J2014 1,003.14 1,411.04 J608 -66.46 403.87 126.75J2015 1,002.25 1,430.67 J608 -67.52 401.42 126.49J2016 1,000.55 1,311.49 J608 -63.51 410.67J2017 1,004.08 1,196.85 J608 -53.45 433.88 126.2J2018 1,000.55 871.42 J608 -33.05 480.97 110.92J2019 1,009.23 713.02 J608 -19.66 511.88 120.14J2020 1,005.14 876.89 J608 -31.87 483.7 118.49J2021 1,006.81 824.56 J608 -26.39 496.35 122.24J2022 1,011.18 904.36 J608 -30.88 485.99 129.73J2024 1,007.70 709.34 J608 -17.14 517.7 125.5

Appendix C 30 of 34
IDTotal Demand
(gpm)Available Flow at
Hydrant (gpm)Critical
Node IDCritical Node Pressure (psi)
Critical Node Head (ft)
Design Flow (gpm)
Baseline MDD plus Fire Flow Report
J2025 1,014.46 501.7 J608 -5.34 544.93 121.16J2026 1,018.40 789.98 J608 -29.93 488.18 121.97J2027 1,005.69 917.68 J608 -38.54 468.31 111.05J2028 1,004.17 1,135.55 J608 -53.22 434.43 111.51J2029 1,001.78 928.6 J608 -36.09 473.96 111.4J2030 1,002.74 1,160.47 J608 -50.83 439.93 121.12J2031 1,005.27 1,084.82 J608 -44.14 455.37 124.06J2032 1,006.64 1,164.78 J608 -56.88 425.98 113.04J2033 1,006.45 1,165.83 J608 -58.71 421.76 111.85J2034 1,003.58 511,080.38 J608 -13,741,534.00 ############ 287.3J2035 1,011.04 1,633.82 J608 -97.26 332.79J2036 1,534.98 1,692.11 J608 -100.06 326.32J2037 1,015.24 735.23 J608 -27.6 493.54 116.56J2038 1,004.38 756.67 J608 -29.5 489.17 107.96J2039 1,005.13 514.09 J608 -12.82 527.66 102.04J2040 1,007.09 670.48 J608 -22.84 504.55 110.68J2041 1,028.40 715.91 J608 -25.84 497.61 131.99
J2041A 1,006.15 683.74 J608 -24.14 501.53 109.74J2042 1,007.01 919.46 J608 -12.87 527.54 167.52J2043 1,014.23 665.51 J608 -1.15 554.58 175.3J2044 1,003.55 888.37 J18 -38.22 476.79 166.1J2045 1,004.50 987.71 J608 -16.4 519.41 170.18J2046 1,001.86 813.33 J608 -8.1 538.55 166.74J2047 1,007.29 866.58 J608 -10.32 533.43 172.16J2048 1,002.38 858.84 J608 -10.19 533.73 162.9J2049 1,004.86 1,113.47 J608 -23.92 502.04 169.73J2050 1,008.48 1,247.50 J608 -28.34 491.84 173.35J2052 1,001.54 1,213.03 J608 -40.42 463.97 146.71J2054 1,000.43 1,479.67 J608 -28.34 491.84 179.81J2055 1,001.73 782.4 J608 -6.71 541.77 150.16
J22 1,009.34 734.17 J608 -12.57 528.24 140.74J24 1,009.39 543.94 J608 -1.46 553.88 140.79J26 1,010.31 366.41 J608 8.38 576.58 141.95J28 1,012.09 315.94 J608 11.14 582.97 143.74J30 1,016.60 1,359.86 J608 -54.84 430.68 149.54J32 1,009.46 1,297.49 J608 -52.63 435.78 139.24J34 1,022.38 855.87 J608 -27.84 493.01 126.2J36 1,014.75 116.02 J36 20 304.16 116.02J38 1,002.10 2,532.37 J38 20 737.16 2,532.37J40 1,001.49 2,470.36 J42 20 724.16 2,470.36
J400 1,002.16 1,364.97 J608 -28.34 491.84 178.78J4001 1,004.12 2,760.04 J1100 -34.18 668.38 2,023.70J4002 1,008.04 1,752.52 J4002 20 664.11 1,752.53J4003 1,011.77 1,638.40 J1117 17.65 660.05 1,615.84

Appendix C 31 of 34
IDTotal Demand
(gpm)Available Flow at
Hydrant (gpm)Critical
Node IDCritical Node Pressure (psi)
Critical Node Head (ft)
Design Flow (gpm)
Baseline MDD plus Fire Flow Report
J4004 1,005.38 2,150.10 J1121 11.22 723.74 1,971.55J4006 1,007.47 1,030.69 J608 -27.41 494 155.14J4008 1,007.97 1,043.96 J608 -19.12 513.12 172.85J4009 1,000.21 1,076.46 J608 -22.48 505.36 165.09J401 1,018.12 872.98 J608 -10.11 533.91 169.1
J4010 1,003.95 1,343.97 J608 -28.34 491.84 168.83J4011 1,005.66 1,137.45 J608 -54.33 431.87 112.07J4012 1,003.19 1,064.66 J608 -42.67 458.77 122.9J4013 1,002.00 1,260.49 J608 -58.89 421.34J4015 1,001.25 1,655.56 J608 -55.53 429.09 180.63J4016 1,005.17 1,006.49 J608 -17.32 517.27 170.05J402 1,011.82 429.56 J608 7.77 575.19 162.79J403 1,003.64 674.04 J608 -1.95 552.75 165.2J404 1,007.53 407.08 J427 10.94 626.89 119.49J405 1,015.82 491.32 J608 5.72 570.44 177.38J406 1,002.93 738.49 J608 -4.72 546.35 164.85J407 1,006.54 648.92 J608 -0.79 555.43 168.46J408 1,002.68 942.14 J608 -14.2 524.48 167.56J409 1,003.68 732.56 J18 -28.31 499.66 158.81J410 1,006.67 1,126.27 J427 4.18 611.28 198.42J411 1,031.57 552.75 J427 11.46 628.08 179.29J412 1,010.30 1,363.70 J427 -0.62 600.2 217.33J413 1,003.62 867.17 J94 -6.66 629.63 152.4J414 1,003.58 -1,298.32 J723 21.61 824.76 306.61J415 1,002.99 895.92 J94 14.46 678.37 306.02J416 1,003.49 -1,145.42 J723 21.61 824.76 262.38J417 1,003.67 2,104.86 J94 -5.6 632.06 245.56J418 1,006.58 1,171.99 J94 8.04 663.55 234.47J419 1,007.27 1,046.24 J94 9.83 667.69 234.9J42 1,001.29 2,017.62 J42 20 724.16 2,017.62
J420 1,004.53 1,832.23 J420 20 674.57 1,832.24J421 1,015.24 1,150.42 J421 20 582.13 1,150.37J422 1,028.72 1,111.62 J422 20 582.77 1,111.51J423 1,003.66 225.51 J94 19.61 690.26 198.92J424 1,020.75 2,219.70 J1121 8.86 718.29 1,987.25J425 1,039.41 876.02 J425 20 656.57 876.03J426 1,008.53 -149.66 J723 21.61 824.76 67.93J427 1,002.62 62.02 J427 20 647.8 62.02J428 1,003.88 328.23 J427 11.4 627.95 95.5J429 1,013.61 408.17 J427 8.54 621.34 105.24J430 1,001.86 3,397.99 J430 20 660.67 3,397.99J431 1,001.80 -4,777.95 J723 21.61 824.76 561.78J433 1,001.55 209.04 J94 18.28 687.18 139.58J434 1,006.83 731.05 J608 -4.23 547.49 171.71

Appendix C 32 of 34
IDTotal Demand
(gpm)Available Flow at
Hydrant (gpm)Critical
Node IDCritical Node Pressure (psi)
Critical Node Head (ft)
Design Flow (gpm)
Baseline MDD plus Fire Flow Report
J435 1,002.16 -145.71 J723 21.61 824.76 197.71J436 1,013.64 2,185.72 J1117 8.06 637.92 2,007.93J437 1,009.45 1,538.83 J437 20 527.29 1,538.83J438 1,010.33 2,364.23 J608 -50.59 440.49 671.85J439 1,003.80 553.84 J439 20 687.52 553.84J44 1,000.55 2,574.68 J44 20 702.16 2,574.68
J440 1,000.00 483.01 J608 6.15 571.44 160.35J442 1,012.54 858.03 J608 7.36 574.24 347.78J46 1,000.48 2,552.56 J56 19.83 706.76 2,548.12
J460 1,005.05 817.75 J801 7.94 795.28 546.78J461 1,007.78 783.34 J801 9.98 799.99 549.51J463 1,003.83 827.34 J801 7.32 793.85 545.56J464 1,010.61 843.86 J801 6.76 792.56 552.34
J465A 1,008.42 847.58 J427 3.12 608.84 156.14J466 1,010.05 704.26 J801 14.04 809.37 551.78J48 1,000.16 2,414.76 J48 20 702.16 2,414.76
J480 1,003.74 1,284.92 J608 -45.66 451.88 147.26J481 1,002.03 1,130.92 J608 -25.06 499.41 166.9J50 1,001.00 2,582.09 J56 16.1 698.16 2,484.70
J500 1,000.00 3,396.83 J1100 8.64 767.22 3,154.87J5004 1,007.82 1,058.70 J1121 16.45 735.79 1,028.37J5008 1,012.87 554.31 J5008 20 824.14 554.31J501 1,000.00 3,401.55 J1100 8.51 766.9 3,156.47
J5010 1,013.77 799.7 J801 9.42 798.7 555.5J502 1,004.55 1,775.91 J4002 17.75 658.91J503 1,004.09 2,721.13 J1100 -18.61 704.32 2,140.61J504 1,016.50 2,083.19 J504 20 558.8 2,083.19J505 1,015.24 1,559.39 J505 20 655.42 1,559.39J506 1,033.83 1,004.17 J506 20 728.27 1,004.17J507 1,002.91 2,472.82 J1121 15.35 733.27 2,378.40J508 1,006.15 498.72 J508 20 613.46 498.72J509 1,008.96 3,065.34 J1100 -23.61 692.79 2,383.28J510 1,002.87 443.09 J608 4.63 567.95 137.16J512 1,004.88 492.47 J608 0.83 559.17 133.67J514 1,001.26 452.08 J608 6.67 572.65 153.23J52 1,000.83 2,083.24 J56 16.97 700.16 2,021.49
J522 1,008.78 1,037.31 J608 -46.63 449.63 113.95J522A 1,002.68 1,027.86 J608 -46.31 450.37 107.86
J54 1,001.70 1,755.82 J54 20 704.16 1,755.82J550 1,018.57 627.99 J508 0.27 567.93 511.14J551 1,004.03 608.32 J508 1.21 570.09 496.6J552 1,038.16 961.24 J553 -2.7 500.31 822.58J553 1,009.49 470.84 J553 20 552.7 470.84J554 1,016.07 853.26 J553 11.69 533.53 800.48

Appendix C 33 of 34
IDTotal Demand
(gpm)Available Flow at
Hydrant (gpm)Critical
Node IDCritical Node Pressure (psi)
Critical Node Head (ft)
Design Flow (gpm)
Baseline MDD plus Fire Flow Report
J555 1,020.23 844.98 J555 20 638.1 844.98J56 1,002.57 1,423.06 J56 20 707.16 1,423.06
J600 1,000.26 1,016.43 J608 -26.76 495.48 148.67J601 1,013.67 673.1 J608 -8.68 537.21 145.15J603 1,004.48 741.74 J608 -29.78 488.53 108.07J604 1,005.00 731.64 J608 -28.64 491.16 108.59J605 1,004.67 1,104.54 J608 -49.4 443.23 113.49J606 1,006.01 691.95 J608 -24.6 500.47 109.6
J606A 1,001.52 689.37 J608 -24.78 500.06 105.11J607 1,007.41 1,042.71 J608 -47.27 448.15 112.58J608 1,041.86 137.89 J608 20 603.41 137.89J609 1,013.19 678.95 J608 -22.76 504.73 116.78J610 1,004.80 845.74 J608 -15.83 520.72 153.21J611 1,001.41 785.11 J608 9.17 578.41 336.65J612 1,006.60 701.71 J608 -17.1 517.77 122.04J621 1,003.76 854.07 J621 20 682.6 854.1J650 1,004.49 1,222.10 J608 -55.81 428.45J651 1,009.89 1,092.91 J608 -44.35 454.9 135.1J670 1,006.65 1,374.52 J608 -71.93 391.26 113.06J671 1,001.25 1,331.25 J608 -68.31 399.59J672 1,007.02 1,155.44 J608 -51.79 437.73 113.42J673 1,001.62 1,321.17 J608 -67.33 401.87J674 1,004.92 1,226.99 J608 -58.35 422.58J675 1,002.51 1,375.53 J608 -72.38 390.22J676 1,001.11 1,296.63 J608 -65.08 407.06 107.52J677 1,021.56 1,307.67 J608 -52.46 436.18 149.94J678 1,019.23 604.71 J608 -10.23 533.64 125.63J679 1,045.15 1,128.91 J608 -45.72 451.72 151.55J680 1,023.97 1,048.45 J608 -40.75 463.22J681 1,040.30 678.7 J608 -13.95 525.05 146.71J682 1,022.89 996.33 J608 -36.74 472.46J683 1,017.99 691.18 J608 -16.8 518.48 124.39J684 1,004.59 934.58 J608 -33.76 479.33J687 1,004.36 1,370.28 J608 -71.71 391.75J688 1,000.25 1,498.00 J608 -78.53 376J700 1,005.92 721.79 J714 16.11 782.6 642.3J701 1,000.49 6,567.91 J1031 15.6 762.12 6,153.55J702 1,004.63 1,088.41 J714 3.16 752.69 729.71J703 1,003.16 1,445.66 J714 -12.92 715.58 781.69J704 1,002.06 1,325.46 J704 20 777.58 1,325.48J705 1,502.62 1,099.06 J705 20 694.44 1,099.06J706 1,004.00 1,197.87 J706 20 742.35 1,197.87J707 1,006.13 1,342.56 J707 20 741.83 1,342.56J708 1,004.24 953.11 J708 20 706.18 953.12

Appendix C 34 of 34
IDTotal Demand
(gpm)Available Flow at
Hydrant (gpm)Critical
Node IDCritical Node Pressure (psi)
Critical Node Head (ft)
Design Flow (gpm)
Baseline MDD plus Fire Flow Report
J709 1,018.19 919.99 J709 20 692.64 920J710 1,003.35 2,548.11 J714 13.36 776.25 2,100.20J711 1,002.54 1,579.53 J711 20 713.43 1,579.53J712 1,501.16 4,590.94 J713 19.04 668.57 4,559.89J713 1,500.98 2,983.10 J713 20 670.78 2,983.10J714 1,006.55 578.8 J714 20 791.57 578.81J715 1,004.86 1,026.18 J714 6.5 760.41 729.93J716 1,502.98 7,124.58 J714 2.49 751.15 4,995.99J717 1,003.35 6,561.08 J723 19.06 818.86 5,225.22J718 1,004.16 6,580.43 J723 18.94 818.59 5,111.80J719 1,504.13 7,125.06 J723 18.15 816.77 4,799.58J720 1,003.41 7,468.93 J714 -3.55 737.22 4,826.38J723 1,510.15 2,303.44 J723 20 821.04 2,303.44J724 1,001.94 1,395.93 J726 19 800.53 1,318.49J725 1,000.95 1,316.12 J726 14.79 790.82 1,027.95J726 1,001.59 927.83 J726 20 802.84 927.83J727 1,000.69 1,460.46 J726 11.78 783.86 1,027.69J728 1,000.41 1,626.07 J726 13.28 787.32 1,201.83J729 1,001.23 1,259.37 J726 19.2 800.99 1,202.66J730 1,509.09 -1,101.56 J723 21.61 824.76J731 1,004.50 1,104.67 J731 20 786.64 1,104.67J80 1,004.86 897.37 J608 5.93 570.94 340.09
J800 1,037.15 557.15 J800 20 792.5 557.15J801 1,005.65 535.54 J801 20 823.12 535.54J802 1,012.29 568.1 J801 19.13 821.12 542.18J82 1,001.75 345.56 J608 16.96 596.4 235.58J94 1,002.76 140.79 J94 20 691.16 140.79

2017 Jenny Lind Water Master Plan Calaveras County Water District
APPENDIX D
Buildout Node, Pipe, and Fire Flow Reports

THIS PAGE LEFT INTENTIONALLY BLANK

Appendix D 1 of 34
IDFrom Node To Node
Length (ft)
Dia (in)
Rough-ness
Flow (gpm)
Velocity (ft/s)
Headloss (ft)
HL/1000 (ft/k-ft) Status
18 J480 J30 1031.26 6 140 144.72 1.64 1.86 1.80 Open20 J5010 J464 2457.92 12 100 93.33 0.26 0.13 0.05 Open
229 J436 J4003 1292.43 6 130 77.56 0.88 0.84 0.65 Open239 J514 J440 109.08 6 130 -247.40 2.81 0.61 5.58 Open24 J465A J76 1115.54 6 130 18.36 0.21 0.05 0.05 Open
241 J2046 416 35.63 6 130 0.00 0.00 0.00 0.00 Open243 J606 J606A 9.58 6 130 13.18 0.15 0.00 0.03 Open245 J2040 J2041A 57.71 6 130 23.48 0.27 0.00 0.07 Open249 9995 J609 715.22 6 130 205.55 2.33 2.83 3.96 Open253 9999 J2041 4389.29 6 130 -37.76 0.43 0.75 0.17 Open257 10003 10007 3814.74 6 130 24.87 0.28 0.30 0.08 Open259 10005 J1097 106.38 6 130 -1.59 0.02 0.00 0.00 Open263 10009 J1081 71.29 6 130 -48.15 0.55 0.02 0.27 Open269 10015 J1061 818.83 12 130 -9.57 0.03 0.00 0.00 Open271 10017 J2030 178.81 6 130 27.82 0.32 0.02 0.10 Open273 10019 10017 121.65 6 130 29.72 0.34 0.01 0.11 Open275 10021 10019 100.79 6 130 31.52 0.36 0.01 0.12 Open277 10023 10021 153.08 6 130 33.50 0.38 0.02 0.14 Open279 10025 10023 411.58 6 130 37.12 0.42 0.07 0.17 Open281 10027 10025 178.30 6 130 41.17 0.47 0.04 0.20 Open283 10029 10027 409.25 6 130 45.41 0.52 0.10 0.24 Open285 10031 10029 500.77 6 130 52.25 0.59 0.16 0.31 Open287 10033 10031 574.79 6 130 61.75 0.70 0.25 0.43 Open289 10035 10037 682.69 6 130 53.60 0.61 0.22 0.33 Open291 10037 10039 281.65 6 130 47.73 0.54 0.07 0.27 Open293 10039 10041 285.51 6 130 43.75 0.50 0.06 0.23 Open295 10041 J2029 209.10 6 130 40.64 0.46 0.04 0.20 Open297 10043 J4013 356.68 6 130 -103.71 1.18 0.40 1.12 Open299 10045 10043 1238.08 6 130 -90.56 1.03 1.07 0.87 Open301 10047 10045 522.45 6 130 -66.09 0.75 0.25 0.48 Open303 10049 10047 293.50 6 130 -43.52 0.49 0.07 0.22 Open307 J4013 J2016 119.81 6 130 -107.57 1.22 0.14 1.19 Open311 10055 J2030 551.73 6 130 -2.72 0.03 0.00 0.00 Open313 J4012 J2031 140.26 6 130 15.62 0.18 0.00 0.03 Open
4014D 4014 J688 1.00 8 150 0.00 0.00 0.00 0.00 Open4014U J2015 4014 1.00 8 150 0.00 0.00 0.00 0.00 Open401D 401 J4001 1.00 4 150 0.00 0.00 0.00 0.00 Open401U J1107 401 1.00 4 150 0.00 0.00 0.00 0.00 Open402D 402 J4002 1.00 4 150 254.72 6.50 0.03 32.59 Open402U J502 402 1.00 4 150 254.90 6.51 0.03 32.59 Open403B1 J2004.1 403B 1.00 12 150 1857.10 5.27 0.01 6.10 Open403B2 403B J2004 1.00 12 150 1857.10 5.27 0.01 6.10 Open403D 403 J4003 1.00 6 150 0.00 0.00 0.00 0.00 Open403U J1117 403 1.00 6 150 0.00 0.00 0.00 0.00 Open
Buildout PHD Pipe Report

Appendix D 2 of 34
IDFrom Node To Node
Length (ft)
Dia (in)
Rough-ness
Flow (gpm)
Velocity (ft/s)
Headloss (ft)
HL/1000 (ft/k-ft) Status
Buildout PHD Pipe Report
404B1 J2005.1 404B 1.00 10 150 121.91 0.50 0.00 0.12 Open404B2 404B J2005 1.00 10 150 121.91 0.50 0.00 0.06 Open404D 404 J424 1.00 14 150 2475.30 5.16 0.00 4.94 Open404U J4004 404 1.00 14 150 2475.21 5.16 0.00 4.94 Open405D 405 J5004 1.00 6 150 14.06 0.16 0.00 0.00 Open405U J1121 405 1.00 6 150 14.06 0.16 0.00 0.00 Open406D 406 J600 1.00 6 150 0.00 0.00 0.00 0.00 Open406U J2055 406 1.00 6 150 0.00 0.00 0.00 0.00 Open408D 408 J4008 1.00 6 150 0.00 0.00 0.00 0.00 Open408U J2048 408 1.00 6 150 0.00 0.00 0.00 0.00 Open410D 410 J4010 1.00 4 150 0.00 0.00 0.00 0.00 Open410U J400 410 1.00 4 150 0.00 0.00 0.00 0.00 Open411D 411 J2034 1.00 8 150 619.59 3.95 0.01 5.77 Open411U J4011 411 1.00 8 150 619.59 3.95 0.01 5.80 Open415D 415 J4015 1.00 10 150 250.94 1.03 0.00 0.37 Open415U J2054 415 1.00 10 150 250.94 1.03 0.00 0.37 Open420D 420 J522A 1.00 6 150 22.05 0.25 0.00 0.06 Open420U J522 420 1.00 6 150 22.05 0.25 0.00 0.06 Open900D 900 J435 1.00 6 150 0.00 0.00 0.00 0.00 Open900U J705 900 1.00 6 150 0.00 0.00 0.00 0.00 Open901D 901 J433 1.00 6 150 0.00 0.00 0.00 0.00 Open901U J621 901 1.00 6 150 0.00 0.00 0.00 0.00 Open902D 902 J423 1.00 6 150 0.00 0.00 0.00 0.00 Open902U J1051 902 1.00 6 150 0.00 0.00 0.00 0.00 Open
NEW011 9993 NEW01 1.00 6 150 219.43 2.49 0.00 3.42 OpenNEW012 NEW01 9995 1.00 6 150 219.42 2.49 0.00 3.42 OpenNEW021 9997 NEW02 1.00 4 150 0.00 0.00 0.00 0.00 OpenNEW022 NEW02 9999 1.00 4 150 0.00 0.00 0.00 0.00 OpenNEW031 10001 NEW03 1.00 4 150 36.61 0.93 0.00 0.85 OpenNEW032 NEW03 10003 1.00 4 150 36.61 0.93 0.00 0.85 OpenNEW041 10005 NEW04 1.00 4 150 0.00 0.00 0.00 0.00 OpenNEW042 NEW04 10007 1.00 4 150 0.00 0.00 0.00 0.00 OpenNEW051 10009 NEW05 1.00 6 150 46.21 0.52 0.00 0.18 OpenNEW052 NEW05 10011 1.00 6 150 46.21 0.52 0.00 0.18 OpenNEW061 10013 NEW06 1.00 6 150 0.00 0.00 0.00 0.00 OpenNEW062 NEW06 10015 1.00 6 150 0.00 0.00 0.00 0.00 OpenNEW071 10051 NEW07 1.00 6 150 189.66 2.15 0.00 2.56 OpenNEW072 NEW07 J2016 1.00 6 150 189.67 2.15 0.00 2.62 OpenNEW081 J2018 NEW08 1.00 6 150 0.00 0.00 0.00 0.00 OpenNEW082 NEW08 10053 1.00 6 150 0.00 0.00 0.00 0.00 OpenNEW091 J2029 NEW09 1.00 6 150 0.21 0.00 0.00 0.00 OpenNEW092 NEW09 10055 1.00 6 150 0.21 0.00 0.00 0.00 Open
P10 T2 J1114 1739.74 14 130 2165.53 4.51 8.70 5.00 OpenP100 J1072 J1071 821.74 6 130 32.19 0.37 0.11 0.13 Open

Appendix D 3 of 34
IDFrom Node To Node
Length (ft)
Dia (in)
Rough-ness
Flow (gpm)
Velocity (ft/s)
Headloss (ft)
HL/1000 (ft/k-ft) Status
Buildout PHD Pipe Report
P101 J1071 J1074 614.47 6 130 125.82 1.43 0.98 1.60 OpenP102 J1074 J1075 635.12 6 130 152.69 1.73 1.45 2.28 OpenP103 J1075 J1077 631.53 10 130 495.60 2.02 1.06 1.68 OpenP104 J1077 J1078 1384.58 10 130 390.30 1.59 1.49 1.08 OpenP105 J1077 J1079 1791.66 6 130 87.72 1.00 1.47 0.82 OpenP106 J1079 J1078 546.20 6 130 19.44 0.22 0.03 0.05 OpenP107 J1076 J1075 1040.42 10 130 356.62 1.46 0.95 0.91 Open
P1075 J80 J82 384.81 6 130 287.95 3.27 2.85 7.39 OpenP108 J1073 J1076 674.65 10 130 380.89 1.56 0.70 1.03 Open
P1080 J121 T1 5067.59 24 130 6643.03 4.71 14.64 2.89 OpenP1088 T7009 J123 64.18 99 130 6656.25 0.28 0.00 0.00 OpenP109 J1072 J1073 655.18 10 130 442.36 1.81 0.89 1.36 Open
P1090 T1 J111 70.77 18 130 5011.40 6.32 0.49 6.96 OpenP110 J1073 J1074 926.26 6 130 42.09 0.48 0.19 0.21 Open
P1102 J123 J125 34.97 10 130 4993.97 20.40 4.23 121.09 OpenP1104 J125 J127 39.97 10 130 2487.91 10.16 1.33 33.32 OpenP1106 J133 J131 34.97 10 130 2476.87 10.12 1.16 33.04 OpenP1108 J131 J121 31.29 10 130 4982.11 20.35 3.77 120.56 OpenP111 J1038 J1137 1681.24 14 130 1697.37 3.54 5.36 3.19 OpenP112 J1039 J1041 1424.14 10 130 259.35 1.06 0.72 0.51 OpenP113 J1039 J1040 775.87 10 130 277.63 1.13 0.45 0.57 OpenP114 J1040 J16 450.25 10 130 213.95 0.87 0.16 0.35 OpenP115 J1044 J1042 806.09 6 130 -50.49 0.57 0.24 0.29 OpenP116 J1040 J1041 986.01 6 130 49.08 0.56 0.28 0.28 OpenP117 J1044 J1120 683.43 8 130 229.09 1.46 0.81 1.19 OpenP118 J1042 J1043 722.09 6 130 212.28 2.41 3.04 4.20 OpenP119 J1041 J1042 760.36 10 130 283.22 1.16 0.45 0.60 OpenP12 J1118 J1121 1184.17 6 130 100.83 1.14 1.25 1.06 Open
P120 J1043 J1125 973.08 8 130 418.52 2.67 3.54 3.64 OpenP121 J1125 J1126 1167.09 6 130 230.58 2.62 5.72 4.90 OpenP122 J1127 J1126 570.65 6 130 -9.88 0.11 0.01 0.01 OpenP123 J1125 J1127 1995.15 6 130 172.75 1.96 5.73 2.87 OpenP124 J1126 J1129 1494.83 6 130 205.30 2.33 5.91 3.95 OpenP125 J1128 J1129 731.65 12 130 1625.91 4.61 4.56 6.24 OpenP126 J1133 J428 546.92 12 130 1496.80 4.25 2.93 5.35 OpenP127 J1135 J1133 1940.77 12 130 708.83 2.01 2.60 1.34 OpenP128 J1135 J404 1055.74 12 130 823.85 2.34 1.87 1.77 OpenP129 J1136 J1135 263.51 12 130 1550.17 4.40 1.50 5.71 OpenP13 J507 J1118 582.00 14 130 2604.09 5.43 4.10 7.04 Open
P130 J1137 J1136 319.77 12 130 1558.60 4.42 1.84 5.77 OpenP131 J1137 J1138 840.43 6 130 125.25 1.42 1.33 1.58 OpenP133 J1139 J460 757.79 10 130 9.73 0.04 0.00 0.00 OpenP135 J10 J1023 967.85 10 130 -156.86 0.64 0.19 0.20 OpenP136 J5010 J1131 983.72 12 130 1663.42 4.72 6.40 6.50 Open

Appendix D 4 of 34
IDFrom Node To Node
Length (ft)
Dia (in)
Rough-ness
Flow (gpm)
Velocity (ft/s)
Headloss (ft)
HL/1000 (ft/k-ft) Status
Buildout PHD Pipe Report
P137 J5008 T5 1656.49 12 130 1481.75 4.20 8.70 5.25 OpenP139 J1057 J1058 585.02 6 130 16.02 0.18 0.02 0.04 OpenP14 J1112 J1114 2450.48 12 130 547.35 1.55 2.03 0.83 Open
P140 J1060 J1057 1215.75 6 130 22.47 0.25 0.08 0.07 OpenP141 J1049 J1060 987.59 6 130 20.48 0.23 0.05 0.06 OpenP143 J1053 J1058 1397.22 6 130 3.24 0.04 0.00 0.00 OpenP144 J1054 J1053 445.17 6 130 17.69 0.20 0.02 0.04 OpenP145 J1054 J1057 442.22 6 130 3.18 0.04 0.00 0.00 OpenP146 J1056 J1054 818.82 6 130 30.10 0.34 0.09 0.11 OpenP147 J1056 J1060 490.52 6 130 13.96 0.16 0.01 0.03 OpenP148 J1050 J1056 1277.98 6 130 59.69 0.68 0.51 0.40 OpenP149 J16 J1044 880.33 8 130 198.61 1.27 0.81 0.92 OpenP15 J1116 J1117 1489.37 6 130 16.89 0.19 0.06 0.04 Open
P150 J1051 J1052 518.22 6 130 51.26 0.58 0.16 0.30 OpenP151 J1048 J1050 977.04 6 130 83.15 0.94 0.72 0.74 OpenP153 J1036 J1111 509.09 6 130 352.19 4.00 5.47 10.74 OpenP154 J1035 J1036 752.58 6 130 132.41 1.50 1.32 1.75 OpenP155 J1148 J1033 662.18 10 130 868.79 3.55 3.14 4.75 OpenP156 J621 J1052 651.52 6 130 -8.95 0.10 0.01 0.01 OpenP157 J1127 J1128 488.26 6 130 168.40 1.91 1.34 2.74 OpenP158 J1031 J1115 416.43 18 130 2684.48 3.38 0.91 2.19 OpenP16 J507 J1116 720.34 6 130 62.40 0.71 0.31 0.44 Open
P161 J1115 J1025 636.71 18 130 2759.81 3.48 1.47 2.30 OpenP162 J1025 J1024 431.33 16 130 1957.13 3.12 0.93 2.16 OpenP163 J1025 J1027 1612.93 12 130 789.83 2.24 2.64 1.64 OpenP164 J1026 J1027 564.27 6 130 -66.08 0.75 0.27 0.48 OpenP165 J716 J720 423.70 12 130 776.17 2.20 0.67 1.59 OpenP166 J1024 J1023 413.12 10 130 902.03 3.68 2.10 5.09 OpenP167 J1023 J1022 240.98 14 130 711.82 1.48 0.15 0.64 OpenP168 J1022 J1003 2372.01 14 130 858.66 1.79 2.14 0.90 OpenP169 J1003 J1002.1 1926.70 12 130 499.80 1.42 1.35 0.70 Open
P169C J1002.1 J1002.2 1296.31 6 130 24.51 0.28 0.10 0.08 OpenP17 J555 J1123 4963.51 6 130 -193.73 2.20 17.62 3.55 Open
P170 J1002.1 J1002 1148.46 12 130 458.50 1.30 0.69 0.60 OpenP171 J1002 J1001 3089.69 12 130 462.99 1.31 1.88 0.61 Open
P171.01 J1002 J1002.001 345.09 10 130 -60.27 0.25 0.01 0.03 OpenP171.02 J1002.001 J1002.004 562.37 10 130 -237.58 0.97 0.24 0.43 OpenP171.05 J1002.004 J1002.005 517.41 10 130 -317.51 1.30 0.38 0.74 OpenP171.07 J1002.005 J1002.007 124.63 10 130 -321.23 1.31 0.09 0.75 OpenP171.08 J1002.007 J1004 365.77 10 130 -427.35 1.75 0.47 1.28 OpenP171.09 J1002.007 J1002.010 571.03 6 130 103.07 1.17 0.63 1.10 OpenP171.10 J1002.010 J1002.004 272.50 6 130 -72.17 0.82 0.16 0.57 OpenP171.11 J1002.010 J1002.014 909.45 6 130 71.81 0.81 0.51 0.56 OpenP171.12 J1002.014 J1002.016 156.33 8 130 -91.85 0.59 0.03 0.22 Open

Appendix D 5 of 34
IDFrom Node To Node
Length (ft)
Dia (in)
Rough-ness
Flow (gpm)
Velocity (ft/s)
Headloss (ft)
HL/1000 (ft/k-ft) Status
Buildout PHD Pipe Report
P171.13 J1002.016 J1002.001 587.20 8 130 -167.69 1.07 0.39 0.67 OpenP171.14 J1002.016 J1002.019 576.20 8 130 60.42 0.39 0.06 0.10 Open
P173 J1004 J1003 993.12 10 130 -343.11 1.40 0.84 0.85 OpenP174 J1005 J1004 194.86 10 130 88.72 0.36 0.01 0.07 OpenP175 J717 J1005 850.35 10 130 182.97 0.75 0.23 0.27 OpenP176 J1008 J719 267.12 10 130 342.06 1.40 0.23 0.84 OpenP177 J1021 J1008 691.35 10 130 381.69 1.56 0.72 1.04 OpenP178 J1008 J1009 1265.90 6 130 36.59 0.42 0.21 0.16 OpenP179 J1009 J1010 1321.22 6 130 24.26 0.28 0.10 0.08 OpenP18 J1108 J1109 966.91 12 130 932.25 2.64 2.15 2.23 Open
P180 J1019 J1010 602.06 8 130 128.85 0.82 0.25 0.41 OpenP181 J12 J14 789.76 8 100 -21.66 0.14 0.02 0.02 OpenP182 J1021 J1020 341.43 12 130 547.16 1.55 0.28 0.83 OpenP183 J1020 J1019 243.03 12 130 883.87 2.51 0.49 2.02 OpenP184 J1020 J1143 437.45 8 130 -338.65 2.16 1.08 2.46 OpenP185 J1028 J1143 495.67 12 130 458.22 1.30 0.30 0.60 OpenP186 J1028 J1029 456.28 8 130 248.78 1.59 0.63 1.39 OpenP187 J1029 J1030 457.35 6 130 164.06 1.86 1.19 2.61 OpenP188 J1030 J1051 1062.92 6 130 64.04 0.73 0.49 0.46 OpenP189 J1030 J1017 1470.69 6 130 88.96 1.01 1.23 0.84 OpenP19 J1122 J552 2319.87 6 130 344.29 3.91 23.88 10.29 Open
P190 J1017 J1016 1428.16 6 130 75.60 0.86 0.89 0.62 OpenP191 J1016 J1015 254.47 6 130 12.15 0.14 0.01 0.02 OpenP192 J1144 J1015 1422.64 8 130 161.97 1.03 0.89 0.63 OpenP193 J1144 J1017 254.37 6 130 -0.88 0.01 0.00 0.00 OpenP194 J1018 J1144 499.09 6 130 178.78 2.03 1.53 3.06 OpenP195 J1029 J1018 1357.62 6 130 78.37 0.89 0.90 0.66 OpenP196 J1143 J1018 957.50 6 130 112.37 1.28 1.24 1.29 OpenP197 J1019 J1012 1518.12 12 130 749.17 2.13 2.25 1.48 OpenP198 J1011 J1012 620.75 8 130 21.97 0.14 0.01 0.02 OpenP199 J1010 J710 743.20 6 130 144.85 1.64 1.54 2.07 OpenP20 J1107 J1108 797.58 8 130 460.06 2.94 3.46 4.34 Open
P200 J2055 J2004 549.27 8 130 0.00 0.00 0.00 0.00 ClosedP2004 J801 J5008 615.77 12 130 1541.58 4.37 3.48 5.65 OpenP201 J14 J10 1262.49 8 100 -88.89 0.57 0.42 0.34 OpenP202 J5004 J2001 4409.17 6 130 0.00 0.00 0.00 0.00 ClosedP203 J2001 J2002 764.27 6 130 -273.29 3.10 5.13 6.71 OpenP204 J2002 J2003 375.28 14 130 2133.91 4.45 1.83 4.87 OpenP205 J4006 J2008 1584.42 6 130 -25.98 0.29 0.14 0.09 OpenP206 J2001 J425 1244.92 6 130 228.36 2.59 5.99 4.81 OpenP207 J2003 J2004.1 1867.64 12 130 1874.21 5.32 15.15 8.11 OpenP208 J2004 J2006 1545.67 12 130 1845.17 5.23 12.18 7.88 OpenP209 J2005 J2006 998.39 6 130 -90.24 1.02 0.86 0.86 OpenP21 J4001 J1122 564.39 6 130 -6.69 0.08 0.00 0.01 Open

Appendix D 6 of 34
IDFrom Node To Node
Length (ft)
Dia (in)
Rough-ness
Flow (gpm)
Velocity (ft/s)
Headloss (ft)
HL/1000 (ft/k-ft) Status
Buildout PHD Pipe Report
P210 J2005 J2007 1649.87 6 130 194.92 2.21 5.92 3.59 OpenP211 J2006 J2007 445.94 8 130 905.87 5.78 6.78 15.21 Open
P2113 J512 J2022 1953.26 6 130 -25.66 0.29 0.16 0.08 OpenP213 J409 J86 1331.42 6 130 -134.38 1.52 2.40 1.80 OpenP215 J30 J677 1482.51 6 140 98.98 1.12 1.32 0.89 OpenP217 J2022 J2021 742.22 6 130 -217.68 2.47 3.27 4.40 OpenP218 J2022 J2024 2347.52 6 130 171.86 1.95 6.67 2.84 OpenP22 J1122 J508 3762.35 6 130 -420.39 4.77 56.07 14.90 Open
P220 J2025 J2026 1659.04 6 130 194.60 2.21 5.94 3.58 OpenP221 J2026 J2027 674.06 6 130 54.67 0.62 0.23 0.34 OpenP222 J2028 J2027 638.63 6 130 110.72 1.26 0.80 1.26 OpenP223 J2025 J2037 931.36 6 130 280.79 3.19 6.57 7.06 OpenP224 J2026 J2037 2410.11 8 130 101.44 0.65 0.64 0.26 OpenP225 J2037 J2039 1440.76 8 130 105.88 0.68 0.41 0.29 OpenP226 J2039 9997 4608.25 6 130 2.48 0.03 0.01 0.00 OpenP227 J2040 J2041 2583.70 6 130 97.59 1.11 2.58 1.00 OpenP228 J2038 9993 922.24 6 130 221.74 2.52 4.20 4.56 OpenP229 J2037 J2038 642.78 6 130 246.26 2.79 3.56 5.53 OpenP23 J1106 J1107 528.53 8 130 472.15 3.01 2.40 4.55 Open
P230 J522 J2038 2293.56 6 130 -15.05 0.17 0.07 0.03 OpenP231 J2033 J2032 855.49 6 130 122.01 1.38 1.29 1.51 OpenP232 J2027 J2033 1738.52 6 130 153.71 1.74 4.02 2.31 OpenP233 J2028 J2032 1108.75 8 130 523.74 3.34 6.11 5.51 OpenP235 J670 J2035 855.54 8 130 233.77 1.49 1.06 1.24 OpenP236 J2034 J2036 2466.79 8 130 282.82 1.81 4.34 1.76 OpenP237 J30 J20 1592.58 8 130 23.82 0.15 0.03 0.02 OpenP238 J2009 J2010 755.02 6 130 235.34 2.67 3.84 5.09 OpenP239 J20 J22 953.18 8 130 61.09 0.39 0.10 0.10 OpenP24 J1105 J1106 597.73 6 130 320.84 3.64 5.40 9.03 Open
P240 J2009 J2011 2358.98 6 130 136.66 1.55 4.39 1.86 OpenP241 J2011 J32 712.88 6 130 149.37 1.69 1.56 2.19 OpenP242 J2008 J2009 959.21 6 130 395.00 4.48 12.74 13.28 OpenP243 J2015 J2014 512.44 8 130 161.37 1.03 0.32 0.62 OpenP244 J2013 J2014 3086.61 8 130 39.96 0.26 0.15 0.05 OpenP245 J2008 J2013 1689.14 6 130 393.01 4.46 22.22 13.15 OpenP246 J2013 J2020 796.68 6 130 330.72 3.75 7.61 9.56 OpenP247 J2021 J2020 597.97 6 130 398.38 4.52 8.07 13.49 OpenP248 J2020 J2019 651.85 6 130 223.34 2.53 3.01 4.62 OpenP249 J2019 J70 713.65 6 130 82.38 0.93 0.52 0.73 OpenP25 J1091 J1105 3333.66 6 130 202.27 2.30 12.82 3.84 Open
P250 J2017 10053 605.82 6 130 6.89 0.08 0.00 0.01 OpenP251 J2016 J2017 533.40 6 130 80.65 0.92 0.37 0.70 OpenP252 J2014 10051 551.80 6 130 193.60 2.20 1.96 3.54 OpenP253 J650 10049 2951.45 6 130 -38.05 0.43 0.51 0.17 Open

Appendix D 7 of 34
IDFrom Node To Node
Length (ft)
Dia (in)
Rough-ness
Flow (gpm)
Velocity (ft/s)
Headloss (ft)
HL/1000 (ft/k-ft) Status
Buildout PHD Pipe Report
P254 J2017 10033 2827.92 6 130 66.32 0.75 1.38 0.49 OpenP255 J2018 10035 1664.19 6 130 59.05 0.67 0.65 0.39 OpenP256 J2019 J2029 1193.72 6 130 121.42 1.38 1.78 1.49 OpenP257 J22 J24 1146.73 6 130 44.36 0.50 0.27 0.23 OpenP258 J2030 J4012 363.81 6 130 20.72 0.24 0.02 0.06 OpenP259 J2036 J688 4332.12 8 130 1.97 0.01 0.00 0.00 OpenP26 J1091 J1142 959.94 12 130 812.08 2.30 1.65 1.72 Open
P260 J2035 J2036 1526.05 8 130 251.17 1.60 2.16 1.41 OpenP261 J2042 J401 2229.77 8 130 70.66 0.45 0.30 0.13 OpenP262 J2043 J2042 583.90 6 130 -22.04 0.25 0.04 0.06 OpenP263 J2044 J406 772.70 6 130 72.09 0.82 0.44 0.57 OpenP264 J2045 J2044 622.28 6 130 -12.15 0.14 0.01 0.02 OpenP265 J408 J2042 1368.21 8 130 111.59 0.71 0.43 0.31 OpenP266 J2048 J2042 576.36 6 130 -4.73 0.05 0.00 0.00 OpenP267 J2047 J4008 779.18 6 130 -5.53 0.06 0.00 0.00 OpenP269 J2049 J4008 1617.60 6 130 23.45 0.27 0.11 0.07 OpenP27 J1142 J1104 1951.36 6 130 235.10 2.67 9.91 5.08 Open
P270 J2049 J2052 453.94 6 130 -94.09 1.07 0.42 0.93 OpenP271 J2050 J481 964.27 6 130 -23.17 0.26 0.07 0.07 OpenP272 J4016 J2050 1019.88 6 130 0.00 0.00 0.00 0.00 ClosedP273 J2047 J4016 544.77 6 130 9.27 0.11 0.01 0.01 OpenP274 J408 J2046 518.42 6 130 3.84 0.04 0.00 0.00 OpenP275 J400 J2045 1385.15 8 130 125.73 0.80 0.54 0.39 OpenP276 J4010 J2050 739.49 6 130 -7.13 0.08 0.01 0.01 OpenP277 J2052 J4015 1816.14 6 130 -248.93 2.82 10.25 5.65 OpenP278 J1078 J2054 2862.03 10 130 397.00 1.62 3.19 1.11 OpenP279 J20 J26 1270.64 8 130 -72.86 0.47 0.18 0.14 OpenP28 J1142 J1103 1642.66 8 130 533.06 3.40 9.36 5.70 Open
P280 J2020 J605 1278.03 8 130 494.97 3.16 6.35 4.97 OpenP281 J605 J2028 261.45 8 130 643.87 4.11 2.11 8.08 OpenP282 J424 J2002 229.00 14 130 2432.83 5.07 1.42 6.21 OpenP283 J26 J28 679.78 6 130 28.94 0.33 0.07 0.10 OpenP285 J1031 J1115 1172.94 6 130 85.34 0.97 0.91 0.78 OpenP287 J26 J601 1561.24 8 130 -121.85 0.78 0.58 0.37 OpenP289 J32 J2012 2035.94 6 130 101.45 1.15 2.18 1.07 OpenP29 J1104 J1105 567.49 6 130 149.71 1.70 1.25 2.20 Open
P291 J32 J22 2724.41 6 130 19.11 0.22 0.13 0.05 OpenP293 J34 J678 1566.15 6 130 35.56 0.40 0.24 0.15 OpenP295 J34 J36 533.74 2 130 35.10 3.58 16.88 31.63 OpenP297 J1002.014 J38 677.35 8 130 158.26 1.01 0.41 0.60 OpenP299 J38 J40 609.25 8 130 -23.31 0.15 0.01 0.02 OpenP30 J1103 J1104 540.92 6 130 98.97 1.12 0.55 1.02 Open
P300 J1012 J1013 495.29 12 130 760.37 2.16 0.76 1.53 OpenP301 J1015 J1013 332.36 6 130 169.13 1.92 0.92 2.76 Open

Appendix D 8 of 34
IDFrom Node To Node
Length (ft)
Dia (in)
Rough-ness
Flow (gpm)
Velocity (ft/s)
Headloss (ft)
HL/1000 (ft/k-ft) Status
Buildout PHD Pipe Report
P302 J1147 J723 1435.34 16 130 906.38 1.45 0.75 0.52 OpenP303 J723 T3 882.31 12 130 656.12 1.86 1.02 1.16 OpenP304 J1145 J723 3077.81 16 130 -214.57 0.34 0.11 0.04 OpenP305 J1006 J1145 3069.48 8 130 161.85 1.03 1.92 0.63 OpenP306 J1146 J1145 1241.63 12 130 -275.54 0.78 0.29 0.23 OpenP307 J1134 J1146 1108.54 12 130 -218.60 0.62 0.17 0.15 OpenP308 T4 J1134 231.53 12 130 -397.49 1.13 0.11 0.46 OpenP309 J1001 J1134 6572.51 12 130 198.62 0.56 0.83 0.13 OpenP31 J1104 J1106 2444.78 6 130 167.80 1.90 6.65 2.72 Open
P310 J1005 J1006 1947.97 6 130 86.23 0.98 1.54 0.79 OpenP311 J1007 J1006 1542.38 6 130 116.90 1.33 2.15 1.39 OpenP312 J1013 J1147 1116.89 16 130 922.78 1.47 0.60 0.54 OpenP313 J1023 J705 1528.40 6 130 16.93 0.19 0.06 0.04 OpenP314 J712 J1022 649.79 6 130 167.42 1.90 1.76 2.71 OpenP315 J1027 J1028 483.15 12 130 713.80 2.02 0.66 1.36 OpenP316 J1035 J1034 376.78 6 130 228.43 2.59 1.81 4.82 OpenP317 J1120 J1043 447.59 6 130 218.42 2.48 1.98 4.43 OpenP318 J2012 J2015 1763.11 8 130 167.56 1.07 1.18 0.67 OpenP319 J1144 J707 475.56 6 130 11.02 0.13 0.01 0.02 OpenP32 J1103 J1141 454.78 8 130 399.81 2.55 1.52 3.34 Open
P321 J40 J42 120.91 6 130 7.80 0.09 0.00 0.01 OpenP323 J40 J44 773.41 8 130 -35.78 0.23 0.03 0.04 OpenP325 J44 J46 208.71 8 130 -69.83 0.45 0.03 0.13 OpenP327 J46 J48 132.42 8 130 11.37 0.07 0.00 0.00 OpenP329 J46 J50 194.45 8 130 -82.40 0.53 0.03 0.18 OpenP33 J1141 J1102 1255.54 8 130 363.28 2.32 3.52 2.80 Open
P331 J50 J52 141.54 6 130 13.70 0.16 0.00 0.03 OpenP333 J52 J54 147.78 6 130 4.85 0.06 0.00 0.00 OpenP335 J52 J56 408.35 6 130 7.25 0.08 0.00 0.01 OpenP337 J50 J1002.010 802.07 6 130 -98.81 1.12 0.82 1.02 OpenP339 J430 J10 1211.84 10 130 -26.11 0.11 0.01 0.01 OpenP34 J1102 J1108 1583.40 8 130 500.61 3.20 8.03 5.07 Open
P341 J427 U7000 84.05 6 100 401.82 4.56 1.87 22.28 OpenP343 U7000 J58 32.26 6 100 401.82 4.56 0.72 22.28 OpenP345 J58 J1130 50.61 6 130 396.92 4.50 0.68 13.40 OpenP347 J111 U7006 52.99 8 130 724.16 4.62 0.53 10.05 OpenP349 U7006 J64 43.83 8 130.00 724.16 4.62 0.44 10.05 OpenP35 J1101 J1102 597.56 6 130 165.04 1.87 1.58 2.64 Open
P351 J64 J119 75.63 8 130 723.00 4.61 0.76 10.02 OpenP353 J111 U7002 63.58 10 130 947.67 3.87 0.35 5.58 OpenP355 U7002 J60 24.56 10 130 947.67 3.87 0.14 5.58 OpenP357 J60 J701 45.14 10 130 947.60 3.87 0.25 5.58 OpenP359 J111 U7004 84.11 10 130 930.63 3.80 0.45 5.39 OpenP36 J1099 J1101 897.75 6 130 93.17 1.06 0.82 0.91 Open

Appendix D 9 of 34
IDFrom Node To Node
Length (ft)
Dia (in)
Rough-ness
Flow (gpm)
Velocity (ft/s)
Headloss (ft)
HL/1000 (ft/k-ft) Status
Buildout PHD Pipe Report
P361 U7004 J62 25.68 10 130 930.63 3.80 0.14 5.39 OpenP363 J62 J701 63.81 10 130 929.27 3.80 0.34 5.38 OpenP365 J66 J701 28.48 10 150 899.22 3.67 0.11 3.88 OpenP367 416 J4016 52.01 6 130 0.00 0.00 0.00 0.00 OpenP37 J1100 J1101 1697.65 6 130 94.40 1.07 1.59 0.94 Open
P373 J70 J2018 499.70 6 130 60.37 0.69 0.20 0.41 OpenP375 J70 J72 620.78 4 130 9.36 0.24 0.06 0.09 OpenP377 J1139 J463 555.13 10 130 -22.28 0.09 0.00 0.01 OpenP379 J1137 J460 801.05 10 130 0.00 0.00 0.00 0.00 ClosedP38 J1100 J1099 2081.84 6 130 57.13 0.65 0.77 0.37 Open
P381 J74 J1139 509.09 6 130 -4.33 0.05 0.00 0.00 OpenP383 J76 V8002 47.47 6 130 0.00 0.00 0.00 0.00 OpenP385 V8002 J74 32.39 6 130 0.00 0.00 0.00 0.00 OpenP387 J2006 J2008 537.89 12 130 834.98 2.37 0.98 1.81 OpenP389 J1090 V8004 12.46 8 130 561.70 3.59 0.08 6.27 OpenP39 J1098 J1099 3565.79 6 130 88.54 1.00 2.97 0.83 Open
P391 J78 J508 427.81 8 130 561.69 3.59 2.69 6.28 OpenP393 V8004 J78 12.84 8 130 561.69 3.59 0.08 6.28 OpenP395 J84 J555 467.52 6 130 -118.97 1.35 0.67 1.44 OpenP397 J84 J18 1829.60 8 130 334.06 2.13 4.39 2.40 OpenP40 J1110 J1141 425.03 6 130 -23.80 0.27 0.03 0.07 Open
P400 J406 J403 330.66 6 130 53.54 0.61 0.11 0.33 OpenP401 J403 J405 822.58 6 130 40.86 0.46 0.16 0.20 OpenP402 J404 J1133 433.55 12 130 802.82 2.28 0.73 1.69 OpenP403 J436 J437 953.44 6 130 53.54 0.61 0.31 0.33 OpenP404 J2007 J438 682.43 10 130 1083.48 4.43 4.88 7.15 OpenP405 J438 J80 1690.34 8 130 324.40 2.07 3.84 2.27 OpenP406 J2054 J400 319.24 8 130 145.18 0.93 0.16 0.51 OpenP407 J401 J2055 750.52 8 130 2.84 0.02 0.00 0.00 OpenP408 J401 J402 1403.49 6 130 28.75 0.33 0.15 0.10 OpenP409 J406 J407 324.18 6 130 11.17 0.13 0.01 0.02 OpenP41 J1110 J1100 95.56 6 130 187.02 2.12 0.32 3.33 Open
P410 J403 J2043 533.54 6 130 6.26 0.07 0.00 0.01 OpenP411 J2047 J434 1130.43 6 130 -19.31 0.22 0.06 0.05 OpenP412 J2045 J408 190.70 8 130 121.93 0.78 0.07 0.37 OpenP413 J2044 J409 331.67 6 130 -103.74 1.18 0.37 1.12 OpenP414 J1076 J410 586.20 6 130 12.65 0.14 0.01 0.02 OpenP415 J88 J18 1322.13 6 130 -235.03 2.67 6.71 5.08 OpenP416 J1138 J411 1801.65 6 130 70.94 0.80 0.99 0.55 OpenP417 J1111 J412 671.15 6 130 18.83 0.21 0.03 0.05 OpenP418 J1050 J423 728.22 6 130 6.63 0.08 0.00 0.01 OpenP419 J1058 J413 545.51 6 130 9.56 0.11 0.01 0.01 OpenP42 J1113 J1110 552.47 6 130 168.50 1.91 1.51 2.74 Open
P420 J414 J1048 487.29 16 130 2557.61 4.08 1.73 3.55 Open

Appendix D 10 of 34
IDFrom Node To Node
Length (ft)
Dia (in)
Rough-ness
Flow (gpm)
Velocity (ft/s)
Headloss (ft)
HL/1000 (ft/k-ft) Status
Buildout PHD Pipe Report
P421 J414 J415 565.33 6 130 8.61 0.10 0.01 0.01 OpenP422 J1033 J416 601.05 8 130 8.49 0.05 0.00 0.00 OpenP423 J417 J1045 168.91 8 130 691.43 4.41 1.56 9.22 OpenP424 J1067 J418 1141.52 6 130 19.65 0.22 0.06 0.05 OpenP425 J1080 J419 850.07 6 130 12.11 0.14 0.02 0.02 OpenP426 J4003 J421 1628.55 6 130 51.96 0.59 0.51 0.31 OpenP427 J436 J422 1736.24 6 130 83.27 0.94 1.29 0.74 OpenP428 J2003 J436 553.06 6 130 246.11 2.79 3.06 5.53 OpenP429 J425 J2005.1 2151.61 6 130 156.55 1.78 5.15 2.39 OpenP43 J1113 J1103 411.14 6 130 -26.89 0.31 0.04 0.09 Open
P430 J427 J426 888.78 6 130 15.15 0.17 0.03 0.03 OpenP431 J1129 J427 293.85 14 130 1818.65 3.79 1.06 3.62 OpenP432 J428 J1128 217.61 12 130 1463.69 4.15 1.12 5.13 OpenP433 J428 J429 797.16 6 130 25.93 0.29 0.07 0.09 OpenP434 J1120 V8022 33.38 6 130 0.00 0.00 0.00 0.00 ClosedP435 J431 J1148 235.15 18 130 3444.98 4.34 0.82 3.48 OpenP436 J431 J439 673.08 6 130 9.01 0.10 0.01 0.01 OpenP437 T1 J431 543.85 18 130 3457.50 4.36 1.90 3.50 OpenP438 J1053 J94 80.09 6 130 8.73 0.10 0.00 0.01 OpenP439 J1034 J435 820.31 6 130 8.34 0.09 0.01 0.01 OpenP44 J1098 J1113 174.76 6 130 145.75 1.65 0.37 2.10 Open
P441 J82 J440 614.31 6 130 284.14 3.22 4.43 7.21 OpenP442 J80 J442 310.22 6 130 23.82 0.27 0.02 0.07 OpenP447 J88 V8008 25.69 6 130 235.03 2.67 0.13 5.08 OpenP449 V8008 J86 24.37 6 130 235.03 2.67 0.12 5.08 OpenP45 J1097 J1098 534.80 6 130 250.70 2.84 3.06 5.72 OpenP46 J1096 10001 4311.06 6 130 38.72 0.44 0.78 0.18 Open
P460 J461 J466 686.64 6 130 21.86 0.25 0.04 0.06 OpenP461 J463 J464 141.33 6 130 -31.59 0.36 0.02 0.12 OpenP463 J464 J461 485.54 8 130 40.45 0.26 0.02 0.05 OpenP467 J621 V8012 84.47 12 130 0.00 0.00 0.00 0.00 OpenP469 V8012 J433 80.64 12 130 0.00 0.00 0.00 0.00 OpenP47 J1096 J1097 623.01 6 130 259.49 2.94 3.80 6.10 Open
P471 J427 U7008 63.95 10 130 733.12 2.99 0.22 3.47 OpenP475 J427 U7010 80.26 10 130 261.72 1.07 0.04 0.51 OpenP477 U7008 J1130 80.38 10 130 733.12 2.99 0.28 3.47 OpenP479 U7010 J1130 93.95 10 130 261.72 1.07 0.05 0.51 OpenP48 J1095 J1096 658.98 6 130 306.36 3.48 5.47 8.29 Open
P480 J2052 J480 120.71 6 130 151.76 1.72 0.27 2.26 OpenP481 J481 J2049 107.94 6 130 -59.46 0.67 0.04 0.40 OpenP483 J434 J4009 78.03 6 130 -32.70 0.37 0.01 0.13 OpenP485 J4009 J481 70.43 6 130 -33.04 0.37 0.01 0.13 OpenP487 J2024 J2025 709.31 10 130 502.20 2.05 1.22 1.72 OpenP489 J438 J612 668.64 8 130 739.73 4.72 6.99 10.45 Open

Appendix D 11 of 34
IDFrom Node To Node
Length (ft)
Dia (in)
Rough-ness
Flow (gpm)
Velocity (ft/s)
Headloss (ft)
HL/1000 (ft/k-ft) Status
Buildout PHD Pipe Report
P49 J1092 J1095 778.25 6 130 53.91 0.61 0.26 0.33 OpenP491 J1051 V8014 61.68 6 130 0.00 0.00 0.00 0.00 OpenP493 V8014 J423 79.50 6 130 0.00 0.00 0.00 0.00 OpenP495 J94 J433 131.31 6 130 3.17 0.04 0.00 0.00 OpenP497 J1130 J5010 664.90 14 130 1787.13 3.72 2.33 3.51 OpenP499 J1063 J119 3404.65 14 130 -2229.67 4.65 17.98 5.28 OpenP50 J1094 J1095 940.31 6 130 264.43 3.00 5.94 6.31 Open
P500 J1109 J502 661.16 6 130 266.25 3.02 4.23 6.39 OpenP501 J1088 J420 396.81 6 130 10.88 0.12 0.01 0.02 OpenP502 J1061 J503 640.99 12 130 9.43 0.03 0.00 0.00 OpenP503 J509 J504 717.91 6 130 34.16 0.39 0.10 0.14 OpenP504 J1109 J509 661.71 12 130 651.62 1.85 0.76 1.15 OpenP505 J1116 J505 303.21 6 130 29.52 0.34 0.03 0.11 OpenP506 J1121 J506 386.95 6 130 61.75 0.70 0.17 0.43 OpenP507 J1114 J507 138.91 14 130 2674.22 5.57 1.03 7.40 OpenP508 J1118 J4004 617.46 14 130 2486.13 5.18 3.99 6.46 OpenP509 J509 J1112 644.14 12 130 602.53 1.71 0.64 0.99 OpenP51 J1094 J1093 1011.02 6 130 -13.41 0.15 0.03 0.03 Open
P510 J501 J119 50.42 8 130 754.23 4.81 0.55 10.83 OpenP511 J500 J119 37.77 8 130 754.48 4.82 0.41 10.84 OpenP512 J510 J512 119.98 6 130 338.40 3.84 1.20 9.97 OpenP514 J514 J510 290.69 6 130 245.07 2.78 1.59 5.49 OpenP519 J98 J12 869.73 8 130 0.00 0.00 0.00 0.00 OpenP52 J1093 J1092 847.71 6 130 273.67 3.11 5.70 6.73 Open
P523 J98 V8020 36.61 8 130 0.00 0.00 0.00 0.00 OpenP525 V8020 J16 38.91 8 130 0.00 0.00 0.00 0.00 OpenP527 J100 J430 297.30 6 130 0.00 0.00 0.00 0.00 OpenP529 V8022 J100 33.40 6 130 0.00 0.00 0.00 0.00 OpenP53 J1092 J1091 461.51 6 130 209.76 2.38 1.90 4.11 Open
P535 J38 J102 1084.53 12 100 166.32 0.47 0.16 0.15 OpenP537 J102 J104 880.61 12 100 69.35 0.20 0.03 0.03 OpenP54 J1089 J1091 353.44 12 130 818.36 2.32 0.62 1.75 OpenP55 J1089 J1090 1369.44 8 130 593.60 3.79 9.52 6.95 Open
P550 J508 J1124 495.27 6 130 128.18 1.45 0.82 1.65 OpenP551 J1124 J550 1322.00 6 130 81.96 0.93 0.95 0.72 OpenP552 J552 J553 725.07 4 130 41.60 1.06 1.07 1.48 OpenP553 J1123 J554 273.23 6 130 19.21 0.22 0.01 0.05 OpenP554 J4002 J84 677.84 6 130 240.74 2.73 3.60 5.31 OpenP555 J1124 J551 855.40 6 130 15.91 0.18 0.03 0.03 OpenP556 J552 J1123 638.41 6 130 234.43 2.66 3.23 5.05 OpenP56 J1087 J1089 616.38 12 130 1421.98 4.03 3.00 4.86 OpenP57 J1082 J1094 732.59 6 130 270.84 3.07 4.84 6.60 OpenP58 J1082 J1083 1542.95 6 130 -112.85 1.28 2.01 1.30 OpenP59 J1081 J1082 1156.00 6 130 206.07 2.34 4.60 3.98 Open

Appendix D 12 of 34
IDFrom Node To Node
Length (ft)
Dia (in)
Rough-ness
Flow (gpm)
Velocity (ft/s)
Headloss (ft)
HL/1000 (ft/k-ft) Status
Buildout PHD Pipe Report
P60 J1061 10011 1432.23 6 130 -32.81 0.37 0.19 0.13 OpenP600 J510 J2021 2229.59 6 130 -97.92 1.11 2.24 1.00 OpenP601 J600 J4006 57.61 6 130 -10.63 0.12 0.00 0.02 OpenP602 J80 J611 722.67 6 130 2.45 0.03 0.00 0.00 OpenP603 J512 J2024 597.50 6 130 355.00 4.03 6.51 10.90 OpenP604 J2021 J612 403.43 8 130 -728.04 4.65 4.09 10.15 OpenP61 J1062 10013 1017.36 12 130 2.63 0.01 0.00 0.00 Open
P618 J601 J2010 613.73 6 130 -151.58 1.72 1.38 2.25 OpenP619 J2029 J605 635.48 6 130 158.37 1.80 1.55 2.44 OpenP62 J1062 J1081 1827.24 6 130 265.76 3.02 11.65 6.37 Open
P621 J2010 J2011 1781.01 6 130 51.58 0.59 0.55 0.31 OpenP63 J1063 J1062 869.20 12 130 279.46 0.79 0.21 0.24 Open
P635 J2032 J4011 747.04 8 130 628.86 4.01 5.78 7.74 OpenP64 J1063 J1084 1491.26 12 130 1666.40 4.73 9.73 6.53 Open
P643 J2033 J522 258.40 6 130 21.23 0.24 0.02 0.06 OpenP646 J522A J607 501.53 6 130 15.95 0.18 0.02 0.03 OpenP65 J1084 J1083 307.16 6 130 426.86 4.84 4.71 15.33 Open
P650 J650 J651 485.93 6 130 31.45 0.36 0.06 0.12 OpenP651 J2031 J650 821.85 6 130 2.16 0.02 0.00 0.00 OpenP653 J609 J606 1838.81 6 130 26.13 0.30 0.16 0.09 Open
P654A J606A J604 424.98 6 130 8.96 0.10 0.01 0.01 OpenP655 J609 J2040 856.84 6 130 140.27 1.59 1.67 1.95 OpenP659 J2041A J603 926.61 6 130 11.72 0.13 0.02 0.02 OpenP66 J1083 J1093 843.54 6 130 302.25 3.43 6.82 8.09 Open
P661 J608 J2039 960.75 10 130 -92.11 0.38 0.07 0.07 OpenP67 J1084 J1085 253.98 10 130 1226.65 5.01 2.28 8.99 Open
P670 J680 J682 1703.96 8 130 139.17 0.89 0.81 0.47 OpenP671 J682 J683 2192.14 6 130 53.50 0.61 0.72 0.33 OpenP672 J682 J684 688.13 8 130 32.43 0.21 0.02 0.03 OpenP673 J679 J680 1282.58 8 130 262.35 1.67 1.97 1.53 OpenP674 J2036 J679 5024.95 8 130 451.11 2.88 21.01 4.18 OpenP675 J679 J34 1224.38 6 130 108.33 1.23 1.48 1.21 OpenP676 J680 J681 2108.79 6 130 65.84 0.75 1.01 0.48 OpenP677 J670 J687 719.92 6 130 78.74 0.89 0.48 0.67 OpenP678 J2034 J670 489.44 8 130 327.04 2.09 1.13 2.31 OpenP679 J687 J671 311.30 6 130 71.12 0.81 0.17 0.55 OpenP68 J1085 J1086 1073.79 10 130 1208.14 4.94 9.39 8.74 Open
P680 J671 J672 273.32 6 130 11.69 0.13 0.01 0.02 OpenP681 J671 J673 265.79 6 130 56.82 0.64 0.10 0.37 OpenP682 J673 J674 276.75 6 130 8.21 0.09 0.00 0.01 OpenP684 J2035 J675 1358.92 6 130 -37.60 0.43 0.23 0.17 OpenP685 J675 J676 265.47 6 130 1.76 0.02 0.00 0.00 OpenP686 J2012 J677 1047.71 6 130 -87.46 0.99 0.85 0.81 OpenP687 J673 J675 303.50 6 130 46.03 0.52 0.08 0.25 Open

Appendix D 13 of 34
IDFrom Node To Node
Length (ft)
Dia (in)
Rough-ness
Flow (gpm)
Velocity (ft/s)
Headloss (ft)
HL/1000 (ft/k-ft) Status
Buildout PHD Pipe Report
P69 J1086 J1087 452.27 10 130 1189.91 4.86 3.84 8.50 OpenP70 J1088 J1087 418.97 6 130 239.32 2.72 2.20 5.25 Open
P700 J702 J700 911.02 6 130 39.68 0.45 0.17 0.19 OpenP701 J703 J700 1270.27 6 130 42.80 0.49 0.28 0.22 OpenP702 J710 J711 446.90 6 130 8.47 0.10 0.00 0.01 OpenP703 J702 J715 220.69 6 130 8.18 0.09 0.00 0.01 OpenP704 J703 J702 297.09 6 130 55.37 0.63 0.10 0.35 OpenP705 J1147 J704 352.82 6 130 5.04 0.06 0.00 0.00 OpenP706 J1011 J703 595.47 6 130 103.94 1.18 0.67 1.12 OpenP707 J710 J1011 266.76 6 130 130.83 1.48 0.46 1.72 OpenP708 J1016 J731 188.11 6 130 43.13 0.49 0.04 0.22 OpenP709 J1016 J706 548.45 6 130 16.95 0.19 0.02 0.04 OpenP71 J1063 J1088 3738.36 6 130 261.05 2.96 23.05 6.17 Open
P710 J1051 J708 363.82 6 130 8.98 0.10 0.00 0.01 OpenP711 J1052 J709 863.34 8 130 31.37 0.20 0.03 0.03 OpenP712 J712 J713 166.67 6 130 2.26 0.03 0.00 0.00 OpenP713 J700 J714 249.08 6 130 45.01 0.51 0.06 0.24 OpenP714 J1024 J716 414.90 12 130 880.67 2.50 0.83 2.00 OpenP715 J718 J717 948.55 6 130 30.40 0.34 0.11 0.11 OpenP716 J718 J717 505.44 10 130 163.68 0.67 0.11 0.22 OpenP717 J1007 J718 818.67 10 130 205.50 0.84 0.27 0.33 OpenP718 J719 J1007 341.91 10 130 302.26 1.23 0.23 0.67 OpenP719 J719 J1007 1725.47 6 130 32.91 0.37 0.23 0.13 OpenP720 J716 J720 646.73 6 130 99.78 1.13 0.67 1.04 OpenP721 J720 J1026 243.66 12 130 870.47 2.47 0.48 1.96 OpenP722 J1026 J1021 659.45 12 130 933.39 2.65 1.47 2.23 OpenP723 J1024 J712 174.91 6 130 171.69 1.95 0.50 2.84 OpenP724 J728 J727 270.52 8 130 9.60 0.06 0.00 0.00 OpenP725 J727 J726 226.77 8 130 5.58 0.04 0.00 0.00 OpenP726 J727 J725 198.89 8 130 1.96 0.01 0.00 0.00 OpenP727 J724 J728 124.84 8 130 20.23 0.13 0.00 0.01 OpenP728 J728 J729 135.77 6 130 9.58 0.11 0.00 0.01 OpenP729 T3 J730 425.80 8 130 48.80 0.31 0.03 0.07 OpenP73 J1064 J1065 2411.03 8 130 304.39 1.94 4.87 2.02 Open
P730 J730 J724 1310.21 8 130 10.90 0.07 0.01 0.00 OpenP731 J730 J724 659.73 8 130 15.78 0.10 0.01 0.01 OpenP732 J701 J1031 227.31 18 130 2775.26 3.50 0.53 2.33 OpenP74 J1048 J1049 427.19 16 130 2247.95 3.59 1.20 2.80 OpenP75 J1049 J1047 621.58 12 130 1899.33 5.39 5.17 8.32 OpenP76 J1047 J1065 2276.96 8 130 -30.22 0.19 0.06 0.03 OpenP77 J1065 J1066 624.38 8 130 240.34 1.53 0.81 1.30 OpenP78 J1066 J1080 2441.09 8 130 59.45 0.38 0.24 0.10 OpenP79 J1080 J1067 1583.37 6 130 17.33 0.20 0.06 0.04 OpenP80 J1066 J1067 474.45 8 130 163.69 1.04 0.30 0.64 Open

Appendix D 14 of 34
IDFrom Node To Node
Length (ft)
Dia (in)
Rough-ness
Flow (gpm)
Velocity (ft/s)
Headloss (ft)
HL/1000 (ft/k-ft) Status
Buildout PHD Pipe Report
P800 J1131 J800 1209.62 6 130 69.89 0.79 0.65 0.54 OpenP801 J801 J802 787.58 6 130 23.24 0.26 0.06 0.07 OpenP802 J1131 J801 649.01 12 130 1576.70 4.47 3.82 5.89 OpenP81 J1067 J1046 2258.24 6 130 142.19 1.61 4.52 2.00 OpenP82 J1046 J1111 482.27 14 130 2490.58 5.19 3.13 6.48 OpenP83 J1047 J1046 941.96 14 130 2370.62 4.94 5.57 5.92 OpenP84 J1049 J1064 784.28 12 130 318.49 0.90 0.24 0.30 OpenP85 J1045 J1036 1056.96 6 130 230.60 2.62 5.18 4.90 OpenP86 J1045 J1047 457.49 8 130 455.27 2.91 1.95 4.25 OpenP87 J1033 J417 655.76 8 130 479.61 3.06 3.07 4.68 OpenP88 J1048 J417 645.75 6 130 218.34 2.48 2.86 4.43 OpenP89 J1148 J414 452.06 16 130 2572.75 4.11 1.62 3.59 OpenP90 J1033 J1035 714.43 6 130 372.02 4.22 8.49 11.88 OpenP91 J1034 J1037 1669.83 6 130 208.24 2.36 6.77 4.06 OpenP92 J1037 J1038 406.67 16 130 3022.19 4.82 1.97 4.84 OpenP93 J1111 J1037 423.37 16 130 2820.20 4.50 1.80 4.26 OpenP94 J1038 J1039 623.39 12 130 556.97 1.58 0.53 0.86 OpenP95 J1038 J1068 2258.09 10 130 754.41 3.08 8.25 3.66 OpenP96 J1068 J1069 2668.39 10 130 729.84 2.98 9.17 3.44 OpenP97 J1069 J1072 2472.44 10 130 527.35 2.15 4.66 1.88 OpenP98 J1069 J1070 317.12 6 130 150.37 1.71 0.70 2.22 OpenP99 J1070 J1071 2368.44 6 130 130.74 1.48 4.06 1.71 Open
P995 J610 J600 337.30 6 130 -10.21 0.12 0.01 0.02 OpenPMP131A1 J1138 J465A 188.11 10 150 37.35 0.15 0.00 0.01 OpenPMP1351 J427 PMP135 1.00 6 150 402.55 4.57 0.01 10.56 OpenPMP1352 PMP135 J1130 1.00 6 150 402.55 4.57 0.01 10.56 Open
PMP21 J111 PMP2 1.00 10 150 899.26 3.67 0.00 3.91 OpenPMP22 PMP2 J66 20.62 10 150 899.26 3.67 0.08 3.88 OpenPMP31 J111 PMP3 1.00 10 150 754.54 3.08 0.00 2.81 OpenPMP32 PMP3 J500 1.00 8 150 754.54 4.82 0.01 8.30 OpenPMP41 J111 PMP4 1.00 8 150 754.31 4.81 0.01 8.30 OpenPMP42 PMP4 J501 1.00 8 150 754.31 4.81 0.01 8.30 OpenPMP61 J123 PMP6 1.00 10 150 1661.16 6.79 0.01 12.08 OpenPMP62 PMP6 J121 1.00 10 150 1661.16 6.79 0.01 12.08 OpenPMP71 J125 PMP7 1.00 10 150 2505.37 10.23 0.03 25.88 OpenPMP72 PMP7 J131 1.00 10 150 2505.37 10.23 0.03 25.88 OpenPMP81 J127 PMP8 1.00 10 150 2478.67 10.13 0.03 25.39 OpenPMP82 PMP8 J133 1.00 10 150 2478.67 10.13 0.03 25.39 Open

Appendix D 15 of 34
ID Demand (gpm) Elevation (ft) Head (ft) Pressure (psi)10001 2.11 727.09 932.06 88.8110003 11.74 727.09 854.02 55.0010005 1.59 706.28 929.03 96.5210007 24.87 706.28 853.72 63.8910009 1.95 607.01 953.65 150.2010011 13.39 607.01 789.33 79.0010013 2.63 671.46 965.32 127.3310015 9.57 671.46 789.14 50.9910017 1.90 352.00 501.66 64.8510019 1.81 350.00 501.68 65.7210021 1.97 340.00 501.69 70.0610023 3.62 337.00 501.71 71.3710025 4.06 327.00 501.78 75.7310027 4.24 319.00 501.81 79.2110029 6.84 329.00 501.91 74.9210031 9.50 344.00 502.07 68.4910033 4.57 334.00 502.32 72.9310035 5.46 400.00 634.51 101.6110037 5.86 398.00 634.29 102.3810039 3.98 403.00 634.22 100.1910041 3.11 404.00 634.15 99.7210043 13.15 310.00 503.53 83.8610045 24.47 276.00 502.45 98.1210047 22.57 257.00 502.20 106.2410049 5.47 276.00 502.13 97.9810051 3.94 330.98 644.42 135.8110053 6.89 392.36 503.69 48.2410055 2.93 409.33 501.64 40.009993 2.31 430.60 621.47 82.719995 13.87 430.60 601.38 74.009997 2.48 481.52 628.82 63.829999 37.76 481.52 593.54 48.54J10 41.86 622.00 831.04 90.58
J100 0.00 0.00 831.03 360.09J1001 264.37 633.86 825.02 82.83J1002 55.78 620.65 826.90 89.37
J1002.001 9.62 617.08 826.91 90.92J1002.004 7.76 615.31 827.16 91.79J1002.005 3.73 612.24 827.54 93.29J1002.007 3.04 614.49 827.63 92.35J1002.010 4.61 620.13 827.00 89.64J1002.014 5.40 624.09 826.49 87.70J1002.016 15.41 620.97 826.52 89.07J1002.019 60.42 624.35 826.46 87.58
J1002.1 16.80 611.77 827.59 93.51
Buildout PHD Node Report

Appendix D 16 of 34
ID Demand (gpm) Elevation (ft) Head (ft) Pressure (psi)Buildout PHD Node Report
J1002.2 24.51 707.26 827.49 52.10J1003 15.75 606.58 828.94 96.35J1004 4.48 611.94 828.10 93.66J1005 8.02 621.81 828.11 89.39J1006 41.29 693.41 826.57 57.70J1007 12.77 614.72 828.71 92.72J1008 3.04 623.18 829.17 89.26J1009 12.33 664.06 828.96 71.45J1010 8.25 670.62 828.86 68.57J1011 4.92 673.77 826.87 66.34J1012 10.77 708.15 826.86 51.44J1013 6.72 715.85 826.10 47.77J1015 4.99 737.58 827.02 38.75J1016 3.36 741.06 827.02 37.25J1017 12.48 662.17 827.91 71.82J1018 11.96 666.78 829.44 70.48J1019 5.86 665.31 829.11 70.98J102 96.97 709.00 825.92 50.66
J1020 1.94 645.73 829.60 79.67J1021 4.54 610.93 829.89 94.87J1022 20.57 608.47 831.08 96.46J1023 16.43 612.59 831.23 94.74J1024 2.74 624.70 833.34 90.40J1025 12.85 630.06 834.27 88.48J1026 3.16 600.02 831.36 100.24J1027 9.95 596.68 831.63 101.80J1028 6.80 605.20 830.97 97.83J1029 6.35 595.68 830.34 101.68J1030 11.06 607.36 829.15 96.10J1031 5.44 726.11 836.65 47.90J1033 8.67 616.66 711.84 41.24J1034 11.86 598.17 701.53 44.79J1035 11.17 577.15 703.35 54.68J1036 10.82 546.80 702.03 67.26J1037 6.25 531.43 694.76 70.77J1038 13.44 507.24 692.79 80.40J1039 19.99 531.50 692.26 69.66J104 69.35 717.00 825.89 47.18
J1040 14.59 605.85 691.81 37.25J1041 25.21 556.73 691.53 58.41J1042 20.45 533.38 691.08 68.33J1043 12.18 559.87 688.05 55.54J1044 20.01 564.85 690.84 54.59J1045 5.57 561.27 707.21 63.23J1046 22.24 515.50 699.69 79.81

Appendix D 17 of 34
ID Demand (gpm) Elevation (ft) Head (ft) Pressure (psi)Buildout PHD Node Report
J1047 14.19 552.19 705.26 66.33J1048 8.17 627.63 711.62 36.39J1049 9.64 598.24 710.43 48.61J1050 16.83 607.94 710.90 44.61J1051 3.81 633.21 828.66 84.69J1052 10.94 619.66 828.50 90.49J1053 5.72 627.26 710.28 35.97J1054 9.23 597.82 710.30 48.74J1056 15.63 613.62 710.39 41.93J1057 9.62 594.57 710.29 50.14J1058 9.71 553.92 710.27 67.75J1060 11.98 578.88 710.37 56.98J1061 13.82 618.39 789.14 73.99J1062 11.08 671.46 965.32 127.33J1063 22.77 670.33 965.52 127.91J1064 14.10 622.17 710.19 38.14J1065 33.84 536.64 705.32 73.09J1066 17.21 521.59 704.51 79.26J1067 19.17 484.65 704.21 95.13J1068 24.57 464.59 684.54 95.30J1069 52.12 425.15 675.36 108.42J1070 19.63 440.14 674.66 101.62J1071 37.11 414.62 670.60 110.92J1072 52.80 433.41 670.71 102.82J1073 19.38 418.51 669.81 108.89J1074 15.22 406.83 669.62 113.87J1075 13.70 402.24 668.17 115.23J1076 11.62 422.93 669.12 106.67J1077 17.59 393.47 667.11 118.57J1078 12.74 381.83 665.62 122.96J1079 68.28 410.28 665.64 110.65J1080 30.01 550.41 704.27 66.67J1081 11.53 607.01 953.67 150.21J1082 48.08 631.17 949.07 137.75J1083 11.76 710.77 951.08 104.13J1084 12.89 718.31 955.79 102.90J1085 18.51 707.72 953.51 106.50J1086 18.23 740.40 944.12 88.27J1087 7.25 739.32 940.27 87.07J1088 10.84 665.42 942.47 120.05J1089 10.02 722.42 937.28 93.10J1090 31.91 616.28 927.75 134.96J1091 13.78 717.07 936.66 95.15J1092 10.00 698.32 938.56 104.09J1093 15.17 682.58 944.26 113.39

Appendix D 18 of 34
ID Demand (gpm) Elevation (ft) Head (ft) Pressure (psi)Buildout PHD Node Report
J1094 19.82 618.52 944.23 141.13J1095 11.97 665.16 938.30 118.35J1096 8.15 727.09 932.83 89.15J1097 7.19 706.28 929.03 96.52J1098 16.41 710.45 925.97 93.39J1099 52.50 613.31 923.01 134.19J1100 35.50 747.27 923.78 76.48J1101 22.52 663.75 922.18 111.98J1102 27.72 687.64 920.61 100.95J1103 7.40 722.31 925.65 88.11J1104 16.57 671.12 925.09 110.05J1105 31.14 620.12 923.84 131.60J1106 16.49 595.30 918.44 140.02J1107 12.08 552.32 916.04 157.60J1108 28.42 550.69 912.58 156.81J1109 14.38 569.06 910.43 147.91J111 0.82 698.87 717.21 7.95
J1110 5.28 743.50 924.09 78.25J1111 3.73 528.11 696.56 72.99J1112 55.19 559.56 909.03 151.43J1113 4.14 715.91 925.61 90.86J1114 38.66 708.49 907.00 86.01J1115 10.00 695.66 835.74 60.70J1116 15.98 610.98 905.65 127.68J1117 16.89 619.32 905.60 124.04J1118 17.13 652.95 901.87 107.86J1120 10.66 572.53 690.03 50.91J1121 25.02 697.84 900.62 87.86J1122 69.41 509.50 742.80 101.09J1123 21.49 422.55 715.69 127.02J1124 30.31 510.20 798.05 124.72J1125 15.19 556.95 684.50 55.27J1126 15.40 558.79 678.79 51.99J1127 14.23 547.63 678.78 56.83J1128 6.17 584.27 677.44 40.37J1129 12.57 578.13 672.88 41.05J1130 7.17 616.94 856.33 103.73J1131 16.83 768.69 847.60 34.19J1133 14.85 565.20 681.48 50.39J1134 19.73 793.84 824.19 13.15J1135 17.49 538.66 684.08 63.01J1136 8.43 543.35 685.59 61.63J1137 13.51 552.21 687.43 58.59J1138 16.97 513.10 686.10 74.96J1139 8.23 670.56 853.85 79.42

Appendix D 19 of 34
ID Demand (gpm) Elevation (ft) Head (ft) Pressure (psi)Buildout PHD Node Report
J1141 12.73 715.21 924.12 90.52J1142 43.91 709.78 935.00 97.59J1143 7.20 638.77 830.68 83.15J1144 6.67 678.41 827.91 64.78J1145 100.87 705.22 824.64 51.75J1146 56.94 736.48 824.35 38.08J1147 11.36 737.76 825.50 38.02J1148 3.44 682.21 714.98 14.20J119 2.03 711.38 983.50 117.91J12 21.66 623.00 830.60 89.95
J121 0.23 543.00 732.34 82.04J123 1.13 543.00 550.00 3.03J125 0.69 543.00 545.77 1.20J127 9.24 543.00 544.43 0.62J131 0.13 543.00 736.11 83.67J133 1.80 543.00 737.26 84.17J14 67.23 639.00 830.62 83.03J16 15.35 592.00 691.65 43.18J18 99.03 565.00 693.02 55.47J20 35.59 417.00 650.01 100.97
J2001 44.92 560.25 795.71 102.03J2002 25.63 531.25 800.84 116.81J2003 13.60 515.99 799.02 122.64J2004 11.93 453.42 681.89 99.00
J2004.1 17.11 453.42 783.86 143.18J2005 17.23 495.76 668.85 75.00
J2005.1 34.64 495.76 784.58 125.14J2006 14.08 391.70 669.71 120.46J2007 17.31 399.00 662.93 114.36J2008 21.00 360.71 668.73 133.47J2009 23.00 378.54 656.00 120.22J2010 32.17 502.68 652.16 64.77J2011 38.87 383.46 651.61 116.19J2012 21.34 309.61 647.87 146.57J2013 22.33 362.75 646.52 122.96J2014 7.73 305.73 646.37 147.60J2015 6.19 299.23 646.69 150.55J2016 1.44 330.98 504.07 75.00J2017 7.44 354.54 503.69 64.63J2018 1.31 392.36 635.17 105.21J2019 19.54 455.11 635.89 78.33J2020 10.78 434.30 638.90 88.65J2021 14.06 443.48 646.97 88.17J2022 20.16 434.22 643.70 90.77J2024 24.66 472.67 637.03 71.22

Appendix D 20 of 34
ID Demand (gpm) Elevation (ft) Head (ft) Pressure (psi)Buildout PHD Node Report
J2025 26.81 499.19 635.81 59.20J2026 38.49 439.39 629.87 82.53J2027 11.68 415.53 629.64 92.77J2028 9.41 381.22 630.44 107.99J2029 3.48 409.33 634.11 97.40J2030 4.38 352.31 501.65 64.71J2031 13.46 350.63 501.62 65.42J2032 16.90 361.99 624.33 113.67J2033 10.47 352.99 625.62 118.13J2034 9.74 347.34 474.27 55.00J2035 20.20 229.78 472.08 104.99J2036 80.90 226.50 469.92 105.47J2037 30.10 447.62 629.23 78.69J2038 9.47 430.60 625.68 84.53J2039 11.28 481.52 628.82 63.83J2040 19.20 402.95 596.87 84.03J2041 59.83 372.34 594.30 96.17
J2041A 11.76 395.79 596.87 87.13J2042 14.16 429.20 661.22 100.53J2043 28.30 482.32 661.18 77.50J2044 19.49 430.76 661.74 100.08J2045 15.96 430.21 661.72 100.31J2046 3.84 437.84 661.65 96.98J2047 15.58 426.01 651.63 97.76J2048 4.73 410.35 661.22 108.70J2049 11.19 400.53 651.75 108.85J2050 16.04 383.53 651.64 116.17J2052 3.08 370.21 652.17 122.18J2054 0.88 356.03 662.43 132.76J2055 2.84 423.72 660.92 102.78
J22 35.84 460.00 649.92 82.29J24 44.36 469.00 649.65 78.28J26 20.04 527.00 650.20 53.38J28 28.94 529.00 650.12 52.48J30 21.93 335.00 650.04 136.51J32 28.82 327.00 650.05 139.98J34 37.68 244.00 447.43 88.14J36 35.10 258.00 430.54 74.76J38 15.25 691.00 826.08 58.53J40 4.66 678.00 826.09 64.17
J400 19.45 376.91 662.27 123.64J4001 6.69 546.98 742.79 84.85J4002 13.99 617.95 701.00 35.99J4003 25.60 613.78 795.12 78.57J4004 10.92 624.96 897.88 118.26

Appendix D 21 of 34
ID Demand (gpm) Elevation (ft) Head (ft) Pressure (psi)Buildout PHD Node Report
J4006 15.35 417.18 668.60 108.94J4008 17.91 408.89 651.64 105.18J4009 0.34 408.84 651.70 105.23J401 39.07 410.39 660.92 108.55
J4010 7.13 382.27 651.64 116.72J4011 9.27 351.28 618.55 115.81J4012 5.10 361.02 501.62 60.92J4013 3.86 334.60 503.92 73.37J4015 2.00 352.57 662.43 134.26J4016 9.27 427.04 651.63 97.31J402 28.75 502.08 660.78 68.76J403 6.42 475.76 661.19 80.35J404 21.04 590.20 682.22 39.87J405 40.86 501.07 661.02 69.31J406 7.38 460.39 661.30 87.05J407 11.17 471.84 661.29 82.09J408 6.50 436.69 661.65 97.48J409 30.64 453.60 662.11 90.35J410 12.65 429.21 669.11 103.95J411 70.94 530.35 685.11 67.06J412 18.83 489.13 696.53 89.87J413 9.56 540.44 710.27 73.59J414 6.53 670.96 713.36 18.37J415 8.61 602.94 713.35 47.84J416 8.49 689.83 711.83 9.53J417 6.52 570.78 708.76 59.79J418 19.65 473.88 704.15 99.78J419 12.11 509.88 704.25 84.22J42 7.80 678.00 826.09 64.17
J420 10.88 628.41 942.47 136.08J421 51.96 535.97 794.61 112.07J422 83.27 536.61 794.67 111.82J423 6.63 640.44 710.90 30.53J424 42.47 617.64 802.26 80.00J425 71.81 610.41 789.72 77.70J426 15.15 626.85 671.79 19.47J427 4.29 601.64 671.81 30.41J428 7.18 590.51 678.56 38.15J429 25.93 572.14 678.49 46.08J430 26.11 614.51 831.03 93.82J431 3.50 698.74 715.80 7.39J433 3.17 640.49 710.28 30.24J434 13.39 414.66 651.69 102.70J435 8.34 646.90 701.52 23.67J436 31.74 515.53 795.96 121.51

Appendix D 22 of 34
ID Demand (gpm) Elevation (ft) Head (ft) Pressure (psi)Buildout PHD Node Report
J437 53.54 481.13 795.65 136.28J438 19.35 394.18 658.05 114.34J439 9.01 641.36 715.79 32.25J44 34.05 656.00 826.12 73.71
J440 36.73 537.00 646.94 47.64J442 23.82 532.86 654.19 52.57J46 1.20 656.00 826.15 73.72
J460 9.73 716.58 853.85 59.48J461 18.59 730.80 853.85 53.32J463 9.31 719.89 853.85 58.05J464 21.28 725.52 853.87 55.61
J465A 18.98 523.63 686.10 70.40J466 21.86 719.20 853.81 58.32J48 11.37 656.00 826.15 73.72
J480 7.04 351.46 651.90 130.18J481 3.24 399.22 651.71 109.40J50 2.71 652.00 826.18 75.47
J500 0.06 708.34 983.91 119.41J5004 14.06 689.51 758.75 30.00J5008 59.83 777.98 840.30 27.00J501 0.08 706.82 984.05 120.12
J5010 30.38 741.82 854.00 48.61J502 11.35 612.75 906.20 127.15J503 9.43 604.24 789.14 80.12J504 34.16 512.64 909.57 171.99J505 29.52 609.26 905.62 128.41J506 61.75 682.11 900.45 94.61J507 7.73 691.93 905.97 92.74J508 13.12 567.30 798.86 100.34J509 14.92 548.71 909.67 156.40J510 4.59 529.43 644.73 49.96J512 9.06 519.04 643.54 53.94J514 2.33 537.35 646.33 47.22J52 1.60 654.00 826.18 74.61
J522 14.23 378.62 625.60 107.02J522A 6.09 379.38 610.17 100.00
J54 4.85 658.00 826.18 72.87J550 81.96 463.99 797.09 144.33J551 15.91 482.54 798.02 136.70J552 68.26 454.22 718.92 114.69J553 41.60 506.54 717.84 91.56J554 19.21 436.24 715.68 121.08J555 74.75 591.94 698.08 45.99J56 7.25 661.00 826.18 71.57J58 4.91 617.00 857.01 103.99

Appendix D 23 of 34
ID Demand (gpm) Elevation (ft) Head (ft) Pressure (psi)Buildout PHD Node Report
J60 0.08 708.00 837.43 56.08J600 0.42 419.42 668.60 107.97J601 29.74 472.26 650.77 77.35J603 11.72 334.12 596.85 113.84J604 8.96 297.52 598.38 130.36J605 9.47 390.28 632.56 104.98J606 12.95 337.40 598.39 113.09
J606A 4.22 336.06 598.39 113.67J607 15.95 336.52 610.15 118.56J608 92.11 557.25 628.75 30.98J609 39.16 414.09 598.55 79.92J610 10.21 436.35 668.59 100.63J611 2.45 521.55 654.21 57.48J612 11.70 452.03 651.06 86.24J62 1.37 708.00 837.52 56.12
J621 8.95 636.44 828.50 83.22J64 1.16 708.00 984.26 119.70
J650 8.75 279.76 501.62 96.13J651 31.45 283.13 501.56 94.65J66 0.04 708.00 837.29 56.02
J670 14.52 306.10 473.14 72.38J671 2.60 267.65 472.48 88.75J672 11.69 298.36 472.48 75.45J673 2.58 267.97 472.39 88.57J674 8.21 269.55 472.38 87.89J675 6.67 249.75 472.31 96.44J676 1.76 243.75 472.31 99.04J677 11.52 317.44 648.72 143.54J678 35.56 275.32 447.19 74.47J679 80.43 229.65 448.91 95.00J680 57.34 226.11 446.94 95.69J681 65.84 262.84 445.93 79.33J682 53.23 216.32 446.14 99.58J683 53.50 233.38 445.42 91.88J684 32.43 223.60 446.11 96.42J687 7.63 263.66 472.66 90.56J688 1.97 300.83 469.92 73.27J70 12.65 425.00 635.37 91.15
J700 37.47 736.44 825.93 38.77J701 0.82 712.05 837.18 54.22J702 7.51 700.46 826.10 54.44J703 5.76 669.44 826.20 67.92J704 5.04 731.42 825.50 40.76J705 16.93 648.28 831.17 79.25J706 16.95 696.19 827.00 56.68

Appendix D 24 of 34
ID Demand (gpm) Elevation (ft) Head (ft) Pressure (psi)Buildout PHD Node Report
J707 11.02 695.67 827.90 57.30J708 8.98 660.02 828.66 73.07J709 31.37 646.48 828.48 78.86J710 5.56 690.18 827.33 59.43J711 8.47 667.27 827.32 69.35J712 2.01 622.41 832.84 91.18J713 2.26 624.62 832.84 90.22J714 45.01 745.41 825.87 34.86J715 8.18 691.64 826.09 58.26J716 4.72 631.53 832.51 87.08J717 11.11 609.41 828.34 94.86J718 11.42 611.20 828.45 94.13J719 6.89 614.13 828.94 93.08J72 9.36 455.00 635.31 78.13
J720 5.48 616.72 831.83 93.21J723 35.68 774.88 824.75 21.61J724 6.46 754.37 823.70 30.04J725 1.96 738.62 823.69 36.86J726 5.58 756.68 823.69 29.04J727 2.07 737.70 823.69 37.26J728 1.05 741.16 823.69 35.76J729 9.58 739.40 823.69 36.52J730 22.12 786.77 823.70 16.00J731 43.13 740.48 826.98 37.48J74 4.33 660.00 853.85 84.00J76 18.37 660.00 686.05 11.29J78 0.00 617.00 801.55 79.97J80 10.19 545.81 654.21 46.97
J800 69.89 746.34 846.95 43.59J801 11.89 776.96 843.78 28.95J802 23.24 754.46 843.72 38.68J82 3.81 575.06 651.37 33.06J84 25.66 600.00 697.40 42.20J86 100.65 480.00 664.51 79.95J88 0.00 480.00 686.31 89.39J94 5.56 645.00 710.28 28.28J98 0.00 592.00 830.60 103.38

Appendix D 25 of 34
IDTotal Demand
(gpm)Available Flow at
Hydrant (gpm)Critical
Node IDCritical Node Pressure (psi)
Critical Node Head (ft)
Design Flow (gpm)
10001 1001.41 657.54 10001 20.00 773.25 657.5410003 1007.83 1032.92 10003 20.00 773.25 1032.9210005 1001.06 2271.40 10005 20.00 752.44 2271.4010007 1016.58 2367.74 10007 20.00 752.44 2367.7510009 1001.30 2543.28 10009 20.00 653.17 2543.2810011 1008.93 3318.85 10011 20.00 653.17 3318.7210013 1001.75 3970.43 J1086 17.53 780.86 3904.5510015 1006.38 4038.44 J1086 15.08 775.21 3909.2710017 1001.27 2107.44 J608 0.15 557.60 1305.2210019 1001.21 1965.63 J608 4.16 566.86 1309.5910021 1001.31 1957.32 J608 4.53 567.71 1313.1510023 1002.41 1857.99 J608 7.30 574.09 1319.1410025 1002.71 1718.20 J608 11.21 583.13 1331.0810027 1002.82 1712.00 J608 11.49 583.77 1335.7210029 1004.56 1548.63 J608 15.75 593.59 1347.1510031 1006.33 1390.47 J608 19.39 602.01 1360.6710033 1003.05 1434.89 J608 18.71 600.42 1370.9910035 1003.64 1573.58 J608 8.14 576.03 1137.0110037 1003.91 1709.53 J608 3.87 566.18 1131.2110039 1002.66 1782.66 J608 1.32 560.31 1126.2910041 1002.08 1936.39 J608 -4.08 547.83 1120.5910043 1008.76 2387.88 J608 1.95 561.74 1652.4710045 1016.31 1827.20 J608 17.57 597.80 1690.6810047 1015.05 1798.43 J608 17.47 597.58 1649.6610049 1003.65 1648.87 J608 19.47 602.17 1617.0110051 1002.63 2017.73 J608 19.78 602.90 2002.4710053 1004.59 6568808.00 J608 -2123144.50 -4899384.00 1182.0410055 1001.95 118603.84 J608 -2645.74 -5548.78 1139.569993 1001.54 1082.61 J608 9.91 580.12 802.249995 1009.25 11149.36 J608 -3686.12 -7949.84 789.139997 1001.66 485.88 9997 20.00 527.68 485.889999 1025.17 716.64 9999 20.00 527.68 714.76J10 1527.90 4997.91 J723 19.57 820.05 4535.84
J1001 1676.25 6694.75 J723 19.33 819.50 5804.43J1002 1537.18 8319.79 J723 16.48 812.91 5078.93
J1002.001 1006.41 7813.08 J104 -20.68 669.27 4763.30J1002.004 1005.18 7589.97 J723 17.03 814.18 4869.35J1002.005 1002.49 7838.29 J723 16.54 813.05 4797.61J1002.007 1002.03 8025.47 J723 16.23 812.33 4775.79J1002.010 1003.08 5306.90 J104 -2.82 710.50 3759.93J1002.014 1003.60 4655.06 J104 -17.50 676.60 2834.12J1002.016 1010.28 4899.26 J104 -15.95 680.19 3029.78J1002.019 1540.28 3109.03 J104 19.25 761.42 3059.81
J1002.1 1511.20 8134.81 J723 16.40 812.73 4921.54
Buildout MDD plus Fire Flow Report

Appendix D 26 of 34
IDTotal Demand
(gpm)Available Flow at
Hydrant (gpm)Critical
Node IDCritical Node Pressure (psi)
Critical Node Head (ft)
Design Flow (gpm)
Buildout MDD plus Fire Flow Report
J1002.2 1016.34 846.83 J1002.2 20.00 753.42 846.86J1003 1510.50 9803.98 J723 13.30 805.57 4711.11J1004 1002.98 8934.65 J723 14.61 808.59 4685.39J1005 1005.34 8326.08 J723 15.42 810.47 4631.75J1006 1027.52 2794.88 J1006 20.00 739.57 2794.88J1007 1508.52 8173.55 J723 14.85 809.14 4290.92J1008 1002.03 8699.86 J723 13.73 806.56 4194.76J1009 1008.22 2141.12 J1009 20.00 710.22 2141.12J1010 1005.50 4783.39 J723 19.01 818.75 3871.80J1011 1003.28 4079.68 J714 -11.25 719.45 2207.63J1012 1007.18 8067.42 J723 12.36 803.40 3517.66J1013 1004.48 8624.35 J723 9.84 797.59 3294.20J1015 1003.33 2229.45 J1016 19.17 785.30 2172.04J1016 1002.24 1463.85 J1016 20.00 787.22 1463.85J1017 1008.32 3161.91 J1016 8.58 760.86 2380.72J1018 1007.98 3461.65 J1018 20.00 712.94 3461.65J1019 1003.90 9925.39 J723 9.99 797.94 3904.44J1020 1001.29 10980.19 J723 8.18 793.76 3969.44J1021 1003.03 12202.32 J723 6.03 788.79 4061.72J1022 1513.71 10483.94 J723 11.67 801.80 4537.32J1023 1510.95 10400.80 J723 11.78 802.06 4518.88J1024 1501.83 12193.90 J723 8.11 793.60 4329.78J1025 1508.57 12082.46 J723 8.56 794.64 4341.95J1026 1002.11 11959.26 J723 7.54 792.29 4188.58J1027 1006.63 10724.65 J723 9.89 797.71 4175.50J1028 1004.53 10130.91 J723 10.87 799.96 4124.03J1029 1004.23 6171.02 J723 17.49 815.24 4030.89J1030 1007.37 3161.59 J708 -2.92 653.29 2592.70J1031 1003.63 7271.14 J723 16.84 813.74 4391.29J1033 1005.78 5059.23 J426 12.78 656.34 1226.62J1034 1007.91 1628.33 J426 16.34 664.56 477.57J1035 1007.45 2696.95 J426 13.62 658.29 559.81J1036 1007.21 3600.60 J426 9.84 649.56 518.24J1037 1004.17 8838.35 J426 -25.86 567.16 382.91J1038 1008.96 9356.18 J426 -35.90 543.99 356.98J1039 1013.32 6980.31 J426 -16.48 588.81 350.45J1040 1009.73 2171.52 J426 10.52 651.12 337.02J1041 1016.81 4417.13 J426 2.76 633.22 338.32J1042 1013.63 4491.76 J426 0.69 628.45 326.05J1043 1008.12 2460.68 J426 2.31 632.18 267.20J1044 1013.34 3466.75 J426 7.76 644.77 320.29J1045 1003.71 7095.37 J426 11.92 654.36 779.75J1046 1014.82 10754.29 J426 -31.59 553.95 498.71J1047 1009.46 11142.50 J426 -16.13 589.62 709.44

Appendix D 27 of 34
IDTotal Demand
(gpm)Available Flow at
Hydrant (gpm)Critical
Node IDCritical Node Pressure (psi)
Critical Node Head (ft)
Design Flow (gpm)
Buildout MDD plus Fire Flow Report
J1048 1005.45 7953.65 J426 10.68 651.50 1360.85J1049 1006.43 11180.47 J426 2.72 633.13 1162.31J1050 1011.22 2288.83 J708 18.27 702.19 2167.77J1051 1002.54 1201.59 J708 8.38 679.37 1075.02J1052 1007.29 1058.15 J709 8.37 665.81 956.91J1053 1003.81 1519.13 J94 14.14 677.63 1118.58J1054 1006.16 1921.18 J94 8.84 665.40 1281.20J1056 1010.42 1824.82 J94 16.86 683.92 1649.33J1057 1006.41 1843.41 J94 12.81 674.55 1318.27J1058 1006.47 1788.06 J94 7.04 661.24 1247.66J1060 1007.99 2373.48 J94 7.25 661.74 1718.67J1061 1009.21 4312.51 J1086 4.64 751.11 3912.20J1062 1007.39 4282.19 J1086 5.72 753.59 3910.19J1063 1015.18 4600.43 J1086 -4.96 728.96 3918.36J1064 1009.40 4018.79 J426 14.53 660.37 1098.25J1065 1022.56 3824.36 J426 12.66 656.07 720.15J1066 1011.47 3174.61 J426 13.96 659.06 649.29J1067 1012.78 3356.10 J426 13.35 657.65 635.05J1068 1016.38 4019.40 J426 12.72 656.20 446.83J1069 1034.75 3106.24 J426 10.82 651.82 660.82J1070 1013.09 2323.23 J426 14.19 659.59 684.12J1071 1024.74 2476.65 J426 13.86 658.84 812.61J1072 1035.20 2693.24 J426 13.03 656.93 825.92J1073 1012.92 2715.85 J426 12.93 656.69 825.07J1074 1010.15 2544.91 J426 13.62 658.29 823.16J1075 1009.14 2718.57 J426 13.09 657.07 858.45J1076 1007.75 2616.16 J426 13.40 657.78 837.17J1077 1011.72 2702.90 J426 13.29 657.52 884.53J1078 1008.49 2667.92 J426 13.60 658.23 914.37J1079 1045.52 2086.06 J426 15.94 663.64 936.13J1080 1020.00 1816.47 J426 17.33 666.85 654.88J1081 1007.69 2697.41 10009 20.00 653.17 2697.41J1082 1032.05 3278.89 J1082 20.00 677.33 3278.89J1083 1007.84 3301.90 J1083 20.00 756.93 3301.91J1084 1008.59 3993.46 J1086 14.18 773.11 3841.70J1085 1012.34 4055.25 J1086 10.26 764.07 3806.42J1086 1012.15 3650.21 J1086 20.00 786.56 3650.21J1087 1004.83 3690.69 J1087 20.00 785.48 3690.69J1088 1007.23 2961.80 J1088 20.00 711.58 2961.80J1089 1006.68 3891.54 J1087 15.30 774.63 3770.22J1090 1021.27 2995.36 J1090 20.00 662.44 2995.36J1091 1009.19 3978.13 J1087 13.86 771.30 3818.96J1092 1006.67 3360.78 J1092 20.00 744.48 3360.80J1093 1010.11 3192.00 J1093 20.00 728.74 3192.01

Appendix D 28 of 34
IDTotal Demand
(gpm)Available Flow at
Hydrant (gpm)Critical
Node IDCritical Node Pressure (psi)
Critical Node Head (ft)
Design Flow (gpm)
Buildout MDD plus Fire Flow Report
J1094 1013.22 3542.18 J1094 20.00 664.68 3542.18J1095 1007.98 3259.02 10001 10.75 751.91 3065.05J1096 1005.43 2330.73 10001 20.00 773.25 2330.72J1097 1004.80 2552.83 10005 20.00 752.44 2552.83J1098 1010.94 3124.06 J1098 20.00 756.61 3124.06J1099 1035.00 3121.15 J1099 20.00 659.47 3121.15J1100 1023.67 2808.06 J1100 20.00 793.43 2808.06J1101 1015.01 3285.45 J1101 20.00 709.91 3285.45J1102 1018.48 4036.13 J1100 12.28 775.62 3806.12J1103 1004.93 3831.78 J1100 14.32 780.32 3666.43J1104 1011.04 3985.62 J1104 20.00 717.28 3985.62J1105 1020.76 4001.70 J1105 20.00 666.28 4001.70J1106 1010.99 4722.68 J1100 16.91 786.30 4607.99J1107 1008.06 5374.73 J1100 -0.12 746.98 4639.60J1108 1018.95 7177.89 J1100 -43.46 646.96 5059.25J1109 1009.58 7436.38 J1100 -33.02 671.08 5476.10J111 1000.55 -49114.73 J426 21.45 676.35
J1110 1003.52 3003.51 J1110 20.00 789.66 3003.52J1111 1002.49 9398.14 J426 -27.17 564.14 414.30J1112 1036.79 8577.83 J1100 -31.96 673.51 6332.54J1113 1002.76 3338.85 J1113 20.00 762.07 3338.85J1114 1025.77 10270.40 J1114 20.00 754.65 10270.42J1115 1006.67 8964.19 J723 14.31 807.91 4373.27J1116 1010.66 2229.36 J1117 16.37 657.11 2188.89J1117 1011.26 1225.13 J1117 20.00 665.48 1225.14J1118 1011.42 9589.62 J1121 0.29 698.52 8304.66J1120 1007.11 2180.44 J426 7.51 644.17 296.22J1121 1016.68 1320.94 J1121 20.00 744.00 1320.98J1122 1046.28 3347.34 J1122 20.00 555.66 3347.34J1123 1014.33 1649.39 J553 3.34 514.25 1461.42J1124 1020.21 2198.75 J1124 20.00 556.36 2198.81J1125 1010.12 2181.82 J426 2.28 632.12 227.31J1126 1010.27 1866.99 J426 2.33 632.22 184.45J1127 1009.49 2172.63 J426 -1.79 622.72 183.40J1128 1004.12 1946.53 J426 0.11 627.11 170.67J1129 1008.38 1789.26 J426 -1.42 623.57 150.64J1130 1004.78 7708.92 J426 -6.51 611.82 468.81J1131 1011.22 3508.58 J426 16.90 665.85 755.29J1133 1009.90 2845.81 J426 -8.47 607.31 204.89J1134 1013.16 -6692.15 J426 21.45 676.35J1135 1011.66 4596.90 J426 -19.64 581.53 229.99J1136 1005.62 4782.22 J426 -17.84 585.69 239.95J1137 1009.01 4997.48 J426 -14.45 593.49 266.43J1138 1011.31 1292.48 J426 13.78 658.64 268.73

Appendix D 29 of 34
IDTotal Demand
(gpm)Available Flow at
Hydrant (gpm)Critical
Node IDCritical Node Pressure (psi)
Critical Node Head (ft)
Design Flow (gpm)
Buildout MDD plus Fire Flow Report
J1139 1005.49 2279.01 J426 17.71 667.73 516.84J1141 1008.49 3758.90 J1100 14.35 780.38 3596.74J1142 1029.27 4020.50 J1087 16.30 776.94 3921.93J1143 1004.80 8757.76 J723 13.47 805.98 4097.13J1144 1004.45 3393.26 J1016 7.21 757.71 2493.14J1145 1067.25 9903.77 J723 9.41 796.59 3988.90J1146 1012.69 6908.70 J723 18.88 818.46 5627.68J1147 1007.57 7601.97 J723 11.76 802.02 3177.06J1148 1002.29 -10444.68 J723 21.93 825.48 2689.56J119 1001.35 4193.01 J1086 12.99 770.38 4005.31J12 1014.44 1535.57 J12 20.00 669.16 1535.57
J121 1000.16 30881.58 J121 20.00 589.16 30882.08J123 1000.76 -2414065.25 J426 21.45 676.35J125 1000.46 -22328.23 J426 21.45 676.35J127 1006.16 -15043.15 J426 21.45 676.35J131 1000.09 26284.15 J131 20.00 589.16 26284.46J133 1001.20 22017.50 J133 20.00 589.16 22017.68J14 1544.82 1835.13 J14 20.00 685.16 1835.13J16 1010.23 3928.56 J426 8.14 645.64 333.58J18 1066.02 1171.06 J18 20.00 611.16 1171.06J20 1023.73 2610.99 J28 -22.03 478.15 1681.76
J2001 1029.95 1867.45 J425 -2.03 605.72 1575.19J2002 1017.09 11102.67 J1121 -14.28 664.89 8396.51J2003 1009.06 10832.17 J1121 -8.58 678.04 8545.68J2004 1007.95 -27733.08 J82 -45.07 471.04 6183.22
J2004.1 1011.41 7785.96 J82 7.26 591.81J2005 1011.49 2942.02 J2005 20.00 541.92 2942.05
J2005.1 1023.09 880.40 J2005.1 20.00 541.92 880.41J2006 1009.39 7888.20 J82 -60.82 434.70 4021.37J2007 1011.54 5930.05 J82 -55.71 446.48 2217.25J2008 1014.00 7875.59 J82 -59.99 436.62 3998.53J2009 1015.33 3148.95 J28 -13.18 498.58 2156.61J2010 1021.45 1843.61 J2010 20.00 548.84 1843.59J2011 1025.91 2608.31 J28 -0.97 526.76 2004.11J2012 1014.22 3298.32 J28 -6.49 514.02 2387.60J2013 1014.88 3625.14 J608 -23.78 502.38 1723.87J2014 1005.16 3272.49 J608 -1.58 553.60 2124.02J2015 1004.13 3287.23 J608 0.00 557.24 2191.89J2016 1000.96 -125.65 J608 -1251.13 -2330.19 1809.33J2017 1004.96 2759.94 J608 -11.27 531.25 1486.50J2018 1000.88 1640.39 J608 6.38 571.98 1140.11J2019 1013.03 1829.37 J608 1.55 560.82 1167.05J2020 1007.19 2688.66 J608 -25.10 499.33 1245.41J2021 1009.38 3150.26 J608 -28.17 492.25 1451.53

Appendix D 30 of 34
IDTotal Demand
(gpm)Available Flow at
Hydrant (gpm)Critical
Node IDCritical Node Pressure (psi)
Critical Node Head (ft)
Design Flow (gpm)
Buildout MDD plus Fire Flow Report
J2022 1013.44 2320.23 J608 -12.20 529.10 1242.61J2024 1016.44 1931.32 J608 -14.47 523.86 993.55J2025 1017.87 1643.93 J608 -4.06 547.89 965.19J2026 1025.66 1949.01 J608 -23.62 502.73 887.81J2027 1007.78 2127.41 J608 -26.90 495.17 928.15J2028 1006.27 2920.66 J608 -40.79 463.12 1016.55J2029 1002.32 2098.78 J608 -10.12 533.89 1115.20J2030 1002.92 2376.84 J608 -6.31 542.68 1299.71J2031 1008.97 1722.25 J608 12.00 584.94 1367.81J2032 1011.26 2620.45 J608 -31.13 485.42 986.27J2033 1006.98 2372.08 J608 -30.82 486.11 942.00J2034 1006.49 128658.03 J608 -2844.69 -6007.93 986.92J2035 1013.47 3298.59 J608 -37.03 471.79 1145.22J2036 1553.94 3583.87 J608 -41.63 461.18 1273.13J2037 1020.06 1804.04 J608 -27.63 493.48 800.50J2038 1006.32 1604.53 J608 -12.88 527.53J2039 1007.52 1181.43 J608 -12.83 527.64 625.22J2040 1012.80 1058.46 J608 8.53 576.94 770.01J2041 1039.89 1042.85 J608 8.81 577.58 772.52
J2041A 1007.84 1061.07 J608 8.20 576.18 765.06J2042 1009.44 1713.20 J426 17.96 668.29 1034.53J2043 1018.87 1355.57 J426 19.09 670.91 1046.27J2044 1012.99 1875.38 J426 17.66 667.60 1070.68J2045 1010.64 1953.82 J426 17.13 666.38 1024.70J2046 1002.56 1419.09 J426 18.80 670.25 1019.46J2047 1010.38 2394.15 J426 17.79 667.90 1337.12J2048 1003.15 1396.76 J426 18.91 670.49 1028.25J2049 1007.46 2871.13 J426 16.80 665.62 1384.15J2050 1010.69 2507.12 J426 17.39 666.98 1266.21J2052 1002.06 3213.19 J426 16.47 664.86 1450.89J2054 1000.59 2579.71 J426 14.35 659.96 951.48J2055 1001.90 1266.68 J426 19.30 671.38 1026.99
J22 1023.89 2013.37 J28 9.19 550.20 1727.19J24 1029.57 1041.16 J24 20.00 515.16 1041.17J26 1013.36 1477.67 J28 19.12 573.12 1455.93J28 1019.30 911.25 J28 20.00 575.16 911.24J30 1014.62 3417.81 J28 -38.86 439.32 1919.72J32 1019.21 2908.29 J28 -13.18 498.59 2013.01J34 1025.12 804.82 J678 6.38 290.04 709.08J36 1023.40 113.26 J36 20.00 304.16 113.27J38 1010.16 2553.10 J104 8.70 737.07 2094.23J40 1003.11 2481.17 J104 14.40 750.23 2227.50
J400 1012.96 2420.78 J426 15.11 661.72 975.93J4001 1004.46 5662.69 J1100 -6.12 733.15

Appendix D 31 of 34
IDTotal Demand
(gpm)Available Flow at
Hydrant (gpm)Critical
Node IDCritical Node Pressure (psi)
Critical Node Head (ft)
Design Flow (gpm)
Buildout MDD plus Fire Flow Report
J4002 1009.32 2403.65 J4002 20.00 664.11 2403.55J4003 1017.06 2138.84 J426 14.51 660.34J4004 1007.28 9067.54 J1121 10.79 722.74 8342.28J4006 1010.23 2574.07 J426 19.30 671.39 2079.40J4008 1011.94 -1495.17 J426 -1394490.63 -3217676.25J4009 1000.23 2639.62 J426 17.24 666.63 1365.39J401 1026.04 1416.98 J426 18.92 670.51 1051.14
J4010 1004.75 796.76 J402 -15805.59 -35975.16 3690.32J4011 1006.18 2277.42 J608 -16.31 519.60 981.18J4012 1003.40 1741.41 J608 11.02 582.67 1348.02J4013 1002.58 2804.52 J608 -9.37 535.62 1777.04J4015 1001.34 3480.86 J426 14.28 659.80 1145.01J4016 1006.18 2245.50 J402 14.41 535.34 1291.58J402 1019.16 750.60 J402 20.00 548.24 750.60J403 1004.28 1363.71 J426 19.04 670.79 1035.56J404 1014.02 2131.07 J426 2.03 631.54 214.98J405 1027.24 943.22 J405 20.00 547.23 943.24J406 1004.92 1466.90 J426 18.75 670.12 1040.29J407 1007.45 1231.13 J426 19.46 671.75 1042.81J408 1004.33 1866.01 J426 17.41 667.02 1021.24J409 1020.43 1720.25 J426 18.38 669.28 1126.32J410 1008.44 1653.36 J426 17.25 666.66 837.86J411 1047.29 701.10 J426 17.67 667.63 304.71J412 1012.56 1784.55 J426 14.84 661.09 424.37J413 1006.37 1350.85 J413 20.00 586.60 1350.85J414 1004.35 -1761.92 J723 21.93 825.48 1809.17J415 1005.74 1233.05 J415 20.00 649.10 1233.06J416 1005.66 -1322.23 J723 21.93 825.48 1226.48J417 1004.34 6372.85 J426 8.92 647.44 882.15J418 1013.10 1358.12 J426 18.34 669.17 635.37J419 1008.08 1237.58 J426 18.65 669.90 642.95J42 1005.20 2000.73 J42 20.00 724.16 2000.73
J420 1007.25 2252.35 J420 20.00 674.57 2252.36J421 1034.64 1270.68 J421 20.00 582.13 1270.68J422 1055.51 1217.11 J422 20.00 582.77 1217.12J423 1004.42 1601.15 J708 16.99 699.22 1476.61J424 1028.31 9302.03 J1121 8.18 716.72 8363.41J425 1047.87 947.73 J425 20.00 656.57 947.73J426 1010.10 105.98 J426 20.00 673.01 105.98J427 1002.86 1114.99 J426 9.07 647.78 140.39J428 1004.79 1845.42 J426 2.59 632.84 178.46J429 1017.29 873.60 J426 13.99 659.14 190.97J430 1017.41 3602.54 J430 20.00 660.67 3602.55J431 1002.33 -17928.57 J723 21.93 825.48 3555.59

Appendix D 32 of 34
IDTotal Demand
(gpm)Available Flow at
Hydrant (gpm)Critical
Node IDCritical Node Pressure (psi)
Critical Node Head (ft)
Design Flow (gpm)
Buildout MDD plus Fire Flow Report
J433 1002.11 1309.42 J94 19.13 689.15 1276.43J434 1008.93 2518.30 J426 17.51 667.26 1370.64J435 1005.56 257.22 J435 20.00 693.06 257.22J436 1021.16 3530.39 J422 10.60 561.08 3364.65J437 1035.69 1811.64 J437 20.00 527.29 1811.64J438 1012.90 5144.25 J82 -57.87 441.51 1766.01J439 1006.01 730.67 J439 20.00 687.52 730.67J44 1022.70 2616.91 J104 15.91 753.73 2413.66
J440 1024.49 1402.21 J82 13.89 607.13 1152.82J442 1015.88 1231.73 J82 17.45 615.33 1123.85J46 1000.80 2573.68 J104 17.32 756.98 2436.46
J460 1006.48 1592.17 J426 18.08 668.57 517.84J461 1012.39 1742.49 J426 17.98 668.34 523.75J463 1006.21 1834.26 J426 17.94 668.24 517.57J464 1014.19 2487.13 J426 17.48 667.19 525.55
J465A 1012.66 1222.11 J426 14.23 659.69 270.07J466 1014.57 1017.40 J426 18.90 670.47 525.93J48 1007.58 2430.52 J48 20.00 702.16 2430.52
J480 1004.69 3266.22 J426 16.64 665.25 1511.70J481 1002.16 2820.32 J426 16.85 665.74 1371.14J50 1001.81 2608.90 J104 17.53 757.46 2479.49
J500 1000.04 4169.30 J1086 14.04 772.80 4008.85J5004 1009.37 1312.18 J426 -598.84 -755.18J5008 1039.89 3163.77 J426 19.34 671.47 2402.95J501 1000.05 4166.86 J1086 14.19 773.16 4010.48
J5010 1020.25 4525.18 J426 11.94 654.41 531.61J502 1007.56 2315.11 J502 20.00 658.91 2315.60J503 1006.29 4234.98 J1086 7.38 757.43 3909.28J504 1022.78 2657.97 J504 20.00 558.80 2657.97J505 1019.68 1875.93 J505 20.00 655.42 1875.98J506 1041.16 1224.58 J506 20.00 728.27 1224.59J507 1005.15 10246.75 J1121 16.44 735.79 9962.54J508 1008.75 3281.77 J508 20.00 613.46 3281.81J509 1009.95 8139.57 J1100 -38.38 658.70 5847.44J510 1003.06 1578.52 J608 10.65 581.84 1225.38J512 1006.04 1674.19 J608 6.13 571.39 1183.17J514 1001.55 1389.18 J82 14.88 609.39 1169.67J52 1001.07 2074.67 J56 16.97 700.16 2009.98
J522 1009.49 1956.71 J608 -19.67 511.86 929.15J522A 1004.06 47645.15 J608 -2204.54 -4530.53 923.72
J54 1003.24 1739.32 J54 20.00 704.16 1739.32J550 1054.64 1441.49 J550 20.00 510.15 1441.50J551 1010.60 1591.92 J551 20.00 528.70 1591.97J552 1045.50 1635.78 J553 -2.89 499.87 1397.83

Appendix D 33 of 34
IDTotal Demand
(gpm)Available Flow at
Hydrant (gpm)Critical
Node IDCritical Node Pressure (psi)
Critical Node Head (ft)
Design Flow (gpm)
Buildout MDD plus Fire Flow Report
J553 1027.73 547.55 J553 20.00 552.70 547.55J554 1012.81 1434.84 J554 20.00 482.40 1434.84J555 1049.84 1125.72 J555 20.00 638.10 1125.72J56 1004.83 1405.03 J56 20.00 707.16 1405.03
J600 1000.28 2547.28 J426 19.26 671.29 2032.40J601 1019.82 1933.69 J28 6.48 543.95 1593.56J603 1007.81 1027.16 J608 9.66 579.53 765.03J604 1005.97 953.58 J608 13.16 587.63 773.87J605 1006.31 2941.92 J608 -37.42 470.89 1063.33J606 1008.63 934.76 J608 14.00 589.56 776.53
J606A 1002.81 930.42 J608 13.94 589.43 770.71J607 1010.64 1657.53 J608 -6.26 542.80 930.30J608 1061.41 654.89 J608 20.00 603.41 654.90J609 1026.10 1132.33 J608 6.59 572.47 794.01J610 1006.81 1836.15 J610 20.00 482.51 1836.15J611 1001.63 1027.27 J611 20.00 567.71 1027.27J612 1007.80 3259.00 J608 -23.47 503.08 1594.24J621 1005.97 849.79 J621 20.00 682.60 849.81J650 1005.84 1803.15 J608 12.01 584.98 1429.21J651 1020.97 1383.82 J651 20.00 329.29 1383.83J670 1009.68 2842.97 J608 -24.34 501.09 1091.11J671 1001.74 2120.98 J608 -6.30 542.71 1091.97J672 1007.79 1586.79 J608 6.25 571.68 1098.03J673 1001.72 2080.33 J608 -5.39 544.81 1095.60J674 1005.48 1733.91 J608 1.74 561.27 1099.36J675 1004.45 2173.06 J608 -7.30 540.40 1102.65J676 1001.17 1862.00 J608 -0.97 555.01 1099.38J677 1007.68 2660.93 J28 2.06 533.75 2121.23J678 1023.71 568.40 J678 20.00 321.48 568.40J679 1053.62 1198.74 J678 -0.14 274.99 1002.40J680 1038.23 1062.63 J681 3.88 271.79 925.47J681 1043.89 637.77 J681 20.00 309.00 637.77J682 1035.49 975.67 J683 12.46 262.14 921.51J683 1035.67 658.05 J683 20.00 279.54 658.05J684 1021.62 906.48 J684 20.00 269.76 906.50J687 1005.09 2246.60 J608 -9.06 536.34 1091.04J688 1001.31 31476.72 J608 257.03 1150.44 2110.92J700 1024.98 696.79 J714 16.10 782.57 612.79J701 1000.55 8028.31 J723 15.83 811.42 4400.59J702 1005.01 1059.91 J714 2.69 751.62 679.79J703 1003.84 1443.06 J714 -12.99 715.44 739.79J704 1003.36 1358.81 J704 20.00 777.58 1358.87J705 1511.29 1080.36 J705 20.00 694.44 1080.38J706 1011.30 1201.06 J706 20.00 742.35 1201.08

Appendix D 34 of 34
IDTotal Demand
(gpm)Available Flow at
Hydrant (gpm)Critical
Node IDCritical Node Pressure (psi)
Critical Node Head (ft)
Design Flow (gpm)
Buildout MDD plus Fire Flow Report
J707 1007.35 1390.50 J707 20.00 741.83 1390.54J708 1005.98 951.09 J708 20.00 706.18 951.10J709 1020.91 916.58 J709 20.00 692.64 916.59J710 1003.71 2843.19 J714 18.09 787.16 2659.78J711 1005.64 1619.67 J711 20.00 713.43 1619.67J712 1501.34 5247.79 J723 19.14 819.05 4357.65J713 1501.50 3088.29 J713 20.00 670.78 3088.29J714 1030.00 554.75 J714 20.00 791.57 554.75J715 1005.45 1001.32 J714 5.74 758.66 680.23J716 1503.15 10923.54 J723 10.11 798.22 4285.96J717 1007.41 7580.05 J723 16.23 812.33 4477.41J718 1007.62 7507.66 J723 16.21 812.30 4419.09J719 1504.59 8453.09 J723 14.27 807.82 4244.35J720 1003.65 11258.51 J723 9.21 796.14 4234.32J723 1523.79 3065.14 J723 20.00 821.04 3065.18J724 1004.30 1383.74 J726 19.00 800.53 1306.27J725 1001.30 1307.12 J726 14.76 790.74 1017.31J726 1003.72 920.47 J726 20.00 802.84 920.48J727 1001.38 1450.15 J726 11.78 783.86 1017.38J728 1000.70 1612.73 J726 13.27 787.32 1188.48J729 1006.38 1254.32 J726 19.15 800.88 1194.16J730 1514.75 -1112.54 J426 21.45 676.35J731 1028.76 1113.81 J731 20.00 786.64 1113.82J80 1006.79 1530.28 J82 9.35 596.65 1114.76
J800 1046.59 708.81 J800 20.00 792.50 708.81J801 1007.93 3057.99 J426 18.64 669.86 1091.23J802 1015.49 772.02 J802 20.00 800.62 772.02J82 1002.54 930.70 J82 20.00 621.22 930.70J94 1003.71 455.74 J94 20.00 691.16 1249.36

2017 Jenny Lind Water Master Plan Calaveras County Water District
APPENDIX E
Recommended Projects

THIS PAGE LEFT INTENTIONALLY BLANK

A
AA
A
A
AA
A
^
FIGURE
E-1Jenny Lind Water Master Plan
AB Transmission Main1180 Iron Point Rd., Suite 260Folsom, CA 95630
Phone: (916) 608-2212Fax: (916) 608-2232
0 500Feet
p 1" = 500 ft
LegendExisting Pipe
Recommended Improvements

A
^
FIGURE
E-2Jenny Lind Water Master Plan
E&F Transmission Main1180 Iron Point Rd., Suite 260Folsom, CA 95630
Phone: (916) 608-2212Fax: (916) 608-2232
0 250Feet
p 1" = 250 ft
LegendExisting Pipe
Recommended Improvements

A
FIGURE
E-3Jenny Lind Water Master Plan
Westhill Rd Loop1180 Iron Point Rd., Suite 260Folsom, CA 95630
Phone: (916) 608-2212Fax: (916) 608-2232
0 250Feet
p 1" = 250 ft
LegendExisting Pipe
Recommended Improvements
New 8" Loop Pipe

AA
A
FIGURE
E-4Jenny Lind Water Master Plan
Anderson St Loop1180 Iron Point Rd., Suite 260Folsom, CA 95630
Phone: (916) 608-2212Fax: (916) 608-2232
0 250Feet
p 1" = 250 ft
LegendExisting Pipe
Recommended Improvements
New 12" Loop Pipe

A
FIGURE
E-5Jenny Lind Water Master Plan
Hanley Dr Loop1180 Iron Point Rd., Suite 260Folsom, CA 95630
Phone: (916) 608-2212Fax: (916) 608-2232
0 250Feet
p 1" = 250 ft
LegendExisting Pipe
Recommended Improvements
New PRV

A
A
A
FIGURE
E-6Jenny Lind Water Master Plan
Bergsma Ln Loop1180 Iron Point Rd., Suite 260Folsom, CA 95630
Phone: (916) 608-2212Fax: (916) 608-2232
0 500Feet
p 1" = 500 ft
LegendExisting Pipe
Recommended Improvements
New PRV

A
A
A
^
FIGURE
E-7Jenny Lind Water Master Plan
Lower B Zone Improvements1180 Iron Point Rd., Suite 260Folsom, CA 95630
Phone: (916) 608-2212Fax: (916) 608-2232
0 500Feet
p 1" = 500 ft
LegendExisting Pipe
Recommended Improvements
B Tank

A
AA
A
A
A
A
A
A
AA
AA
^
^
^
^
^
FIGURE
E-8Jenny Lind Water Master Plan
A1 Transmission Main1180 Iron Point Rd., Suite 260Folsom, CA 95630
Phone: (916) 608-2212Fax: (916) 608-2232
0 1,000Feet
p 1" = 1000 ft
LegendExisting Pipe
Recommended Improvements

A
A
AA
^
FIGURE
E-9Jenny Lind Water Master Plan
A1 Zone Improvements1180 Iron Point Rd., Suite 260Folsom, CA 95630
Phone: (916) 608-2212Fax: (916) 608-2232
0 500Feet
p 1" = 500 ft
LegendExisting Pipe
Recommended Improvements