3 2† accepted - journal of virologyjvi.asm.org/content/early/2006/08/23/jvi.00851-06.full.pdf3 1...
TRANSCRIPT

1
An Integrated Molecular Signature of Disease: Analysis of Influenza Virus-Infected Macaques 1
through Functional Genomics and Proteomics 2
Baas, T. 1‡*, Baskin, C.R. 1,2‡, D.L. Diamond1, A. García-Sastre4, H. Bielefeldt-Ohmann2†, T.M. 3
Tumpey5, M.J. Thomas1, V.S. Carter1, T. H. Teal1, N. Van Hoeven5, S. Proll1, J.M. Jacobs6, Z. R. 4
Caldwell1, M.A. Gritsenko6, R.R. Hukkanen2,3, D.G. Camp II6, R.D. Smith6, and M.G. Katze1, 2 5
‡ Both Authors contributed equally to this work 6
7
1Department of Microbiology, 2Washington National Primate Research Center, 3Department of 8
Comparative Medicine, Seattle, WA, University of Washington, Seattle, WA 98195; 4Department of 9
Microbiology, Mount Sinai School of Medicine, New York, NY 10029; 5Influenza Branch, DVRD, 10
NCID, Centers for Disease Control and Prevention, Atlanta, GA 30333, 6Biological Sciences 11
Division and Environmental Molecular Sciences Laboratory, Pacific Northwest National Laboratory, 12
Richland, Washington 99352. 13
14
Running Title: Genes induced in macaque lung and blood by influenza 15
16
17
18
*Box 358070, Department of Microbiology, University of Washington, Seattle, WA, 98195, (206) 19
732-6119, Fax: (206)732-6056; [email protected] 20
†Currently at College of Veterinary Medicine & Biomedical Sciences, Department of Microbiology, 21
Immunology & Pathology, Colorado State University, Fort Collins, CO 22
23
24
25
26
ACCEPTED
ACCEPTED
Copyright © 2006, American Society for Microbiology and/or the Listed Authors/Institutions. All Rights Reserved.J. Virol. doi:10.1128/JVI.00851-06 JVI Accepts, published online ahead of print on 23 August 2006
on July 1, 2018 by guesthttp://jvi.asm
.org/D
ownloaded from

2
ABSTRACT 1
Recent outbreaks of avian influenza in humans have stressed the need for an improved non-human 2
primate model of influenza pathogenesis. In order to further develop a macaque model, we expanded 3
our previous in vivo genomics experiments in influenza virus infected macaques by focusing on the 4
innate immune response at day 2 post-inoculation and on gene expression in affected lung tissue with 5
viral genetic material present. Finally, we sought to identify signature genes for early infection in 6
whole blood. For these purposes, we infected six pigtailed macaques (Macaca nemestrina) with 7
reconstructed influenza A/Texas/36/91 virus and three control animals with a sham inoculate. We 8
sacrificed one control and two experimental animals at days 2, 4, and 7 post infection (PI). Lung 9
tissue was harvested for pathology, gene expression profiling, and proteomics. Blood was collected 10
for genomics every other day from each animal until experimental endpoint. Gross and microscopic 11
pathology, immunohistochemistry, viral gene expression by arrays and/or quantitative real-time RT-12
PCR confirmed successful yet mild infection in all experimental animals. Genomic experiments were 13
performed using macaque-specific oligonucleotide arrays and high-throughput proteomics revealed 14
the host response to infection at the mRNA and protein levels. Our data showed dramatic differences 15
in gene expression within regions in influenza virus-induced lesions based on the presence or absence 16
of viral mRNA. We also identified genes tightly co-regulated in peripheral white blood cells and in 17
lung tissue at day 2 post-inoculation. This latter finding opens the possibility of using gene expression 18
arrays on whole blood to detect infection after exposure but prior to onset of symptoms or shedding. 19
20
21
22
23
24
25
26
ACCEPTED
ACCEPTED
on July 1, 2018 by guesthttp://jvi.asm
.org/D
ownloaded from

3
INTRODUCTION 1
Although influenza virus was one of the first human viruses isolated, it continues to pose a 2
challenge by resurfacing each year with newly acquired genetic variation (83). This adaptive nature of 3
the virus leads to new species-specificity, tissue tropism, and replicative abilities through both genetic 4
drift and shift that directly affect virulence and can potentially result in the emergence of pandemic 5
strains (34,55,63,81,83). Although subtypes circulating in humans since 1918 have been limited to 6
combinations of H1/H2/H3 and N1/N2 surface proteins, there are increasing concerns that (H5/H7) 7
avian influenza viruses are adapting to other species, including humans, and causing morbidity in 8
normally unaffected hosts (34,82). International surveillance of influenza virus has increased and 9
research efforts have been adopted to attempt to diagnose cases early, produce effective vaccines 10
faster, and devise new antiviral drugs. 11
Using reverse genetics techniques, (19,32,33,53,54) scientists can now make replicas of 12
emerging influenza viruses and can generate novel recombinant viruses to study pathogenicity or to 13
be used as vaccines. These techniques have already been used to investigate virulence of 14
reconstructed 1918 pandemic (4,39,41,78,79) and avian influenza viruses (30,46) in mouse models. 15
While the availability of murine reagents and genetically-modified mouse models are powerful tools 16
to study disease pathogenesis and to evaluate therapeutic and prophylactic strategies, influenza 17
infection of mice does not precisely replicate the natural infection in the human host (75). Mice are 18
not natural hosts of influenza virus, making their utility as transmission or immunoprotection models 19
limited. Ferrets have been considered appropriate host models because they are outbred mammals that 20
are naturally susceptible to infection with influenza viruses, resulting in disease that resembles that of 21
human influenza (26,85). Limitations include a shortage of influenza-seronegative ferrets, a 22
confounding higher body temperature, and the lack of available immunological reagents (48). 23
Although other animal models of influenza infection exist and are routinely used, none are as 24
close to humans in physiology and DNA sequence as non-human primates. The close phylogenetic 25
relationship between humans and non-human primates has driven their widespread use as models for 26
ACCEPTED
ACCEPTED
on July 1, 2018 by guesthttp://jvi.asm
.org/D
ownloaded from

4
human disease, and influenza is no exception. Macaques, in particular, have been used extensively to 1
study viral respiratory diseases, including influenza (8,42,68,69,71,72), SARS (20,44,45,50,59,70), 2
and metapneumovirus (43) and to evaluate therapeutic and prophylactic strategies 3
(18,25,28,45,60,67). With the rapid advancement in sequencing of several non-human primate 4
transcriptomes, primate resources have expanded and the ability to perform global gene expression 5
and protein profiling is at hand (49). Recently, Baskin et al. examined the suitability of pigtailed 6
macaques as models of influenza infection and disease in the context of transcriptional studies, by 7
integrating clinical data and pathology with examination of global and immune response-specific 8
gene expression in affected tissues (3). In the present study, our goal was to more fully define the 9
impact of host-virus interaction in lungs with an emphasis on the early response. We address the 10
question “What does influenza infection look like in a primate?” by using both classical infectious 11
study protocols augmented with the powerful technologies of functional genomics performed with 12
macaque-specific oligonucleotide arrays and high throughput proteomics. By processing multiple 13
pulmonary samples from the same animal and from the same lesion, areas of localized infection (viral 14
mRNA present) as well as areas without direct evidence of infection (viral mRNA absent) were 15
detected. We observed that pulmonary transcriptional profiles, predominantly innate immune 16
response, were strongly affected by the amount of viral mRNA present. Very importantly, we have 17
identified transcriptional markers of early infection in peripheral white blood cells. 18
19
MATERIAL AND METHODS 20
Animals 21
Nine male pigtailed macaques, ranging in age from 6 to 9.5 years and in weight from 11.2 to 23.4 kg, 22
were obtained from the Washington National Primate Research Center for the purpose of this study. 23
None of these animals had received any major treatments in the past, and were sero-negative for type 24
D simian retrovirus (SRV), simian T cell leukemia virus (STLV), and simian foamy virus (SFV). 25
Physical exam two weeks before scheduled inoculation, as well as a complete blood count (CBC), 26
ACCEPTED
ACCEPTED
on July 1, 2018 by guesthttp://jvi.asm
.org/D
ownloaded from

5
serum chemistry (both processed at the Department of Laboratory Medicine, University of 1
Washington Medical Center), and influenza A serum antibody titers (by measurement of 2
hemagglutination inhibition (HI) titers against H1N1 A/New Cal/20/99, H3N2 A/Panama/2007/99, 3
and H3N2 A/New Mexico/17/2003), ruled out any major health problems or prior exposure to 4
influenza virus. All animals were moved from another part of the facility into the room assigned to 5
the study four days prior to start of the experiment. All animals displayed behavior and appetite 6
within normal limits, indicative of successful acclimation, by the start of the study. During the study, 7
the room was under a biosafety level 2+, and all procedures were performed according to guidelines 8
approved by the University of Washington Environmental Health and Safety Committee, the 9
Occupational Health Administration, the Primate Center Research Review Committee, and the 10
Institutional Animal Care and Use Committee. 11
Protocol 12
The protocol was adapted from Rimmelzwaan et al. (67,68,69) and based on our previous work (3). 13
Briefly, the nine animals were either designated as control (sham-inoculated) animals (n = 3) or as 14
experimental animals (n = 6), and were matched for age and weight. Three sets of one control and 15
two experimental animals were assigned endpoints of 2, 4, or 7 days post-inoculation (PI). The 16
control phase of the study was performed first, to avoid cross-infection by infected animals. 17
Experimental animals were inoculated with 107 of 50% Tissue Culture Infectious Doses (TCID50) of 18
reconstructed influenza A/Texas/36/91 virus. The sequence of the rescued Tx/91 virus was 19
confirmed by RT-PCR and sequence analysis. Future studies will use this reconstructed Texas 20
virus as a background to genetically engineer chimeras that will investigate host response to viral 21
gene constellations in a systematic manner. Inoculation was done intratracheally, and on tonsils and 22
conjunctivae, which approximates natural routes of infection and resulted in successful infection and 23
reproduction of the human disease in past experiments (Baskin et al. 2004). Animals were monitored 24
for clinical signs by daily clinical observation and conventional blood-work ancillary diagnostics. At 25
necropsy, tissue samples were either immediately homogenized in solution D (4 M guanidinium 26
ACCEPTED
ACCEPTED
on July 1, 2018 by guesthttp://jvi.asm
.org/D
ownloaded from

6
thiocyanate, 25 mM sodium citrate, 0.5% sarcosyl, 0.1 M ß-mercaptoethanol), as previously 1
described (14,39) for macaque oligonucleotide arrays, snap-frozen for proteomics work and viral 2
isolation (see below), or fixed in 10% formalin for histology and immunohistochemistry. Methods for 3
viral isolation, serology, histopathology and immunohistochemistry were provided in a previous 4
manuscript (3). 5
Tissue processing for Macaque Oligonucleotide Arrays 6
Total RNA was isolated from areas of the lungs that had gross lesions, i.e. discoloration due to the 7
infection and in most cases consolidation as well. One animal (“Day 2 A”), sacrificed at day 2PI, had 8
a more discrete and hyperemic lesion in the accessory lobe, suggesting acute inflammation. Tissues 9
were collected at necropsy and immersed immediately in solution D. Tissue was homogenized 10
immediately for 30 seconds with a Kinematica Polytron PT1200 instrument and the model PT-11
DA1212/2 generator (Kinematica, Lucerne, Switzerland) in 10 ml round bottom polypropylene test 12
tubes with 5 ml of solution D. In order to reduce generation of aerosols during this process, the 13
Polytron’s generator was passed through a hole in the test tube lid which had been drilled in a manner 14
that insured a tight fit with the instrument. To further minimize possible contact with aerosols, a 15
barrier shield was used in addition to positive air pressure respirators and full protective personal 16
protection equipment. The homogenized samples were then snap-frozen on dry ice, and stored at –17
70°C. Total RNA was subsequently extracted according to current lab protocol (39). Whole blood 18
was collected for arrays and processed with the PAXgene™ Blood RNA System (PreAnalytix, 19
Qiagen, Valencia, CA) according to the manufacturer’s instructions. 20
Oligonucleotide Microarray analysis 21
Experimental design for microarray analyses involved infected macaque samples being co-hybridized 22
with a reference mock sample to a macaque oligonucleotide array containing 131 viral probes, 23
corresponding to 26 viruses, and 22,559 rhesus probes, corresponding to ~18,000 rhesus genes. A 24
complete description of this novel array is available upon request. The reference mock sample for 25
pulmonary tissues was created by pooling equal mass quantities of total RNA extracted from lung 26
ACCEPTED
ACCEPTED
on July 1, 2018 by guesthttp://jvi.asm
.org/D
ownloaded from

7
samples of three mock animals. The common reference mock sample for blood samples was created 1
by pooling equal mass quantities of total RNA extracted from whole blood samples of all nine 2
animals at Day 0 (prior to infection or mock infection). An Agilent 2100 bioanalyzer was used to 3
check the purity of the total RNA prior to cRNA probe production with the Agilent Low RNA Input 4
Fluorescent Linear Amplification kit (Agilent Technologies Inc., Palo Alto, CA). Slides were 5
scanned with an Agilent DNA microarray scanner and image analysis was performed using Agilent 6
Feature Extractor Software (Agilent Technologies). Each microarray experiment was done with two 7
technical replicates by reversing dye hybridization for experimental and reference samples (40). All 8
data were entered into a custom-designed database, Expression Array Manager, and then uploaded 9
into Resolver® 4.0 (Rosetta Biosoftware), DecisionSite™ for Functional Genomics (Spotfire, Inc.), 10
and Ingenuity Pathway Analysis (Ingenuity Systems) for analysis and mining. Initially, genes were 11
selected to be included for transcriptional profile based on two criteria: a greater than 99% probability 12
of being differentially expressed (P ≤ 0.01) and an expression level change of 2 fold or greater. For 13
study of gene expression in peripheral white blood cells, each experimental animal (day 0, day 2, day 14
4, and day 7) was compared to a pool of six animals at day 0. Using the re-ratio feature of Resolver, 15
we then compared each sample against that of the same animal at day 0 virtually, and in this manner 16
obtained a 7 PI time-course experiment where each animal was its own control. Finally, biological 17
gene sets (referred to as Biosets) were compiled for key cellular processes by selecting genes of 18
interest that were both represented on the microarray and which had Gene Ontology (GO) annotation 19
(29). In accordance with proposed standards (7), all data described in this report, including sample 20
information, intensity measurements, gene lists, error analysis, microarray content, and slide 21
hybridization conditions, are available in the public domain through Expression Array Manager at 22
http://expression.microslu.washington.edu/expression /index.html. 23
Quantitative real-time RT-PCR 24
Quantitative real-time RT-PCR (qRT-PCR) was used to validate presence of influenza mRNA found 25
by microarrays in lung tissue. Total RNA samples were treated with DNase using a DNA-free DNase 26
ACCEPTED
ACCEPTED
on July 1, 2018 by guesthttp://jvi.asm
.org/D
ownloaded from

8
kit (Ambion, Inc, Austin, TX). cDNA was generated using reverse transcription reagents and random 1
hexamers (Applied Biosystems, Foster City, CA). Primer and probe sets for each of the target 2
influenza HA and M, sequences are available as supplementary data. qRT-PCR was performed on the 3
ABI 7500 Real Time PCR System, using TaqMan chemistry (Applied Biosystems, Foster City, CA). 4
Each target was run in quadruplicate, in 20µL reaction volumes with TaqMan 2x PCR Universal 5
Master Mix (Applied Biosystems, Foster City, CA). GAPDH and 18S were chosen as endogenous 6
controls to normalize quantification of the target. Quantification of each gene, relative to the 7
calibrator, was calculated by the instrument, using the equation: 2-∆∆CT within the Applied 8
Biosystems Sequence Detections Software version 1.3. 9
Sample Preparation for Proteomics 10
During necropsy, lung tissue samples set aside for proteomic analysis were thoroughly rinsed in 11
saline, then snap-frozen on dry ice. Subsequently, frozen samples were rinsed in cold (4˚C) phosphate 12
buffered saline (PBS) and homogenized in high salt buffer (500 mM KCl, 20 mM MgCl2, 50 mM 13
Tris, pH 8.0) using repeating rounds in a Kinematica Polytron PT1200 instrument with the model PT-14
DA1212/2 generator (Kinematica, Lucerne, Switzerland) and dounce homogenization. The resulting 15
suspensions were centrifuged and the supernatant was retained and dialyzed extensively in 25 mM 16
NH4HCO3 with 5 changes of fresh buffer every 3 h. A bicinchoninic acid (BCA) assay (Pierce 17
Biotechnology, Inc., Rockford, IL) was performed to determine protein concentration. Equal amounts 18
of total protein from multiple animals were independently pooled to create a sample representing an 19
infected macaque and a sample representing an uninfected macaque to maximize protein coverage 20
when creating a database of macaque pulmonary tissue. Each sample was reduced in volume via 21
SpeedVac to ~0.5 mL, reduced (5 mM 2-methyl-2-tert-butylperoxy-propane or “TBP”), denatured 22
(50% 2,2,2-trifluoroethanol or “TFE”), and incubated for 1 h at 60 oC (~1 mL total volume per 23
sample). Samples were then diluted with 50 mM NH4HC03 to a final TFE concentration of 10% for 24
trypsin digestion. 25
26
ACCEPTED
ACCEPTED
on July 1, 2018 by guesthttp://jvi.asm
.org/D
ownloaded from

9
1
Trypsin Digestion 2
Sequencing grade-modified porcine trypsin was prepared as instructed by the manufacturer (Promega, 3
Madison, WI) and added to all protein samples at a 1:50 (w/w) trypsin-to-protein ratio for overnight 4
digestion at 37 oC. Samples were reduced by ~50% in volume via SpeedVac to remove any remaining 5
TFE, snap frozen in liquid nitrogen to interrupt trypsin activity, and stored at -80 oC until time for 6
analysis. 7
Peptide Enrichment and Separation 8
Additional SPE C18 (Discovery DSC-18, SUPELCO, Bellefonte, PA) clean up was performed to 9
insure the purity of the peptide samples for the cysteinyl-peptide enrichment step. Peptides were 10
eluted from the C18 column using 80% acetonitrile with 0.1% trifluoroacetic acid. Peptide samples 11
were concentrated down in a SpeedVac and a BCA protein assay was performed to determine the 12
final peptide concentration. Cysteinyl-peptide enrichment was performed on two pooled samples, 800 13
µg each of influenza-infected and mock-treated, where both the captured cysteinyl-peptide fraction 14
and the flow-through non-cysteinyl-peptide fraction were retained for further analysis. Cysteinyl-15
peptide enrichment has been previously described in detail (36,37), but briefly, the tryptic digests 16
were reduced with 5 mM DTT for 30 min at 37 °C, after which the samples were diluted 1:5 in 17
coupling buffer (50 mM Tris buffer, pH 7.5, 1 mM EDTA) and incubated for 1 h at room temperature 18
(RT) with Thiopropyl Sepharose 6B thiol-affinity resin (Amersham Biosciences, Uppsala, Sweden) 19
prepared per the manufacturer’s instructions. The unbound, non-cysteinyl-peptide fraction was 20
collected from the resin by spinning the column at low speed, removal of the supernatant, and then 21
washing in wash buffer (50 mM Tris buffer, pH 8.0, 1 mM EDTA), all of which were retained as the 22
non-cysteinyl-peptide fraction. For cysteinyl-peptide release, a 20 mM DTT solution in washing 23
buffer was added to the resin and incubated for 30 min at RT. The resin was further washed with 100 24
µL of 80% acetonitrile. The eluted sample was pH adjusted to 8.0, alkylated with 80 mM 25
ACCEPTED
ACCEPTED
on July 1, 2018 by guesthttp://jvi.asm
.org/D
ownloaded from

10
iodoacetamide for 30 min at RT, desalted by SPE C18 column as described above, and lyophilized to 1
reduce volume. 2
The non-cysteinyl-peptide fractions were subjected to strong cation exchange chromatography (SCX) 3
using a PolySulfoethyl A, 200 mm x 2.1 mm, 5 µM, 300-Å column with 10 mm x 2.1 mm guard 4
column (PolyLC, Inc., Columbia, MD) and details about this SCX peptide fractionation step have 5
been previously described in detail (36,37). The peptides were resuspended in 900 µL of mobile 6
phase A, and separated on an Agilent 1100 system (Agilent, Palo Alto, CA) equipped with a 7
quaternary pump, degasser, diode array detector, peltier-cooled autosampler and fraction collector 8
(both set at 4 ºC). A total of 25 fractions were collected for each sample resulting in two sets of SCX 9
fractions for the non-cysteinyl-peptide enrichments of both the influenza virus-infected and mock-10
infected lung tissue samples. No SCX fractionation was performed with the cysteinyl-peptide 11
enriched fractions due to the available amount of total recovered sample. 12
Reversed phase LC separation and MS/MS analysis 13
This method has been previously reported (74) with the coupling of a constant pressure (5,000 psi) 14
reversed phase capillary liquid chromatography (RPLC) system (150 µm i.d. × 360 µm o.d. × 65 cm 15
capillary; Polymicro Technologies Inc., Phoenix, AZ) and a Finnigan LTQ ion trap mass 16
spectrometer (ThermoFinnigan, San Jose, CA) using an electrospray ionization source manufactured 17
in-house. Each SCX fraction (+/- influenza) was analyzed via capillary RPLC-MS/MS, for a total of 18
56 analyses, 25 SCX-based analyses for each non-cysteinyl-peptide preparation combined with 3 19
analyses each for the cysteinyl-enriched peptide fractions 20
LC-MS/MS data analysis 21
SEQUEST analysis software was used to match the MS/MS fragmentation spectra with sequences 22
from the April 2005 IPI human database, containing 49,161 entries. The criteria selected for filtering 23
followed methods based upon a human reverse database false positive model which has been shown 24
to give ~95% confidence for the entire protein dataset (58). Briefly, protein identifications were 25
retained if their identified peptide met the following criteria: 1) SEQUEST DelCN value of ≥ 0.10 26
ACCEPTED
ACCEPTED
on July 1, 2018 by guesthttp://jvi.asm
.org/D
ownloaded from

11
and, 2) SEQUEST correlation score (Xcorr) ≥ 1.5 for charge state 1+ and full tryptic peptides, Xcorr 1
≥3.1 for partial tryptic peptides; Xcorr ≥ 1.9 for charge state 2+ and full tryptic peptides, Xcorr ≥ 3.8 2
for partial tryptic peptides; Xcorr ≥ 2.9 for charge state 3+ and full tryptic peptides, Xcorr ≥ 4.5 for 3
partial tryptic peptides. To remove redundantly identified proteins, the program ProteinProphet was 4
utilized (52). All peptides which passed our filter criteria were given the identical score of one, and 5
entered into ProteinProphet for redundancy analysis only. This condensed the number of proteins 6
detected from an initial 3,938 to a combined total of 3,548 proteins reported as identified, with >99% 7
of these proteins identified by a full tryptic peptide. Proteins had to pass a minimum criteria to be 8
used in a quantitative nature which is based on the analysis performed in previous reports by our 9
laboratory (36,57). Briefly, a protein needed to have a minimum of 5 total peptide identifications in 10
one of the samples so as to eliminate the inclusion of proteins which are not detected with enough 11
frequency to warrant quantitation, as well as have at least a 3.0 fold increase/decrease in the relative 12
abundance measurements between the two samples. 13
14
RESULTS 15
Progression and patterns of global gene expression from Day 2 to 7 PI in influenza virus-16
infected macaques 17
Six animals were inoculated with reconstructed A/Texas/36/91 influenza virus, a mildly 18
pathogenic H1N1 strain in humans, at day 0. Clinical samples were collected during the study and 19
tissues were harvested at the assigned endpoints. The same was done for three mock-infected animals 20
in a control phase of the study performed temporally apart to avoid cross-infection by infected 21
animals. All animals in the experimental group showed signs of infection based on three criteria: 22
clinical signs, gross and/or microscopic lung pathology, and tracheobronchial lymph node pathology. 23
Foci of pneumonia, hyperemia, or consolidation were used for antigen staining and extraction of total 24
RNA. We were successful in detecting influenza mRNA – by array and qRT-PCR (HA and M) - from 25
two infected animals (“Day 2 A” and “Day 7 B”) (data not shown) and intranuclear viral antigen in 26
ACCEPTED
ACCEPTED
on July 1, 2018 by guesthttp://jvi.asm
.org/D
ownloaded from

12
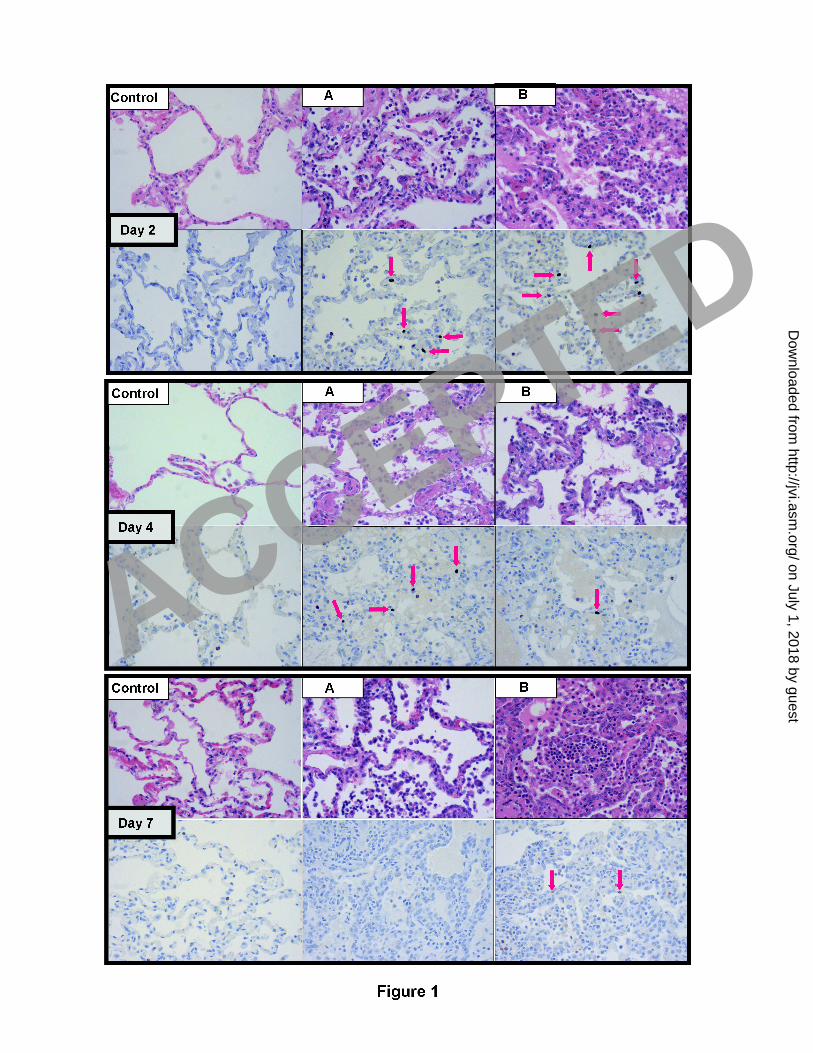
five (“Day 2 A”, “Day 2 B”, “Day 4 A”, “Day 4 B”, and “Day 7 B” as shown in Figure 1). Figure 1 1
illustrates representative histopathology and immunohistochemistry (using an antibody against the 2
viral NP) for all experimental animals. Clinical signs, pathology, antigen detection, and influenza 3
mRNA positivity results are summarized in Table 1 and reported in detail as supplementary data. 4
In order to test the hypothesis that the presence or absence of influenza viral mRNA within a 5
sample had a significant effect on global gene expression, we performed array analysis on samples 6
from areas that were close to the main lesion yet looked distinct from one another by visual 7
examination. Because animal “Day 2 A” had a very discrete and hyperemic lesion in the accessory 8
lobe, multiple samples were taken from within this acute lesion and the immediate surrounding area. 9
Three samples from this animal were selected for inclusion in transcriptional profiling, including two 10
which were positive for viral mRNA. These profiles were obtained by comparing total RNA isolated 11
from affected lung areas to that isolated from lung of mock-infected animals. Selecting parameters of 12
fold cut-off > 2 with p < 0.01, samples from animals with detectable viral mRNA showed greater 13
gene expression changes (~1,300 genes) compared to samples from animals with non-detectable viral 14
mRNA (~200 genes), indicating a definite response of lung tissue to the virus. 15
Unsupervised hierarchical clustering methods were used to order rows (genes) and columns 16
(samples) to identify groups of genes or samples with similar expression patterns (13,73). “Day 2 A 17
(I+P+)” was positive for viral mRNA (I+) and within the main acute lesion (P+), “Day 2 A (I+)” was 18
positive for viral mRNA and adjacent to the lesion, and “Day 2 A” was negative for viral mRNA and 19
adjacent to the lesion as well. Sample “Day 7 B (I+)” was also positive for viral mRNA and was 20
harvested from an area of consolidation in that animal. These data were plotted as a heat map where 21
each matrix entry represents a gene expression value. Red corresponds to higher gene expression than 22
that of the controls; green corresponds to lower gene expression (Figure 2A). Since it was anticipated 23
that factors such as presence or absence of viral mRNA, timing after inoculation, and genetic 24
similarity between samples from the same animal could all impact clustering, cut-off parameters were 25
further restricted so as to hold true for any one gene in at least two of the eight samples. This analysis 26
ACCEPTED
ACCEPTED
on July 1, 2018 by guesthttp://jvi.asm
.org/D
ownloaded from

13
yielded 1373 genes with the two samples (I+ and I+P+) from animal “Day 2 A” clustered next to one 1
another with the third sample from animal “Day 2 A” in close proximity, corroborating the assumed 2
influence of genetic similarities among samples from the same animal. The expression profile of 3
sample “Day 7 B (I+)” was within close proximity to those three, indicating that presence of 4
influenza mRNA was indeed a key factor in determining transcription of cellular genes, 5
independently of timing after infection. 6
Impact of influenza viral mRNA on expression of genes relevant to the innate and adaptive 7
immune responses 8
Not surprisingly, the presence of influenza viral mRNA in lung tissue, suggesting recent viral 9
replication, had a strong influence on induction of the innate immune response and subsequent T cell 10
and B cell activations. As an extension of global profiling, we focused on the effect of the virus by 11
identifying differentially expressed genes common to both positive samples “Day 2 A (I+, P+)” and 12
“Day 2 A (I+)”, and expanded the analysis by looking for commonalities between these two samples 13
and the positive sample “Day 7 B (I+)”. Genes of interest preferentially induced by the virus - with a 14
fold change > 2 and p < 0.01 - only in “Day 2 A (I+, P+)” and “Day 2A (I+)” are shown on the left 15
panel of Figure 2B whereas the ones induced in “Day 2A (I+, P+)”, “Day 2A (I+)” and “Day 7B 16
(I+)” are shown on the right panel. The intersection of “Day 2 A (I+, P+)” and “Day 2 A (I+)” holds a 17
total of 572 differentially expressed genes, including 195 genes co-regulated in “Day 2 A (I+, P+)”, 18
“Day 2 A (I+)” and “Day 7 B (I+)”. Both heat map panels should represent what took place during a 19
localized host response to infection (where viral mRNA is present). The left panel focuses on 20
transcriptional events present only early in infection in one animal. The right panel, with virus 21
positive samples from animal “Day 2A” and animal “Day 7B” represents those changes occurring at 22
both early and later stages of infection, and suggests what consistent strategies the host uses to 23
combat viral replication for the duration of the infection and in different animals. 24
The two samples from animal “Day 2 A” showed a remarkable state of interferon induction, 25
with several genes upregulated by over 5 fold [IFITL1, MX1, MX2, IFI44, IFIT1, OAS1] and even 26
ACCEPTED
ACCEPTED
on July 1, 2018 by guesthttp://jvi.asm
.org/D
ownloaded from

14
over 10 fold [IFIT2, IFIT3, and G1P2], as shown in Figure 2B. Of note, similar but much attenuated 1
expression patterns could be observed in the other Day 2 animal (“Day 2 B”) and Day 4 animals 2
(“Day 4 A” and “Day 4 B”), indicating consistent but progressively decreased induction of this 3
response. On the left panel, of all of the other samples, Day 2A is the one more similar to Days 2A 4
(I+) and Day 2A (I+P+), suggesting that the IFN signature is also present adjacent to lesions but in 5
areas where viral infection has not been detected, consistent with the paracrine effects of IFN. When 6
focusing on localized host response for the duration of the infection by looking at genes differentially 7
expressed exclusively in the two positive samples from animal “Day 2 A” and at the same time in the 8
positive sample from animal “Day 7B”, fewer genes were found (195 versus 377 exclusive to the 9
positive “Day 2 A” samples), but more of these were annotated as having functions in the immune 10
response to infectious disease, or in generic pulmonary stress. Many of these genes, upregulated by at 11
least 5 or 10 fold (LGALS9, IRF7, ISG20, GBP1, CXCL10, KRT15, CXCL13, CXCL11, and 12
PLA2G4C) showed similar expression in other animals and at other time points perhaps representing 13
common markers of infection. Interestingly, SCGB3A2 (secretoglobin, family 3A, member 2) was 14
downregulated by over 10 fold in all flu mRNA-positive samples: This gene has been implicated in 15
controlling transcription of lung surfactant proteins and is found to be expressed by Clara-like cells in 16
the bronchial epithelium (6). In conclusion, an interferon signature response was induced early in 17
infection while other immune and cytokine responses were sustained throughout the course of the 18
infection. 19
Because viral mRNA was shown to be a key factor in determining transcription of cellular 20
genes, two critical immune pathways were investigated by recombining in silico “Day 2 A (I+, P+)”, 21
“Day 2 A (I+)”, and “Day 7 (I+)” to generate a “+viral mRNA” average and by recombining in silico 22
“Day 2 A”, “Day 2 B”, “Day 4 A”, “Day 4 B”, “Day 7 A” to generate a “no viral mRNA” average. 23
We performed a pathway-based analysis by looking at genes specifically regulated as part of the 24
innate immune response and involved in regulation of T and B cell activation and proliferation. 25
Figures 3A and 3B illustrate the differences between samples positive for influenza mRNA and 26
ACCEPTED
ACCEPTED
on July 1, 2018 by guesthttp://jvi.asm
.org/D
ownloaded from

15
samples negative for influenza mRNA. Many genes classically associated with interferon signaling 1
were shown to be activated in animals with pulmonary viral mRNA: IFNγ, IFNβ, STAT1, ISGF3G, 2
IRF7, and NFKB1, among other genes induced either as part of the JAK-STAT pathway or through 3
the interferon stimulated response element. Among genes that were most affected were those coding 4
for chemotactic factors, regulating cell adhesion (CCL-, CCR-, and CXCL-), and those associated 5
with dendritic cell (CD83) or natural killer cell function (CD48) (Figure 3A). Interestingly, MX1, 6
OAS1, and OAS3 were shown to be upregulated in all animals, regardless of viral mRNA presence, 7
again suggesting that the IFN signature is also present adjacent to lesions but in areas where viral 8
infection has not been detected, consistent with the paracrine effects of IFN. 9
An important effect of autocrine and paracrine exposure to the virus, as defined by the 10
response in infected cells versus the response of neighboring cells to type I interferon, was the strong 11
induction of T cell proliferation and activation, as shown in Figure 3B. This activation encompassed 12
both cytotoxic T cells (Tap1, GZMB, IFNγ) and T helper cells, as evidenced by the concurrent 13
stimulation of B cells. This robust T cell response in infected lung tissue would be expected to be 14
moderated by the strong expression of TNFα, known to decrease chemotaxis and increase apoptosis 15
of T cells (1,21), and INDO, which decreases T cell proliferation (35). In fact, it would appear from 16
the induction of genes coding for B cell products, including IL6, and from the downregulation of 17
IGLL1, produced by B cell precursors, that the B cell response was well under way even at day 2 PI. 18
Co-regulation of genes in peripheral blood and infected lung tissue 19
Currently there are adequate methods for diagnosing influenza soon after onset of viral 20
shedding, yet these diagnostic tests demonstrate limited specificity or sensitivity (56,66,76) and do 21
not hold prognostic value. While gene expression profiling in lung tissue may provide valuable 22
insights into influenza pathogenesis and successful host response, gene profiling in blood could 23
complement or even replace in some instances lung tissue collection, help in identification of the 24
pathogen, and perhaps predict pathology to come. So far, there have been only a handful of studies 25
investigating the effect of pulmonary infections on gene expression in peripheral white blood cells in 26
ACCEPTED
ACCEPTED
on July 1, 2018 by guesthttp://jvi.asm
.org/D
ownloaded from

16
vivo (62,84). Most often, transcriptional studies are performed on white blood cells after in vitro 1
culture and a number of other manipulations. We were interested in using blood as a snapshot of the 2
ongoing lung infection and potentially as an indicator of disease progression in the animal as a whole. 3
Our study included the use of blood collection tubes (PAXgene Blood RNA System) that stabilize 4
RNA in whole blood, so the effects of handling and storage on active transcripts were minimized 5
(11,16,61). In this manner, we were able to study gene expression in all white blood cells as opposed 6
to only peripheral mononuclear cells. 7
In order to begin investigating the effects of influenza virus infection in pulmonary tissue on 8
peripheral blood, expression profiles were obtained by comparing total RNA isolated from whole 9
blood of animals “Day 7 A” and “Day 7 B” at day 2, day 4, and day 7 post infection to a pool of total 10
RNA isolated from whole blood of all nine animals at day 0. Using a re-ratio feature in silico, we 11
then compared each sample against the day 0 sample from that same animal, and in this manner 12
obtained a 7 day PI time-course experiment where each animal was its own control. Figure 4 13
illustrates the close regulation between genes in blood samples taken at day 2 PI (left panel, first two 14
columns) and genes regulated in viral mRNA positive lung samples, also harvested at day 2PI (right 15
panel, first two columns), but from a different animal. This gene expression similarity in the blood 16
samples (left panel) was sustained throughout the course of infection, albeit to a lesser extent. This 17
expression profile included a considerable proportion of interferon-induced genes (IFI-, G1P-, GBP-, 18
IRF7, INDO, and cig5) and antiviral genes MX1, MX2, OASL, OAS1, and OAS3 (also induced by 19
interferon). A number of these genes were similarly expressed in blood at Days 4 and 7 (Red font in 20
Figure 4), which, if these findings were confirmed, could expand the useful window for a prognostic 21
test based on peripheral white blood cells transcriptional profiling. Several of the genes shown to be 22
regulated in blood were also regulated at multiple time points in the lungs (red arrows in Figure 4) as 23
shown in the right panel. APOL2 and PLA2G4C are known to be involved in the acute phase 24
response (23), with PLA2G4C being regulated both by collagen and interferon. IRF7, INDO, and 25
GBP1 play roles in the immune response, especially inflammatory stress. Both GBP1 and IRF7 are 26
ACCEPTED
ACCEPTED
on July 1, 2018 by guesthttp://jvi.asm
.org/D
ownloaded from

17
well known components of induction of host response to viruses (2,51). While FBXO6 is not as 1
closely related to host-immune response, there is some precedence for F-box proteins playing a 2
critical role in the controlled degradation of cellular regulatory proteins (10). 3
4
Proteome analysis of infected and control lung samples yield results consistent with influenza 5
virus infection 6
Several observations point to the importance of monitoring the proteins expressed in a cell or 7
tissue and relating these to mRNA expression measurements in order to maximize the chance of 8
identifying biomarkers of the conditions being studied and uncovering cellular mechanistic pathways 9
that contribute to disease processes. Perhaps most notable is the often poor to moderate correlation 10
(e.g. < 40% concordance) between the relative expression abundance of a gene and its biologically 11
active protein product (12,15,27,77) which can arise, for example, from differences in their rates of 12
synthesis and turnover. Moreover, the limited presence of mRNA in body fluids restricts 13
identification of clinically relevant disease biomarkers to the measurement of secreted proteins in 14
these samples. Additionally, phenotypic protein variations (e.g. modification, interaction with other 15
proteins, subcellular distribution, and activity) that confer or modify protein function can not be 16
predicted from mRNA measurements. For these reasons, we have begun to expand upon our 17
functional genomics efforts by constructing a macaque lung protein database and subsequently 18
analyzing the protein abundance changes that occur in macaques infected with influenza. A total of 19
14,100 peptides and 3,548 proteins were identified for the entire study (Table 2). Among the proteins 20
identified were many candidates of particular interest based on gene expression in the lung and 21
peripheral blood (Fig. 2B and 4) as well as previous clinical, pathological and gene expression data 22
initially demonstrating the suitability of the non-human primate model for studying influenza virus 23
pathogenesis (3). The proteins identified included several well known interferon-induced proteins 24
(e.g. MX1, IFI-, GBP- and STAT1) and other non-cellular mediators of the innate immune response 25
ACCEPTED
ACCEPTED
on July 1, 2018 by guesthttp://jvi.asm
.org/D
ownloaded from

18
(elements of the complement pathways: C7 and C5) (Figure 5). Additional examples include proteins 1
relevant to neutrophil and monocyte/macrophage function (e.g. MIF, MMP9, and MNDA). 2
The ability to globally profile changes in protein abundance is essential for elucidating the 3
events that occur during cellular processes. The macaque lung protein database described here lays 4
the foundation for subsequent comparative quantitative proteomic studies of non-human primate 5
models of influenza virus infection using stable isotope labeling strategies. While such a detailed 6
proteomic characterization is beyond the scope of this study, we have taken advantage of the “semi-7
quantitative” relationship between the total number of peptide identifications and the relative 8
abundance of the corresponding protein in a sample (24,47,57) as a first pass means of detecting 9
changes in protein abundance when comparing uninfected and influenza virus-infected lung tissue 10
samples. This approach has been verified in our laboratory where we previously described 11
perturbations in the abundance of a variety of proteins using an in vitro model system for HCV 12
replication (36). We observed an apparent upregulation of MX1, an interferon-induced protein 13
involved in the innate immune response, and C7, a non-cellular mediator of the innate immune 14
response which is consistent with the establishment of an antiviral state in the lungs of influenza 15
virus-infected macaques. Additionally, by mining proteins having functional annotations of interest, 16
we identified three proteins (MIF, C7, and GBP2) whose changes in relative abundance would not 17
have been predicted from analysis at the mRNA level. These findings are consistent with previous 18
studies demonstrating that mRNA and protein levels do not necessarily correlate, thus pointing to the 19
complementarity of high throughput proteomic studies for assisting in the determination of 20
proteins/pathways affected by influenza virus infection. 21
22
DISCUSSION 23
Suitability of non-human primate model for influenza studies. This study represents the first 24
complete investigation of a macaque model of influenza A virus infection, using both classical 25
infectious study protocols and the powerful technologies of functional genomics and proteomics. Our 26
ACCEPTED
ACCEPTED
on July 1, 2018 by guesthttp://jvi.asm
.org/D
ownloaded from

19
experimentally infected macaques showed signs of successful infection based on clinical features and 1
pathology, indicated in Table 1. Several of these features such as rhinorrhea and conjunctivitis, are 2
similar to symptoms in humans yet absent in mice infected with the same mildly pathogenic human 3
virus. Likewise, the limited extent of pathology and viral replication in these non-human primates 4
resembles the human disease to a much greater extent. These findings emphasize that what occurs in 5
inbred mice may not be as relevant to human host-virus interaction as an outbred mammalian model 6
that can become naturally infected (38). For instance, ferrets have been successfully used to 7
investigate the contribution of host-related factors to influenza virus pathogenesis, particularly H5N1 8
subtypes (26,85). Unfortunately, limited genomic resources for ferrets render high-throughput 9
analysis currently impossible in this species. By contrast, a macaque model combines close 10
phylogenetic relationship and great similarities of immune response and physiology to humans. Their 11
size also makes them more amenable to discriminate response and pathology in different areas of the 12
lungs, generate large enough samples for multiple analyses, and allow serial sampling. 13
Consistently, pulmonary samples showed heterogeneity in gene expression, and the ability to 14
compare signatures from samples very close anatomically but with or without presence of influenza 15
virus mRNA yielded new and valuable information about the effects of the virus on surrounding cells 16
at the transcriptional level. At the same time, expression profiling suggested significant similarities in 17
different lung samples from the same animal and even similarities in different experimental animals. 18
Therefore, these findings contributed to alleviating the concern that transcriptional profiling may be 19
too heavily influenced by individual variation to be of practical use in studying host-virus interaction. 20
Commitment to this approach and systematic sampling is especially important when working with 21
mildly pathogenic viruses because this graduated tissue response to virus may discern subtle yet 22
telling differences. This understanding is important because it will help us characterize the 23
constituents of a successful response to the insult at the tissue level or at the level of the entire host. 24
By analyzing individual samples rather than pooling them, gene expression patterns were not 25
artificially diluted and samples with evidence of recently replicating virus could be used to study 26
ACCEPTED
ACCEPTED
on July 1, 2018 by guesthttp://jvi.asm
.org/D
ownloaded from

20
direct effects of the infection while samples lacking viral mRNA helped further define the host 1
response. For instance, higher interferon pathway induction in tissues more directly affected by 2
influenza virus was not surprising since secretion of interferon by infected cells induces interferon-3
sensitive genes in other cells whose protein synthesis machinery is not redirected toward making viral 4
particles. On the other hand, the early and significant induction of T and B cell activation and 5
proliferation pathways in tissues where influenza mRNA could be found was more intriguing in part 6
because of its timing early in infection and because of its dependence on autocrine or paracrine 7
effects of the virus. The bulk of T and B cell activation takes place in peripheral lymph nodes 8
draining infected tissue, subsequent to antigen presentation. However, B cells are currently thought to 9
also present exogenous antigens through still incompletely characterized MHCI pathways to cytotoxic 10
T cells, a possibility that would increase the importance of their role during early influenza virus 11
infection (64,65,80). Induction of T and B cell pathways in lung tissue at day 2 PI could indeed be 12
compatible with activation of B cells through less specific BCR-antigen interactions. These 13
interactions were shown to result in a lower activation threshold for B cell intracellular signaling and 14
antigen processing for presentation to T lymphocytes (5). 15
Transcriptional signature of pulmonary infection in whole blood Although blood work is 16
typically unremarkable and viremia is undetectable during infection with a mildly pathogenic 17
influenza virus (9), chemotaxis and activation of immune cells responding to a localized viral 18
infection is detectable at the systemic level. It has been previously suggested that while viral 19
replication is intrinsically capable of producing extensive damage to respiratory epithelium directly, 20
the host immune cell response may significantly enhance pulmonary damage well beyond the 21
immediate vicinity of infected cells (17). In line with this concept, we tried to detect early signatures 22
in peripheral blood reflecting the effects of localized pulmonary influenza virus infection. There are 23
currently only a handful of studies investigating the effect of pulmonary infection on gene expression 24
in peripheral leukocytes in vivo (62,84). Most often, transcriptional studies are performed on white 25
blood cells after in vitro culture and infection. Our studies showed a number of genes consistently 26
ACCEPTED
ACCEPTED
on July 1, 2018 by guesthttp://jvi.asm
.org/D
ownloaded from

21
expressed within both peripheral white blood cells and lung samples positive for viral mRNA, 1
particularly interferon-induced genes. Blood cells did not have viral mRNA detected by microarray as 2
the infection was local to pulmonary tissues, without viremia, indicating that changes do not reflect 3
infection of blood cells, but rather circulating cytokines and chemokines. Even with limited 4
infiltration of white blood cells in lung tissue, highly activated immune cells in lung tissue account for 5
at least part of the co-regulation observed. The disproportionate involvement of interferon genes 6
induced in peripheral white blood cells also raises the question of whether any acute respiratory viral 7
infection would give similar transcriptional profiles. Current but very limited comparisons between 8
SARS and influenza in patients seem to suggest otherwise (62), indicating the possibility of unique 9
signatures for respiratory infectious agents. Finding these unique signatures is possible if there is a 10
continued commitment to using functional genomics as opposed to classical cytokines and antiviral 11
protein assays. 12
Relationship to Human Infections Classical cytokine studies have previously examined protein 13
levels using ELISA assays in nasal lavage fluid, plasma, and serum from volunteers experimentally 14
infected with influenza A/Texas/36/91 virus (22,31). IL6, TNFα, IL8, IFNα, IFNγ, IL10, CCL3 15
(MIP1α), CCL4 (MIP1β) and CCL2 (MCP-1) were elevated in nasal lavage fluid, and IL-6 and IFNγ 16
were elevated to a lesser extent in plasma. Our macaque studies concurred with these findings at the 17
transcriptional level for TNFα and IL6 in pulmonary tissue. Additional cytokines not detected in the 18
human studies were expressed as a result of the macaque infection in peripheral leukocytes (IL1β and 19
TGFβI) and in pulmonary tissue (TGFβI). Of note, only IL6 was induced in pulmonary tissue of mice 20
infected with influenza A/Texas/36/91 virus (unpublished data). CCL2 (MCP-1) expression was also 21
elevated in macaque pulmonary samples, but differed from results in the human study in that the 22
response was early as opposed to sustained, perhaps a reflection of the fact that our data measured 23
transcription as opposed to protein levels. What we have learned from our macaque model and 24
functional genomics approach of cytokine and chemokine responses during influenza virus infection 25
could be implemented in the context of human studies. Our examination of cytokines and 26
ACCEPTED
ACCEPTED
on July 1, 2018 by guesthttp://jvi.asm
.org/D
ownloaded from

22
chemokines expressed in macaque pulmonary tissue revealed CCL19 (MIP3β), CCL11, CXCL11 (IP-1
9), CXCL13, CXCL10 (IP-10) and IL4I1 as attractive candidates for future investigation: For 2
instance, CCL19, CXCL13, CXCL10, and CCL11 were highly induced by infection and have known 3
roles in recruiting leukocytes to sites of inflammation. These could potentially be detected to a lesser 4
extent at sites of infection in humans infected intra-nasally with influenza virus. Likewise, CXCL11 5
and IL4I1, although previously lacking known association with influenza infection, had significant 6
enough responses to the presence of viral mRNA in pulmonary samples of macaques to warrant 7
inclusion in future cytokine/chemokine lavage assays. 8
Proteomics as complement to genomics. With the advent of a 22k macaque oligonucleotide array, 9
we have achieved superior genomic coverage and minimal standard error with our probe signals. We 10
have supplemented our genomic coverage with proteomics data in an effort to move our study into 11
the realm of a true functional global host response investigation. The utilization of refined, high 12
resolution multidimensional chromatographic separations that reduce sample complexity and the 13
range of relative protein abundances enabled the identification of > 3,000 proteins in macaque lung 14
tissue. To our knowledge, this work represents the first comprehensive proteomic characterization 15
yet reported for a non-human primate model system providing a baseline for characterization of 16
influenza virus-induced perturbations in the cellular environment, identification of potential targets 17
for future antiviral treatment, and future comparative studies involving antiviral drug screening and 18
evaluation for therapeutic intervention. To this end, we have used a semi-quantitative approach 19
(described above) to take a first look at lung protein abundance changes associated with influenza 20
virus infection. Consistent with gene expression data demonstrating the establishment of an antiviral 21
state in the lungs of influenza virus-infected macaques, our proteomic analyses also revealed an 22
increase in the abundance of proteins in the lungs involved in the innate immune response. 23
Furthermore, the complementary nature of proteomic studies was evidenced by the identification of 24
changes in relative protein abundance that would not have been predicted from gene expression 25
measurement thus demonstrating the potential of proteomics for assisting in the determination of 26
ACCEPTED
ACCEPTED
on July 1, 2018 by guesthttp://jvi.asm
.org/D
ownloaded from

23
novel as well as previously described pathways affected by virus infection. To get a truly integrative 1
view of the host molecular signature in response to influenza virus infection, we compared genomics 2
profiles in blood and lungs to proteomic profiles in lung in order to start identifying potential 3
biomarkers indicative of influenza infection. Our method shows that host response measured by 4
pulmonary protein profiling is consistent with trends observed with genomic profiling, both in the 5
lungs and peripheral blood (Figure 6). Statistical significance will be gained as refinements are made 6
to the protocols of processing macaque protein samples and the implementation of a macaque 7
proteomics database. Still this work has shown that even when screening macaque peptide hits to a 8
human protein database, proteomics data augments robust genomics data to give a more complete 9
picture of the host response to influenza virus infection. 10
Conclusion. By integrating macaque-based functional genomics, both microarrays and mass 11
spectrometry, we have refined an integrated multi-faceted macaque model of influenza virus 12
infection. The field of virus-host bioinformatics has expanded greatly in the past few years and efforts 13
are being undertaken to improve methodologies for compendium analyses, including software tools 14
for visualizing genomic and proteomic data simultaneously, beginning with established human 15
databases and progressing to establish macaque genomic and proteomic databases. As more wild-type 16
and mutant viruses showing differences in pathogenicity are studied in the macaque model, host-17
related factors leading to a successful outcome and viral gene combinations leading to host demise 18
will be better understood. This strategy, combined with the concurrent profiling of markers in 19
peripheral blood, and with the investigation of molecular basis for pathogenesis in cell culture may 20
ultimately lead to effective early prognostic tools for influenza. 21
22
ACKNOWLEDGMENTS 23
The authors would like to acknowledge the following individuals: Rosalind Billharz, Olivia 24
Perwitasari, Jim Wallace and Doug Chan from the Katze laboratory, and Leon R. Flanary from the 25
ACCEPTED
ACCEPTED
on July 1, 2018 by guesthttp://jvi.asm
.org/D
ownloaded from

24
Washington National Primate Research Center for their intellectual contributions and technical 1
assistance. 2
Portions of this research were supported by the NIH National Center for Research Resources (grant 3
RR018522 to R.D.S.), the National Institute of Allergy and Infectious Diseases (grant P01 AI058113 4
to A.G-S. and M.G.K.), the National Institute on Drug Abuse (grant 1P30DA01562501 to M.G.K.), 5
and the Environmental Molecular Sciences Laboratory at PNNL, Richland, WA, for use of the 6
instrumentation applied in this research. The Environmental Molecular Sciences Laboratory, a 7
national scientific user facility sponsored by the Department of Energy's Office of Biological and 8
Environmental Research and located at Pacific Northwest National Laboratory. Pacific Northwest 9
National Laboratory is operated by Battelle Memorial Institute for the U.S. Department of Energy 10
under Contract No. DE-AC06-76RLO 1830. 11
12 FIGURE LEGENDS 13 14 Figure 1: For each day post infection (Day 2, Day 4, Day 7) are shown progressive microscopic 15
histopathological changes (top panels) and influenza antigen staining (bottom panels). Red arrows 16
point to discrete intra-nuclear staining in respiratory epithelium and denote presence of viral 17
nucleoprotein (NP) antigen, indicative of recent active infection. Samples from a mock-infected 18
animal are included for each day to show lack of pathology (top panels) and non-specific 19
cytoplasmic staining of neutrophils (lower panels). All photographs were taken at 40X optical 20
magnification. 21
22
Figure 2A: Unsupervised Clustering of Gene Expression Profiles. The profiles of animal A show 23
similarities based on the fact that they were sampled from the same animal while viral mRNA 24
positive samples showed similarities as well. “Day 2 A (I+P+)” was positive for viral mRNA and 25
within the main lesion, “Day 2 A (I+)” was positive for viral mRNA and adjacent to the lesion, and 26
“Day 2 A” was negative for viral mRNA and adjacent to the lesion as well. All gene expression 27
profiles are the results of comparing gene expression in lungs of individual experimental animals 28
ACCEPTED
ACCEPTED
on July 1, 2018 by guesthttp://jvi.asm
.org/D
ownloaded from

25
versus gene expression in lungs of mock-infected animals (pooled), and genes were included if they 1
met the criteria of a two-fold change or more (P≤0.01). A two-of-eight strategy allowed samples to 2
cluster together if profile similarities existed based on timing of inoculation (n=2 samples for each 3
day). A three-of-eight strategy allowed samples to cluster together if profile similarities existed based 4
on presence or absence of viral mRNA (n= 3 samples with viral mRNA): or based on the provenance 5
of the samples from the same animal (n=3 samples from animal “Day 2 A”). Very similar clusters 6
were obtained in either case, so only one is represented here. 7
8
Figure 2B: Venn diagrams showing genes with a fold change > 2 and p < 0.01 in samples Day 2 A 9
(I+P+), Day 2 A (I+), and Day 7 B (I+) [Upper Venn Diagram]; and in samples Day 2 A (I+P+) and 10
Day 2 A (I+) but not in sample Day 7 B (I+) [Lower Venn Diagram]. Although there were fewer 11
genes within the intersection of the three samples (195 genes), a greater proportion of these genes 12
were annotated and had functions relevant to the immune response, infectious disease, or pulmonary 13
stress. Heat maps show the same genes regulated in day 2, 4, and 7 lung samples. All gene expression 14
profiles are the results of comparing gene expression in lungs of individual experimental animals 15
versus gene expression in lungs of mock-infected animals (pooled). 16
17
Figure 3A: Innate Immune Response in Lung Tissue with or without Viral mRNA. The top bar of 18
individual gene heat maps was created by combining expression data for samples Day 2 A (I+P+), 19
Day 2A (I+), and Day 7 B (I+), where viral mRNA was detected by array. The bottom bar was 20
created by combining expression data for samples Day 2 A, Day 2 B, Day 4 A, Day 4 B, and Day 7 21
A, where no viral mRNA was detected. As in classical heat-maps, brighter colors indicate stronger 22
gene induction in combined samples, red signifying up-regulation and green down-regulation. This 23
illustrates the significant impact of the presence (top bar) or absence (bottom bar) of influenza viral 24
mRNA on gene expression, even among essentially similarly affected portions of the same lung or 25
among animals that were all infected. We selected probes with the strongest signals for any one gene 26
ACCEPTED
ACCEPTED
on July 1, 2018 by guesthttp://jvi.asm
.org/D
ownloaded from
26
for the purpose of these diagrams. All shown data are the results of comparing combined gene 1
expression in lungs of experimental animals– as described above - versus gene expression in lungs of 2
mock infected animals (pooled). This figure was produced using the Resolver® 4.0 (Rosetta 3
Biosoftware) and Pathway Builder Tool (Protein Lounge, San Diego, CA). 4
5
Figure 3B: T& B cell Regulation in Lung Tissue with or without Viral mRNA. All red arrows 6
indicate activation and/or secretion. All black arrows indicate inhibitory interactions. The top bar of 7
each heat map anchor was created by combining ratio experiments for Day 2 A (I+P+), Day 2 (I+), 8
and Day 7 B (I+), experiments where viral mRNA was detected by array. The bottom bar of each heat 9
map anchor was created by combining ratio experiments for Day 2 A, Day 2 B, Day 4 A, Day 4 B, 10
and Day 7 A. This illustrates the significant impact of the presence or absence of influenza viral 11
mRNA on gene expression, even among essentially similarly affected portions of the same lung or 12
among animals that were all infected. We selected probes with the strongest signals for any one gene 13
for the purpose of these diagrams. All heat map anchors are the results of comparing combined gene 14
expression in lungs of individual experimental animals – as described above - versus gene expression 15
in lungs of mock-infected animals (pooled). This figure was produced using the Resolver® 4.0 16
(Rosetta Biosoftware) and Pathway Builder Tool (Protein Lounge, San Diego, CA). 17
18
Figure 4: Co-regulated genes in blood and infected tissue. The heat map on the left indicates 19
differential expression of blood taken from two animals (Day 7A and Day 7B) at Day 2, Day 4, and 20
Day 7. To indicate that these are blood samples, a and b are small font. The heat map on the right 21
indicates differential expression of pulmonary tissue collected from six animals. To indicate that 22
these are pulmonary samples, A and B are capital font. This figure shows strong and early co-23
regulation of a set of genes in peripheral white blood cells and in lung tissue where influenza viral 24
mRNA was detected by arrays, even in different animals. This set was obtained by unsupervised 25
clustering of genes in blood and in lung tissue positive for viral mRNA, and selecting genes that were 26
ACCEPTED
ACCEPTED
on July 1, 2018 by guesthttp://jvi.asm
.org/D
ownloaded from

27
regulated by a factor of 2 fold or more (P≤ 0.01) in all 4 experiments. Some of these genes were still 1
similarly regulated at day 4 and day 7 in blood as shown in the left heat map (red font). Several of 2
these genes shown to be regulated in blood were also regulated at multiple time points in the lungs 3
(red arrows) as shown in the right heat map. Brackets indicate genes whose profile in blood must be 4
interpreted with caution because expression at day 0 in these individual blood samples varied by 4-5
fold or more from that in all animals combined at day 0. All gene expression profiles in lungs are the 6
results of comparing gene expression in individual experimental animals versus gene expression in 7
mock-infected animals (pooled). All gene expression profiles in blood are the results of comparing 8
gene expression samples from individual experimental animals at the indicated time point versus that 9
in day 0 in the same animal. 10
11
Figure 5: This bar graph shows the total number of peptide identifications for proteins having 12
previously known associations with influenza virus infection or acute respiratory distress. Those 13
proteins exhibiting an apparent regulation during influenza virus infection are indicated with an 14
asterisk. Apparent regulation indicates that the protein was identified with at least 5 peptides, and 15
also showed at least a 3 fold increase/decrease between samples from flu-infected and mock-infected 16
animals. 17
18
Figure 6: This diagram shows the overlap between proteins detected by mass spectrometry in 19
pulmonary samples and mRNA detected by gene expression in pulmonary and peripheral blood 20
samples. Red indicates induction and green repression. We have selected to highlight genes/proteins 21
that showed concordance in the top panel. In addition, we show three proteins that were not 22
previously identified using genomics alone. Gene expression: “++”indicates genes meeting the fold 23
change > 2 and p < 0.01 criteria; “+” indicates genes that showed a consistent trend as far as induction 24
or repression, but did not make the array statistical cut-off. Gene expression results to determined 25
trends were either combined in silico (Lung) or averaged from the time course data (Blood). 26
ACCEPTED
ACCEPTED
on July 1, 2018 by guesthttp://jvi.asm
.org/D
ownloaded from

28
Proteomics: “++” indicates that the protein was identified with at least 5 peptides, and also showed a 1
> 3 fold change between samples from flu-infected and mock-infected animals. “+” indicates that the 2
protein was identified. 3
4
LIST OF TABLES 5 6 Table 1: This table summarizes clinical features of control and experimental animals, pathology, and 7
positivity of lung samples for influenza mRNA. Live influenza virus was found on a pharyngeal swab 8
from animal “Day7 B” at day 2 PI, and a complete blood count showed a rise in absolute and relative 9
lymphocyte numbers at day 4 PI in that animal and the same in animal “Day 7A”. All infected 10
animals showed increased bronchial lavage cellularity, particularly at day 2 and day 4 PI. We were 11
unable to isolate replicating influenza virus above plaque assay detection levels from the lung lesions, 12
but this was not surprising since the disease was considered mild and tissue sampled for viral 13
isolation was on the periphery of the lesions which were first and foremost set aside for arrays, 14
proteomics, and histology. Detection of viral antigen staining was performed using one tissue sample 15
while detection of viral mRNA was performed using another tissue sample. One sample could not be 16
used for both due to unique sample preparation protocols and explains why detection of viral antigen 17
is not always concordant with detection of viral mRNA. Of note, one of the mock animals had a 18
transient nasal discharge (slight and clear) and all control animals had mild diffuse pulmonary 19
inflammation, most likely due to the bronchial lavages. Finally, mock animals experienced a mild 20
weight loss attributed to the stress of experimental manipulation. 21
22
Table 2: Summary of Peptides/Proteins identified by LC-MS/MS analysis 23
aTotal number of peptides detected in each sample. 24
bTotal number of Cysteinyl-peptides detected in each sample. 25
cTotal number of Proteins detected for each sample following ProteinProphet analysis. 26
d Total number of unique peptides and proteins 27
ACCEPTED
ACCEPTED
on July 1, 2018 by guesthttp://jvi.asm
.org/D
ownloaded from

29
1
Supplemental Table 1: Taqman primers and probes to identify viral mRNA. 2
3
Supplemental Table 2: Details of clinical features of control and experimental animals, pathology, 4
and influenza mRNA positivity of lung samples used for arrays 5
6
Reference List 7 8
1. Aggarwal, S., S. Gollapudi, and S. Gupta. 1999. Increased TNF-alpha-induced 9 apoptosis in lymphocytes from aged humans: changes in TNF-alpha receptor 10 expression and activation of caspases. J Immunol. 162:2154-2161. 11
2. Barnes, B., B. Lubyova, and P. M. Pitha. 2002. On the role of IRF in host defense. J 12 Interferon Cytokine Res. 22:59-71. 13
3. Baskin, C. R., A. García-Sastre, T. M. Tumpey, H. Bielefeldt-Ohmann, V. S. 14 Carter, E. Nistal-Villán, and M. G. Katze. 2004. Integration of clinical data, 15 pathology, and cDNA microarrays in influenza virus-infected pigtailed macaques 16 (Macaca nemestrina). J. Virol. 78:10420-10432. 17
4. Basler, C. F., A. H. Reid, J. K. Dybing, T. A. Janczewski, T. G. Fanning, H. Zheng, 18 M. Salvatore, M. L. Perdue, D. E. Swayne, A. Garcia-Sastre, P. Palese, and J. K. 19 Taubenberger. 2001. Sequence of the 1918 pandemic influenza virus nonstructural 20 gene (NS) segment and characterization of recombinant viruses bearing the 1918 NS 21 genes. Proc. Natl. Acad. Sci. U. S. A. 98:2746-2751. 22
5. Batista, F. D. and M. S. Neuberger. 2000. B cells extract and present immobilized 23 antigen: implications for affinity discrimination. EMBO J. 19:513-520. 24
6. Bin, L. H., L. D. Nielson, X. Liu, R. J. Mason, and H. B. Shu. 2003. Identification of 25 uteroglobin-related protein 1 and macrophage scavenger receptor with collagenous 26 structure as a lung-specific ligand-receptor pair. J Immunol. 171:924-930. 27
7. Brazma, A., P. Hingamp, J. Quackenbush, G. Sherlock, P. Spellman, C. Stoeckert, 28 J. Aach, W. Ansorge, C. A. Ball, H. C. Causton, T. Gaasterland, P. Glenisson, F. 29 C. P. Holstege, I. F. Kim, V. Markowitz, J. C. Matese, H. Parkinson, A. 30 Robinson, U. Sarkans, S. Schulze-Kremer, J. Stewart, R. Taylor, J. Vilo, and M. 31 Vingron. 2001. Minimum information about a microarray experiment (MIAME) 32 toward standards for microarray data. Nature Genet. 29:365-371. 33
8. Burnet, F. 1941. Influenza Virus "A" Infections of Cynomolgus Monkeys. Australian J 34 Exp Bio Med 19:281-290. 35
ACCEPTED
ACCEPTED
on July 1, 2018 by guesthttp://jvi.asm
.org/D
ownloaded from

30
9. Cate, T. R. 1987. Clinical manifestations and consequences of influenza. Am. J Med. 1 June 19; 82(6A):15-19. 2
10. Cenciarelli, C., D. S. Chiaur, D. Guardavaccaro, W. Parks, M. Vidal, and M. 3 Pagano. 1999. Identification of a family of human F-box proteins. Curr. Biol. 4 9:1177-1179. 5
11. Chai, V., A. Vassilakos, Y. Lee, J. A. Wright, and A. H. Young. 2005. Optimization 6 of the PAXgene blood RNA extraction system for gene expression analysis of clinical 7 samples. J Clin. Lab Anal. 19:182-188. 8
12. Chen, G., T. G. Gharib, C. C. Huang, J. M. Taylor, D. E. Misek, S. L. Kardia, T. J. 9 Giordano, M. D. Iannettoni, M. B. Orringer, S. M. Hanash, and D. G. Beer. 10 2002. Discordant protein and mRNA expression in lung adenocarcinomas. Mol Cell 11 Proteomics. 1:304-313. 12
13. Chipman, H., T. J. Hastie, and R. Tibshirani. 2003. Clustering Microarray Data, p. 13 159-200. In T. Speed (ed.), Statistical Analysis of Gene Expression Microarray Data. 14 CRC Press Company, New York. 15
14. Chomczynski, P. and N. Sacchi. 1987. Single-step method of RNA isolation by 16 guanidinium thiocyanate-phenol-chloroform extraction. Anal. Biochem. 162:156-159. 17
15. Cox, B., T. Kislinger, and A. Emili. 2005. Integrating gene and protein expression data: 18 pattern analysis and profile mining. Methods 35:303-314. 19
16. Debey, S., T. Zander, B. Brors, A. Popov, R. Eils, and J. L. Schultze. 2005. A highly 20 standardized, robust, and cost-effective method for genome-wide transcriptome 21 analysis of peripheral blood applicable to large-scale clinical trials. Genomics. 22
17. Enelow, R. I., A. Z. Mohammed, M. H. Stoler, A. N. Liu, J. S. Young, Y. H. Lou, 23 and T. J. Braciale. 1998. Structural and functional consequences of alveolar cell 24 recognition by CD8(+) T lymphocytes in experimental lung disease. J Clin. Invest. 25 102:1653-1661. 26
18. Fan, J., X. Liang, M. S. Horton, H. C. Perry, M. P. Citron, G. J. Heidecker, T. M. 27 Fu, J. Joyce, C. T. Przysiecki, P. M. Keller, V. M. Garsky, R. Ionescu, Y. 28 Rippeon, L. Shi, M. A. Chastain, J. H. Condra, M. E. Davies, J. Liao, E. A. 29 Emini, and J. W. Shiver. 2004. Preclinical study of influenza virus A M2 peptide 30 conjugate vaccines in mice, ferrets, and rhesus monkeys. Vaccine. 22:2993-3003. 31
19. Fodor, E., L. Devenish, O. G. Engelhardt, P. Palese, G. G. Brownlee, and A. Garcia-32 Sastre. 1999. Rescue of influenza A virus from recombinant DNA. J Virol. 73:9679-33 9682. 34
20. Fouchier, R. A., T. Kuiken, M. Schutten, A. G. van, G. J. van Doornum, B. G. van 35 den Hoogen, M. Peiris, W. Lim, K. Stohr, and A. D. Osterhaus. 2003. Aetiology: 36 Koch's postulates fulfilled for SARS virus. Nature. 423:240. 37
ACCEPTED
ACCEPTED
on July 1, 2018 by guesthttp://jvi.asm
.org/D
ownloaded from

31
21. Franitza, S., R. Hershkoviz, N. Kam, N. Lichtenstein, G. G. Vaday, R. Alon, and O. 1 Lider. 2000. TNF-alpha associated with extracellular matrix fibronectin provides a 2 stop signal for chemotactically migrating T cells. J Immunol. 165:2738-2747. 3
22. Fritz, R. S., F. G. Hayden, D. P. Calfee, L. M. Cass, A. W. Peng, W. G. Alvord, W. 4 Strober, and S. E. Straus. 1999. Nasal cytokine and chemokine responses in 5 experimental influenza A virus infection: results of a placebo-controlled trial of 6 intravenous zanamivir treatment. J Infect. Dis. 180:586-593. 7
23. Gabay, C. and I. Kushner. 1999. Acute-phase proteins and other systemic responses to 8 inflammation. N. Engl. J Med. 340:448-454. 9
24. Gao, J., G. J. Opiteck, M. S. Friedrichs, A. R. Dongre, and S. A. Hefta. 2003. 10 Changes in the protein expression of yeast as a function of carbon source. J Proteome 11 Res. 2:643-649. 12
25. Gao, W., A. Tamin, A. Soloff, L. D'Aiuto, E. Nwanegbo, P. D. Robbins, W. J. 13 Bellini, S. Barratt-Boyes, and A. Gambotto. 2003. Effects of a SARS-associated 14 coronavirus vaccine in monkeys. Lancet. 362:1895-1896. 15
26. Govorkova, E. A., J. E. Rehg, S. Krauss, H. L. Yen, Y. Guan, M. Peiris, T. D. 16 Nguyen, T. H. Hanh, P. Puthavathana, H. T. Long, C. Buranathai, W. Lim, R. 17 G. Webster, and E. Hoffmann. 2005. Lethality to ferrets of H5N1 influenza viruses 18 isolated from humans and poultry in 2004. J Virol. 79:2191-2198. 19
27. Gygi, S. P., Y. Rochon, B. R. Franza, and R. Aebersold. 1999. Correlation between 20 protein and mRNA abundance in yeast. Mol. Cell. Biol. 19:1720-1730. 21
28. Haagmans, B. L., T. Kuiken, B. E. Martina, R. A. Fouchier, G. F. Rimmelzwaan, A. 22 G. van, R. D. van, J. T. de, S. Itamura, K. H. Chan, M. Tashiro, and A. D. 23 Osterhaus. 2004. Pegylated interferon-alpha protects type 1 pneumocytes against 24 SARS coronavirus infection in macaques. Nat Med. 10:290-293. 25
29. Harris, M. A., J. Clark, A. Ireland, J. Lomax, M. Ashburner, R. Foulger, K. 26 Eilbeck, S. Lewis, B. Marshall, C. Mungall, J. Richter, G. M. Rubin, J. A. Blake, 27 C. Bult, M. Dolan, H. Drabkin, J. T. Eppig, D. P. Hill, L. Ni, M. Ringwald, R. 28 Balakrishnan, J. M. Cherry, K. R. Christie, M. C. Costanzo, S. S. Dwight, S. 29 Engel, D. G. Fisk, J. E. Hirschman, E. L. Hong, R. S. Nash, A. Sethuraman, C. L. 30 Theesfeld, D. Botstein, K. Dolinski, B. Feierbach, T. Berardini, S. Mundodi, S. Y. 31 Rhee, R. Apweiler, D. Barrell, E. Camon, E. Dimmer, V. Lee, R. Chisholm, P. 32 Gaudet, W. Kibbe, R. Kishore, E. M. Schwarz, P. Sternberg, M. Gwinn, L. 33 Hannick, J. Wortman, M. Berriman, V. Wood, C. N. de la, P. Tonellato, P. 34 Jaiswal, T. Seigfried, and R. White. 2004. The Gene Ontology (GO) database and 35 informatics resource. Nucleic Acids Res. 32:D258-D261. 36
30. Hatta, M., P. Gao, P. Halfmann, and Y. Kawaoka. 2001. Molecular basis for high 37 virulence of Hong Kong H5N1 influenza A viruses. Science. 293:1840-1842. 38
ACCEPTED
ACCEPTED
on July 1, 2018 by guesthttp://jvi.asm
.org/D
ownloaded from

32
31. Hayden, F. G., R. Fritz, M. C. Lobo, W. Alvord, W. Strober, and S. E. Straus. 1998. 1 Local and systemic cytokine responses during experimental human influenza A virus 2 infection. Relation to symptom formation and host defense. J Clin. Invest. 101:643-3 649. 4
32. Hoffmann, E., S. Krauss, D. Perez, R. Webby, and R. G. Webster. 2002. Eight-5 plasmid system for rapid generation of influenza virus vaccines. Vaccine. 6 19;20:3165-3170. 7
33. Hoffmann, E. and R. G. Webster. 2000. Unidirectional RNA polymerase I-polymerase 8 II transcription system for the generation of influenza A virus from eight plasmids. J 9 Gen Virol. 81:2843-2847. 10
34. Horimoto, T. and Y. Kawaoka. 2005. Influenza: lessons from past pandemics, 11 warnings from current incidents. Nat. Rev. Microbiol. 3:591-600. 12
35. Hwu, P., M. X. Du, R. Lapointe, M. Do, M. W. Taylor, and H. A. Young. 2000. 13 Indoleamine 2,3-dioxygenase production by human dendritic cells results in the 14 inhibition of T cell proliferation. J Immunol. 164:3596-3599. 15
36. Jacobs, J. M., D. L. Diamond, E. Y. Chan, M. A. Gritsenko, W. Qian, M. Stastna, T. 16 Baas, D. G. Camp, R. L. Carithers, Jr., R. D. Smith, and M. G. Katze. 2005. 17 Proteome analysis of liver cells expressing a full-length hepatitis C virus (HCV) 18 replicon and biopsy specimens of posttransplantation liver from HCV-infected 19 patients. J. Virol. 79:7558-7569. 20
37. Jacobs, J. M., H. M. Mottaz, L. R. Yu, D. J. Anderson, R. J. Moore, W. N. Chen, K. 21 J. Auberry, E. F. Stritmatter, M. E. Monroe, B. D. Thrall, I. I. Camp, and R. D. 22 Smith. 2003. Multidimensional proteome analysis of human mammary epithelial 23 cells. J. Proteome Res. 24
38. Jones-Engel, L., G. A. Engel, M. A. Schillaci, R. Babo, and J. Froehlich. 2001. 25 Detection of antibodies to selected human pathogens among wild and pet macaques 26 (Macaca tonkeana) in Sulawesi, Indonesia. Am. J. Primatol. 54:171-178. 27
39. Kash, J. C., C. F. Basler, A. García-Sastre, V. Carter, R. Billharz, D. E. Swayne, R. 28 M. Przygodzki, J. K. Taubenberger, M. G. Katze, and T. M. Tumpey. 2004. 29 Global host immune response: pathogenesis and transcriptional profiling of type A 30 influenza viruses expressing the hemagglutinin and neuraminidase genes from the 31 1918 pandemic virus. J. Virol. 78:9499-9511. 32
40. Kerr, M. K. and G. A. Churchill. 2001. Statistical design and the analysis of gene 33 expression microarray data. Genet. Res. 77:123-128. 34
41. Kobasa, D., A. Takada, K. Shinya, M. Hatta, P. Halfmann, S. Theriault, H. Suzuki, 35 H. Nishimura, K. Mitamura, N. Sugaya, T. Usui, T. Murata, Y. Maeda, S. 36 Watanabe, M. Suresh, T. Suzuki, Y. Suzuki, H. Feldmann, and Y. Kawaoka. 37 2004. Enhanced virulence of influenza A viruses with the haemagglutinin of the 1918 38 pandemic virus. Nature. 431:703-707. 39
ACCEPTED
ACCEPTED
on July 1, 2018 by guesthttp://jvi.asm
.org/D
ownloaded from

33
42. Kuiken, T., G. F. Rimmelzwaan, G. van Amerongen, and A. D. Osterhaus. 2003. 1 Pathology of human influenza A (H5N1) virus infection in cynomolgus macaques 2 (Macaca fascicularis). Vet. Pathol. 40:304-310. 3
43. Kuiken, T., B. G. van den Hoogen, D. A. van Riel, J. D. Laman, A. G. van, L. 4 Sprong, R. A. Fouchier, and A. D. Osterhaus. 2004. Experimental human 5 metapneumovirus infection of cynomolgus macaques (Macaca fascicularis) results in 6 virus replication in ciliated epithelial cells and pneumocytes with associated lesions 7 throughout the respiratory tract. Am. J Pathol. 164:1893-1900. 8
44. Lawler, J. V., T. P. Endy, L. E. Hensley, A. Garrison, E. A. Fritz, M. Lesar, R. S. 9 Baric, D. A. Kulesh, D. A. Norwood, L. P. Wasieloski, M. P. Ulrich, T. R. Slezak, 10 E. Vitalis, J. W. Huggins, P. B. Jahrling, and J. Paragas. 2006. Cynomolgus 11 Macaque as an Animal Model for Severe Acute Respiratory Syndrome. PLoS Med. 12 3:e149. 13
45. Li, B. J., Q. Tang, D. Cheng, C. Qin, F. Y. Xie, Q. Wei, J. Xu, Y. Liu, B. J. Zheng, 14 M. C. Woodle, N. Zhong, and P. Y. Lu. 2005. Using siRNA in prophylactic and 15 therapeutic regimens against SARS coronavirus in Rhesus macaque. Nat Med. 16 11:944-951. 17
46. Li, Z., H. Chen, P. Jiao, G. Deng, G. Tian, Y. Li, E. Hoffmann, R. G. Webster, Y. 18 Matsuoka, and K. Yu. 2005. Molecular basis of replication of duck H5N1 influenza 19 viruses in a mammalian mouse model. J Virol. 79:12058-12064. 20
47. Liu, H., R. G. Sadygov, and J. R. Yates, III. 2004. A model for random sampling and 21 estimation of relative protein abundance in shotgun proteomics. Anal. Chem. 22 76:4193-4201. 23
48. Luke, C. J. and K. Subbarao. 2006. Vaccines for pandemic influenza. Emerg. Infect. 24 Dis. 12:66-72. 25
49. Magness, C. L., P. C. Fellin, M. J. Thomas, M. J. Korth, M. B. Agy, S. C. Proll, M. 26 Fitzgibbon, C. A. Scherer, D. G. Miner, M. G. Katze, and S. P. Iadonato. 2005. 27 Analysis of the Macaca mulatta transcriptome and the sequence divergence between 28 Macaca and human. Genome Biol. 6:R60. 29
50. McAuliffe, J., L. Vogel, A. Roberts, G. Fahle, S. Fischer, W. J. Shieh, E. Butler, S. 30 Zaki, C. M. St, B. Murphy, and K. Subbarao. 2004. Replication of SARS 31 coronavirus administered into the respiratory tract of African Green, rhesus and 32 cynomolgus monkeys. Virology. 330:8-15. 33
51. Naschberger, E., M. Bauer, and M. Sturzl. 2005. Human guanylate binding protein-1 34 (hGBP-1) characterizes and establishes a non-angiogenic endothelial cell activation 35 phenotype in inflammatory diseases. Adv. Enzyme Regul. 45:215-27. Epub; 2005 36 Jul 6.:215-227. 37
52. Nesvizhskii, A. I., A. Keller, E. Kolker, and R. Aebersold. 2003. A statistical model 38 for identifying proteins by tandem mass spectrometry. Anal. Chem. 75:4646-4658. 39
ACCEPTED
ACCEPTED
on July 1, 2018 by guesthttp://jvi.asm
.org/D
ownloaded from

34
53. Neumann, G., K. Fujii, Y. Kino, and Y. Kawaoka. 2005. An improved reverse 1 genetics system for influenza A virus generation and its implications for vaccine 2 production. Proc. Natl. Acad. Sci. U. S. A. 102:16825-16829. 3
54. Neumann, G., T. Watanabe, H. Ito, S. Watanabe, H. Goto, P. Gao, M. Hughes, D. 4 R. Perez, R. Donis, E. Hoffmann, G. Hobom, and Y. Kawaoka. 1999. Generation 5 of influenza A viruses entirely from cloned cDNAs. Proc. Natl. Acad. Sci. U. S. A. 6 96:9345-9350. 7
55. Palese, P. 2004. Influenza: old and new threats. Nat Med. 10:S82-S87. 8
56. Perdue, M. L. 2003. Molecular diagnostics in an insecure world. Avian Dis. 47:1063-9 1068. 10
57. Qian, W. J., J. M. Jacobs, D. G. Camp, M. E. Monroe, R. J. Moore, M. A. 11 Gritsenko, S. E. Calvano, S. F. Lowry, W. Xiao, L. L. Moldawer, R. W. Davis, R. 12 G. Tompkins, and R. D. Smith. 2005. Comparative proteome analyses of human 13 plasma following in vivo lipopolysaccharide administration using multidimensional 14 separations coupled with tandem mass spectrometry. Proteomics. 5:572-584. 15
58. Qian, W. J., T. Liu, M. E. Monroe, E. F. Strittmatter, J. M. Jacobs, L. J. Kangas, K. 16 Petritis, D. G. Camp, and R. D. Smith. 2005. Probability-based evaluation of 17 peptide and protein identifications from tandem mass spectrometry and SEQUEST 18 analysis: the human proteome. J Proteome Res. 4:53-62. 19
59. Qin, C., J. Wang, Q. Wei, M. She, W. A. Marasco, H. Jiang, X. Tu, H. Zhu, L. Ren, 20 H. Gao, L. Guo, L. Huang, R. Yang, Z. Cong, L. Guo, Y. Wang, Y. Liu, Y. Sun, 21 S. Duan, J. Qu, L. Chen, W. Tong, L. Ruan, P. Liu, H. Zhang, J. Zhang, H. 22 Zhang, D. Liu, Q. Liu, T. Hong, and W. He. 2005. An animal model of SARS 23 produced by infection of Macaca mulatta with SARS coronavirus. J Pathol. 206:251-24 259. 25
60. Qin, E., H. Shi, L. Tang, C. Wang, G. Chang, Z. Ding, K. Zhao, J. Wang, Z. Chen, 26 M. Yu, B. Si, J. Liu, D. Wu, X. Cheng, B. Yang, W. Peng, Q. Meng, B. Liu, W. 27 Han, X. Yin, H. Duan, D. Zhan, L. Tian, S. Li, J. Wu, G. Tan, Y. Li, Y. Li, Y. 28 Liu, H. Liu, F. Lv, Y. Zhang, X. Kong, B. Fan, T. Jiang, S. Xu, X. Wang, C. Li, 29 X. Wu, Y. Deng, M. Zhao, and Q. Zhu. 2006. Immunogenicity and protective 30 efficacy in monkeys of purified inactivated Vero-cell SARS vaccine. Vaccine. 31 24:1028-1034. 32
61. Rainen, L., U. Oelmueller, S. Jurgensen, R. Wyrich, C. Ballas, J. Schram, C. 33 Herdman, D. Bankaitis-Davis, N. Nicholls, D. Trollinger, and V. Tryon. 2002. 34 Stabilization of mRNA expression in whole blood samples. Clin. Chem. 48:1883-35 1890. 36
62. Reghunathan, R., M. Jayapal, L. Y. Hsu, H. H. Chng, D. Tai, B. P. Leung, and A. J. 37 Melendez. 2005. Expression profile of immune response genes in patients with 38 Severe Acute Respiratory Syndrome. BMC. Immunol. 6:2.:2. 39
ACCEPTED
ACCEPTED
on July 1, 2018 by guesthttp://jvi.asm
.org/D
ownloaded from

35
63. Reid, A. H. and J. K. Taubenberger. 2003. The origin of the 1918 pandemic influenza 1 virus: a continuing enigma. J Gen Virol. 84:2285-2292. 2
64. Reimann, J., W. Bohm, and R. Schirmbeck. 1994. Alternative processing pathways 3 for MHC class I-restricted epitope presentation to CD8+ cytotoxic T lymphocytes. 4 Biol. Chem. Hoppe Seyler. 375:731-736. 5
65. Reimann, J. and R. Schirmbeck. 1999. Alternative pathways for processing exogenous 6 and endogenous antigens that can generate peptides for MHC class I-restricted 7 presentation. Immunol Rev. 172:131-52.:131-152. 8
66. Rennels, M. B. and H. C. Meissner. 2002. Technical report: Reduction of the influenza 9 burden in children. Pediatrics 110:e80. 10
67. Rimmelzwaan, G. F., M. Baars, B. R. van, A. G. van, K. Lovgren-Bengtsson, E. C. 11 Claas, and A. D. Osterhaus. 1997. Induction of protective immunity against 12 influenza virus in a macaque model: comparison of conventional and iscom vaccines. 13 J Gen Virol. 78:757-765. 14
68. Rimmelzwaan, G. F., T. Kuiken, G. van Amerongen, T. M. Bestebroer, R. A. 15 Fouchier, and A. D. Osterhaus. 2001. Pathogenesis of influenza A (H5N1) virus 16 infection in a primate model. J. Virol. 75:6687-6691. 17
69. Rimmelzwaan, G. F., T. Kuiken, G. van Amerongen, T. M. Bestebroer, R. A. 18 Fouchier, and A. D. Osterhaus. 2003. A primate model to study the pathogenesis of 19 influenza A (H5N1) virus infection. Avian Dis. 47:931-933. 20
70. Rowe, T., G. Gao, R. J. Hogan, R. G. Crystal, T. G. Voss, R. L. Grant, P. Bell, G. P. 21 Kobinger, N. A. Wivel, and J. M. Wilson. 2004. Macaque model for severe acute 22 respiratory syndrome. J Virol. 78:11401-11404. 23
71. Saslaw, S., H. E. Wilson, C. A. Doan, O. C. Woolpert, and J. L. Schwab. 1946. 24 Reactions of monkeys to experimentally induced influenza virus A infection. Exp. 25 Med. 84:113-125. 26
72. Saslaw, S. and H. N. Carlisle. 1965. Aerosol exposure of monkeys to influenza virus. 27 Proc. Soc. Exp. Biol. Med. 119:838-843. 28
73. Shannon, W., R. Culverhouse, and J. Duncan. 2003. Analyzing microarray data using 29 cluster analysis. Pharmacogenomics. 4:41-52. 30
74. Shen, Y., R. Zhao, M. E. Belov, T. P. Conrads, G. A. Anderson, K. Tang, L. Pasa-31 Tolic, T. D. Veenstra, M. S. Lipton, and R. D. Smith. 2001. Packed capillary 32 reversed-phase liquid chromatography with high-performance electrospray ionization 33 Fourier transform ion cyclotron resonance mass spectrometry for proteomics. Anal. 34 Chem. 73:1766-1775. 35
ACCEPTED
ACCEPTED
on July 1, 2018 by guesthttp://jvi.asm
.org/D
ownloaded from

36
75. Sidwell R.W. 1999. The Mouse Model of Influenza Virus Infection, p. 981-988. In Zak 1 O. and Sande M.A. (eds.), Handbook of Animal Models of Infection: Experimental 2 Models in Antimicrobial Therapy. Academic Press, London. 3
76. Sintchenko, V., G. L. Gilbert, E. Coiera, and D. Dwyer. 2002. Treat or test first? 4 Decision analysis of empirical antiviral treatment of influenza virus infection versus 5 treatment based on rapid test results. J Clin. Virol 25:15-21. 6
77. Tian, Q., S. B. Stepaniants, M. Mao, L. Weng, M. C. Feetham, M. J. Doyle, E. C. Yi, 7 H. Dai, V. Thorsson, J. Eng, D. Goodlett, J. P. Berger, B. Gunter, P. S. Linseley, 8 R. B. Stoughton, R. Aebersold, S. J. Collins, W. A. Hanlon, and L. E. Hood. 9 2004. Integrated genomic and proteomic analyses of gene expression in mammalian 10 cells. Mol. Cell. Proteomics 3:960-969. 11
78. Tumpey, T. M., C. F. Basler, P. V. Aguilar, H. Zeng, A. Solorzano, D. E. Swayne, N. 12 J. Cox, J. M. Katz, J. K. Taubenberger, P. Palese, and A. Garcia-Sastre. 2005. 13 Characterization of the reconstructed 1918 Spanish influenza pandemic virus. 14 Science. 310:77-80. 15
79. Tumpey, T. M., A. Garcia-Sastre, J. K. Taubenberger, P. Palese, D. E. Swayne, and 16 C. F. Basler. 2004. Pathogenicity and immunogenicity of influenza viruses with 17 genes from the 1918 pandemic virus. Proc. Natl. Acad. Sci. U. S. A. 101:3166-3171. 18
80. Voeten, J. T., G. F. Rimmelzwaan, N. J. Nieuwkoop, R. A. Fouchier, and A. D. 19 Osterhaus. 2001. Antigen processing for MHC class I restricted presentation of 20 exogenous influenza A virus nucleoprotein by B-lymphoblastoid cells. Clin. exp. 21 immunol. 125:423-431. 22
81. Webby, R. J. and R. G. Webster. 2003. Are we ready for pandemic influenza? Science. 23 302:1519-1522. 24
82. Webster, R. G. 1997. Influenza virus: transmission between species and relevance to 25 emergence of the next human pandemic. Arch. Virol Suppl. 13:105-13.:105-113. 26
83. Yewdell, J. and A. Garcia-Sastre. 2002. Influenza virus still surprises. Curr. Opin. 27 Microbiol. 5:414-418. 28
84. Yu, S. Y., Y. W. Hu, X. Y. Liu, W. Xiong, Z. T. Zhou, and Z. H. Yuan. 2005. Gene 29 expression profiles in peripheral blood mononuclear cells of SARS patients. World J 30 Gastroenterol. 11:5037-5043. 31
85. Zitzow, L. A., T. Rowe, T. Morken, W. J. Shieh, S. Zaki, and J. M. Katz. 2002. 32 Pathogenesis of avian influenza A (H5N1) viruses in ferrets. J Virol. 76:4420-4429. 33
34 35
ACCEPTED
ACCEPTED
on July 1, 2018 by guesthttp://jvi.asm
.org/D
ownloaded from