3.08 mri and ct scanning services -...
TRANSCRIPT

MRI and CT Scanning Services
Chapter 3Section 3.08
Chap
ter 3
• VF
M S
ectio
n 3.
08
365
Ministry of Health and Long-Term Care
1.0 Summary
Diagnostic medical imaging includes the use of magnetic resonance imaging (MRI) and computed tomography (CT) scans to provide physicians with important information for diagnosing and monitoring patients’ conditions. Timely, quality, medically necessary scans can help doctors to accurately diagnose and treat many diseases earlier in their course, positively contributing to patients’ health outcomes.
As technological advances continue to broaden the range of their medical uses and the diseases that can be diagnosed, MRI scans performed have increased by 17% and CT scans by more than 30% over the five years up to 2017/18, excluding emer-gency cases (as emergency data was not required to be collected before 2015).
The Ministry of Health and Long-Term Care (Ministry) is responsible for overseeing, through the 14 Local Health Integration Networks (LHINs), the funding and performance of MRI and CT services in Ontario. Of the 137 public hospitals in Ontario as of April 2018, 78 had at least one MRI or CT machine.
Timely access to MRI and CT scanning services is a fundamental part of Ontario’s Wait Time Strategy. The Ministry has set four priority levels for radiolo-gists to use to triage patients and has set a wait-time target for each level: emergency (within 24 hours),
urgent (within two days), semi-urgent (within 10 days) and non-urgent (within 28 days). These targets are set at the 90th percentile, which repre-sents the time within which 90% of patients in each category should receive their scan from the date of referral for the scan. This means that no more than 10% should wait any longer than that.
Our audit found that, overall, Ontario’s wait times for patients requiring MRI and CT scans were the lowest when compared to five provinces where the 90th percentile wait-time data was available (public information is not available from British Columbia and Quebec). However, many Ontarians who needed scans have had significantly long waits in comparison to Ministry targets. We also found that if existing MRI and CT scan machines had been operated more hours, more patients could have been scanned, thereby reducing wait times. Our audit also identified opportunities where increased efficiency and better use of resources could help to reduce wait times for MRI and CT scans. While some of our specific findings are common to both MRIs and CTs, others are unique to either MRIs or CTs, as follows:
MRI Scanning ServicesFor MRIs, in 2017/18, a total of 108 MRI machines in 52 hospitals performed over 835,600 examina-tions. During the same fiscal year, the Ministry provided funding of $157 million, plus a one-time additional payment of $7.3 million, to these

366
Chap
ter 3
• VF
M S
ectio
n 3.
08
hospitals, to be used specifically for providing MRI services. Hospitals also have the discretion to use funds from their global budgets (annual lump-sum funding from the Ministry) or other sources to pro-vide additional MRI services.
• 65% of semi-urgent and non-urgent patients waited longer than the Ministry’s targeted waiting period to receive their MRIs. Ontario hospitals were mostly able to provide timely services to patients who required either emergency or urgent MRI scans, but were unable to do so for semi-urgent and non-urgent patients. It is still important for semi-urgent and non-urgent patients to receive timely services. Long wait times delay their diagnosis and treatment, and can impact their quality of life, such as their ability to return to employment, school or everyday life. In some cases, the long wait can result in deterioration of the patient’s condition.
For emergency patients, only 5% waited longer than the 24-hour target. For urgent patients, 17% waited longer than the two-day target (up to five days). Semi-urgent and non-urgent patients accounted for 91% of the total MRI scans in 2017/18. Overall, only 35% (not the intended 90%) of semi-urgent and non-urgent patients received MRI scans within the Ministry’s wait-time targets of 10 days and 28 days, respectively. The remaining 65% (not the intended 10%) waited longer than these wait-time targets (see Figure 7).
• Wait times for MRI scans vary depending on where the patient lives in Ontario. The wait-time disparity for non-urgent patients was the most significant. Depending on where a patient lives and the demand for MRI scanning services in that LHIN, patients have a shorter or longer wait than in other LHINs. The Ministry has not analyzed why wait times vary significantly among LHINs.
In 2017/18, 90% of non-urgent patients waited up to 203 days in the LHIN with the
longest wait times, as compared to 63 days in the LHIN with the shortest wait times.
• Patients wait unnecessarily long times for MRI scans, while machines are not operating for sufficient hours, despite available capacity. We found that MRI machines could have been operating more hours, thereby reducing wait times, but the hospitals were financially unable to increase their operating hours for these machines. If all 108 MRI machines in Ontario’s hospitals had operated for 16 hours, seven days a week, hospitals would have been able to outperform the Ministry’s wait-time targets.
On average, all 108 MRI machines were used at only 56% of maximum capacity (which is running 24 hours a day, seven days a week) in 2017/18. We estimated the additional cost to meet the Ministry targets by the end of 2018/19 would be about $34 million, assuming hospitals operated machines 132,197 more hours than they operated them in 2017/18, at a rate of $260 per hour.
• Patient no-shows (missed appointments) are costly, but the Ministry and hospitals do not understand why they occur. When patients do not show up for an appointment or cancel it the same day, scanning machines can sit idle if hospitals are unable to fill the time slot quickly. Lack of user-friendly communication systems at the hospitals to allow patients to confirm receipt of their appointment, including emails and text-messaging, contributed to patient no-shows. We also noted that none of the four hospitals where we conducted audit work routinely tracks reasons for no-shows.
MRI patient no-show rates across Ontario hospitals ranged between 0.1% and 13.4% of scheduled appointments. In 2017/18, hospitals reported a total of 48,320 MRI appointments where patients did not show up, which we estimated cost hospitals about $6.2 million, mainly to pay for staffing.

367MRI and CT Scanning Services
Chap
ter 3
• VF
M S
ectio
n 3.
08
CT Scanning Services In 2017/18, a total of 165 CT machines in 78 hos-pitals performed almost 1.8 million scans. In the same year, the Ministry gave $9 million to these hospitals to be used specifically for providing CT services. Hospitals rely more heavily on their global budgets to provide CT services—the $9 million is intended to be supplementary funding.
• 33% of semi-urgent and non-urgent patients waited longer than the Ministry’s targeted waiting period to receive their CT scans. Ontario hospitals were mostly able to provide timely services to patients who required either emergency or urgent CT scans, but were unable to do so for semi-urgent and non-urgent patients.
For emergency patients, less than 1% waited longer than the 24-hour target. For urgent patients, 4% waited longer than the two-day target (up to four days). Semi-urgent and non-urgent patients accounted for 49% of the total CT scans in 2017/18. Only 67% (not the intended 90%) of semi-urgent and non-urgent patients received CT scans within the Ministry’s wait-time targets of 10 days and 28 days for these two groups. The remaining 33% (not the intended 10%) waited longer (see Figure 9).
• Wait times for CT scans vary depending on where the patient lives in Ontario. The wait-time disparity for non-urgent patients was the most significant. Depending on where a patient lives and the demand for CT scanning services in that LHIN, patients have a shorter or longer wait than in other LHINs. The Ministry has not analyzed why wait times vary significantly among LHINs.
In 2017/18, 90% of non-urgent patients waited up to 127 days within the LHIN with the longest wait times, as compared to 27 days in the LHIN with the shortest wait times.
• Patients wait unnecessarily long times for CT scans, while machines are not operating for sufficient hours, despite
available capacity. We found that CT machines could have been operating more hours, thereby reducing wait times, but the hospitals were financially unable to increase their operating hours for these machines.
On average, all 165 CT machines were used at approximately 37% of maximum capacity in 2017/18, despite long wait times. Cancer Care Ontario does not have a predictive model to determine the number of hours needed to achieve the Ministry’s wait-time targets for CT scans.
• Patient no-shows (missed appointments) are costly, but the Ministry and hospitals do not understand why they occur. Lack of user-friendly communication systems at the hospitals to allow patients to confirm receipt of their appointment, including emails and text-messaging, contributed to patient no-shows. We noted that none of the four hospitals where we conducted audit work routinely tracks reasons for no-shows.
CT patient no-show rates across Ontario hospitals ranged between 0.6% and 13% of scheduled appointments. In 2017/18, hospitals reported a total of 57,916 missed CT appointments, but they were able to fill these slots with little difficulty.
MRI and CT Scanning Services • The Ministry is unable to justify the
funding methods for MRI and CT scans, which have remained unchanged for over 10 years. The Ministry has not reviewed its funding method for either MRI or CT services, and it has not incorporated into its funding method the actual cost-per-scan information self-reported by hospitals, individual hospitals’ demand and capacity, and the complexity of scans needed by patients.
• Province-wide peer review of MRI and CT scan results is not mandatory across Ontario hospitals. Lack of a peer review

368
Chap
ter 3
• VF
M S
ectio
n 3.
08
program exposes patients and hospitals to the risk of misinterpretation of MRI and CT images and/or misdiagnosis of a patient’s condition. A 2013 review of a radiologist’s work at Trillium Health Partners uncovered issues related to over 640 CT scans, some of which involved undiagnosed cancers. The Ministry requested that Health Quality Ontario (HQO) lead the implementation of a province-wide physician peer review program in all facilities where diagnostic imaging services are provided, but progress has been slow.
• Hospitals did not consistently assess or track whether all referrals for MRI and CT scans were clinically necessary. Monitoring the number of unnecessary or inappropri-ate scans is essential because these scans do not improve the patient’s health and use resources that can otherwise be used to help patients who need the scans. At the four hospitals where we conducted audit work, the hospitals’ radiologists are responsible for deciding the level of priority for each incoming referral and rejecting those that are deemed inappropriate. However, none of the hospitals keep track of the number of inappropriate referrals the hospitals rejected.
Independent Health Facilities Since 2003, the Ministry has contracted with seven independent health facilities (IHFs) to provide MRI and/or CT scanning services at no charge to patients insured under the Ontario Health Insur-ance Plan—mostly semi-urgent and non-urgent scans. In 2017/18, the IHFs, with a total of six MRI and two CT machines, performed about 48,000 MRI and 11,320 CT scans outside of hospitals.
• Standardized hourly rates and wait-time performance measures are lacking in Ministry agreements with independent health facilities (IHFs). The Ministry is responsible, under the Independent Health
Facilities Act, 1990, for licensing, funding and co-ordinating quality assurance assessments of IHFs. We found that achieving performance measures such as wait-time targets is not expected. Also, hourly rates vary: the rate paid for an MRI scan at one IHF can be as high as 175% the rate paid for a similar scan at another IHF, and the rate paid for a CT scan at one IHF can be as high as 280% of the rate paid for a similar scan at another IHF. The Ministry does not know the actual cost of a scan performed outside of a hospital, so it cannot assess whether the rates it currently pays the IHFs are reasonable.
Overall ConclusionOur audit concluded that not all patients who needed an MRI and/or CT scan received timely and equitable service. This was particularly the case for patients who were assessed in the semi-urgent and non-urgent priority levels. Although Ontario’s wait times were the lowest for patients requiring MRI and/or CT scans compared to five other prov-inces where similar data was available, hospitals in Ontario did not meet the Ministry’s wait-time targets. Wait times for MRI and CT scans varied depending on where patients live.
We also concluded that MRI and CT services were not being delivered in a cost-effective manner. The Ministry had not reviewed the MRI hourly rates it pays to hospitals and its funding method for either MRI or CT services for more than a decade, and it did not incorporate into its funding method cost-per-scan information, individual hospitals’ demand and capacity, and the complexity of scans needed by patients. In addition, the hourly rates paid by the Ministry to the seven independent health facilities for scans vary significantly for similar services.
The hospitals we visited had policies and screen-ing procedures in place to ensure patient safety while receiving MRI scans. Radiologists at the hospitals also ensure patients were exposed to a

369MRI and CT Scanning Services
Chap
ter 3
• VF
M S
ectio
n 3.
08
minimal level of radiation dosage for CT scans that produced clear images that were in compliance with applicable standards. However, the hospitals did not consistently assess or track whether all referrals for these scans were appropriate and clinically necessary.
Our audit also concluded that although wait times are measured, validated and publicly reported periodically, more useful and complete wait-time information could be made available to patients and their physicians to assist them in mak-ing informed decisions about where patients should be referred to receive the most timely scan.
This report contains 13 recommendations, con-sisting of 33 actions, to address our audit findings.
OVERALL MINISTRY RESPONSE
Recognizing the importance that MRI and CT imaging play in the diagnosis and treatment of diseases, the Ministry of Health and Long-Term Care (Ministry) is committed to working with Local Health Integration Networks (LHINs), hospitals and Cancer Care Ontario (CCO) toward the continuous quality improvement of cost-effectiveness, safety, appropriateness, efficiency, equitable distribution, and building capacity of high-quality, timely MRI and CT services for all Ontarians. We welcome the insights and recommendations provided by the Auditor General.
The audit identifies several areas of consider-ation where the Ministry will build on existing efforts and initiatives to evaluate, address and improve. This includes improving scheduling, appropriateness of referrals, and how the Min-istry funds MRI and CT operations. The Ministry will continue to work closely with CCO, LHINs, hospitals and other system partners to ensure that Ontarians continue to have access to high-quality MRI and CT diagnostic imaging services.
2.0 Background
2.1 Overview of MRI and CT Scanning Services
Diagnostic medical imaging includes the use of magnetic resonance imaging (MRI) and computed tomography (CT) to provide physicians with important information in diagnosing and monitor-ing patients’ conditions. Medical imaging may be done for many reasons: screening patients at risk for a disease, reducing uncertainty about a diag-nosis, assisting with decisions about care choices, assessing treatments and/or guiding surgery or other interventions. Timely MRI and CT scans can improve the ability of doctors to accurately diag-nose and treat many diseases earlier in their course, contributing greatly to positive outcomes.
MRI and CT scanning services are offered to patients who have been referred for a scan by a physician. Before a referral is made, patients can consult with their physician to select a hospital or independent health facility (IHF) based on various factors such as the closest location, wait times, distance the patient is willing to travel, and co-ordination of the scan with other tests or consul-tations. The referring physician completes a requisi-tion and submits it to a hospital diagnostic imaging department or IHF. Before a booking is made, the requisition is assessed by radiologists, who determine the type of scan and assign the patient a priority level—emergency, urgent, semi-urgent and non-urgent. An appointment scheduler then books the patient into a predefined slot in the MRI or CT schedule based on the type of exam required (the part of the body scanned and other requirements to get a clear and usable image).
When patients arrive at the hospital or IHF, they must go through safety procedures with staff before a scan can proceed. The rest of the process includes every step required to examine the patient, study the images, and produce a report of clinical findings based on the images. The report

370
Chap
ter 3
• VF
M S
ectio
n 3.
08
is sent to the referring physician. Appendix 1 shows the major steps that a patient typically goes through from consulting his or her physician to receiving the result of a scan. Appendix 2 lists some of the key similarities and differences in MRI imaging and CT imaging.
2.2 MRI ServicesMagnetic resonance imaging (MRI) is a medical imaging technique used to visualize detailed inter-nal structures using magnetic fields. MRI provides three-dimensional views of body organs, and is best used for producing images of soft tissues such as ligaments, tendons, organs and tumours. It also gives excellent visualization of heads, spines, muscles and joints.
2.2.1 Key Statistics Relating to MRI Scans Performed
The total number of MRI scans performed in Ontario hospitals increased by 17% over five years from 702,047 in 2013/14 to 824,805 in 2017/18. (This trend excludes emergency scans, because provincial data for these scans was not required to be collected in 2013/14 and 2014/15. In 2017/18, emergency scans represented only 1% of total MRI scans.) Advances in imaging technology have led physicians to increasingly rely on MRIs to diagnose
patients’ conditions—for example, to diagnose car-diac events, screen for cancer, and examine high-risk individuals for breast cancer. The demand for follow-up scans to monitor patients for progression or remission of disease has also increased.
Figure 1 shows the number of MRI scans performed from 2013/14 to 2017/18. For the 2017/18 fiscal year, we also noted the following:
• 69% of MRI scans were performed for adult patients between 18 and 65 years of age, mainly under non-urgent conditions.
• The majority of MRI scans were performed on the head (31% of the total), the spine (25%) and the extremities—that is, the limbs (24%). The remaining 20% of MRI scans were per-formed in areas such as the abdomen, pelvis, breast, and the neck area.
2.2.2 Funding for MRI Scans
Each year, the Ministry provides a lump-sum pay-ment (the “global budget”) to each hospital based on historical spending and inflation. It also provides additional funding for various programs, including MRI operations. As of March 2018, 52 of Ontario’s 137 hospitals had a total of 108 MRI machines. The Ministry gave these hospitals $157 million in 2017/18 to operate these machines, unchanged from the two previous years. This represents a 3% increase over 2013/14, when the hospitals received
Figure 1: Number of MRI Scans Performed in Hospitals, 2013/14–2017/18Source of data: Cancer Care Ontario
2013/14–2017/18 2017/18
Priority Level 2013/14 2014/15 2015/16 2016/17 2017/18 % Change % of TotalUrgent 46,109 50,333 55,951 59,976 63,741 38 8Semi-urgent 93,190 97,330 104,966 110,861 116,706 25 14Non-urgent 562,748 587,752 606,468 637,127 644,358 15 77Total Non-emergency 702,047 735,415 767,385 807,964 824,805 17 99Emergency* n/a n/a 10,267 11,298 10,843 n/a 1Total n/a n/a 777,652 819,262 835,648 n/a 100
* Wait-time data for emergency scans was not required to be collected for the years 2013/14 and 2014/15. Cancer Care Ontario does not have a mandate to validate wait times or volumes for emergency scans collected since 2015/16, because wait times for these scans are not publicly reported.

371MRI and CT Scanning Services
Chap
ter 3
• VF
M S
ectio
n 3.
08
$152 million. The Ministry provided one-time fund-ing of $7.3 million in 2017/18 and $6.9 million in 2018/19 to hospitals specifically for urgent, semi-urgent, cancer screening and/or diagnosis, and high-risk breast cancer patients.
The Ministry does not provide capital funding for MRI machines. Instead, it funds hospitals’ use of the machines mainly on the basis of predetermined hourly rates, as discussed in Section 4.5. To buy new machines or replace existing ones, hospitals use part of their internal capital budget and/or money from local fundraising. We discuss capital funding for MRI machines in Section 4.7.2. Appen-dix 3 shows how these 108 MRI machines are allocated among the 52 hospitals that have them as well as the wait times at each hospital in 2017/18.
2.3 CT Scanning ServicesComputed tomography (CT) uses x-ray photons to produce multiple images that are then digitally reconstructed. A CT scanner consists of an x-ray tube and detectors. The tube produces an x-ray beam that passes through the patient’s body. The scan combines a series of x-ray images taken from different angles and uses a computer to create cross-sectional images (slices) of a patient’s body. CT imaging is best used for the head, bones and areas where there is a lot of movement such as the chest and abdomen. As noted in Section 2.2, CT
scans are commonly used for the same body parts as MRI scans.
2.3.1 Key Statistics Relating to CT Scans Performed
The total number of CT scans performed in Ontario hospitals has increased by 31% over five years from 939,258 in 2013/14 to 1,234,131 in 2017/18, primarily resulting from advances in technology. (This trend excludes emergency scans, because provincial data for these scans was not required to be collected in 2013/14 and 2014/15. In 2017/18, emergency scans represented 31% of total CT scans.) For example, the Province has noted an increasing demand by specialists for CT scans to determine the initial state of suspected cancer cells in patients, and the stage of the disease, as well as an increasing number of follow-up scans for patients who need continuous monitoring for progression or remission of a disease.
Figure 2 shows the number of CT scans performed. For the 2017/18 fiscal year, we also noted the following:
• CT scans were performed almost equally for adult patients between 18 and 65 years of age and adults over 65 for all priority levels.
• 81% of CT scans were performed on the abdomen (30% of the total); brain (28%); and thorax (23%); the remaining 19% of CT
Figure 2: Number of CT Scans Performed in Hospitals, 2013/14–2017/18Source of data: Cancer Care Ontario
2013/14–2017/18 2017/18
Priority Level 2013/14 2014/15 2015/16 2016/17 2017/18 % Change % of TotalUrgent 228,786 256,316 283,810 343,888 365,120 60 20Semi-urgent 254,033 266,425 267,192 289,990 313,604 23 18Non-urgent 456,439 473,133 507,562 544,465 555,407 22 31Total Non-emergency 939,258 995,874 1,058,564 1,178,343 1,234,131 31 69Emergency* n/a n/a 341,496 495,604 556,131 n/a 31Total n/a n/a 1,400,060 1,673,947 1,790,262 n/a 100
* Wait-time data for emergency scans was not required to be collected for the years 2013/14 and 2014/15. Cancer Care Ontario does not have a mandate to validate wait times or volumes for emergency scans collected since 2015/16, because wait times for these scans are not publicly reported.

372
Chap
ter 3
• VF
M S
ectio
n 3.
08
scans were performed in areas such as the head and neck, the spine and the pelvis.
2.3.2 Funding for CT Scans
In addition to the lump-sum payment (the “global budget”) the Ministry provides to each hospital, based on historical spending and inflation, it also provides additional funding for CT operations and other programs. As of March 2018, 78 Ontario hospitals had a total of 165 CT machines; historic-ally, each year the Ministry has been giving these hospitals a total of about $9 million supplementary funding to operate the machines. The Ministry considers the $9 million to be supplementary fund-ing because it expects hospitals to operate their CT machines out of their global budgets. Appendix 4 shows how these 165 CT machines are allocated among the 78 hospitals in Ontario and the wait times at each hospital for 2017/18.
2.4 Wait-Time TargetsThe Ministry defines wait time as the time “from when a hospital receives the request from the patient’s doctor to book an MRI or a CT scan to the patient having the scan.” We illustrate the patient’s journey, including wait time, in Appendix 1.
To prioritize access to MRI and CT scanning services, based on advice from clinical experts, the Ministry has categorized patients into four levels: emergency (Priority 1), urgent (Priority 2), semi-urgent (Priority 3), and non-urgent (Priority 4). Radiologists in hospitals use these categories to triage and classify patients based on the urgency of their need to receive a scan.
In 2005/06, as part of Ontario’s Wait Time Strategy, based on advice from clinical experts, the Ministry established wait-time targets for each of the priority levels for both MRI and CT scanning services, as shown in Figure 3. The Ministry target is set for the 90th percentile. This means that 90% of patients should receive their scans within the targets set by the Ministry, and no more than 10% should wait any longer.
Hospitals are required to capture and submit MRI and CT data for both adult and pediatric patients to Cancer Care Ontario (CCO) regularly. Hospital-level MRI and CT wait-time data had been publicly reported on the Ministry’s website until December 2017. Since then, the wait-time data has been published on the Health Quality Ontario website.
The wait times reported publicly on Health Quality Ontario’s website are based on the average (mean) of the wait times measured as well as the percentage scanned within the Ministry target for
Figure 3: Priority Level Definitions* and Provincial Wait-Time Targets for MRI and CT Scan Services in OntarioSource: Ministry of Health and Long-Term Care
Clinical DescriptionAny condition in which failure to diagnose
Patient Category and initiate treatment would result in: Type of Patient Provincial Wait-Time TargetEmergency (Priority 1) serious morbidity or mortality
e.g., spinal cord compression ER patients, in-patients within 24 hours
Urgent (Priority 2) significant deterioration e.g., suspected epidural abscess
ER patients, in-patients, very urgent out-patients
within 2 days
Semi-urgent (Priority 3) moderate deterioration e.g., cancer staging
urgent outpatients within 10 days
Non-urgent (Priority 4) minimal deterioration e.g., chronic dizziness/hearing loss
outpatients within 28 days
* Priority levels and target times for waiting for diagnostic imaging services in Ontario are developed by clinical experts across the province to guide treatment decisions and manage patient access and outcomes.
373MRI and CT Scanning Services
Chap
ter 3
• VF
M S
ectio
n 3.
08
each individual priority level and for all priorities combined. Appendix 5 explains the various meth-ods used by Cancer Care Ontario to measure wait times and describes the advantages and disadvanta-ges of these methods; it also explains the method of measuring real-time wait times, which we discuss in Section 4.6. As the Ministry targets are set at the 90th percentile, we have selected this measure to report wait times in our audit report.
2.5 Key Players in the Diagnostic Imaging Sector
The following are the key players in diagnostic imaging sector in Ontario:
Ministry of Health and Long-Term Care (Ministry) The Ministry is responsible for capacity planning, policy development, and overseeing operating funding and performance of MRI and CT scan-ning services in Ontario. It provides leadership and management direction in operational and policy initiatives, and through its responsibility for Ontario’s hospitals. The Ministry and Local Health Integration Networks (LHINs) sign the Ministry–LHIN Accountability Agreement, which outlines their mutual responsibilities. The Ministry has legislative oversight over hospitals’ compliance with the Healing Arts Radiation Protection Act, 1990 and other laws. This act oversees the use of certain diagnostic imaging equipment, including x-ray and CT machines, but not MRI machines because MRI machines do not expose people to radiation. As of August 2018, the Oversight of Health Facilities and Devices Act, 2017, which expanded the Ministry’s oversight for MRIs, had passed. This act was not yet in force when we completed our audit. The Ministry has also licensed seven independent health facili-ties to provide MRI and CT scanning services under the Independent Health Facilities Act, 1990, further discussed in Section 4.12.
Local Health Integration Networks (LHINs) LHINs are responsible for transferring global fund-ing as well as specific operating funding for MRI and CT scans from the Ministry to hospitals within their regions. They review and submit business cases to the Ministry for its approval for operating funding in relation to new machines in hospitals. The LHINs monitor hospital wait-time and effi-ciency data. LHINs sign Hospital Service Account-ability Agreements with their hospitals, which outline their mutual responsibilities.
Cancer Care Ontario (CCO) CCO is a provincial agency with a mandate, among others, to collect and report wait-time and efficiency data relevant to MRI and CT scanning services. Its Diagnostic Imaging Advisory Committee suggests ways to address wait-time issues and guide program strategy and priorities. CCO validates the data submitted by hospitals before it provides the information to Health Quality Ontario for public reporting.
Ontario Hospitals Hospitals are responsible for procuring and manag-ing MRI and CT machines as well as scheduling, managing and providing safe scanning services within their operations. Radiologists who work in hospitals assign priority levels to incoming refer-rals, and interpret and share imaging results with the physicians who refer their patients for imaging. Hospitals are required to report relevant wait-time and other efficiency data, such as the patient no-show rates we discuss in Section 4.9, to Cancer Care Ontario regularly.
3.0 Audit Objective and Scope
Our audit objective was to assess whether Ontario hospitals, working with the Ministry of Health and Long-Term Care (Ministry), Cancer Care Ontario

374
Chap
ter 3
• VF
M S
ectio
n 3.
08
(CCO) and their respective Local Health Integration Networks (LHINs), have effective policies and procedures in place to:
• ensure that magnetic resonance imaging (MRI) and computed tomography (CT) scan-ning services are provided in a timely, safe, equitable, appropriate and cost-effective manner to meet Ontarians’ needs in accord-ance with applicable standards, clinical guidelines and legislation; and
• measure and publicly report periodically on the results and effectiveness of MRI and CT scanning services in meeting patients’ clinical needs.
Before starting our work, we identified the audit criteria we would use to address our audit objective. These criteria were established based on a review of applicable legislation, policies and procedures, and internal and external studies. Senior management at the Ministry, CCO, the four hospitals where we did detailed audit work (the Ottawa Hospital, Health Sciences North, St. Joseph’s Healthcare Hamilton and Mackenzie Health) and their respective LHINs (Champlain, North East, Hamilton Niagara Haldimand Brant, and Central) reviewed and agreed with our objective and associated criteria as listed in Appendix 6.
Our audit work was conducted primarily at CCO and the four hospitals where we conducted audit work from January to July 2018. We obtained writ-ten representation from the Ministry, CCO, the four hospitals and their respective LHINs that, effective November 9, 2018, they have provided us with all the information they are aware of that could significantly affect the findings of this report. We interviewed senior management and appropriate staff, and examined related data and documenta-tion at the Ministry, CCO, the four hospitals and their respective LHINs.
To obtain a better understanding of the unique challenges faced by other hospitals in delivering MRI and CT services, we also visited five other hos-pitals (see Appendices 3 and 4), interviewed their
senior management and obtained relevant informa-tion. We based our selection of these hospitals on factors including wait times, number and age of machines, number of scans performed, geograph-ical location, hospital type and other observations we made throughout our audit that prompted further examination.
The majority of our file review went back three to five years, with some funding trend analysis going back 10 years. We reviewed relevant research from Ontario and other Canadian provinces, as well as foreign jurisdictions.
We also obtained and reviewed relevant infor-mation from the Ministry on the seven independent health facilities (discussed in Section 4.9) that are funded by the Province to operate MRI and/or CT scanning services in Ontario.
We talked to representatives from stakeholder groups, including Health Quality Ontario, the Ontario Association of Radiologists and the Can-adian Association of Radiologists, to gain their perspectives on diagnostic imaging with regard to MRI and CT scanning services in particular.
We engaged an expert advisor with medical background and expertise in assessing the effi-ciency of government-funded services such as MRI and CT scanning services.
We did not rely on the work of internal audit, as it has not conducted any recent work related to MRI and CT scanning services.
Finally, we considered the relevant issues reported in our 2006 audits “Hospitals—Man-agement and Use of Diagnostic Imaging Equip-ment” and “Hospitals—Administration of Medical Equipment”; our 2012 audit “Independent Health Facilities” and our 2017 audit “Cancer Treatment Services.”
We conducted our work and reported on the results of our examination in accordance with the applicable Canadian Standards on Assurance Engagements—Direct Engagements issued by the Auditing and Assurance Standards Board of the Chartered Professional Accountants of Canada. This included obtaining a reasonable level of assurance.

375MRI and CT Scanning Services
Chap
ter 3
• VF
M S
ectio
n 3.
08
The Office of the Auditor General of Ontario applies the Canadian Standards of Quality Control and, as a result, maintains a compre-hensive quality control system that includes documented policies and procedures with respect to compliance with rules of professional conduct, professional standards and applicable legal and regulatory requirements.
We have complied with the independence and other ethical requirements of the Code of Professional Conduct of the Canadian Professional Accountants of Ontario, which are founded on fundamental principles of integrity, objectivity, pro-fessional competence and due care, confidentiality and professional behaviour.
4.0 Detailed Audit Observations
4.1 65% of MRI Patients and 33% of CT Patients Had Long Waits for Their Scans, in Excess of the Ministry’s Targets for Semi-urgent and Non-urgent Priority Patients
Our audit found that while Ontario hospitals were mostly able to provide timely services to patients who required either an emergency or urgent MRI or CT scan, they were unable to do so for semi-urgent and non-urgent patients. The Ministry’s target for providing emergency scans is 24 hours, and its target for urgent scans is two days. The targets for semi-urgent and non-urgent scans are 10 days and 28 days, respectively.
The Ministry has set its target for the 90th percentile. This means that 90% of patients should receive their scans within target, and no more than 10% should wait longer than that. For semi-urgent and non-urgent patients, however, far greater percentages than 10% waited longer than 10 and 28 days, according to statistics compiled by Cancer Care Ontario.
• MRI scans: For emergency patients, only 5% waited longer than 24 hours. For urgent patients, 17% waited longer than two days (up to five days). Semi-urgent and non-urgent patients accounted for 91% of the total MRI scans in 2017/18. Overall, only 35%, not 90%, of semi-urgent and non-urgent patients received MRI scans within the Ministry’s tar-gets of 10 days and 28 days, respectively. The remaining 65%, not 10%, waited longer than these targets (see Figure 7).
• CT scans: For emergency patients, less than 1% waited longer than 24 hours. For urgent patients, 4% waited longer than two days (up to four days). Semi-urgent and non-urgent patients accounted for about 49% of the total CT scans in 2017/18. Only 67%, not 90%, of semi-urgent and non-urgent patients received CT scans within the Ministry’s 10-day and 28-day targets for these two groups. The remaining 33% of patients, not 10%, waited longer (see Figure 9).
In our hospital visits, we noted that the percentage of patients scanned within target (especially patients requiring non-urgent scans) was strongly influenced by anomalies in the wait-list system. For example, when patients cancelled a confirmed scheduled appointment, other patients who were still waiting for a scan were often able to jump the queue and have their scan performed sooner—even though many were not the highest priority patients on the wait list.
Hospital staff we spoke to about this specific issue at three of the four hospitals that otherwise reported high wait times informed us that these patients formed a large percentage of the patients scanned within target. As a result, the percentage of patients scanned within target (28 days for non-urgent patients) as disclosed by these hospitals often skewed both the average and 90th percentile calculations reported by the Ministry. We discuss more appropriate and useful reporting methods in Section 4.6.

376
Chap
ter 3
• VF
M S
ectio
n 3.
08
Even though these patients have been classified below the urgent level by radiologists, long wait times delay the diagnosis and treatment of their conditions and can affect their quality of life (for example, delaying their return to work or school); in some cases, the delay can result in deteriora-tion of a patient’s condition and extra cost to the health-care system. During our audit, we noted the following:
• A patient wrote to the then Minister of Health and Long-Term Care in early 2018 about his own case and the consequences of the delay in scheduling an appointment. The patient was assessed as non-urgent and put into a long wait list for seven months. However, dur-ing the long wait, the patient was hospital-ized for a surgery that in the patient’s opinion “[was] for a condition that might have been caught by that CT scan.” The patient further stated that “I was in hospital care for two months with at least three medical teams attending to me (I am still not recovered). We can imagine the cost to the taxpayer let alone the damage perpetrated against the patient. According to my surgeon, I came within a half-inch … of losing my leg. All of this might have been obviated by a correctly scheduled medical image.…”
• We noted another example where a neurolo-gist who has extensive experience with the health sector expressed concerns about wait-time problems in general:
• “For routine studies [meaning non-urgent scans], we have seen considerable wait times.… For some MRI requests we have been given wait times of over 6 months for routine studies. Although these stud-ies may not be urgent, this delay creates anxiety for our patients over protracted periods of time. Even if the neurologist doesn’t think there is a tumor or multiple sclerosis, the patient may—and will agon-ize over this daily for 6+ months.”
• “Another issue is that some eventually diagnosed pathologies may have been bet-ter addressed months earlier. For example, an imaging scan for dementia may seem routine but if prominent vascular pathol-ogy is identified, more urgent stroke prevention may be warranted. If a tumor is identified, it would likely have been better addressed 6 months earlier.”
• “I am also concerned that the wait time creates waste. For example, if there is a prolonged wait for MRI, an interim CT scan may be ordered to ensure there isn’t gross pathology but the MRI will still be needed so extra resources are consumed.”
Many of the physicians and hospital staff we interviewed echoed these viewpoints.
Long wait times also introduce an unnecessary element of uncertainty into Ontario’s health-care system. The wait for a scan is a bottleneck in the patient’s progress through the system: decisions on further treatment often have to wait until the scan is completed and interpreted. As a complex system that consists of many interacting parts, Ontario’s health-care system requires predictability to plan its actions and direct its resources most efficiently.
4.1.1 Ontarians Experienced the Lowest Wait Time among Five Other Provinces
Although patients in Ontario waited longer than the provincial targets for both MRI and CT scans, Ontario’s wait times for both scans were among the lowest compared to five other provinces where the 90th percentile data was most recently avail-able. We show the data compiled by the Canadian Institute for Health Information (CIHI) for the period between April and September 2016, and for the same period in 2017, in Figures 4 and 5. (CIHI’s reports do not include data from British Columbia and Quebec, which was not publicly available.)
In addition, the Canadian Agency for Drugs and Technologies in Health reported that in 2017, Ontario performed a relatively high number of

377MRI and CT Scanning Services
Chap
ter 3
• VF
M S
ectio
n 3.
08MRI and CT examinations per 1,000 population compared to other provinces in Canada, as shown in Appendix 7. We also noted that Ontario has set more ambitious and potentially harder to attain wait-time targets than other provinces and the Can-adian Association of Radiologists have set; these are shown in Appendix 8.
4.1.2 MRIs: Many Patients Had Long Waits for Semi-urgent and Non-urgent Scans
Semi-urgent and non-urgent scans made up 91% of the total MRI volume in 2017/18. That same year, 61% of semi-urgent patients received their scans within target (10 days); 29% waited between 11 and 34 days; and 10% waited more than 34 days.
As non-urgent patients waited the longest to receive their MRI scans, in Figure 6 we have shown wait times for these patients for 2017/18, with the number and percentage of patients and their wait times stated in day ranges.
As the Ministry sets its target at the 90th percentile, we have assessed the Ministry’s progress toward this target. Figure 7 shows the 90th percentile wait-time trend over the last five years for semi-urgent and non-urgent MRI requests,
and compares it to the wait-time targets set by the Province as well as the targets recommended by the Canadian Association of Radiologists.
We noted that, on an annual basis, hospitals consistently performed a lower number of scans than the number of incoming requisitions during a year. As a result, an increasing backlog of outstand-ing scan requests increased by 63% from 85,021 as of April 1, 2014, to 138,197 as of April 1, 2018, which led to the long waits. Many factors contrib-uted to the increasing backlog:
• Technological advances in imaging equip-ment have contributed to increased demand. Physicians are increasingly relying on MRI imaging for purposes such as diagnosing cardiac events, providing care for cancer patients, and screening high-risk individuals for breast cancer.
• Increasing numbers of follow-up scans for patients who need continuous monitoring for progression or remission of disease (such as cancer) drive up the demand year after year. From 2013/14 to 2017/18, the demand for follow-up scans increased by 46%, compared to only 14% for initial or one-time scans and other types of scans.
Figure 4: Comparison of Selected Provincial Wait Times for MRI Scans, April–September, 2016, and April–September, 2017Source: Canadian Institute for Health Information
Wait Time (Days)April–September, April–September,
Province 2016 2017Ontario 99 96Saskatchewan 208 174
Manitoba 176 205
PEI 181 231
Nova Scotia 203 241
Alberta 242 277
Notes:
• Wait times are measured as the maximum amount of time in which 90% of patients have received their MRI scans.
• Provinces shown are those for which comparable data was available.
Figure 5: Comparison of Selected Provincial Wait Times for CT Scans, April–September, 2016, and April–September, 2017Source: Canadian Institute for Health Information
Wait Time (Days)April–September, April–September,
Province 2016 2017Ontario 41 35Manitoba 46 49
Saskatchewan 61 55
Nova Scotia 77 92
Alberta 92 110
PEI 71 113
Notes:
• Wait times are measured as the maximum amount of time in which 90% of patients have received their CT scans.
• Provinces shown are those for which comparable data was available.

378
Chap
ter 3
• VF
M S
ectio
n 3.
08
• Imaging equipment is not operating sufficient hours to meet patient demand (discussed in Section 4.4).
In 2017/18, the Ministry funded the hospitals with an additional one-time funding of $7.3 million. This additional funding contributed to shorter wait times of MRI scans for urgent, semi-urgent, cancer, and high-risk Ontario Breast Screening Program patients by 20% to 32% (or between one and 42 days).
4.1.3 CTs: Some Patients Had Long Waits for Semi-urgent and Non-urgent Scans
As with MRI scans, the Ministry sets its target for CT scans at the 90th percentile. This means that 90% of patients should receive their CT scans within 10 days for semi-urgent patients and within 28 days for non-urgent patients, and no more than 10% should wait any longer.
We noted that wait times for patients requiring CT scans are shorter than for MRI scans. The main reason for this is that the time needed to perform a
Figure 6: MRI Wait Times for Non-urgent Patients, 2017/18Source of data: Cancer Care Ontario
Wait Timewithin Target
(Days) Wait Time in Excess of Target (Days)0–28 29–60 61–90 91–150 151–240+ Total
# of Scans Performed* 171,099 203,044 108,733 60,775 18,790 562,441(%) 30 36 19 11 4 100
* Number of scans performed excludes patients who received follow-up scans.
Figure 7: Wait Times for MRI Scan for Semi-urgent and Non-urgent Patients, 2013/14–2017/18 (Days)Source of data: Cancer Care Ontario
2013/142014/152015/162016/172017/18
33
69
43
85
52
103
42
114
34
106
05
101520253035404550556065707580859095
100105110115120
Semi-urgent Non-urgent
Ministry Target:2 within 10 days
Ministry Target:2 within 28 daysCAR Target:1 within 30 days
CAR Target:1 within 60 days
1. Target recommended by the Canadian Association of Radiologists (CAR).2. Ministry’s wait times measured as the maximum amount of time in which nine of 10 patients have received their MRI scans.

379MRI and CT Scanning Services
Chap
ter 3
• VF
M S
ectio
n 3.
08
CT scan is much less; CT scans take a few minutes, while MRI scans can take from 20 minutes to more than an hour.
Also, CT scans are often used in emergency cases to quickly examine patients who may have internal injuries or other types of trauma. These rapid examinations often reveal internal injuries and/or bleeding quickly enough to help save lives. These patients are at the highest priority level and are scanned within the Ministry target of 24 hours. This partly explains why semi-urgent and non-urgent
patients made up only 49% of total CT requests in 2017/18, compared to 91% for MRI requests.
As non-urgent patients waited the longest to receive their CT scans, in Figure 8 we have shown the number and percentage of scans performed on these patients in 2017/18, with wait times stated in day ranges.
Since the Ministry sets its target at the 90th percentile, once again we have assessed its progress by showing the 90th percentile wait-time trend for semi-urgent and non-urgent patients. Figure 9
Figure 8: CT Wait Times for Non-urgent Patients, 2017/18Source of data: Cancer Care Ontario
Wait Timewithin Target
(Days) Wait Time in Excess of Target (Days)0–28 29–60 61–90 91–150 151–240+ Total
# of Scans Performed* 259,099 76,308 23,540 12,488 6,139 377,574% 69 20 6 3 2 100
* Number of scans performed excludes patients who received follow-up scans.
Figure 9: Wait Times for CT Scans for Semi-urgent and Non-urgent Patients, 2013/14–2017/18 (Days)Source of data: Cancer Care Ontario
2013/142014/152015/162016/172017/18
Ministry Target:2 within 10 days
Ministry Target:2 within 28 daysCAR Target:1 within 30 days
25
48
28
44
28
61
30
69
28
64
0
10
20
30
40
50
60
70
80
Semi-urgent Non-urgent
CAR Target:1 within 60 days
Ministry Target:2 within 10 days
Ministry Target:2 within 28 days
1. Target recommended by the Canadian Association of Radiologists (CAR).2. Ministry’s wait times measured as the maximum amount of time in which nine of 10 patients have received their CT scans.

380
Chap
ter 3
• VF
M S
ectio
n 3.
08
shows the wait-time trend for CT scans for these patients over the last five years and compares it to the targets set by the Ministry as well as the targets recommended by the Canadian Association of Radiologists.
The reasons for the long waits for CT scans are similar to what we see with MRI scans. The main reasons are the backlog of patients wait-ing to be scanned, the constantly rising demand resulting from advances in the technology and the machines’ capabilities, and the increase in the number of follow-up scans for patients who need continuous monitoring.
We discuss wait-time issues from different per-spectives in the sections that follow.
4.2 Wait Times for Scans Vary Depending on Where Patients Live
Our audit found that wait times for MRI and CT scans varied significantly depending on where patients live. The disparity for non-urgent patients was the most significant. Figure 10 shows the MRI wait times for non-urgent patients by LHIN in 2017/18; Figure 11 shows the corresponding CT wait times.
Cancer Care Ontario collects information on wait times at the LHIN level, including total number and type of scans performed, type of hospital, use by patients from outside the LHIN, number of MRI and/or CT machines, and length of time machines are run. The Ministry has not used this data, how-ever, to analyze the reasons for the significant dif-ferences in wait times among LHINs that may result in inequitable experiences in the health-care system for patients living in different regions.
Figure 10: MRI Wait Times for Non-urgent Patients, by Local Health Integration Network (LHIN),1 2017/18 (Days)Source of data: Cancer Care Ontario
203
133126
115103 101
96
7872 71 70 68
63
0102030405060708090
100110120130140150160170180190200210220
Champlain TorontoCentral
Central MississaugaHalton
NorthWest
ErieSt. Clair
HamiltonNiagara
HaldimandBrant
NorthEast
WaterlooWellington
SouthEast
SouthWest
CentralEast
NorthSimcoe
Muskoka
Ministry Target:2 within 28 days
1. Central West LHIN has one hospital which operates four MRI machines. This hospital’s data contained significant inaccuracies due to a system implementation issue, and therefore the information has not been published by the Ministry of Health and Long-Term Care on the Health Quality Ontario website and is not included in this figure.
2. Wait times are measured as the maximum amount of time in which 90% of patients have received their MRI scans.

381MRI and CT Scanning Services
Chap
ter 3
• VF
M S
ectio
n 3.
08
4.2.1 MRI Scans
We noted that the Champlain, Toronto Central and Central LHINs have relatively higher MRI wait times for non-urgent patients than other LHINs. These three LHINs had unique challenges that drove up their wait times:
• Champlain LHIN serves the fourth high-est population in Ontario (approximately 1.3 million as of July 2017). Outside of the University Health Network, Ottawa Hospital in Champlain LHIN is Ontario’s largest teach-ing or academic hospital and provides the highest number of MRI scans (approximately 36,000 in 2017/18); it is also the only teach-ing hospital performing complex scans within this LHIN. The other two teaching hospitals in Champlain LHIN serve specific populations: pediatric patients at the Children’s Hospital
of Eastern Ontario, and francophone patients at l’Hôpital Montfort. With the exception of these two, the nearest teaching hospital in Ontario is Kingston Health Sciences Centre in South East LHIN, 195 kilometres away. Hence, the wait times at Ottawa Hospital have driven up the overall wait times for its LHIN. Section 4.3 further discusses wait times in teaching hospitals.
• In Toronto Central LHIN, 58% of the patients its hospitals served were from outside the LHIN. In particular, Sunnybrook Hospital and the University Health Network offer specialized MRI services to patients across the province: Sunnybrook is the largest single-site critical care resource in Ontario and one of the largest regional trauma and oncology centres. University Health Network is a well-known research centre, attracting physician
Figure 11: CT Wait Times for Non-urgent Patients, by Local Health Integration Network (LHIN), 1 2017/18 (Days)Source of data: Cancer Care Ontario
1. Central West LHIN has two hospitals of which one operates six CT machines. This hospital’s data had significant inaccuracies due to a system implementation issue, and therefore the information has not been published by the Ministry of Health and Long-Term Care on the Health Quality Ontario website and is not included in this figure.
2. Wait times are measured as the maximum amount of time in which 90% of patients have received their CT scans.
TorontoCentral
MississaugaHalton
NorthWest
ErieSt. Clair
HamiltonNiagara
HaldimandBrant
NorthEast
WaterlooWellington
SouthEast
SouthWest
CentralEast
NorthSimcoe
Muskoka
127
106
8783
74
58
48
38 37 3531 29 27
0
10
20
30
40
50
60
70
80
90
100
110
120
130
140
Champlain
Brant
Central
Ministry Target:2 within 28 days

382
Chap
ter 3
• VF
M S
ectio
n 3.
08
referrals for MRI scans in complex and spe-cialized cases.
• Central LHIN serves the highest population in the province (approximately 1.9 million as of July 2017); in addition, 28% of the patients it served were from outside this LHIN.
North Simcoe Muskoka LHIN, with the second lowest population density in the province, had the shortest wait times for MRI scans.
4.2.2 CT Scans
We noted that, for CT scans, Champlain, North East and Toronto Central LHINs have relatively higher wait times for non-urgent patients than other LHINs. The reasons are similar to those explained for MRI scans in the previous section. In addition, North East LHIN has only one teaching hospital performing 35% of all emergency and urgent scans, therefore driving up the wait times overall for this LHIN. In 2017, as requested by the Ministry, CCO analyzed whether additional CT machines are required in the North East and North West LHINs and recommended three potential areas where patients who were travelling over 100 kilometres could benefit from a mobile CT machine. As of August 2018, the Ministry had not made a decision whether to install a new machine in these areas.
RECOMMENDATION 1
To help ensure patients have equitable access to MRI and CT services across the province, we recommend that the Ministry of Health and Long-Term Care work with Local Health Integra-tion Networks (LHINs) and hospitals to:
• analyze and identify the reasons why wait times vary significantly between LHINs:
• for MRI services; and
• for CT services; and
• take necessary actions to reduce the wait-time inequities across the province:
• for MRI services; and
• for CT services.
MINISTRY RESPONSE
The Ministry of Health and Long-Term Care sup-ports this recommendation and will work with LHINs, hospitals and clinical experts to deter-mine the causes of local and regional variations in wait times for MRI and CT services and take necessary action to address any inequities.
4.3 Patients in Teaching Hospitals Wait Significantly Longer for Scans than Those in Community Hospitals
Patients classified as semi-urgent or non-urgent had to wait significantly longer for their scans in teaching hospitals than those waiting in community hospitals. Figure 12 shows the MRI wait times for semi-urgent and non-urgent patients at teaching versus community hospitals; Figure 13 shows the corresponding CT wait times. The reasons for the long waits in teaching hospitals include the following:
• Referring physicians or the patients them-selves may prefer to have a scan done and interpreted at a teaching hospital because of a perception that teaching hospitals have better quality of care even for semi-urgent or non-urgent cases. Radiologists at the four hospitals where we conducted audit work primarily read and interpret scans performed in their own hospital. However, we did not note any significant issues among radiologists at teaching hospitals associated with reading and interpreting scans performed at other hospitals, if that creates efficiencies.
• Teaching hospitals have the expertise to scan, interpret and diagnose complex and specialized patient cases, and therefore they receive a high number of referrals. Particularly for MRI scans, the complex scans (specialized by body part) that teaching hospitals specialize in generally require more time for each scan, leaving less time

383MRI and CT Scanning Services
Chap
ter 3
• VF
M S
ectio
n 3.
08
Figure 12: MRI Wait Times for Semi-urgent and Non-urgent Patients, Teaching vs Community Hospitals,1 2017/18 (Days)Source of data: Cancer Care Ontario
1. Of the hospitals with MRI machines, 18 were teaching hospitals and 34 community hospitals. 2. Wait times are measured as the maximum amount of time in which 90% of patients have received their MRI scans.
TeachingCommunity
40
139
18
90
0
10
20
30
40
50
60
70
80
90
100
110
120
130
140
150
Semi-urgent Non-urgent
Ministry Target:2 within 10 days
Ministry Target:2 within 28 days
Figure 13: CT Wait Times for Semi-urgent and Non-urgent Patients, Teaching vs Community Hospitals,1 2017/18 (Days)Source of data: Cancer Care Ontario
TeachingCommunity
29
99
15
53
0
10
20
30
40
50
60
70
80
90
100
110
Semi-urgent Non-urgent
Ministry Target:2 within 10 days
Ministry Target:2 within 28 days
1. Of the hospitals with CT machines, 18 were teaching hospitals and 60 community hospitals.2. Wait times are measured as the maximum amount of time in which 90% of patients have received their CT scans.

384
Chap
ter 3
• VF
M S
ectio
n 3.
08
implementation date by fall 2019. The intent of this system would be to distribute non-urgent cases among hospitals within the same LHIN, reducing the long waits in some of the LHIN’s hospitals. Waterloo Wellington LHIN was also working on an e-referral system.
RECOMMENDATION 2
To help ensure timely and equitable access for semi-urgent and non-urgent MRI and CT servi-ces, we recommend that Local Health Integra-tion Networks (LHINs) continue to work with hospitals to:
• offer referring physicians and patients the option of having scans performed in hospitals with lower wait times, and having the results interpreted with guidance from specialized radiologists and physicians in teaching hospitals, where needed:
• for MRI services; and
• for CT services; and
• where applicable, redistribute the incoming referrals between teaching and commun-ity hospitals within a LHIN by using an effective tool such as a centralized intake or referral process:
• for MRI services; and
• for CT services.
RESPONSE FROM LHINS
The LHINs acknowledge the benefit of stream-lining referral processes and commit to work with hospitals and physicians to explore solutions such as centralized intake, offering alternative referral options, and/or developing common tools. The LHINs recognize such strat-egies should be co-ordinated with other initia-tives to more effectively improve wait times. The specific strategies explored may vary across the province to reflect differences in populations, geographies, and clinical and financial resources that exist within LHINs.
and fewer resources for less complex scans. (Complex scans are defined as scans that are performed on emergency, urgent and/or in-patients, patients requiring general anaesthesia before the scan can be performed or patients whose scans are expected to take longer than 60 minutes.) As a result, other patients scheduled for scans may find themselves on a long wait list. We compared the percentages of complex scans performed in teaching and community hospitals and noted that teaching hospitals performed more than double those performed by community hospitals.
• For CT scans, teaching hospitals performed on average about double the number of emer-gency scans performed by community hospi-tals (11,000 scans compared to 6,000 scans). The higher number of emergency scans may leave less machine time for other priority levels, resulting in high wait times for these other patients. Emergency scans comprised more than 30% of total CT scans performed in 2017/18.
Ontario places no restriction on where a patient can obtain a scan. It also has no standard or set of consistent practices in place to process and distribute physician referrals for MRI or CT scans among hospitals, especially for semi-urgent and non-urgent cases. As a result, semi-urgent and non-urgent cases are frequently referred to teach-ing hospitals, where these patients are assigned low priority and have significantly long wait times. Conversely, some physicians refer their patients to community hospitals with lower wait times so their scans can be performed earlier than in a teaching hospital. However, one specialist cautioned that this may pose a risk if complex scans are not inter-preted by specialized physicians with the required expertise, most often found in teaching hospitals.
We noted that hospitals in Champlain LHIN were working with the LHIN to establish a central-ized intake system for scans to allocate demand equitably among the hospitals, with a tentative

385MRI and CT Scanning Services
Chap
ter 3
• VF
M S
ectio
n 3.
08
4.4 Patients Wait Unnecessarily Long for Scans Because Machines Are Not Operating Sufficient Hours despite Available Capacity
We found that existing MRI and CT machines could be used for more hours per week, thereby reducing wait times, but the hospitals were financially unable to increase their operating hours for these machines to meet patient demand.
The Ministry’s MRI and CT Expert Panel (Panel) stated in 2005 that these machines should meet efficiency standards and operate extended hours to minimize the fixed cost per exam. The Panel recommended a minimum standard for MRI and CT operations at 16 hours a day, seven days a week. We noted that if all 108 MRI and 165 CT machines in the province followed the Panel’s recommendation, hospitals would have been able to outperform the Ministry’s wait-time targets, as explained in Sec-tions 4.4.1 and 4.4.2.
4.4.1 MRI Scans
Between 2013/14 and 2017/18, the Ministry’s annual funding for MRI operations increased by about 3%, from $152 million to $157 million. Staff at two of the four hospitals where we conducted audit work informed us that they used part of their global budgets to run their MRI machines for addi-tional hours, but not all hospitals we spoke to could find the funds they needed to do this.
In 2017/18, the Ministry funded Ontario hospitals for a total of 473,000 MRI hours based on a funding model of $385/hour for the first 2,080 hours and $260/hour thereafter. The Min-istry also provided one-time funding to support an additional 28,000 hours, for a total of 501,000 operating hours. The hospitals, meanwhile, oper-ated a total 523,511 MRI hours, or 22,511 hours beyond the number funded by the Ministry. Even though the hospitals were operating their MRIs for more hours than the Ministry funded, the
machines were still operating at only 56% of their maximum capacity.
We found that while many of the hospitals were not running their MRI machines at the maximum, a few others were running their machines close to the maximum. Overall, we noted that in 2017/18, of the 108 MRI machines, 69% (75 machines) were run below 16 hours a day, seven days a week; 29% (31 machines) were run between 16/7 and 23/7; and the remaining 2% (two machines) were kept running more than 23/7. For example, one of the four hospitals where we conducted audit work had high wait times (134 days for non-urgent patients), but was operating its MRI machines only 11 hours, six days a week—that is, at 39% of maximum capacity.
We also noted that in order to have completed 90% of scans within the Ministry’s wait-time target at the end of 2017/18 and to have cleared the back-log from prior years, the hospitals would have had to operate their MRI machines a total of 585,273 hours—514,579 hours for incoming requests received during the year and another 70,694 hours to clear the outstanding requests for MRI scans accumulated prior to 2017/18. However, the hospi-tals provided 61,762 fewer hours than the number of hours required.
Given that the hospitals were unable to clear the existing backlogs and meet the Ministry’s wait-time targets for the 2017/18 fiscal year, CCO projected that, for the following year, hospitals would need to run their MRI machines a total of 655,708 hours—576,288 hours to handle all the incoming requests received during the year and another 79,420 hours to clear the outstanding requests accumulated prior to 2018/19. These 655,708 hours are equivalent to an additional $34 million in funding (at a rate of $260/hour) for 132,197 hours (655,708 minus 523,511) assuming, for 2018/19, hospitals operate the same number of MRI hours as in 2017/18. At the time of our audit, the Ministry did not have a plan to increase its annual funding to hospitals.
386
Chap
ter 3
• VF
M S
ectio
n 3.
08
4.4.2 CT Scans
On average, all 165 CT machines were operated over 530,000 hours in 2017/18, or at approximately 37% of maximum capacity, despite long wait times. CCO does not have a predictive model to estimate the number of hours needed to achieve the Min-istry’s wait-time target for 90% of patients referred for CT scans, as was done for MRIs, discussed in the previous section.
RECOMMENDATION 3
To better utilize the existing MRI and CT machines and reduce wait times for services, we recommend that the Ministry of Health and Long-Term Care work with Cancer Care Ontario and hospitals to:
• assess whether the existing unused capacity at each hospital can be used to address existing backlogs from prior years and new requests for scans received by the hospital:
• for MRI machines; and
• for CT machines; and
• prepare a detailed action plan to better utilize the existing machines to improve wait times:
• for MRI services; and
• for CT services.
MINISTRY RESPONSE
The Ministry of Health and Long-Term Care sup-ports this recommendation and will work with Cancer Care Ontario, Local Health Integration Networks and hospitals to assess machine cap-acity and prepare an action plan to better utilize capacity to address wait times, with considera-tion given to geographical differences.
4.5 Ministry Unable to Justify Funding Method for Scans That Has Remained Unchanged for Over 10 Years
We noted that the Ministry’s funded hourly rates for MRI and CT services have remained unchanged for over a decade. It has not formally reviewed or revised the hourly rates since 2006. We also found that although hospitals self-report costing informa-tion that would allow the Ministry to calculate the average cost per scan, the Ministry has not used this information, together with other attributes such as demand, capacity and complexity of scans, to analyze and assess whether the current hourly rate is appropriate.
4.5.1 Ministry Unable to Justify Its Funding per MRI Machine
The Ministry was unable to justify why the alloca-tion of MRI funding for each machine is appropri-ate. In 2006, the Ministry standardized its funding formula to provide all machines 2,080 hours at the hourly rate of $385 and thereafter at $260 per hour. However, we noted that the Ministry funds approximately 20% of MRI machines (22 out of 108 machines) for between 3,120 hours and 4,160 hours operating time per machine at the rate of $385 per hour. The Ministry did not adjust the funding for these 22 machines, resulting in a higher annual funding of between $130,000 and $260,000 per MRI machine since then.
As well, we noted that hospitals self-report cost-ing information, which indicated that the average cost per MRI scan decreased from $143 in 2013/14 to $128 in 2017/18. Cost per scan varies by hospital because it depends on factors such as the types of scans and patients, and the time taken for each scan. Because of these factors, the average number of scans performed within an hour also varies between hospitals. For example, if in one hour an average of 1.6 MRI scans are performed (provincial average as reported by CCO), the $128 cost per

387MRI and CT Scanning Services
Chap
ter 3
• VF
M S
ectio
n 3.
08
machine at maximum capacity and could not perform more scans.
Wait times are lengthened when hospitals with high demand for scans are not funded according to the actual cost of meeting the demand, and when hospitals with available capacity lack the funds to put this capacity to use. Hospitals’ priorities may also be distorted by these funding inequities, as they may lack the incentive to perform complex scans requiring more resources.
4.5.2 Ministry Has Not Reviewed Appropriateness of Its Funding to Hospitals for CT Scans for More than 10 Years
Hospitals self-report costing information, which indicated that the average cost per CT scan decreased from $70 in 2013/14 to $64 in 2017/18. For example, if in one hour an average of 2.87 CT scans are performed (estimate based on data col-lected by CCO), the $64 cost per scan is equivalent to $181 per operating hour. However, the Ministry has not used this information, with other factors such as the increasing demand for CT services, to analyze and assess whether the current hourly rate of $250, or the total of $9 million funding to hospi-tals, is appropriate.
RECOMMENDATION 4
To help ensure the method used to fund hospi-tals for their MRI and CT machines is appropri-ate, we recommend that the Ministry of Health and Long-Term Care work with Local Health Integration Networks to:
• collect complete and relevant information on demand, capacity and types of scans and performed by each hospital:
• for MRI services; and
• for CT services; and
• use the information collected to regularly assess the reasonableness of the funding rates and allocations to each hospital and make any necessary adjustments:
scan is equivalent to $205 per operating hour. How-ever, the Ministry has not used this information to analyze and assess whether the current hourly rate of $385 (for the first 2,080 hours) and $260 (for operating hours over and above 2,080) are appropriate.
While the Ministry’s one-time funding of $7.3 million in 2017/18 and $6.9 million in 2018/19 was allocated based on projected demand by LHINs, its allocation of annual funding of $157 million among hospitals is primarily based on the number of hours each machine was funded historically. The allocation of annual funding does not incorporate the following key attributes at each hospital:
• Demand for scans at each hospital—the num-ber of MRI orders received and the regional demographic and population needs vary by hospital.
• Complexity and types of scans performed—some scans take longer than others to perform or to interpret. For instance, a scan requiring contrast material takes on average 40 minutes and requires at least two tech-nologists on site, whereas other scans take on average 20 minutes and require only one technologist on site. (The contrast material is a chemical substance called Gadolinium, injected into the patient to obtain enhanced images for certain types of scan.) Cardiac scans are also complex scans that take signifi-cantly longer than other scans.
• Unused MRI capacity within the hospital—allocation of the funding across hospitals does not consider the available capacity in operating hours at each hospital based on the number of machines it runs. We noted that throughout the year the Ministry and LHINs do not consistently track available capacity in each hospital to optimally allocate funds across hospitals. For instance, we were informed that one hospital could not utilize additional funds it received from the LHIN since it was already operating its MRI
388
Chap
ter 3
• VF
M S
ectio
n 3.
08
• for MRI services; and
• for CT services.
MINISTRY RESPONSE
The Ministry of Health and Long-Term Care (Ministry) supports this recommendation and will work with partners to determine and collect relevant information for MRI and CT services, and conduct an initial and regular review of existing funding approaches for MRI and CT services with adjustments made as necessary. In addition, the Ministry will work with Local Health Integration Networks to support the regular monitoring of utilization to make neces-sary funding adjustments.
4.6 Wait Times for Patients to Receive an MRI or CT Scan Are Higher than Publicly Reported for Selected Hospitals
To understand current real wait times and compare them to the publicly reported average wait times we note in Section 2.4, we asked staff at four selected hospitals what appointment dates were currently being provided to non-urgent patients, to obtain an understanding of how long a patient can expect to wait once the hospital has received his or her requisition form. Our analysis shows that wait times are higher than publicly reported for patients who were referred to receive an MRI or CT scan at these hospitals.
We obtained wait lists as of July 12, 2018 (we chose that day to ensure we compared all the wait lists at the same time point) from three of the four hospitals where we performed audit work. The fourth hospital was unable to generate the wait list in a similar report format for the purpose of our analysis, due to data quality issues resulting from a recent system implementation. A wait list contains, among other things, patients’ information, the date of their referrals for MRI or CT scans and their appointment dates (when scheduled).
From our analysis of the three hospitals, we found that:
• One hospital was not giving appointment dates to over 90% of the non-urgent patients who were referred to this hospital and waiting for MRI and/or CT scans. At the time of our audit, this hospital did not give appointment dates to these patients when they were first referred by their physicians. The fact that this hospital was not scheduling any appointments for these patients, which is very important for patients and referring doctors to know, was not communicated to the public.
• Another hospital had not given appointment dates to 45% of the non-urgent patients who were waiting for MRI scans. We noted that this hospital was not giving appointments to non-urgent patients who were waiting for scans requiring contrast agent (used for gen-erating clearer images in specific body parts).
• Although the third hospital had given appointments to all non-urgent patients who were waiting for MRI and/or CT scans, more than 85% of these patients were waiting in excess of the average wait time reported to the public.
Refer to Appendix 9 for our detailed analysis. As shown in Appendix 5, which lists the advan-
tages and disadvantages of five different meas-ures—average (mean), median, 90th percentile, date ranges and real-time wait time—it is import-ant to provide patients with the picture of their potential wait times that they can find most useful. This information is critical in allowing patients and their physicians to make informed decisions on diagnosis and treatment.
Before December 2017, the Ministry used to pub-licly report on wait times using the 90th percentile, which is the target set by the Ministry, as recom-mended and advised by clinical experts. Since then, Health Quality Ontario (HQO) started to report through its website on the average (mean) wait time and the percentage of patients scanned within
389MRI and CT Scanning Services
Chap
ter 3
• VF
M S
ectio
n 3.
08
For patients to use the information provided, they first must be aware that it exists. With assist-ance from hospital staff, we conducted a survey at the four hospitals we visited by asking patients who came in for MRI/CT scans, over one to two days, if they were aware that hospitals’ wait time information is publicly available. We found that very few patients were aware that they could access wait-time information:
• MRI patients: Overall, only 5% of the MRI patients surveyed were aware they could view MRI wait-time data by hospital. Of the 5% of the patients who were aware of the HQO website, 10% visited the website and found that the information was useful in planning their treatment.
• CT patients: Overall, only 3% of the CT patients surveyed were aware they could view CT wait-time data by hospital. Of the 3% of the patients who were aware of the HQO website, 20% visited the website, none of whom found that the information was useful in planning their treatment.
RECOMMENDATION 5
To better assist patients and physicians in mak-ing informed decisions, we recommend that the Ministry of Health and Long-Term Care:
• assess the advantages and disadvantages of various wait-time reporting methods;
• publicly report complete and relevant wait-time information by hospital, such as the percentage of patients scanned within various wait-time ranges and the next avail-able appointment date a patient who is on a hospital’s wait list would expect to receive a scan; and
• work with other health providers to increase public awareness of the availability of the wait-time information on Health Quality Ontario’s website.
the Ministry target for each individual priority level and for all priorities combined. The reason stated for the change was that a user survey revealed that patients and caregivers want to know how long they can expect to wait (that is, the typical wait or average for similar patients) and whether patients in Ontario receive timely care. The survey results also revealed that these new measures were easier for the public to understand than the 90th percentile figure.
The 90th percentile is an important measure of the Ministry’s progress, but neither it nor the average informs patients how long they are likely to wait for their scans. The usefulness of these measures is further diluted by the percentage of non-urgent patients who have been scanned within 28 days as a result of anomalies in the system (as explained in Section 4.1).
As noted in Section 4.1.2 and Figure 6, an alternative reporting method is to state wait times in day ranges by number and percentage of patients on the list. This method has the advantage of repre-senting every patient who has received a scan in a hospital. Therefore, it provides a more complete picture of how many patients waited in the past and for how many days.
These three methods—the average wait times reported to the public, the 90th percentile wait-time targets and wait-time day ranges—are all based on how long patients have waited to have their scans completed. In other words, the data used is a record of past performance. An alternative to methods that involve providing information on past performance is for hospitals to provide real-time information on patients’ expected wait times to CCO for public reporting. The real-time wait time reflects the next available appointment date that patients can expect to get, and its calculation changes according to a patient’s real position along his or her journey to receive a scan. It can therefore provide specific and useful information to patients and their physicians, and give the health-care system a more reliable picture of expected patient flow.

390
Chap
ter 3
• VF
M S
ectio
n 3.
08
MINISTRY RESPONSE
The Ministry of Health and Long-Term Care (Ministry) supports this recommendation and will assess various wait-time reporting meth-ods, options for expanded data collection and enhancing public reporting. The Ministry also welcomes the opportunity to increase public awareness of wait-time reporting.
4.7 Use of Scanning Machines Past Their Expected Service Life Could Affect Patient Safety as Well as Quality and Efficiency of Scans
To track when MRI and CT machines are due to be replaced, the Canadian Association of Radiologists (Canadian Radiologists) provides guidelines to define these machines’ life expectancy. According to the guidelines, life expectancy for an MRI or a CT machine ranges from eight to 12 years, assuming no upgrades are made to the machine, and depends on the number of hours per year it is run and number of scans per year. Figure 14 shows the number of MRI and CT machines in Ontario by age as well as the number of machines past their expected service life, assuming no upgrades are made, as of March 2018.
4.7.1 Forty-Nine, or 30%, of CT Machines in Ontario Are Past Their Expected Service Life
The radiologists we interviewed in the course of our audit stressed the clinical value of CT scans. Nevertheless, potential impacts on patient safety are a concern with older CT machines. Our audit found that, as of March 2018, of the 165 CT machines in hospitals, 49, or 30% of them, were past their expected service life as determined by the guidelines developed by the Canadian Radiolo-gists. CCO, on behalf of the Ministry, keeps track of the age of each CT machine; however, it does not know how many of these 49 CT machines may have been upgraded and therefore might have had their service life extended or their radiation dosage reduced.
The Ministry does not directly fund the acquisi-tion of CT machines. Instead, hospitals fund their purchase either from their internal capital budget and/or with money raised by the hospital founda-tion. Therefore, it is the hospitals that are respon-sible for replacing their CT machines at the end of their service life.
CT machines past their service life are more likely to generate lower quality images than newer technologically advanced machines. Newer machines also scan patients more quickly. Older
Figure 14: Number and Percentage of MRI and CT Machines Past Their Expected Service Life,* as of March 2018Source of data: Cancer Care Ontario
Age (Year)0–4 5–8 9–12 13–20 Total
MRI Machines# MRI machines by age 20 35 26 27 108% MRI machines by age 19 32 24 25 100# MRI machines past their expected service life 0 0 23 27 50% of total MRI machines past their expected service life 46CT Machines# CT machines by age 66 38 37 24 165% CT machines by age 40 23 22 15 100# CT machines past their expected service life 0 2 23 24 49% of total CT machines past their expected service life 30
* According to the Canadian Association of Radiologists’ guidelines, life expectancy for an MRI or a CT machine ranges from eight to 12 years, assuming no upgrades are made to the machine, and depends on the number of hours per year it runs and number of scans performed per year.
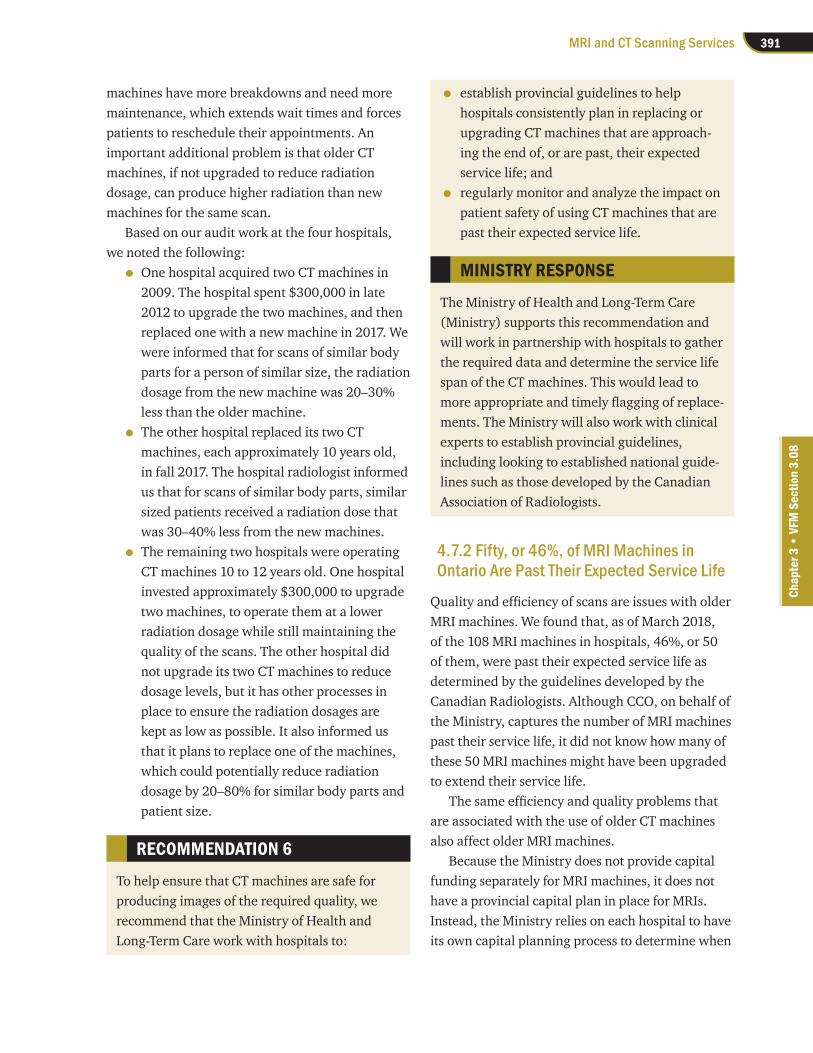
391MRI and CT Scanning Services
Chap
ter 3
• VF
M S
ectio
n 3.
08
• establish provincial guidelines to help hospitals consistently plan in replacing or upgrading CT machines that are approach-ing the end of, or are past, their expected service life; and
• regularly monitor and analyze the impact on patient safety of using CT machines that are past their expected service life.
MINISTRY RESPONSE
The Ministry of Health and Long-Term Care (Ministry) supports this recommendation and will work in partnership with hospitals to gather the required data and determine the service life span of the CT machines. This would lead to more appropriate and timely flagging of replace-ments. The Ministry will also work with clinical experts to establish provincial guidelines, including looking to established national guide-lines such as those developed by the Canadian Association of Radiologists.
4.7.2 Fifty, or 46%, of MRI Machines in Ontario Are Past Their Expected Service Life
Quality and efficiency of scans are issues with older MRI machines. We found that, as of March 2018, of the 108 MRI machines in hospitals, 46%, or 50 of them, were past their expected service life as determined by the guidelines developed by the Canadian Radiologists. Although CCO, on behalf of the Ministry, captures the number of MRI machines past their service life, it did not know how many of these 50 MRI machines might have been upgraded to extend their service life.
The same efficiency and quality problems that are associated with the use of older CT machines also affect older MRI machines.
Because the Ministry does not provide capital funding separately for MRI machines, it does not have a provincial capital plan in place for MRIs. Instead, the Ministry relies on each hospital to have its own capital planning process to determine when
machines have more breakdowns and need more maintenance, which extends wait times and forces patients to reschedule their appointments. An important additional problem is that older CT machines, if not upgraded to reduce radiation dosage, can produce higher radiation than new machines for the same scan.
Based on our audit work at the four hospitals, we noted the following:
• One hospital acquired two CT machines in 2009. The hospital spent $300,000 in late 2012 to upgrade the two machines, and then replaced one with a new machine in 2017. We were informed that for scans of similar body parts for a person of similar size, the radiation dosage from the new machine was 20–30% less than the older machine.
• The other hospital replaced its two CT machines, each approximately 10 years old, in fall 2017. The hospital radiologist informed us that for scans of similar body parts, similar sized patients received a radiation dose that was 30–40% less from the new machines.
• The remaining two hospitals were operating CT machines 10 to 12 years old. One hospital invested approximately $300,000 to upgrade two machines, to operate them at a lower radiation dosage while still maintaining the quality of the scans. The other hospital did not upgrade its two CT machines to reduce dosage levels, but it has other processes in place to ensure the radiation dosages are kept as low as possible. It also informed us that it plans to replace one of the machines, which could potentially reduce radiation dosage by 20–80% for similar body parts and patient size.
RECOMMENDATION 6
To help ensure that CT machines are safe for producing images of the required quality, we recommend that the Ministry of Health and Long-Term Care work with hospitals to:

392
Chap
ter 3
• VF
M S
ectio
n 3.
08
of radiation from the scans. However, the medical profession is aware of these concerns, particularly when it comes to pediatric patients who are the most vulnerable to the long-term effects of radia-tion. The main risk that is cited is the potential for this type of radiation to cause cancers. The poten-tial risk for a given patient depends on the radiation dosage the patient receives from each scan and the frequency of scans over a specific period. As well, older CT machines, if not upgraded to reduce dos-age, may emit higher amounts of radiation than newer machines, as discussed in Section 4.7.1.
We noted that the cumulative dosage levels per patient in Ontario are not tracked. Under the Occupational Health and Safety Act, occupational dosage limits are set for workers, including hospi-tal staff, from any source of x-rays, including CT machines. However, no similar legislative require-ment exist for patients in Ontario. We also noted that although CT machines capture the radiation dosage from each scan, neither the Ministry nor the four hospitals where we conducted audit work track each patient’s cumulative dosage.
Outside the four hospitals, we noted that two other hospitals use software to track cumulative radiation levels from scans within their own facili-ties, but cannot track dosage from scans their patients receive outside their hospitals.
Wide variations in radiation dosage given to patients for similar scans in different hospitals are also a health concern. In 2014, Toronto’s St. Michael’s Hospital set up a radiation dosage regis-try to track data collected from each CT scan it did and compare its results with several other hospitals.
Health Quality Ontario’s “Report and Recom-mendations on Modernizing Ontario’s Radiation Protection Legislation” (2016) recommended a dos-age registry system across hospitals along the lines of systems in use in the United Kingdom, California and elsewhere, to track radiation that patients receive from any type of medical equipment that emits radiation, including x-ray machines, as well as to compare radiation dosage per similar scan between hospitals.
and how a new MRI machine should be purchased and/or an old machine should be replaced. Based on our hospital visits, we noted that MRI machines can range from $1.4 million to $2.7 million, depending on the model and functionality. Hospi-tals fund their purchase from their internal capital budget and/or with money raised by the hospital’s local community.
RECOMMENDATION 7
To help ensure that MRI machines produce quality images and operate efficiently, we rec-ommend that the Ministry of Health and Long-Term Care work with hospitals to:
• establish provincial guidelines to help hospi-tals consistently plan to replace or upgrade MRI machines that are approaching the end of, or are past, their expected service life; and
• analyze the impact in areas such as quality and efficiency of using MRI machines that are past their expected service life.
MINISTRY RESPONSE
The Ministry of Health and Long-Term Care (Ministry) supports this recommendation and will work in partnership with hospitals to estab-lish provincial guidelines to support enhanced planning for MRI machines’ life cycles, including looking to established guidelines such as those from the Canadian Association of Radiologists. The Ministry will also analyze any impacts relating to using machines past their expected service life.
4.8 Hospitals’ Tracking of CT Scans’ Frequency of Use and Radiation Dosage per Patient Has Been Insufficient
As noted in Section 4.7.1, the radiologists we inter-viewed stressed the clinical value of CT scans, even when taking into account concerns over the impact

393MRI and CT Scanning Services
Chap
ter 3
• VF
M S
ectio
n 3.
08
RECOMMENDATION 8
To minimize the overall health effects on patients, and especially pediatric patients, from CT radiation, we recommend that the Ministry of Health and Long-Term Care work with hospitals to:
• evaluate the cost-effectiveness and feasibility of creating a CT dosage registry to track and monitor the radiation dosage patients receive during their lifetime; and
• use the dosage registry information to assess the impact of the variation across hospitals in dosage received from similar body scans.
MINISTRY RESPONSE
The Ministry of Health and Long-Term Care (Ministry) supports this recommendation. The Ministry will work with the appropriate stakeholders, including hospitals, to explore and assess the cost-effectiveness and feasibility for hospitals and facilities to collect and report the necessary data.
4.9 Hospital Booking and Scheduling of Appointments Could Be Improved
Cancer Care Ontario collects various efficiency met-rics including booking turnaround time and patient no-show rate. Our audit found that improvement in the following areas could be made by hospitals to maximize the use of resources and improve patient experience.
4.9.1 Hospitals Mail Letters or Phone Patients to Notify Them of Their Appointments
Once hospital staff schedule an appointment for a patient, they inform the physician and/or patient of the appointment date, time and other details. We noted that three of the four hospitals where we
conducted audit work send letters to notify patients when their appointments are first scheduled. The fourth hospital phones patients directly. None of the four hospitals use email or other automatic sys-tems that allow patients to confirm receipt of their appointment details electronically. Thus, the hos-pitals cannot be sure that all patients are aware of their appointments when they are first scheduled.
Then, to remind patients when their appoint-ments are coming up and confirm with patients, three hospitals phone them (calls are either auto-mated or in-person). The fourth uses an automated phone system or sends text messages when cell phone numbers are detected.
4.9.2 Patient No-Shows Are Costly but the Ministry and Hospitals Do Not Understand Why They Occur
When patients do not show up for an appointment or cancel it the same day, scanning machines can sit idle if hospitals are unable to fill the appointment slot quickly.
MRI Patient No-ShowsMRI no-show rates across hospitals, as reported to CCO, ranged from 0.1% to 13.4% of scheduled appointments for 2017/18. In 2017/18, hospitals reported a total of 48,320 missed MRI appoint-ments—representing the number of additional patients who could have received a scan that year. We estimated that such no-shows cost the hospitals about $6.2 million (48,320 patients × estimated $128/scan) to pay mainly for staffing. All four of the hospitals where we conducted audit work agreed on the difficulty they face in scheduling around missed MRI appointments. One hospital’s data showed that of the 24 no-shows it had in a sample week, it was only able to fill three slots.
None of the four hospitals where we conducted audit work routinely tracks the appointment con-firmation rate. Based on our audit testing of data available at three of the four hospitals, we noted

394
Chap
ter 3
• VF
M S
ectio
n 3.
08
patient populations. Although this information is available at CCO, it is not provided to the hospitals unless requested.
When we asked CCO to compile no-show rates by patient age, we found that patients aged 19–29 had a higher no-show rate in 2017/18 than other age groups, at 12%. This group might be more reachable with alternative communication methods or technology such as email and text messaging.
As well, we noted that all four hospitals where we conducted audit work do not routinely track the reasons for no-shows. Thus, even though the hospitals recognize the problem, they do not fully understand the reasons behind it and can do little to influence the trend. Hospital staff indicated that patients are less likely to remember appointments the more distant in the future the date is. As a result, one hospital schedules patients no earlier than a month before the next available appointment slot. We noted, though, that this has other implications for patients, discussed in Section 4.9.3.
RECOMMENDATION 9
To help improve efficiency of booking and scheduling of MRI and CT scanning appoint-ments and minimize patient no-shows, we recommend that hospitals:
• formally track the reasons for patient no-shows and develop strategies to reduce their prevalence; and
• track confirmation rates to assess the effectiveness of the existing notification and reminder systems to determine if a more user-friendly technology, such as automatic confirmation through email or text messa-ging, should be used.
RESPONSE FROM HOSPITALS
The hospitals agree that there need to be measures in place to establish effective and efficient processes to mitigate no-shows and to determine best practices in resource utiliza-tion. Hospitals recognize the importance of
that only 25–36% of the patients who received phone call reminders confirmed their appointment before the day of their scan. In comparison, 50% of the patients who received text messages confirmed their appointments. The fourth hospital did not have information available for our analysis at the time of our audit.
CT Patient No-Shows CT no-show rates across hospitals reported to CCO ranged from 0.6% to 13% of scheduled appoint-ments for 2017/18. In 2017/18, hospitals reported 57,916 CT appointment no-shows; however, we noted that they were able to fill these slots with little difficulty.
None of the four hospitals where we conducted audit work routinely tracks the appointment con-firmation rate. Based on our audit testing of data available at three of the four hospitals, we noted that only 21–41% of the patients who received phone call reminders from the hospitals confirmed their appointment before the day of their scan, while 54% of the patients who received text mes-sages confirmed their appointment. The fourth hospital did not have information available for our analysis at the time of our audit.
Reporting of No-Shows Hospitals report their no-show numbers to CCO regularly. However, they are not required to record or report on how many of their no-shows they are able to replace with another patient (such as an in-patient or an emergency department patient), nor do the hospitals actively track and monitor this information to determine the amount of time machines are sitting idle.
CCO reports no-show rates back to the hospitals to monitor as an efficiency metric. We noted that CCO could improve the relevancy of this metric if it were coupled with other patient demographic information (such as age and gender) and scan procedure to provide hospitals with insight on factors affecting the no-show rates in their local

395MRI and CT Scanning Services
Chap
ter 3
• VF
M S
ectio
n 3.
08
who were waiting to receive MRI appointments; on average, at 15, 28 and 197 days, in scheduling incoming non-urgent scan requests for 2017/18. The hospital with the largest backlog indicated that it schedules patients for their appointments approximately a month before the next avail-able open date, rather than as soon as possible, to minimize the number of appointments being re-scheduled during the long waits. However, this increases patients’ anxiety as they are waiting longer to receive their appointment details and times. This also impacts their ability to plan their treatment with their physicians. The same three hospitals indicated that they lack sufficient resour-ces, such as staffing, to schedule appointments on a timely basis.
RECOMMENDATION 10
To help ensure that patients receive the dates of their MRI appointments as soon as possible, we recommend that hospitals establish an effective process to monitor incoming scan requests and schedule appointments on a timely basis.
RESPONSE FROM HOSPITALS
Hospitals acknowledge the importance in noti-fying patients of appointments in a timely man-ner and the monitoring of incoming MRI scan requests. Hospitals generally attempt to provide timely notification of appointments. However, there are occasions where capacity to perform the requested examination becomes an issue. One hospital with a high backlog in notifying patients of their appointments in a timely man-ner is currently working with its new Healthcare Information System vendor to develop notifica-tion strategies that would confirm their appoint-ments, or when capacity is an issue, confirm receipt of their referrals along with a current anticipated wait time.
implementing measures or processes to advise patients of their responsibilities and allow hospitals the opportunity to reach success-ful outcomes in having patients attend their appointments as scheduled.
The hospitals are supportive and will assess the effectiveness of their processes to mitigate no-shows on a regular basis, by tracking reasons for no-shows and patient demographics. These reviews will allow hospitals to strategize best practices that would include new technologies and processes to improve outcomes. Hospitals will work with their Information Technology departments as well as Communications and Privacy Offices on technologies that can improve access to patients through various user-friendly technological means such as emails, texting, automated mail-outs or interactive voice response systems.
The hospitals agree that patient no-shows have negative implications on operations, access and patient management, with a potential for lost revenues and increasing wait times. These challenges require hospitals to continue to find better opportunities to reduce no-show rates. Regular reviews do provide such opportunities, as well as working with their Local Health Inte-gration Networks in seeking best practices from other hospital sites.
4.9.3 Some Hospitals Have a Large Number of Patients Waiting To Receive MRI Appointments
In 2017/18, while schedulers at hospitals were able to schedule urgent and semi-urgent requests within two days, they took an average of 18 calendar days to schedule non-urgent requests and notify the patients of their appointment date and time. The average of 18 calendar days is over twice as long as the seven calendar days recommended by Cancer Care Ontario.
Of the four hospitals where we conducted audit work, three had a significant number of patients
396
Chap
ter 3
• VF
M S
ectio
n 3.
08
The Ministry still does not have a complete list of the hospitals with regular peer review programs among those that provide scanning services. In 2014, when the Ontario Hospital Association sur-veyed Ontario’s 155 hospitals, only 85 responded to the question asking if they had a peer review program; 41 of them had these programs in their diagnostic imaging departments.
Three of the four hospitals where we conducted audit work have peer review programs in place for reviewing both MRI and CT scans and the associ-ated radiologist reports. The fourth had conducted several trial peer reviews but was not doing them on a regular basis.
In conducting a peer review, a colleague reviewer re-examines a sample of a practising radiologist’s scans and compares the results with the radiologist’s reports on those scans. This has the benefit of evaluating the end product of the radiologist’s work—an assessment of performance in practice that is hard to accomplish in many other medical specialties. Peer reviews therefore give radiologists and hospitals the opportunity to improve quality assurance and maintain the value of radiologists’ expertise.
RECOMMENDATION 11
To help improve quality of diagnostic results across Ontario hospitals, we recommend that the Ministry of Health and Long-Term Care work with Health Quality Ontario to clarify their expectation and timeline for hospitals to imple-ment a formal and regular peer review program of diagnostic results in hospitals.
MINISTRY RESPONSE
The Ministry of Health and Long-Term Care (Ministry) supports this recommendation and will continue to work with Health Quality Ontario (HQO) to implement a formal and regu-lar peer review program of diagnostic results in hospitals.
4.10 Province-wide Peer Review Program Not Mandatory across Ontario Hospitals
The Canadian Association of Radiologists (Can-adian Radiologists) describes peer review as a process of self-regulation by a profession or of evaluation involving qualified individuals within the field. Peer review is used to maintain standards, improve performance and provide credibility. The Canadian Radiologists recommend that a radiology department’s overall quality assurance program should incorporate peer review to enhance the consistency and accuracy of radiology services and thus improve the quality of care for patients.
Nevertheless, not every Ontario hospital that provides MRI and/or CT scanning services has a regular peer review program. In 2013, an external review of a radiologist’s work at Trillium Health Partners found errors in his interpretation of 645 CT scans over the course of one year, some of which involved undiagnosed cancers. In December 2013, the Minister of Health and Long-Term Care requested that Health Quality Ontario (HQO) and its health partners “lead the implementation of a province-wide physician peer review program in all facilities where diagnostic imaging services are provided, including mammograms and CT scans.”
The 2016 report “Peer Review: A Diagnostic Imaging Quality Initiative for Ontario” outlined an implementation plan for a province-wide peer review program. The report’s recommendations for a mandatory peer review program included that it should be integrated, standards-based, consist-ent, focused on learning and education, account-able and sustainable. As of June 2018, HQO had developed a toolkit to support implementation of peer review programs in five community hospitals for their staff radiologists, and planned to expand this pilot program to 14 hospitals by the end of 2018/19. HQO indicated to us there has been no expectation set by the Ministry that the program will be mandatory for hospitals, and that it does not have the authority to “require” all hospitals to participate in this program.
397MRI and CT Scanning Services
Chap
ter 3
• VF
M S
ectio
n 3.
08
To achieve this, and to inform appropriate expectations and implementation timelines, the Ministry and HQO will continue to seek advice from hospitals and clinical expert groups.
4.11 Hospitals Did Not Consistently Assess Whether All Referrals for MRI and CT Scans Were Clinically Necessary
Research organizations and stakeholder groups we interviewed during our audit, including the Ontario Association of Radiologists, estimated that inappropriate scan referrals in Ontario—meaning, those that are not clinically necessary—range from 2% to 12%.
The Canadian Association of Radiologists recognizes that the appropriateness of performing an MRI or CT scan relies on having evidence based on clinical indications to support the request for the scan. A scan that is unlikely to improve patient outcomes is considered inappropriate. Inappropri-ate use of scans puts unnecessary financial strain on the system and increases wait times for patients who really need the scans. There are also risks for patients who are given scans they may not have needed. Radiologists sometimes make incidental findings (unexpected findings that the referring physician did not refer for). Many of these are benign, but they may still lead to a series of fur-ther scans and investigations, and anxiety for the patient. In some cases, investigating these findings may require invasive medical procedures.
Academic research on medical imaging has found that ordering inappropriate scans is a prob-lem for the medical system. A recent Canadian review of studies on this issue with MRI scans found results for inappropriate scans ranging from 2% to as high as 28.5%, depending on the body part, age and location of the patient, and design of the study. A Canadian study released in 2018 examined approximately 1,000 MRI scans for various body parts along with the indications for imaging given on the physicians’ requisition forms. The study
assessed each scan according to the Canadian Association of Radiologists’ referral guidelines, and found 6% to 12% to be inappropriate.
Radiologists in the Champlain LHIN estimated the percentage there at 5% to 15%. At the four hospitals where we conducted audit work, the chief radiologist or other radiologists are responsible for deciding the level of priority for each incoming referral, rejecting those they deem inappropriate or obtaining further clarifications from the referring physicians on the need for a scan. However, none of the hospitals kept track of the number of referrals they rejected as inappropriate.
The radiologists we interviewed agreed that the likelihood of an inappropriate referral depends on the body part and age of the patient, particularly in the absence of other clinical indicators, or “red flags.” For example, a physician should not routinely refer patients with only lower back pain for imaging, unless there are reasons to suspect serious underlying clinical issues. Chronic knee pain in patients over the age of 55 is another such example where MRI or CT scans may not be clinically necessary.
To support that consensus, the Waterloo Wel-lington LHIN completed a case study in 2017 that found that of 650 patients older than 55 with knee pain, 221 had completed a pre-consult MRI scan. A review of these cases found that 77% of the 221 scans were considered inappropriate. Building on this work, an electronic referral system incorporat-ing a decision support tool reduced the number of inappropriate MRIs by 12%.
To limit the number of inappropriate scans being requested, the Canadian Association of Radiologists issued its Diagnostic Imaging Referral Guidelines in 2012 as a resource for physicians. It intends these guidelines to assist physicians in making decisions, but not to restrict their role in deciding on the imaging studies they request.
Hospitals that have scanning services have also been studying whether to provide similar clinical decision support to requesting physicians. The Champlain LHIN centralized intake system (as

398
Chap
ter 3
• VF
M S
ectio
n 3.
08
mentioned in Section 4.3) will include decision support tools and clinical pathways to help guide referring physicians in their ordering practices to improve appropriateness of the requests. A clinical support tool is used for this purpose by hospitals in the United States.
RECOMMENDATION 12
To better ensure that referrals for MRI and CT scans are clinically necessary, we recommend that the Ministry of Health and Long-Term Care work with Local Health Integration Networks and hospitals to:
• develop effective tools such as standardized requisition forms with applicable checklists to minimize the number of inappropriate requests for scans; and
• ensure that radiologists at hospitals assess and track MRI and CT requests, and imple-ment practices that improve adherence to the appropriateness guidelines.
MINISTRY RESPONSE
The Ministry of Health and Long-Term Care supports this recommendation and will work with Local Health Integration Networks, hospitals and clinical experts to develop and implement tools and best practices to minimize the number of inappropriate referrals for scans. The Independent Health Facilities Program will consult with key partners and licensees to consider how it might be possible to implement these recommendations.
4.12 Standardized Hourly Rates and Performance Measures Are Lacking in Ministry Agreements with Independent Health Facilities
Our audit found that, for both MRI and CT scans, standardized hourly rates and wait-time perform-ance measures are lacking in Ministry agreements
with independent health facilities (IHFs), as detailed in Sections 4.12.1 and 4.12.2.
Also, the Ministry has not compared the prac-tices in providing similar scanning services by both the IHF and hospital sectors to identify areas, such as hourly rates and peer review, for further improvement. For example, all IHFs licensed under the Independent Health Facilities Act (Act) are required to perform regular peer review, whereas a province-wide formal peer review program still has not been fully implemented in hospitals, as discussed in Section 4.10.
IHFs are either for-profit or not-for-profit organizations located in communities throughout Ontario that provide certain health-care services, including MRI and CT services, at no charge to patients insured under the Ontario Health Insur-ance Plan. Their purpose is to provide Ontarians with increased access to health-care services out-side of hospitals. The Ministry is responsible under the Act for licensing, funding and co-ordinating quality assurance assessments of these IHFs.
In order to receive funding under the Act, these licensees sign an agreement with the Ministry to establish the annual budget. The IHFs must submit monthly service reports to the Ministry that detail the number of hours of services delivered. The year-end reconciliation process is based on the actual service hours rendered, the types of services pro-vided and the daily operating hours; the Ministry may recover any overpayments.
Over the three fiscal years ending 2017/18, the Ministry funded seven IHFs a total annual average of $8.6 million for MRI services and $2.6 million for CT services. In 2017/18, the IHFs with a total of six MRI and two CT machines performed about 48,000 MRI and 11,320 CT scans, excluding the number of scans performed by another two CT machines where information had not been reported to Cancer Care Ontario at the time of our audit.

399MRI and CT Scanning Services
Chap
ter 3
• VF
M S
ectio
n 3.
08
formed outside of hospital so cannot know whether the rates it currently pays the IHFs are reasonable.
• Only two of the four IHFs are currently con-tracted to provide wait-time information to Cancer Care Ontario, although they are not contracted to achieve the wait-time targets. In 2018/19, the Ministry began funding the two other IHFs to establish the capability and start reporting their wait times as well.
RECOMMENDATION 13
To help ensure that payments to independent health facilities (IHFs) for MRI and CT services are cost-effective, we recommend that the Min-istry of Health and Long-Term Care:
• review the existing hourly rate paid for scanning services delivered by each IHF and determine whether the rates are appropri-ate based on the types of scans, cost per scan and the service volume each IHF performs; and
• establish performance measures, such as wait-time targets, and incorporate these measures into future contracts with all IHFs.
MINISTRY RESPONSE
The Ministry of Health and Long-Term Care will undertake a review of the hourly rate paid for MRI and CT services and will undertake a review of MRI and CT independent health facilities’ transfer payment funding agreements to consider:
• how to implement a consistent, clear and evidence-based approach to setting facility-fee rates for MRI and CT service delivery;
• a potential adjustment to existing MRI and CT facility-fee rates to align with this approach; and
• an analysis and integration of applicable performance measures, including wait-time targets, associated with the provision of services.
4.12.1 MRI Scans
Three licensees with five IHFs operate a total of six MRI machines. A list of these IHFs with their corresponding wait-time information is shown in Appendix 10. We found the following issues:
• The Ministry’s agreed hourly rates with these IHFs varied significantly: the rate paid for an MRI scan at one IHF can be as high as 175% the rate paid for a similar scan at another IHF. These rates were established in 2003 as a result of successful bids submitted to the Ministry in response to request for proposals for the provision of licenced MRI services, as set out under the Act. The Ministry still pays the same rates in 2018. The Ministry does not know the actual cost per scan per-formed outside of hospital so it cannot know whether the rates it currently pays the IHFs are reasonable.
• All five IHFs are currently contracted to provide wait-time information to Cancer Care Ontario. However, their contracts with the Ministry do not require them to achieve any of the provincial wait-time targets that are expected from Ontario hospitals. In 2017/18, none of these IHFs met the provincial wait-time target of 28 days.
4.12.2 CT Scans
Three licensees with four IHFs operate four CT machines in various locations across the province (see Appendix 10). We found similar issues as dis-cussed previously in Section 4.12.1 as follows:
• The Ministry’s agreed hourly rates with these IHFs varied: the rate paid for a CT scan at one IHF can be as high as 280% the rate paid for similar scan at another IHF. These rates were established in 2003 as a result of a request for proposals process mentioned in Section 4.12.1. The Ministry still pays the same rates in 2018. Again, the Ministry does not know the actual cost per scan per-
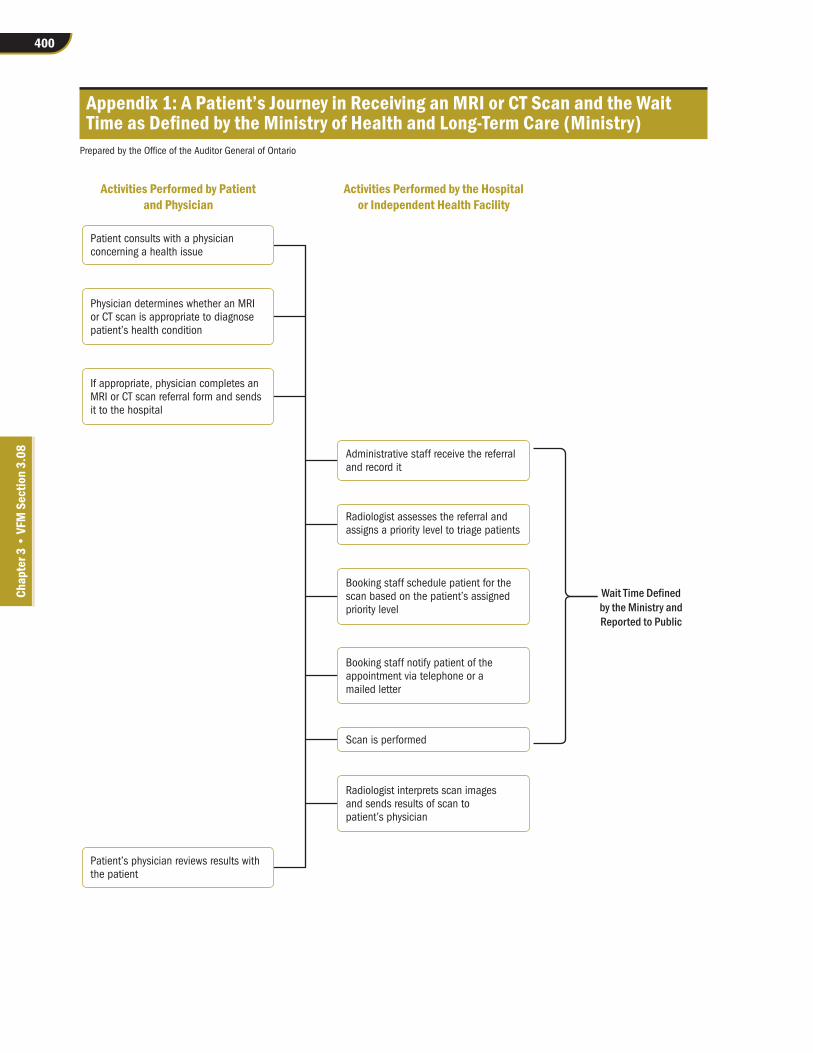
400
Chap
ter 3
• VF
M S
ectio
n 3.
08
Appendix 1: A Patient’s Journey in Receiving an MRI or CT Scan and the Wait Time as Defined by the Ministry of Health and Long-Term Care (Ministry)
Prepared by the Office of the Auditor General of Ontario
Activities Performed by Patientand Physician
Patient consults with a physician concerning a health issue
Administrative staff receive the referral and record it
Radiologist assesses the referral and assigns a priority level to triage patients
Booking staff schedule patient for the scan based on the patient’s assigned priority level
Booking staff notify patient of the appointment via telephone or a mailed letter
Scan is performed
Radiologist interprets scan images and sends results of scan to patient’s physician
Physician determines whether an MRI or CT scan is appropriate to diagnose patient’s health condition
If appropriate, physician completes an MRI or CT scan referral form and sends it to the hospital
Patient’s physician reviews results withthe patient
Activities Performed by the Hospitalor Independent Health Facility
Wait Time Definedby the Ministry andReported to Public

401MRI and CT Scanning Services
Chap
ter 3
• VF
M S
ectio
n 3.
08
Appendix 2: Key Facts Regarding MRI and CT MachinesSource of data: Ministry of Health and Long-Term Care
MRI Machine CT MachineHow it works • Uses a magnetic field and pulses of radio waves
to produce images of areas inside the body• Combines a series of x-ray images taken from
different angles and uses a computer to create cross-sectional images (slices) of a patient’s body
Best use • Soft tissues (e.g., ligaments, tendons, organs, tumours)
• Bones and areas with lots of movement (e.g., chest and abdomen)
• Often used to monitor cancer patients
Scanning time • 20 minutes to 60+ minutes • A few minutes
Patient safety • Does not use any radiation• Due to strong magnetization, MRIs are not safe
for patients with metal in their body, such as pacemakers, metal plates or screws
• Extra precautions are taken with patients who have medical implants
• Patient or delegate must respond to all questions regarding safety protocols before obtaining a scan
• Patients are exposed to radiation emitted from each scan completed
• Patients with metal in their body can get CT scans
Patient comfort • Painless; possible discomfort if patient is sensitive to small enclosed spaces
• Depending on length of scan, patient may have to stay still for a long time, which can be difficult
• Very loud; patients are given earplugs to block the noise as much as possible
• Painless; possible discomfort if patient is sensitive to small enclosed spaces

402
Chap
ter 3
• VF
M S
ectio
n 3.
08
Appendix 3: Number of MRI Machines1 and Wait Times, by Ontario Hospital, March 2018
Source of data: Cancer Care Ontario
Non-urgent Patients’Wait Times, at
90th Percentile,2 Hospital Hospital Type # of MRIs 2017/18 (# of Days)Central LHINHumber River Hospital Community 2 142
Mackenzie Health3 Community 2 134
North York General Hospital Teaching 2 134
Markham Stouffville Hospital Corporation Community 2 76
Southlake Regional Health Centre Community 2 62
Central East LHINThe Scarborough and Rouge Hospital Community 3 88
Lakeridge Health Corporation4 Community 3 66
Peterborough Regional Health Centre Community 1 53
Ross Memorial Hospital Community 1 50
Northumberland Hills Hospital Community 1 25
Central West LHINWilliam Osler Health System5 Community 4 Not Reported
Champlain LHINOttawa Hospital3 Teaching 4 249
Cornwall Community Hospital Community 1 122
Hôpital Montfort/Montfort Hospital Teaching 2 116
University of Ottawa Heart Institute Teaching 1 88
Queensway Carleton Hospital Community 2 81
Children’s Hospital of Eastern Ontario-OCTC Teaching 2 63
Pembroke Regional Hospital Community 1 42
Erie St. Clair LHINWindsor Regional Hospital Community 2 119
St. Joseph’s Health Services Association of Chatham Community 1 61
Bluewater Health Community 1 28
Hamilton Niagara Haldimand Brant LHINNiagara Health System4 Community 2 117
Brant Community Healthcare System Community 1 91
Hamilton Health Sciences Corp Teaching 5 90
Joseph Brant Hospital Community 1 82
St. Joseph’s Healthcare Hamilton3,5 Teaching 4 Not Reported
Mississauga Halton LHINTrillium Health Partners Community 4 127
Halton Healthcare Services Community 4 66

403MRI and CT Scanning Services
Chap
ter 3
• VF
M S
ectio
n 3.
08
Non-urgent Patients’Wait Times, at
90th Percentile,2 Hospital Hospital Type # of MRIs 2017/18 (# of Days)North East LHINHealth Sciences North3 Teaching 1 119
North Bay Regional Health Centre Community 1 71
Timmins and District Hospital Community 1 66
Sault Area Hospital Community 1 57
North Simcoe Muskoka LHINRoyal Victoria Regional Health Centre Community 2 64
Orillia Soldiers’ Memorial Hospital Community 1 56
North West LHINThunder Bay Regional Health Sciences Centre Teaching 3 103
South East LHINKingston Health Sciences Centre Teaching 1 136
Quinte Healthcare Corporation Community 1 39
South West LHINLondon Health Sciences Centre Teaching 4 158
Grey Bruce Health Services Community 1 59
St. Joseph’s Health Care London Teaching 3 55
Woodstock General Hospital Community 1 44
Stratford General Hospital Community 1 40
Toronto Central LHINSunnybrook Health Sciences Centre4 Teaching 3 284
Hospital for Sick Children4 Teaching 4 174
Sinai Health System Teaching 2 139
University Health Network4 Teaching 7 128
St. Michael’s Hospital–St. Joseph’s Health Centre Toronto Teaching 4 119
Women’s College Hospital Teaching 1 75
Toronto East Health Network Community 1 70
Waterloo Wellington LHINCambridge Memorial Hospital Community 1 80
Grand River Hospital Corp Community 1 66
Guelph General Hospital Community 1 65
Total # of MRIs 108
1. Excludes those machines used solely for research purposes.
2. Wait times are measured as the maximum amount of time in which 90% of patients have received their MRI scans.
3. Hospitals that we visited where we conducted detailed audit work.
4. Hospitals that we visited and met with their senior representatives.
5. Data from these hospitals had significant inaccuracies due to system implementation; hence, the information has not been published by the Ministry of Health and Long-Term Care nor included in this appendix.

404
Chap
ter 3
• VF
M S
ectio
n 3.
08
Appendix 4: Number of CT Machines1 and Wait Times, by Ontario Hospital, March 2018
Source of data: Cancer Care Ontario
Non-urgent Patients’Wait Times, at
90th Percentile,2 Hospital Hospital Type # of CTs 2017/18 (# of Days)Central LHINMackenzie Health3 Community 2 152
Humber River Hospital Community 4 55
Southlake Regional Health Centre Community 2 53
North York General Hospital Teaching 3 50
Markham Stouffville Hospital Community 3 34
Stevenson Memorial Hospital Alliston Community 1 30
Central East LHINPeterborough Regional Health Centre Community 2 35
Ross Memorial Hospital Community 1 27
Lakeridge Health Corporation4 Community 4 26
The Scarborough and Rouge Hospital Community 5 25
Northumberland Hills Hospital Community 1 22
Campbellford Memorial Hospital Community 1 13
Central West LHINHeadwaters Health Care Centre Community 1 34
William Osler Health System5 Community 6 Not Reported
Champlain LHINOttawa Hospital3 Teaching 6 234
Hôpital Montfort/Montfort Hospital Teaching 2 117
Queensway Carleton Hospital Community 2 106
Winchester District Memorial Hospital Community 1 103
Children’s Hospital of Eastern Ontario–OCTC Teaching 1 95
Pembroke Regional Hospital Community 1 43
University of Ottawa Heart Institute Teaching 1 32
Renfrew Victoria Hospital Community 1 32
Hawkesbury and District General Hospital Community 1 16
Cornwall Community Hospital Community 1 16
Erie St. Clair LHINBluewater Health Community 2 41
St. Joseph’s Health Services Association of Chatham Community 1 40
Windsor Regional Hospital Community 3 31
Erie Shores Healthcare Community 1 14

405MRI and CT Scanning Services
Chap
ter 3
• VF
M S
ectio
n 3.
08
Non-urgent Patients’Wait Times, at
90th Percentile,2 Hospital Hospital Type # of CTs 2017/18 (# of Days)Hamilton Niagara Haldimand Brant LHINHamilton Health Sciences Corp Teaching 6 76
Brant Community Healthcare System Community 1 48
Norfolk General Hospital Community 1 29
Joseph Brant Hospital Community 2 26
Haldimand War Memorial Hospital Community 1 22
Niagara Health System4 Community 4 21
St Joseph’s Healthcare Hamilton3,5 Teaching 2 Not Reported
Mississauga Halton LHINTrillium Health Partners Community 5 93
Halton Healthcare Services Community 4 27
North East LHINHealth Sciences North3 Teaching 2 199
Timmins and District Hospital Community 1 70
Sault Area Hospital Community 2 68
North Bay Regional Health Centre Community 2 56
Temiskaming Hospital Community 1 30
West Parry Sound Health Centre Community 1 20
North Simcoe Muskoka LHINMuskoka Algonquin Healthcare Community 1 45
Royal Victoria Regional Health Centre Community 2 42
Georgian Bay General Hospital Community 1 27
Collingwood General and Marine Hospital Community 1 21
Orillia Soldiers’ Memorial Hospital Community 1 19
North West LHINThunder Bay Regional Health Sciences Centre Teaching 2 32
Sioux Lookout Meno-Ya-Win Health Centre Community 1 22
Lake of the Woods District Hospital Community 1 18
Riverside Health Care Facilities Inc. Community 1 16
South East LHINKingston Health Sciences Centre Teaching 3 52
Quinte Healthcare Corporation Community 2 28
Brockville General Hospital Community 1 28
Perth and Smiths Falls District Hospital Community 1 19
South West LHINLondon Health Sciences Centre Teaching 4 70
St. Joseph’s Health Care London Teaching 2 35
St. Thomas Elgin General Hospital Community 1 29
Stratford General Hospital Community 1 27
Grey Bruce Health Services Community 1 27

406
Chap
ter 3
• VF
M S
ectio
n 3.
08
Non-urgent Patients’Wait Times, at
90th Percentile,2 Hospital Hospital Type # of CTs 2017/18 (# of Days)Woodstock General Hospital Community 1 25
Tillsonburg District Memorial Hospital Community 1 25
South Bruce Grey Health Centre Community 1 21
Strathroy Middlesex General Hospital Community 1 12
Alexandra Marine and General Hospital Community 1 12
Toronto Central LHINSunnybrook Health Sciences Centre4 Teaching 4 173
St. Michael’s Hospital–St. Joseph’s Health Centre Toronto Teaching 5 92
Toronto East Health Network Community 2 92
Women’s College Hospital Teaching 1 84
Sinai Health System Teaching 4 83
University Health Network4 Teaching 14 64
Hospital for Sick Children4 Teaching 2 56
Waterloo Wellington LHINSt. Mary’s General Hospital Community 1 58
Grand River Hospital Corp Community 2 37
Guelph General Hospital Community 1 35
Cambridge Memorial Hospital Community 1 28
Groves Memorial Community Hospital Community 1 27
Total # of CTs 165
1. Excludes those machines used solely for research purposes.
2. Wait times are measured as the maximum amount of time in which 90% of patients have received their CT scans.
3. Hospitals that we visited where we conducted detailed audit work.
4. Hospitals that we visited and met with their senior representatives.
5. Data from these hospitals had significant inaccuracies due to system implementation; hence, the information has not been published by the Ministry of Health and Long-Term Care nor included in this appendix.
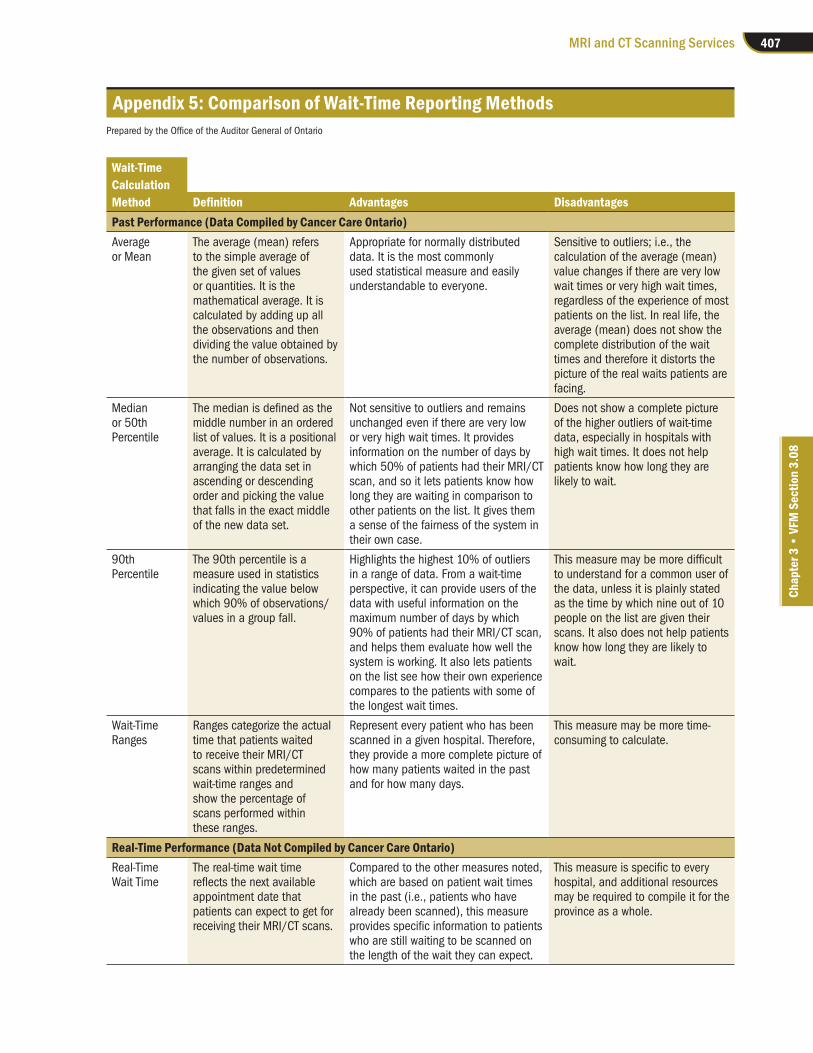
407MRI and CT Scanning Services
Chap
ter 3
• VF
M S
ectio
n 3.
08
Appendix 5: Comparison of Wait-Time Reporting MethodsPrepared by the Office of the Auditor General of Ontario
Wait-TimeCalculationMethod Definition Advantages DisadvantagesPast Performance (Data Compiled by Cancer Care Ontario)Average or Mean
The average (mean) refers to the simple average of the given set of values or quantities. It is the mathematical average. It is calculated by adding up all the observations and then dividing the value obtained by the number of observations.
Appropriate for normally distributed data. It is the most commonly used statistical measure and easily understandable to everyone.
Sensitive to outliers; i.e., the calculation of the average (mean) value changes if there are very low wait times or very high wait times, regardless of the experience of most patients on the list. In real life, the average (mean) does not show the complete distribution of the wait times and therefore it distorts the picture of the real waits patients are facing.
Median or 50th Percentile
The median is defined as the middle number in an ordered list of values. It is a positional average. It is calculated by arranging the data set in ascending or descending order and picking the value that falls in the exact middle of the new data set.
Not sensitive to outliers and remains unchanged even if there are very low or very high wait times. It provides information on the number of days by which 50% of patients had their MRI/CT scan, and so it lets patients know how long they are waiting in comparison to other patients on the list. It gives them a sense of the fairness of the system in their own case.
Does not show a complete picture of the higher outliers of wait-time data, especially in hospitals with high wait times. It does not help patients know how long they are likely to wait.
90th Percentile
The 90th percentile is a measure used in statistics indicating the value below which 90% of observations/values in a group fall.
Highlights the highest 10% of outliers in a range of data. From a wait-time perspective, it can provide users of the data with useful information on the maximum number of days by which 90% of patients had their MRI/CT scan, and helps them evaluate how well the system is working. It also lets patients on the list see how their own experience compares to the patients with some of the longest wait times.
This measure may be more difficult to understand for a common user of the data, unless it is plainly stated as the time by which nine out of 10 people on the list are given their scans. It also does not help patients know how long they are likely to wait.
Wait-Time Ranges
Ranges categorize the actual time that patients waited to receive their MRI/CT scans within predetermined wait-time ranges and show the percentage of scans performed within these ranges.
Represent every patient who has been scanned in a given hospital. Therefore, they provide a more complete picture of how many patients waited in the past and for how many days.
This measure may be more time-consuming to calculate.
Real-Time Performance (Data Not Compiled by Cancer Care Ontario)Real-Time Wait Time
The real-time wait time reflects the next available appointment date that patients can expect to get for receiving their MRI/CT scans.
Compared to the other measures noted, which are based on patient wait times in the past (i.e., patients who have already been scanned), this measure provides specific information to patients who are still waiting to be scanned on the length of the wait they can expect.
This measure is specific to every hospital, and additional resources may be required to compile it for the province as a whole.

408
Chap
ter 3
• VF
M S
ectio
n 3.
08
Appendix 6: Audit CriteriaPrepared by the Office of the Auditor General of Ontario
1. Effective governance and planning processes are in place to ensure the capacity, allocation and utilization of MRI and CT equipment meet patients’ clinical needs across the province.
2. Effective procedures and co-ordination among service providers are in place to ensure patients have timely and equitable access to MRI and/or CT scans when needed.
3. Evidence-based policies, procedures and clinical guidelines are in place and followed to ensure that the referral and delivery of MRI and CT scanning services are appropriate.
4. MRI and CT equipment are acquired, used and maintained in a cost-effective, safe and appropriate manner.
5. Effective processes are in place to accurately report, track and access patient test results on a timely basis.
6. Performance measures and targets are established, monitored, compared against actual results and publicly reported to ensure that the intended outcomes are achieved and that corrective actions are taken on a timely basis when issues are identified.
7. Financial and operational data are collected to provide accurate, complete and timely information to help guide management decision-making, compare against best practices in other jurisdictions, and assist with performance management.

409MRI and CT Scanning Services
Chap
ter 3
• VF
M S
ectio
n 3.
08
Appendix 7: Canadian MRI and CT Machine Inventories and Number of Scans Performed, January–December 2017
Source: Canadian Agency for Drugs and Technologies in Health
Population # of Scans perProvince/Territory (as of July 1, 2017) # of Machines # of Scans 1,000 PopulationMRI MachinesPrince Edward Island 149,790 1 4,279 28.6
British Columbia 4,789,221 46 173,678 36.3
Saskatchewan 1,161,365 10 44,461 38.3
Newfoundland and Labrador 528,683 5 20,990 39.7
Alberta 4,291,980 41 192,375 44.8
Quebec 8,371,498 107 380,357 45.4
Nova Scotia 953,173 12 47,490 49.8
Yukon 37,808 1 2,200 58.2
Manitoba 1,332,629 12 77,735 58.3
New Brunswick 757,641 11 44,592 58.9
Ontario 14,135,610 120 866,953 61.3Northwest Territories 44,381 0 n/a n/a
Nunavut 37,462 0 n/a n/a
Canada 36,591,241 366 1,855,110 51.0CT MachinesNunavut 37,462 1 2000 53.4
Yukon 37,808 1 3,500 92.6
Alberta 4,291,980 56 405,332 94.4
Prince Edward Island 149,790 2 15,811 105.6
Northwest Territories 44,381 1 4695 105.8
Saskatchewan 1,161,365 15 128,415 110.6
Manitoba 1,332,629 23 186,197 139.7
British Columbia 4,789,221 66 695,248 145.2
Quebec 8,371,498 163 1,350,792 161.4
Nova Scotia 953,173 18 155,099 162.7
Ontario 14,135,610 184 2,430,739 172.0Newfoundland and Labrador 528,683 16 90,985 172.1
New Brunswick 757,641 15 142,294 187.8
Canada 36,591,241 561 5,611,107 153.0

410
Chap
ter 3
• VF
M S
ectio
n 3.
08
Appendix 8: Comparison of Wait-Time Targets for Receiving MRI and CT Scan Services across Jurisdictions and as Recommended by Canadian Association of Radiologists
Source: Provincial health ministry websites and Canadian Association of Radiologists
Jurisdiction/Category Emergency Urgent Semi-urgent Non-urgent How Wait Time Is MeasuredOntario Within
24 hoursWithin 2 days Within
10 daysWithin 28 days
From receipt of the MRI/CT request to the date that the scan is performed
Alberta Not specified Within 7 days Within 30 days
MRI: Within 90 DaysCT: Within 60 Days
Between the time when a patient and specialist decide that a procedure or diagnostic test is required and the date the procedure or test is performed
PEI Within 48 hours
Within 14 days
Within 28 days
MRI: Within 84 DaysCT: Within 56 Days
From receipt of the MRI/CT request to the date that the scan is performed
Saskatchewan Within 24 hours
2–7 days 8–30 days 31–90 days The wait time is calculated from the date the procedure is requested to the date the procedure is performed
Canadian Association of Radiologists
Within 24 hours
Within 7 days Within 30 days
Within 60 days
From the date a completed referral for a medical examination is received until the date the examination is completed
Note: In Ontario and Saskatchewan, wait-time targets are measured as the maximum amount of time in which 90% of patients have received their scans. However, other provinces do not publicly report a similar wait-time measure.

411MRI and CT Scanning Services
Chap
ter 3
• VF
M S
ectio
n 3.
08
Appendix 9: Analysis of MRI and CT Patient Real-Time Wait Times at Three Hospitals, July 2018
Source of data: three of the four selected hospitals where information was available
Hospital A B CMRI Patients(a) Average wait time for non-urgent patients, in days—reported to the public 193 72 92
(b) # of patients on hospital wait list 8,230 2,305 3,944
(c) # of non-urgent patients on hospital wait list 7,508 [91% of (b)]
2,103[91% of (b)]
3,816[97% of (b)]
(d) # of non-urgent patients who have not received an appointment date 6,872[92% of (c)]
954[45% of (c)] 0
# of patients waiting for more than the average wait time reported to the public in (a)
2,106[31% of (d)]
310[32% of (d)] 0
# of patients waiting less than the average wait time reported to the public in (a)
4,766[69% of (d)]
644[68% of (d)] 0
(e) # of non-urgent patients who have received an appointment date 636 [8% of (c)]
1,149 [55% of (c)]
3,816 [100% of (c)]
# of patients waiting for more than the average wait time reported to the public in (a) for their scheduled scans
625[98% of (e)]
423[37% of (e)]
3,315[87% of (e)]
# of patients waiting less than the average wait time reported to the public in (a) for their scheduled scans
11[2% of (e)]
726[63% of (e)]
501[13% of (e)]
CT Patients(a) Average wait time for non-urgent patients, in days—reported to the public 156 116 59
(b) # of patients on hospital wait list 5,842 2,945 1,304
(c) # of non-urgent patients on hospital wait list 4,659 [80% of (b)]
2,434[83% of (b)]
1,123[86% of (b)]
(d) # of non-urgent patients who have not received an appointment date 4,499[97% of (c)]
390[16% of (c)] 0
# of patients waiting for more than the average wait time reported to the public in (a)
2,087[46% of (d)]
82[21% of (d)] 0
# of patients waiting less than the average wait time reported to the public in (a)
2,412[54% of (d)]
308[79% of (d)] 0
(e) # of non-urgent patients who have received an appointment date 160 [3% of (c)]
2,044 [84% of (c)]
1,123 [100% of (c)]
# of patients waiting for more than the average wait time reported to the public in (a) for their scheduled scans
129[81% of (e)]
1,604[78% of (e)]
968[86% of (e)]
# of patients waiting less than the average wait time reported to the public in (a) for their scheduled scans
31[19% of (e)]
440[22% of (e)]
155[14% of (e)]
Note: Once hospitals receive the requisition forms for MRI or CT scans from the patients’ referring physicians, the radiologists triage patients based on the information available in the requisitions. They classify patients by assigning priority levels and then assessing the patients for the type of scan they should be given. The hospitals schedule appointments based on these patient classifications. This appendix excludes patients who were waiting for follow-up scans.

412
Chap
ter 3
• VF
M S
ectio
n 3.
08
Appendix 10: Number of MRI and CT Scan Machines and Wait Times by Independent Health Facility, March 2018
Source of data: Cancer Care Ontario
Non-urgentWait Times 2017/18
(# of Days atIndependent Health Facilities (IHFs) # of Machines LHIN 90th Percentile)IHFs Operating MRI MachinesKMH MRI and Healthcare Centres – Thornhill 1 Central 104
Kingston MRI 2 South East 93
Oxford Advanced Imaging Inc. – Mississauga 1 Mississauga Halton 88
Oxford Advanced Imaging Inc. – Ajax 1 Central East 64
KMH MRI and Healthcare Centres – Kitchener 1 Waterloo Wellington 58
Total 6IHFs Operating CT MachinesOxford Advanced Imaging Inc. – Mississauga 1 Mississauga Halton 17
Oxford Advanced Imaging Inc. – Ajax 1 Central East 9
Superior Imaging 1 North West Not reported*
Huntsville CT Clinic 1 North Simcoe Muskoka Not reported*
Total 4
* Wait-time data will be reported after an information system is implemented; the setup of the system was in progress at the time of our audit.