6-5 the central limit theorem
DESCRIPTION
6-5 The Central Limit Theorem. The Central Limit Theorem tells us that for a population with any distribution, the distribution of the sample means approaches a normal distribution as the sample size increases. - PowerPoint PPT PresentationTRANSCRIPT
6-5 The Central Limit Theorem
The Central Limit Theorem tells us that for a population with any distribution, the distribution of the sample means approaches a normal distribution as the sample size increases.
The procedure in this section forms the foundation for estimating population parameters and hypothesis testing.
1. The distribution of sample will, as the sample size increases, approach a normal distribution.
2. The mean of the sample means is the population mean .
3. The standard deviation of all sample meansis .
Central Limit Theorem
x
/ n
Practical Rules Commonly Used
1. For samples of size n larger than 30, the distribution of the sample means can be approximated reasonably well by a normal distribution. The approximation becomes closer to a normal distribution as the sample size n becomes larger.
2. If the original population is normally distributed, then for any sample size n, the sample means will be normally distributed (not just the values of n larger than 30).

The mean of the sample means
The standard deviation of sample mean
(often called the standard error of the mean)
Notation
x
xn

Example - Normal Distribution
As we proceed from n = 1 to n = 50, we see that the distribution of sample means is approaching the shape of a normal distribution.

Example - Uniform Distribution
As we proceed from n = 1 to n = 50, we see that the distribution of sample means is approaching the shape of a normal distribution.
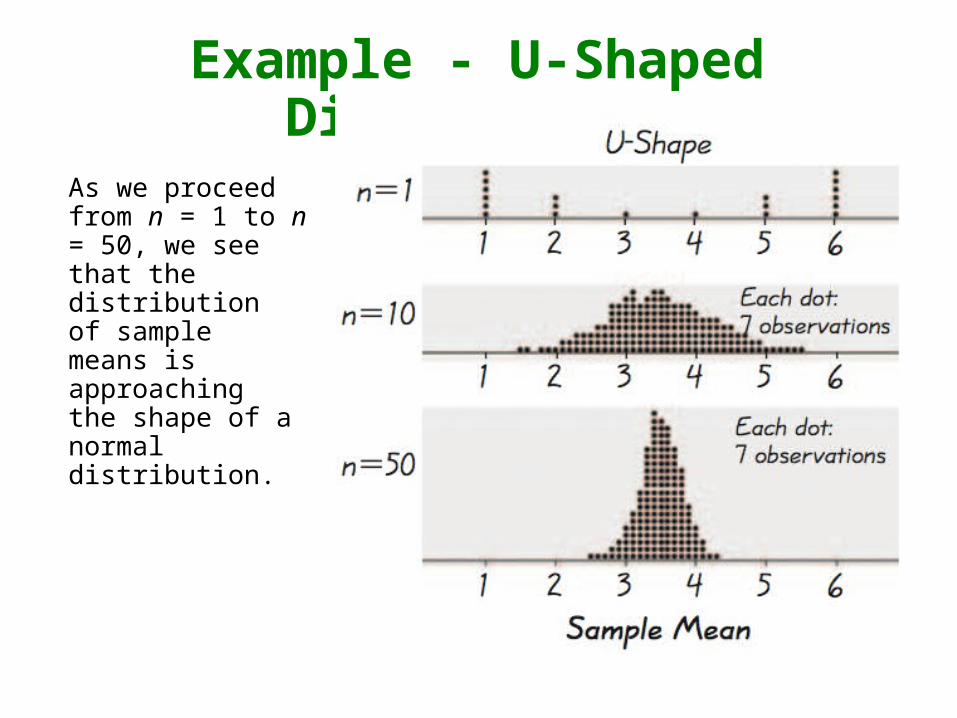
Example - U-Shaped Distribution
As we proceed from n = 1 to n = 50, we see that the distribution of sample means is approaching the shape of a normal distribution.
As the sample size increases, the sampling distribution of sample means approaches a normal distribution.
Important Point
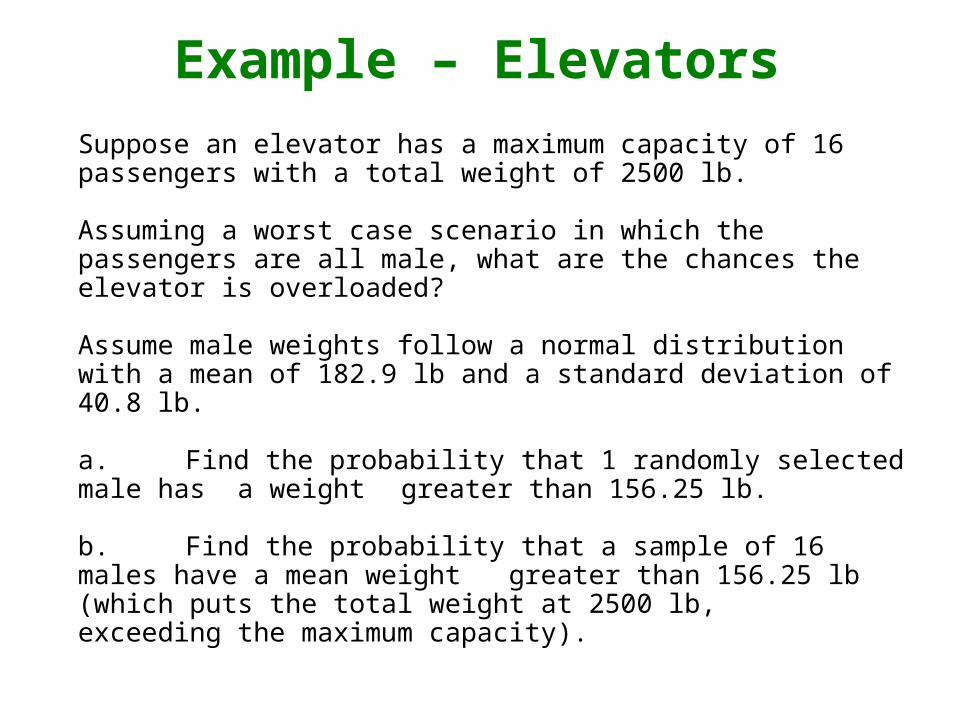
Suppose an elevator has a maximum capacity of 16 passengers with a total weight of 2500 lb.
Assuming a worst case scenario in which the passengers are all male, what are the chances the elevator is overloaded?
Assume male weights follow a normal distribution with a mean of 182.9 lb and a standard deviation of 40.8 lb.
a. Find the probability that 1 randomly selected male has a weight greater than 156.25 lb.
b. Find the probability that a sample of 16 males have a mean weight greater than 156.25 lb (which puts the total weight at 2500 lb,
exceeding the maximum capacity).
Example – Elevators

a. Find the probability that 1 randomly selected male has a weight greater than 156.25 lb.
Use the methods presented in Section 6.3. We can convert to a z score and use Table A-2.
Using Table A-2, the area to the right is 0.7422.
Example – Elevators
156.25 182.90.65
40.8
xz

b. Find the probability that a sample of 16 males have a mean weight greater than 156.25 lb.
Since the distribution of male weights is assumed to be normal, the sample mean will also be normal.
Converting to z:
Example – Elevators
182.9
40.810.2
16
x x
xx
n
156.25 182.92.61
10.2z

b. Find the probability that a sample of 16 males have a mean weight greater than 156.25 lb.
While there is 0.7432 probability that any given male will weigh more than 156.25 lb, there is a 0.9955 probability that the sample of 16 males will have a mean weight of 156.25 lb or greater.
If the elevator is filled to capacity with all males, there is a very good chance the safe weight capacity of 2500 lb. will be exceeded.
Example – Elevators