9.1 self reported status of bbbee progress - … · 9.1 self reported status of bbbee progress ......
TRANSCRIPT
.
.
.
.
.
.
.
.
.
Page 12
9 THE BBBEE STATUS IN SOUTH AFRICA
9.1 SELF REPORTED STATUS OF BBBEE PROGRESS
At the onset of the interview respondents were asked what their current status with regard to BBBEE was.
The following question was posed to respondents:
A.1 Which one of the following best describe your company's current status with regard to Broad
Based Black Economic Empowerment - BBBEE (Please select the most appropriate description of your
status)
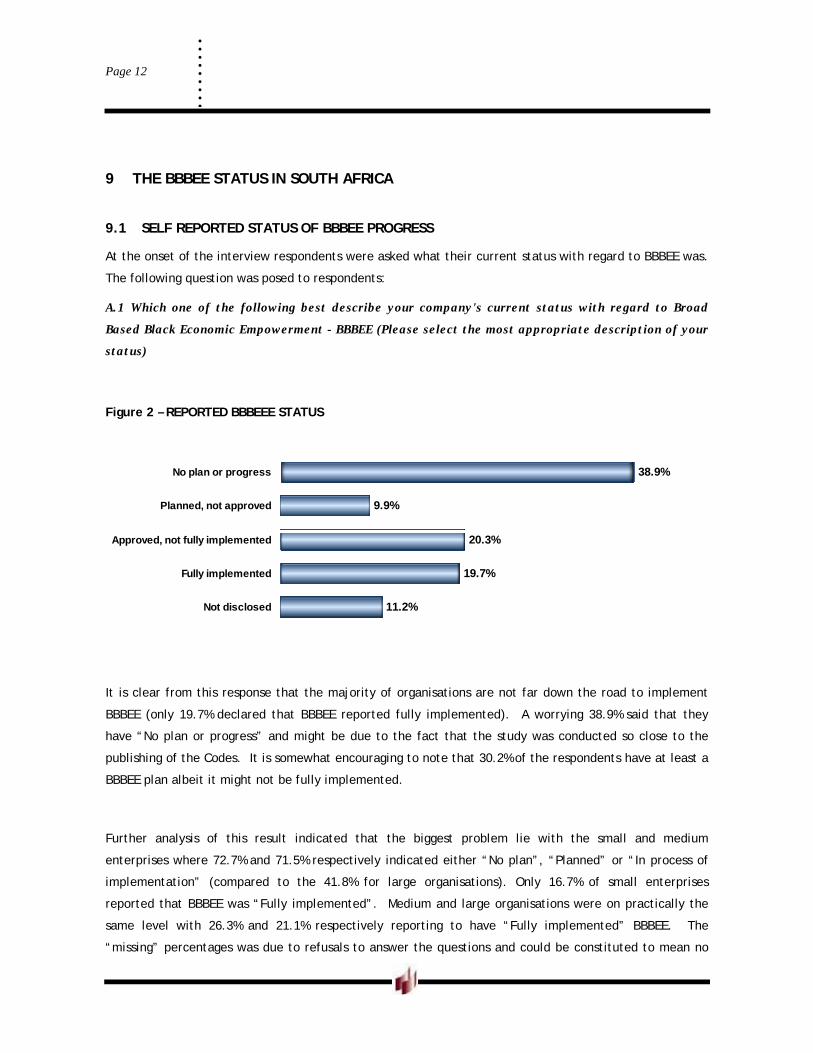
Figure 2 – REPORTED BBBEEE STATUS
38.9%
9.9%
20.3%
19.7%
11.2%
No plan or progress
Planned, not approved
Approved, not fully implemented
Fully implemented
Not disclosed
It is clear from this response that the majority of organisations are not far down the road to implement
BBBEE (only 19.7% declared that BBBEE reported fully implemented). A worrying 38.9% said that they
have “No plan or progress” and might be due to the fact that the study was conducted so close to the
publishing of the Codes. It is somewhat encouraging to note that 30.2% of the respondents have at least a
BBBEE plan albeit it might not be fully implemented.
Further analysis of this result indicated that the biggest problem lie with the small and medium
enterprises where 72.7% and 71.5% respectively indicated either “No plan”, “Planned” or “In process of
implementation” (compared to the 41.8% for large organisations). Only 16.7% of small enterprises
reported that BBBEE was “Fully implemented”. Medium and large organisations were on practically the
same level with 26.3% and 21.1% respectively reporting to have “Fully implemented” BBBEE. The
“missing” percentages was due to refusals to answer the questions and could be constituted to mean no

.
.
.
.
.
.
.
.
.
Page 13
progress and if so, would bring large organisations somewhat in line with their smaller counterparts as
37.1% of large organisations refused to disclose this information.
9.2 EXISTENCE OF A FORMAL BBBEE SCORECARD, THE SOURCE THEREOF AND THE LEVEL OF
COMPLIANCE
Of those respondents that confirmed that their BBBEE plan is fully implemented, 63.5% said that they “Do
not have a formal BBBEE scorecard”. The 24.7% (11.8% refused to answer the question) that did confirm
that they have a “Formal BBBEE scorecard” declared that they adhere to the following compliance levels
and indicates a fairly even spread with 40.7% falling between Levels 1 and 4 and 42.3% below Level 5.
Figure 3 – SELF REPORTED LEVEL OF BBBEE COMPLIANCE
9.5%
9.8%
9.5%
11.8%
10.9%
9.3%
9.1%
7.5%
5.5%
17.0%
Level One
Level Two
Level Three
Level Four
Level Five
Level Six
Level Seven
Level Eight
Non-compliant
Not disclosed
On inquiry about the source of the scorecard, 8.4% said it was as a result of their own calculation, 14.4%
said the source was a verification agency and 11.8% was unsure about the source of the scorecard. It is
significant to realise that 63.5% of companies interviewed reported having “No Scorecard” yet.

.
.
.
.
.
.
.
.
.
Page 14
9.3 CALCULATED NATIONAL SCORECARD
Based on information provided by respondents and through the analysis of the published data, the first
ever Baseline scorecard for South African companies was calculated as follows.
TABLE 1 – NATIONAL SCORECARD
SCORECARD ELEMENT WEIGHTING TARGETS SCORE
ELEMENT 1 - OWNERSHIP 20 25% + 1 12.06
ELEMENT 2 - MANAGEMENT CONTROL 10 40% to 50% 3.24
ELEMENT 3 - EMPLOYMENT EQUITY 15 43% to 80% 5.50
ELEMENT 4 - SKILLS DEVELOPMENT 15 3% of payroll 6.57
ELEMENT 5 - PREFERENTIAL PROCUREMENT 20 70% 3.34
ELEMENT 6 - ENTERPRISE DEVELOPMENT 150.375% of
Turnover1.83
ELEMENT 7 - SOCIO-ECONOMIC DEVELOPMENT 50.125% of
Turnover1.35
Total BBBEE Points 100 33.89
As can be seen fro the above the most progress is made with regard to Element 1 – Ownership, where
organisations on a national basis has managed to accrue 60.3% of the weighted target of 25.1% black
ownership (equivalent to 15.13% Black ownership) for this element. This is followed by Element 4 – Skills
Development with a 43.8% accrual of the weighted target (3% of payroll). The element most lagging
behind is Element 6 – Enterprise Development with a 12.2% accrual to the weighted target.
The calculated BBBEE Baseline score for South African Companies in July 2007 thus stands at 33.89
points which is equivalent to a Level 8 Compliance or 10% BBBEE recognition according to the official
BBBEE Scorecard published by the DTI in February 2007.
60.3%
32.4%
36.7%
43.8%
16.7%
12.2%
27.0%
.
.
.
.
.
.
.
.
.
Page 15
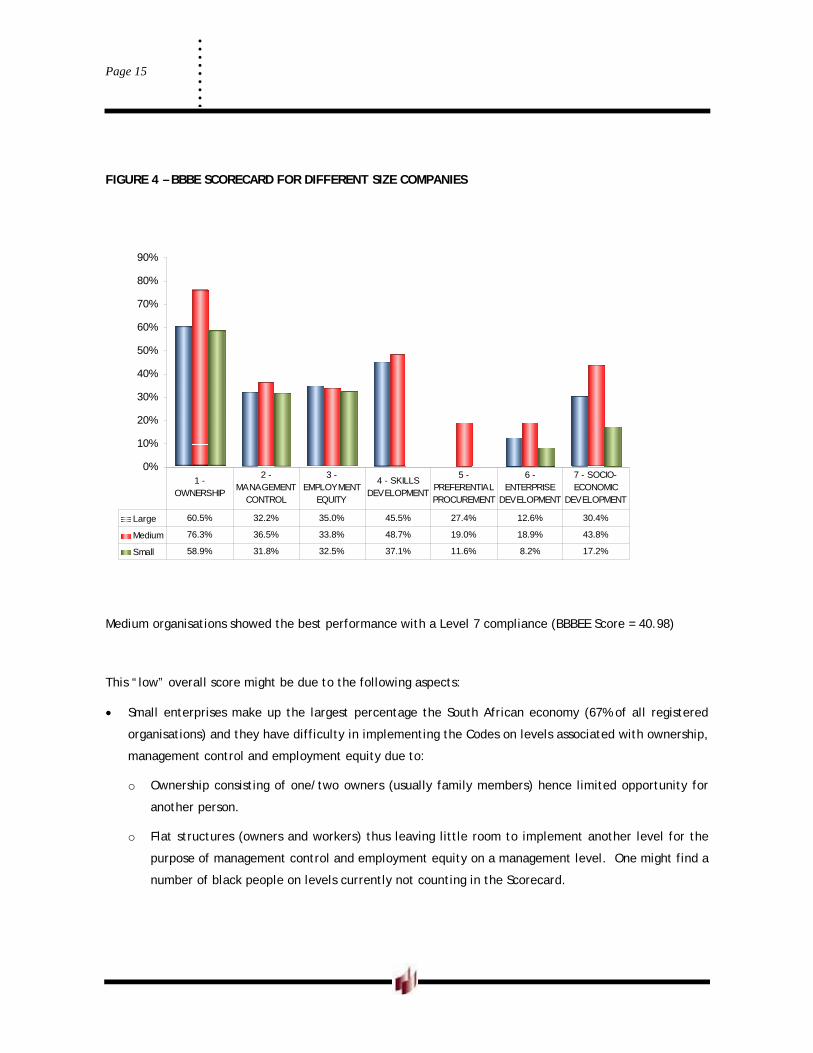
FIGURE 4 – BBBE SCORECARD FOR DIFFERENT SIZE COMPANIES
0%
10%
20%
30%
40%
50%
60%
70%
80%
90%
Large 60.5% 32.2% 35.0% 45.5% 27.4% 12.6% 30.4%
Medium 76.3% 36.5% 33.8% 48.7% 19.0% 18.9% 43.8%
Small 58.9% 31.8% 32.5% 37.1% 11.6% 8.2% 17.2%
1 -
OWNERSHIP
2 -
MANAGEMENT
CONTROL
3 -
EMPLOYMENT
EQUITY
4 - SKILLS
DEVELOPMENT
5 -
PREFERENTIAL
PROCUREMENT
6 -
ENTERPRISE
DEVELOPMENT
7 - SOCIO-
ECONOMIC
DEVELOPMENT
Medium organisations showed the best performance with a Level 7 compliance (BBBEE Score = 40.98)
This “low” overall score might be due to the following aspects:
Small enterprises make up the largest percentage the South African economy (67% of all registered
organisations) and they have difficulty in implementing the Codes on levels associated with ownership,
management control and employment equity due to:
o Ownership consisting of one/two owners (usually family members) hence limited opportunity for
another person.
o Flat structures (owners and workers) thus leaving little room to implement another level for the
purpose of management control and employment equity on a management level. One might find a
number of black people on levels currently not counting in the Scorecard.

.
.
.
.
.
.
.
.
.
Page 16
o No real profit to “spend” on “Socio-economic development” and “Enterprise development” and
furthermore smaller organisations are often located in remote areas where the opportunities for
such initiatives (and Preferential Procurement as well) do not present themselves.
o The one aspect that smaller companies can really focus on is Element 4 – Skills Development and
hence the good score and progress in this field.
o The complexity of the Codes if measured against the general level of education of such business
owners.
9.4 BBBEE PROGRESS
From the calculated scorecards it is possible to categorize responding companies into one of the following
progress classifications:
Percentage of Target
No Compliance 0% compliance
Low Compliance More than 0%, but less than 50% compliance
Moderate Compliance 50% and more, but less than 80% compliance
Good Compliance 80% and more, but less than 100% compliance
Excellent Compliance 100% and more compliance
In the following paragraphs the progress in BBBEE is shown according to the percentage of companies
classified into the progress classifications shown above.
Unpacking the components of the Elements led to the following observations:
9.4.1 Element 1 – Ownership
o Good progress is made in the field of economic interest, but may be hampered by the following
known view about the so-called “small group of black elite”:
.
.
.
.
.
.
.
.
.
Page 17
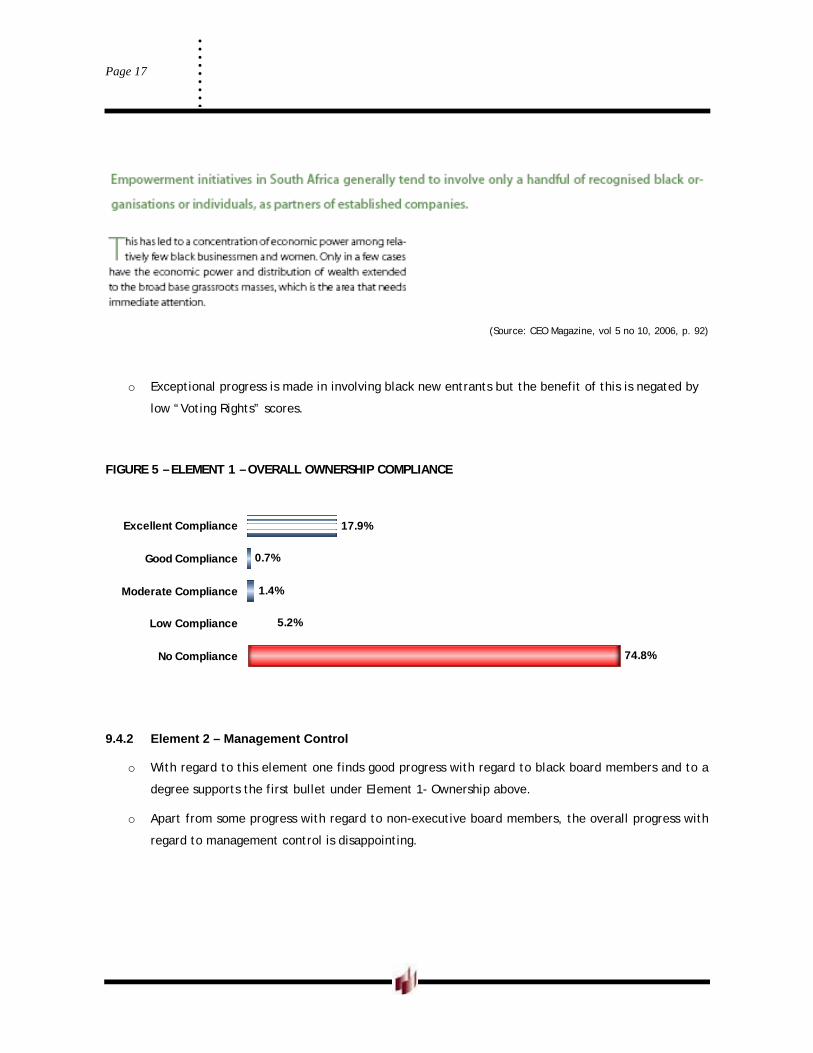
(Source: CEO Magazine, vol 5 no 10, 2006, p. 92)
o Exceptional progress is made in involving black new entrants but the benefit of this is negated by
low “Voting Rights” scores.
FIGURE 5 – ELEMENT 1 – OVERALL OWNERSHIP COMPLIANCE
17.9%
0.7%
1.4%
5.2%
74.8%
Excellent Compliance
Good Compliance
Moderate Compliance
Low Compliance
No Compliance
9.4.2 Element 2 – Management Control
o With regard to this element one finds good progress with regard to black board members and to a
degree supports the first bullet under Element 1- Ownership above.
o Apart from some progress with regard to non-executive board members, the overall progress with
regard to management control is disappointing.

.
.
.
.
.
.
.
.
.
Page 18
FIGURE 6 – ELEMENT 2 – MANAGEMENT CONTROL COMPLIANCE
8.5%
1.0%
3.6%
6.4%
80.5%
Excellent Compliance
Good Compliance
Moderate Compliance
Low Compliance
No Compliance
9.4.3 Element 3 – Employment Equity
o Only 38% of the black management target of 58% (as adjusted and motivated above under Point 3 –
Constraints of the Study) has been reached and is equally disappointing.
o This aspect might coincide with 50.2% of the respondents claiming to have difficulty in finding
suitable employees
FIGURE 7 – ELEMENT 3 – OVERALL EMPLOYMENT EQUITY COMPLIANCE
11.6%
5.0%
4.3%
18.9%
60.3%
Excellent Compliance
Good Compliance
Moderate Compliance
Low Compliance
No Compliance
.
.
.
.
.
.
.
.
.
Page 19
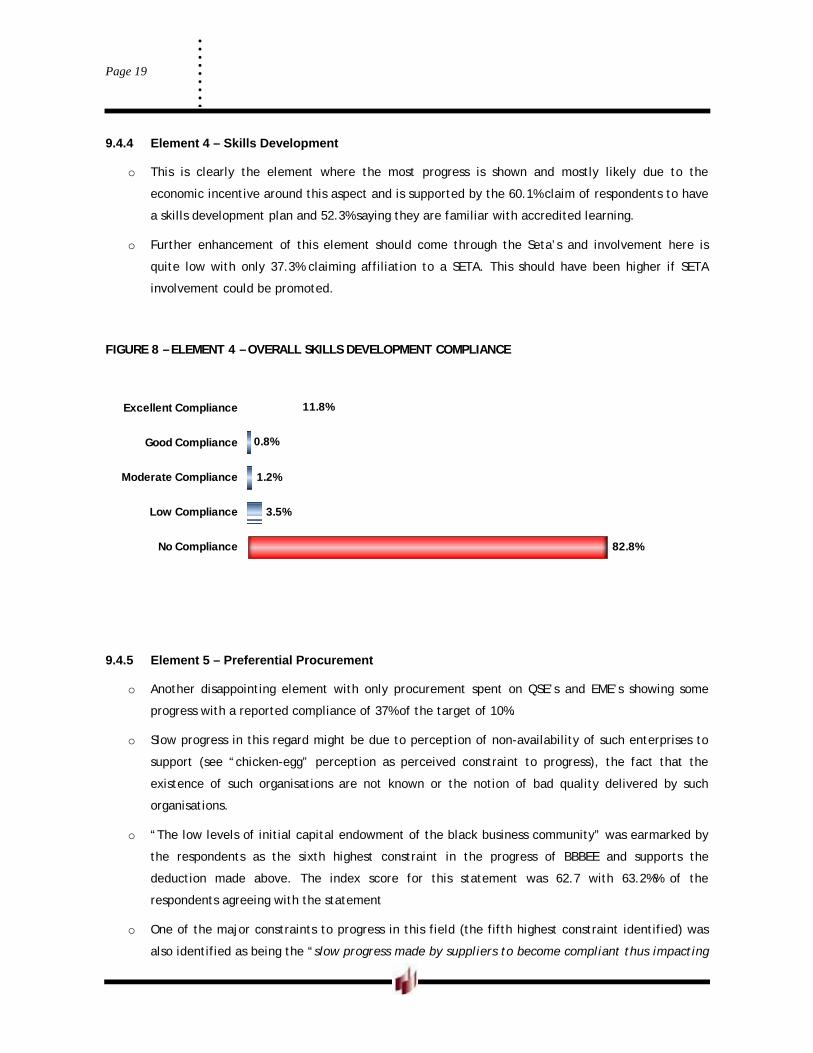
9.4.4 Element 4 – Skills Development
o This is clearly the element where the most progress is shown and mostly likely due to the
economic incentive around this aspect and is supported by the 60.1% claim of respondents to have
a skills development plan and 52.3% saying they are familiar with accredited learning.
o Further enhancement of this element should come through the Seta’s and involvement here is
quite low with only 37.3% claiming affiliation to a SETA. This should have been higher if SETA
involvement could be promoted.
FIGURE 8 – ELEMENT 4 – OVERALL SKILLS DEVELOPMENT COMPLIANCE
11.8%
0.8%
1.2%
3.5%
82.8%
Excellent Compliance
Good Compliance
Moderate Compliance
Low Compliance
No Compliance
9.4.5 Element 5 – Preferential Procurement
o Another disappointing element with only procurement spent on QSE’s and EME’s showing some
progress with a reported compliance of 37% of the target of 10%.
o Slow progress in this regard might be due to perception of non-availability of such enterprises to
support (see “chicken-egg” perception as perceived constraint to progress), the fact that the
existence of such organisations are not known or the notion of bad quality delivered by such
organisations.
o “The low levels of initial capital endowment of the black business community” was earmarked by
the respondents as the sixth highest constraint in the progress of BBBEE and supports the
deduction made above. The index score for this statement was 62.7 with 63.2%% of the
respondents agreeing with the statement
o One of the major constraints to progress in this field (the fifth highest constraint identified) was
also identified as being the “slow progress made by suppliers to become compliant thus impacting

.
.
.
.
.
.
.
.
.
Page 20
on the purchasing organization’s own compliance” (the index score for this aspect was 63.4 with
61.3%% of the respondents agreeing that this was a constraint to the progress of BBBEE). This was
also the statement with which the lowest percentage of respondents disagreed, i.e. 5.8% of the
respondents totally disagreed that this was a constraint and can thus be viewed as an important
factor that requires attention.
FIGURE 9 –ELEMENT 5 – OVERALL PREFERENTIAL PROCUREMENT COMPLIANCE
6.7%
1.5%
2.0%
4.4%
85.4%
Excellent Compliance
Good Compliance
Moderate Compliance
Low Compliance
No Compliance
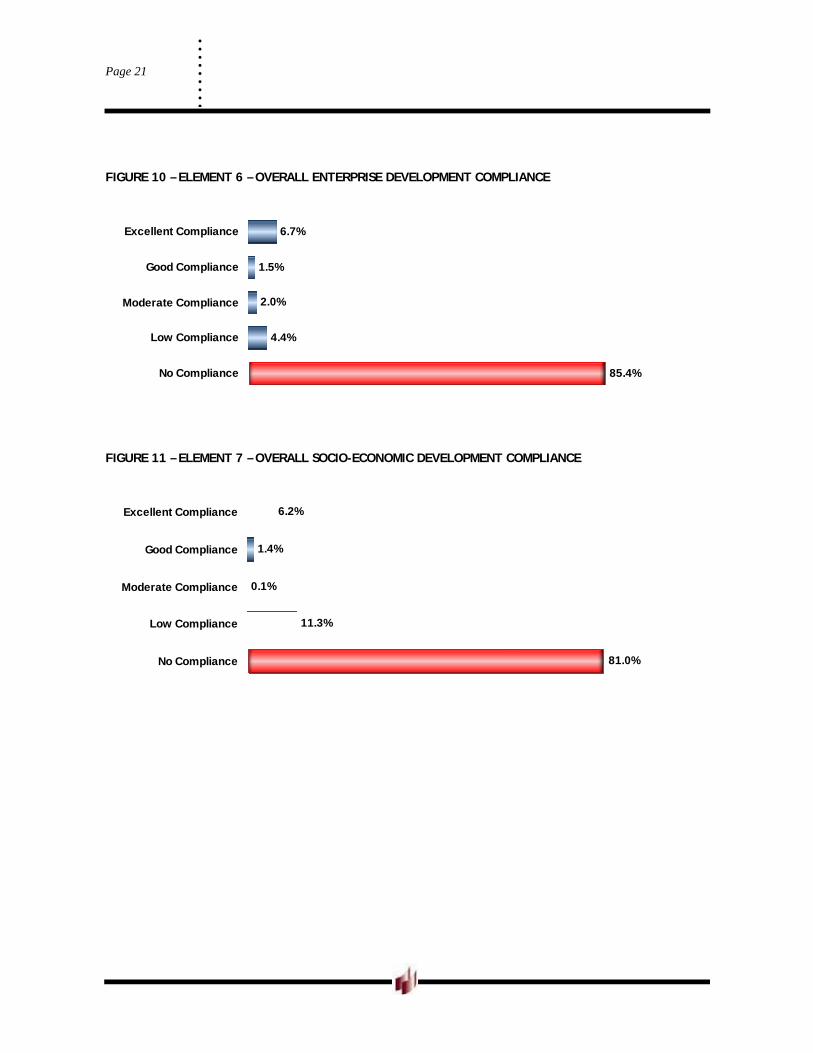
9.4.6 Elements 6 and 7 – Enterprise and Socio-economic Development
o Very low progress reported on both these elements and this might be due to the fact that
organisations are unaware that they do in fact comply with this or support such initiatives.
o The mere fact that Socio-economic development showed a bit more progress than Enterprise
Development supports this deduction – it is easier to do and measure and the opportunities for this
are more abundant.
.
.
.
.
.
.
.
.
.
Page 21
FIGURE 10 – ELEMENT 6 – OVERALL ENTERPRISE DEVELOPMENT COMPLIANCE
6.7%
1.5%
2.0%
4.4%
85.4%
Excellent Compliance
Good Compliance
Moderate Compliance
Low Compliance
No Compliance
FIGURE 11 – ELEMENT 7 – OVERALL SOCIO-ECONOMIC DEVELOPMENT COMPLIANCE
6.2%
1.4%
0.1%
11.3%
81.0%
Excellent Compliance
Good Compliance
Moderate Compliance
Low Compliance
No Compliance