a cross-country assessment of energy- related co2 ... resource and carbon emission decoupling in...
TRANSCRIPT

PROCEEDINGS OF ECOS 2016 - THE 29TH INTERNATIONAL CONFERENCE ON
EFFICIENCY, COST, OPTIMIZATION, SIMULATION AND ENVIRONMENTAL IMPACT OF ENERGY SYSTEMS
JUNE 19-23, 2016, PORTOROŽ, SLOVENIA
A cross-country assessment of energy- related CO2 emissions: A combined decomposition and
decoupling approach
Fátima Limaa, Manuel Lopes Nunes
b Jorge Cunha
c
a Department of Production and Systems, University of Minho, Guimarães, Portugal,
[email protected] b ALGORITMI Research Centre, University of Minho, Guimarães, Portugal, [email protected], c ALGORITMI Research Centre, University of Minho, Guimarães, Portugal, [email protected]
Abstract: Energy can be considered both a resource and carbon intensive sector with the potential to promote adverse effects. One of these is climate change that distresses multiple dimensions of sustainability both on developed and emerging countries. Therefore, efforts to achieve energy sustainability should strive for emission reductions that promote impact decoupling, namely between energy- related CO2 emissions and economic growth. In order to assess the relationship between these two variables at cross-country level, this study has resorted to a twofold complementary approach, based on decomposition and decoupling concepts. In the first approach, Log Mean Divisia Index (LMDI) method has been used to decompose changes in energy- related CO2 emissions into its main driving forces. In the second approach, the role of these drivers regarding decoupling effect has been explored, determining which main drivers have contributed to decoupling and/or recoupling of emissions. The results obtained might help energy policy decision-makers to design future policies, with the aim of furthering impact reduction without hindering economic growth.
Keywords: Decoupling Effect; Decomposition Effect; Energy- related CO2 emissions; Cross-country assessment.
1. Introduction
The progress of human civilization has been closely interlinked to energy production and use (see
[1], [2]). If, on the one hand, energy use has led to social welfare and economic growth, on the other
hand, it has implied resource and environmental depletion (see [3], [4]). Nowadays, the energy
sector accounts for the largest share of greenhouse gas emissions (68%), from which a large
majority (90%) has been attributed to CO2 emissions [5]. Therefore, a reduction of energy- related
carbon emissions has been considered imperative for climate change mitigation [5], [6] and to
ensure future energy sustainability. Within this context, a change in the paradigm where traditional
high resource (energy) consumption implies a high impact (CO2 emissions) has been increasingly
upheld [2], [3]. However, these emerging sustainability concerns require equilibrium between
emission reduction and economic growth. The “Green growth” promotes the convergence between
these two issues, and has been progressively identified as an answer to that challenge [7]. In fact,
the need to promote a transition towards a low carbon economy has been recognised as being in the
best interest to all nations, both developed and emerging [3]. The concept of decoupling has
emerged against this background, associated with the need to redesign energy policy. The
recognition that the opportunity for sustainability relies on the decoupling of economic growth from
environmental impacts [4] has contributed to emphasise studies focusing this issue. Moreover,
several decoupling approaches have been developed and applied to different sectors, and different
levels of aggregation. For instance, through the use of “economy wide decoupling indicators” for
climate change, Organization for Economic Cooperation and Development (OECD) [8] has
determined the (in)existence of decoupling for 20 countries over the period between 1990-1999.

Evidence indicates that relative decoupling is widespread comparatively to absolute decoupling. [9]
found progress in decoupling CO2 emissions from the industry sector in 14 EU countries. However,
[10] found that decoupling between waste emissions and economic growth has been higher for
OECD countries in comparison to non-OECD countries. Moreover, progress towards decoupling of
economic growth from CO2 emissions in Italy, between 1998 and 2006, has not reached absolute
decoupling degree [11]. The results obtained have also emphasised economic growth and energy
intensity as main contributors for CO2 emission increase [11]. Accordingly to [12]–[14], relative
decoupling has characterised most of the decoupling between environmental pressures and
economic growth in China, across different timeframes. Whereas, [15] claims the occurrence of
absolute decoupling between energy- related CO2 emissions and economic growth between 2004
and 2009 in Brazil. [16] refers that well-designed policy could contribute towards greater potential
for resource and carbon emission decoupling in OECD countries, while promoting economic
growth at lower “environmental cost” in emerging countries.
Although most of these studies are indicative of the existence and extent of decoupling, they are not
explicit about the main drivers of the emissions. However, understanding changes in decoupling is
essential to develop policies that promote effective decoupling, which requires the use of the
decomposition approach. In order to assess the relationship between energy- related CO2 emissions
and economic growth at a cross-country level, this study has resorted to a twofold complementary
approach. This approach was based on decomposition and decoupling concepts. It provided relevant
information regarding the drivers that most likely promote or demote decoupling. Moreover, this
study has emphasised the relevance of additional decoupling degrees, not previously featured in
conventional decoupling framework. This allows raising awareness for this issue to energy policy
makers. Decoupling poses a global challenge with country level repercussions [3]. Thus, this study
encompasses a set of developed (United Kingdom and Portugal) and emerging (Brazil and China)
countries, characterised by substantially different socio-economic backgrounds and commitment
efforts towards energy sustainability challenges.
The remainder of the paper is organised as follows. Section 2 describes the methodological
approach undertaken in this study. Section 3 shows the evolution of key indicators related to the
decoupling and decomposition approach used in this study. In Section 4, the main results achieved
regarding the decomposition and decoupling analysis are presented, whereas the discussion of those
results is made on Section 5. Finally, Section 6 draws the main conclusions and presents
suggestions for future work.
2. – Methodological Approach
This study follows a twofold decomposition and decoupling approach proposed by [17] and [3],
with the objective of promoting a cross-country comparison.
2.1 - Decomposition Approach
In order to ascertain the main drivers underlying energy- related CO2 emissions from human
activity, a Log Mean Divisia Index (LMDI) decomposition approach has been applied to an
extended Kaya identity, as exposed in (1):
∑
∑ [( ⁄ ) ( ⁄ ) ( ⁄ ) ( ⁄ ) ( ⁄ ) ] ∑
(1)
Where,
Ctot = CO2 Emissions
Ci= CO2 emissions from fossil fuel type i
E= Total primary energy consumption of all fossil fuels
F1= Ci/FFi, CO2 emission factor, for fossil fuel type i
S1=FFi/FF, share of fossil fuel in total fossil fuels
S2= FF/E, share of fossil fuels in total fuels

I=E/Y, aggregate energy intensity
G=Y/P, GDP PPP per capita or affluence
P= Population
The Kaya Identity is a variant of IPAT equation (which correlates environmental impacts, I, with
three factors: population, P, affluence, A, and technology, T), developed for energy- related carbon
emission assessments [16]. It has been extended in order to account for additional effects that drive
carbon emissions [18]. This extended Kaya identity is able to account for changes in CO2
emissions, which have resulted from increasing contribution of renewable energy sources (RES) in
the energy mix [17]. The LMDI I multiplicative decomposition1 approach enables the assessment of
changes in Ctot while promoting a cross-country comparison [19], as follows (2):
(2)
Where changes in a country’s aggregate carbon emissions, Ctot, result from changes in a
multiplicity of effects (or drivers), namely: emission factor effect (Cemf); fossil fuel substitution
(Cffse); contribution of RES (Cres); energy intensity (Cint); affluence (Cypc) and population
(Cpop) effects. These effects are grouped by typology, as exposed in Table A.
Table A: Main effects featured in decomposition approach (adapted from: [17])
Effect Typology Main description
Ctot Aggregate Total change in CO2 emissions from energy use
Cemf Intensity Changes in carbon content per unit of fossil fuel (coal, oil, gas)
Cint Intensity Changes in energy/GDP PPP or energy intensity
Cffse Structure Fossil fuel substitution (coal, oil, gas) in total fossil fuels
Cres Structure Contribution of RES by displacement of fossil fuels (hydro, wind, biomass,
geothermal)
Cypc Scale Changes in GDP PPP/POP or affluence
Cpop Scale Changes in total population
The effects featured in (2) can be calculated following the LMDI I formulae [20]:
[∑ (
)
] [∑(
) (
)
( ) ( )
(
)]
(3)
[∑ (
)
] [∑(
) (
)
( ) ( )
(
)]
(4)
[∑ (
)
] [∑(
) (
)
( ) ( )
(
)]
(5)
[∑ (
)
] [∑(
) (
)
( ) ( )
(
)]
(6)
[∑ (
)
] [∑(
) (
)
( ) ( )
(
)]
(7)
1 Within Index Decomposition Approach (IDA), LMDI I has been chosen in virtue of its multiple advantages, namely
perfect decomposition, and its ability to cope with zero values, amongst other properties (see[28], [29]).

[∑ (
)
] [∑(
) (
)
( ) ( )
(
)]
(8)
Where wi is representative of the weight function for each effect in Ctot, between pre-established
time series (t), which, in the case of this study, was from 1990 to 2013.
2.2– Decoupling Approach
The concept of decoupling was firstly introduced by the Organization for Economic Cooperation
and Development (OECD) [6]. It occurs when there is a greater increase in the growth rate of a
driving force (e.g. GDP) comparatively to an environmental pressure (e.g. CO2 emissions). This
concept has also been differentiated between absolute and relative decoupling. While the former
implies that the environmental pressure and driving forces evolve in opposing directions, the latter
implies growth rates that evolve in the same direction though at different paces. The extent of
decoupling has been redefined by [14]. This study identified a total of eight decoupling degrees to
explore decoupling of transport sector between Finland and EU. More recently, [4] proposed a
Decoupling Index, identifying six different decoupling states.
In order to analyse the decoupling between energy- related carbon emissions and economic growth
at a cross-country level, a Decoupling Index has been calculated [3]. This indicator corresponds to
the ratio between relative changes in an environmental pressure, EP (with EP represented by
energy- related CO2 emissions for the current study) and the relative changes in a driving force, DF
(with DF represented by gross domestic product, GDP, for the current study), enabling to assess the
extent of decoupling, as shown in (9):
( ) ( )
(9)
According to this index, the following classification of decoupling can be identified [3], [21]:
When DI ˃ 1, no decoupling (ND) status is defined,
When DI = 1, the border between no decoupling (ND) and relative decoupling (RD) status is
defined,
When 0 < DI < 1, relative decoupling (RD) status is defined,
When DI = 0, the border between relative and absolute decoupling (AD) is defined,
When DI < 0, absolute decoupling (AD) status is defined.
These decoupling classifications are designated in this study as Conventional degrees of decoupling
for growing economies (Δ% DF>0), as can be seen in Figure 1. The final DI value has been
determined by the interaction between two variables (Δ%EP ↔ Δ%DF).
Fig. 1. Conventional and Additional Decoupling Index (DI) degrees (Own elaboration from [3]).
For instance, ND (i.e. DI >1) implies a positive variation rate of both variables, i.e. changes in EP
are proportionally higher than changes in DF (Δ% EP > Δ% DF). In this case, economic growth has

led to substantial emissions growth. The transition between ND and RD (i.e. DI=1) implies positive
and equal changes in both variables’ growth rates (Δ% EP = Δ% DF). Despite the positive growth
rates, RD (i.e. 0< DI <1) implies that changes in EP are proportionally lower than changes in DF
(Δ%EP < Δ%DF). In this case, economic growth outgrows emission growth. The borderline
between RD and AD (i.e. DI=0) still implies a positive growth rate for economic growth, though
associated with a constant EP (EP cte). In this case, economic growth has not led to emissions
growth, since these remain the same. Finally, AD (i.e. DI <0) implies opposing variation rates for
both variables, with a positive change for DF and a negative change for EP. In this case,
comparatively to previous year, economic growth increases while EP decreases (EPt < EPt-1).
Besides the abovementioned classification of decoupling as conventional degrees, this study
introduces two additional decoupling degrees that take into account other socioeconomic scenarios
(namely, Δ% DF<0).
When DI >1, apparent no decoupling (AND) is defined,
When DI <0, apparent absolute decoupling (AAD) is defined.
The value of DI continues to be determined by the relationship between EP and DF variables.
Therefore, AND (i.e. DI >1) implies a negative variation rate of both variables, i.e. in absolute
value, changes in EP are proportionally higher than changes in DF (|Δ% EP| > |Δ% DF|). In this
case, decline in economic growth is complemented by substantial emission decline. On the other
hand, AAD (DI <0) implies opposing variation rates for both variables, with a negative change for
DF and a positive change for EP. In this case, decline in economic growth is complemented by an
increase in EP (Δ% EP > |Δ% DF|). Thus, a more detailed understanding is required, given the
addition of these two decoupling degrees that have not been featured by the conventional DI
framework. The data for decomposition and decoupling approach has been collected from a single
international database - International Energy Agency (IEA). Resorting to these dataset enables
cross-country comparability overcoming potential existing data gaps.
3. Key indicators trends for decoupling and decomposition approach
A brief overview of the main key indicators trends related to the analysis of decoupling and
decomposition approach (e.g. primary energy, PE; energy- related CO2 emissions; gross domestic
product in purchasing power parities, GDP PPP; and population, POP), for a period between 1990
and 2013, and for the four countries analysed in this study, is presented in this section.
As illustrated in Panel a) of Figure (1), Brazil has seen an increasing trend for all indicators, except
in 2002-2003 and 2009-2010 (a more accentuated decrease due to the economic recession).
Therefore, comparatively to the base year (1990=100), the 2013’s values presented the following
increases: PE has increased by 90%, energy- related CO2 emissions by 146%, GDP PPP by 95%
and population by almost 20%.
Panel a) Brazil Panel b) China
Fig.1. Key Indicator trends for Brazil and China (Own elaboration from [5]).

On the other hand, although China has also seen an increasing trend for all indicators, it is clear that
a substantial increase in GDP PPP has overcome the increase in remaining indicators (Panel b,
Figure 1). Therefore, comparatively to base year (1990=100), 2013 presented the following
increases: GDP by 826% followed by energy- related CO2 emissions 309%, PE 246%, and
population by 19%.
Contrasting with emerging countries, Portugal (Panel a, Figure 2) has seen an ascending trend for
all indicators (with the exception of population) until 2005, followed by a descending trend in PE
and energy- related CO2 emissions, and also a decrease in GDP since 2009. In spite of this, the
values for GDP PPP, PE and energy- related CO2 emissions are still above 1990 threshold by 33%,
30%, and 16%, respectively.
Panel a) Portugal Panel b) United Kingdom
Fig.2. Key Indicator trends for Portugal and United Kingdom (Own elaboration from [5]).
Conversely, United Kingdom’s GDP PPP increasing trend clearly contrasts with the remaining
indicators. GDP trend is along with population the only ones above 1990 threshold, almost 60% and
12%, respectively. PE and energy-related CO2 emissions, for their turn, registered a decrease of 7%
and 19%, respectively, below 1990 threshold (Panel b, Figure 2).
4. Results The results obtained from twofold decomposition and decoupling approach are presented separately
in the following two subsections, for the 1990-2013 time interval.
4.1. Results from Decomposition Approach
Following the classification criteria developed by [22], the results obtained for each decomposition
factor should be interpreted as follows: values above 1 mean that the explanatory factor has
contributed to an increase of energy- related CO2 emissions; values equal to 1 imply no change in
emissions; and values below 1 mean that the explanatory factor has contributed towards emission
decrease. Overall results have shown predominance of changes in overall carbon emissions (Ctot)
mostly above 1, throughout the entire time series for Brazil and China. Meanwhile, variations in
Ctot for Portugal clearly present two main stages, the first mostly above 1 and the second mostly
below 1. These results contrast with changes in Ctot for UK, mostly below 1. Associated with these
changes, the results obtained have also shown relevance of scale and intensity effects, as the main
drivers, and to a less extent structural effects. In spite of these common features, a more detailed
country level analysis is provided in the following subsections.
4.1.1. Country level Decomposition results for Emerging Countries
As previously seen by country profile, Brazil presents an increasing CO2 emission trend. This
overall trend has been corroborated by decomposition results. As illustrated in Figure 3, the red line
(corresponding to total carbon emission (Ctot) is mostly located above 1, which denotes the
prevalence of effects contributing to increase energy- related carbon emissions.
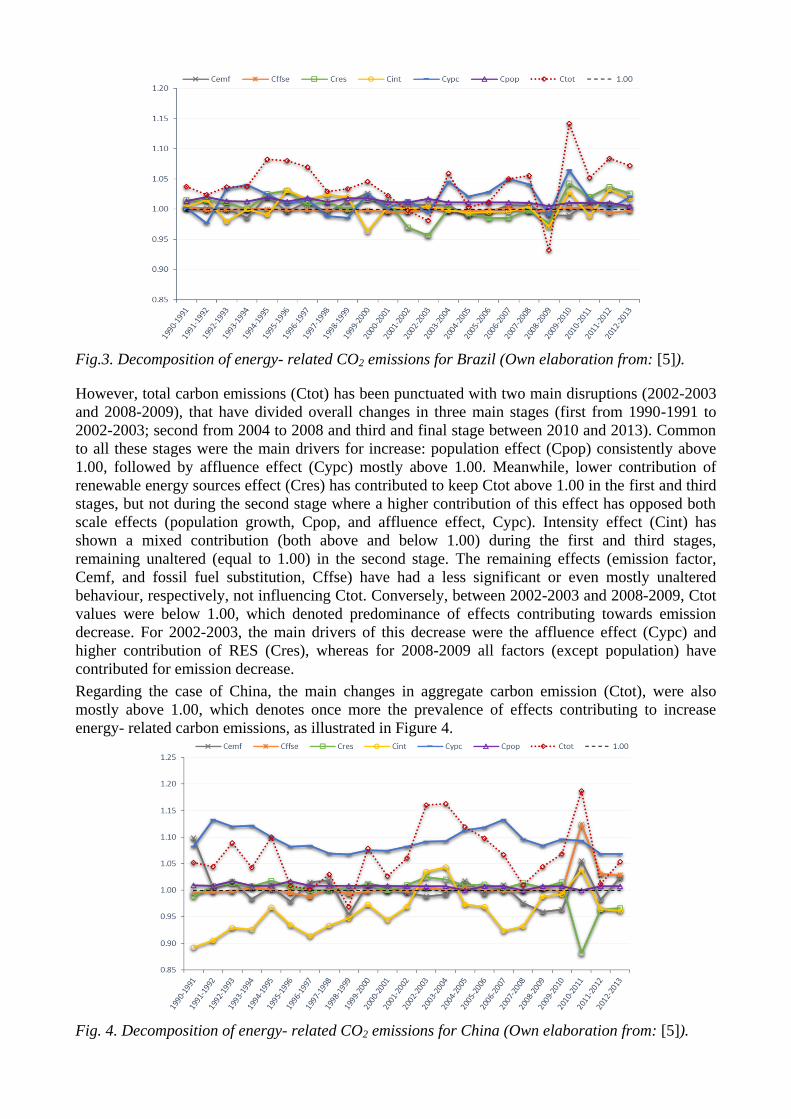
Fig.3. Decomposition of energy- related CO2 emissions for Brazil (Own elaboration from: [5]).
However, total carbon emissions (Ctot) has been punctuated with two main disruptions (2002-2003
and 2008-2009), that have divided overall changes in three main stages (first from 1990-1991 to
2002-2003; second from 2004 to 2008 and third and final stage between 2010 and 2013). Common
to all these stages were the main drivers for increase: population effect (Cpop) consistently above
1.00, followed by affluence effect (Cypc) mostly above 1.00. Meanwhile, lower contribution of
renewable energy sources effect (Cres) has contributed to keep Ctot above 1.00 in the first and third
stages, but not during the second stage where a higher contribution of this effect has opposed both
scale effects (population growth, Cpop, and affluence effect, Cypc). Intensity effect (Cint) has
shown a mixed contribution (both above and below 1.00) during the first and third stages,
remaining unaltered (equal to 1.00) in the second stage. The remaining effects (emission factor,
Cemf, and fossil fuel substitution, Cffse) have had a less significant or even mostly unaltered
behaviour, respectively, not influencing Ctot. Conversely, between 2002-2003 and 2008-2009, Ctot
values were below 1.00, which denoted predominance of effects contributing towards emission
decrease. For 2002-2003, the main drivers of this decrease were the affluence effect (Cypc) and
higher contribution of RES (Cres), whereas for 2008-2009 all factors (except population) have
contributed for emission decrease.
Regarding the case of China, the main changes in aggregate carbon emission (Ctot), were also
mostly above 1.00, which denotes once more the prevalence of effects contributing to increase
energy- related carbon emissions, as illustrated in Figure 4.
Fig. 4. Decomposition of energy- related CO2 emissions for China (Own elaboration from: [5]).

Although three different stages can also be identified in Ctot (from 1990-1991 to 1998-1999; from
1999-2000 to 2007-2008 and finally from 2008-2009 to 2013), the main drivers for increase or
decrease energy- related CO2 emissions throughout the entire time series are quite clear. Changes
were mostly driven by the affluence (Cypc), and population (Cpop) effects regarding emissions
increase and by the energy intensity (Cint) effect regarding emissions decrease. The remaining
effects seem to play a less significant role. Nonetheless, lower RES contribution (Cres) has
contributed to keep Ctot above 1.00 throughout the first and second stages (with particular emphasis
for 2003-2004 period), but not during the third stage where a higher contribution of this effect has
opposed to the remaining effects. Fossil fuel substitution effect (Cffse) has mostly kept unaltered
throughout most of the time series, with exception of the third stage contributing to increase
emissions. The emission factor (Cemf) effect has shown a mixed contribution with values below
1.00 during the first two stages, and shifting to values above 1.0 during the third stage. Overall, the
contribution of several effects (intensity, Cint, emission factor, Cemf, and fossil fuel substitution,
Cffse) have contributed to offset the main emission growth drivers (affluence, Cypc, and
population, Cpop) for this period.
4.1.2. Country level Decomposition results for Developed Countries
As seen in Panel a) of Figure 2, overall carbon emission for Portugal presented an increasing
followed by a decreasing trend, which means that changes in aggregate carbon emission (Ctot) are
mostly above 1.00 until 2005 and below 1.00 afterwards, as illustrated in Figure 5.
Fig. 5. Decomposition of energy- related CO2 emissions for Portugal (Own elaboration from: [5]).
This outcome denotes a transition from prevalence of effects contributing to increase energy-
related carbon emissions towards effects contributing to its decrease. In fact, from the main drivers
of emissions increase (affluence, Cypc, intensity, Cint, and contribution of RES, Cres) until 2005,
only affluence effect (Cypc) has kept mostly above 1.00 afterwards. For instance, from 2005
onwards higher contribution of renewables (Cres) has consistently contributed to offset the main
growth emission drivers. A similar tendency has been identified for intensity effect (Cint), with the
exception of two years. Meanwhile, population (Cpop) has kept mostly unchanged during the entire
period of analysis. The remaining effects (emission factor, Cemf, and fossil fuel substitution, Cffse)
revealed a mixed contribution, with values both above and below 1.00. During the last period of the
analysis, both these effects in combination with Cint have contributed to offset other effects, though
Ctot remained below 1.00.
Contrasting with the other countries analysed, the main changes in aggregate carbon emission (Ctot)
for United Kingdom, were mostly below 1.00 for the entire period, which denotes the prevalence of

effects contributing towards energy- related carbon emissions decrease, as illustrated in Figure 6,
and in keeping with previously determined CO2 emission trends.
Fig. 6. Decomposition of energy- related CO2 emissions for United Kingdom (Own elaboration
from: [5]).
Similarly to China, though changes in carbon emissions (Ctot) can be divided into two main stages,
drivers for increase and decrease are easily identifiable. Between 1991-1992 and 2007-2008,
changes were mostly driven by the affluence (Cypc) and population (Cpop) effects regarding
emission increase and energy intensity (Cint) effect regarding emission decrease. The remaining
effects seem to play a less significant role. Yet, within this period contribution of renewables (Cres)
has transitioned from below 1.00 (1990-1991 to 1998-1999) to an almost unchanged contribution
(Cres equal to 1.00). A similar behaviour has been identified for fossil fuel substitution (Cffse)
effect. Meanwhile, the emission factor (Cemf) effect has kept mostly unchanged. Furthermore, this
period has been punctuated with two points below 1.00, driven by intensity effect (Cint) with the
increasing contribution of renewable energy sources (Cres). This period culminated in 2008-2009
with all effects below 1.00, except population growth, Cpop. During the last stage, from 2010
onwards, affluence (Cypc) in combination with other effects (Cffse and Cint) have contributed to
keep carbon emissions, Ctot, above 1.00, being offset by Cres.
4.2. Results from Decoupling Index Approach
In this section the results obtained from the decoupling index (DI) approach, for a period comprised
between 1990 and 2013, are presented. The interpretation of results is made according to the
classification of decoupling degrees presented in Figure 1. Overall results have ranged from
predominance of no decoupling status (DI ˃1) for Brazil and relative decoupling (0 < DI < 1) for
China. Meanwhile DI trend for Portugal clearly presented two main stages, the first implying no
decoupling status (DI ˃1) and the second implying presence of decoupling (DI < 1). These results
contrast with changes in DI for UK, mostly below 0 (DI < 0), suggesting absolute decoupling. In
spite of these predominant features, disparities at country level, such as cases of apparent
(de)coupling require a more in-depth analysis.
4.2.1. Country level decoupling index results for Emerging Countries
Decoupling Index degrees for Brazil ranged from conventional to additional degrees (Figure 7). The
Decoupling Index (DI) value was mostly above 1.00, which denotes predominance of no
decoupling (ND) status, corresponding to the DI degree 1 of conventional decoupling degrees of
Figure 2. This meant that, for most of the period under analysis, the rate of growth of carbon
emissions (Δ%C) was higher than the rate of growth of the economy (Δ%Y), as seen in Figure 7.

Fig. 7. Decoupling Index for Brazil (Own elaboration from: [5]).
DI degree 1 of conventional decoupling has been identified in three different periods: from 1990 to
1991; from 1995 to 2000 and from 2008 till 2013. The highest value of DI was reached in 1997-
1998. Regardless of being the main trend, DI degree 1 is punctuated with additional decoupling
degrees or apparent decoupling status, not featured in the conventional DI framework. For instance,
Brazil moved from DI degree 1 within conventional degrees in 1990-1991 towards a DI degree 2
within additional decoupling degrees, in 1991-1992. In other words, despite the same sign for the
DI indicator (DI <0), changes in energy- related CO2 emissions and economic growth rates were not
being consistent with absolute decoupling (AD) status from conventional DI degrees. Conversely,
absolute decoupling (DI degree 5) was registered during 2001-2003 period. Lowest DI value (DI = -
5.09) for the entire time series was reached in 1991-1992. Relative decoupling (RD) has been
identified between 1992 and 1994 and also between 2004 and 2007 (DI degree 3).
As illustrated in Figure 8, decoupling index (DI) for China mostly denoted the existence of relative
decoupling (RD), corresponding to DI degree 3 in the conventional DI degrees classification. In
fact, this effect prevailed throughout the entire time series, with the exception of five years. For
1999-2000 absolute decoupling was reached (DI degree 5), whereas between 2002-2005 and 2011-
2012 DI degree 1 from conventional DI framework prevailed.
Fig. 8. Decoupling Index for China (Own elaboration from: [5]).

4.2.2. Country level decoupling index results for Developed Countries
Decoupling Index for Portugal has shown two main trends (Figure 9): the first one, between 1991
and 2005, with most values for DI above 1.00 implying no decoupling; and the second one, between
2005 and 2013, with most values for DI bellow 1.00 implying evidence of decoupling. Therefore
Portugal seems to have gradually moved from a no decoupling towards a decoupling status.
However, both of these phases have been punctuated with disruptions from additional decoupling
degrees classification of Figure 2. In the first phase, where DI degree 1 from conventional DI
classification prevailed, a total of four disruptions have been identified. Two correspond to shifts
towards absolute decoupling (1995-1996 and 1999-2000) meaning that DI degree 5 was observed.
The other two disruptions (1992-1993 and 2002-2003) correspond to DI degree 1 from additional
DI classification, where apparent no decoupling (AND) is observed, as illustrated in Figure 9. In the
second phase (2005-2013) two disruptions have also been identified in 2008-2009 and 2010-2012,
identified as DI degree 2 and DI degree 1, respectively.
Fig. 9. Decoupling Index for Portugal (Own elaboration from: [5]).
As illustrated in Figure 10, decoupling index (DI) for United Kingdom has moved from a
predominantly decoupling status (1990-2007), with DI < 1, towards a period where decoupling
index has fluctuated between diverging decoupling statuses (2007-2013). In spite of this, there is a
predominance of absolute decoupling (DI degree 5), followed by relative decoupling (DI degree 3),
and few disruptions above 1.00 threshold (DI degree 1 from conventional DI framework). The first
stage (1990-2007), mostly decoupling status, has seen four main disruptions. The first one, between
1990 and 1991, has been considered apparent absolute decoupling (AAD), classified as DI degree 2
from additional DI classification. Between 1995 and 1996, has resulted in no decoupling status,
corresponding to DI degree 1 from conventional DI classification. The last two disruptions (1996-
1997 and 2001-2002) correspond to absolute decoupling (DI degree 5). In the second stage, UK saw
a sharp increase in the decoupling index values that culminated in 2008-2009 with an apparent no
decoupling (AND), corresponding to DI degree 1 from additional decoupling classification.

Fig. 10. Decoupling Index for United Kingdom (Own elaboration from: [5]).
In general, decomposition results though country-specific, have enabled to identify main common
drivers for changes on energy- related CO2 emissions. The key role played by intensity (Cint) and
affluence (Cypc) effects seem to have been emphasised in each country level assessment, regardless
of developmental stage. Meanwhile next in importance is the contribution of renewable energy
sources (Cres). The combination of these effects with others considered less significant has
contributed to bring about changes in carbon emissions. Similarly, in spite of being country-specific
results, decoupling index (DI) trend has also reflected total carbon emissions (Ctot) behaviour.
However, despite high complementarity between decomposition and decoupling trends, additional
decoupling degrees identified and their interconnections require a more in-depth evaluation,
provided in the next section.
5. Discussion of results
The results obtained in the previous section have shown a high complementarity between
decomposition of energy- related CO2 emissions and decoupling index. This might be indicative of
interconnectivity between different decoupling degrees and main drivers for carbon emission
increase and/or decrease. Though sharing main common drivers for increase (population, Cpop, and
affluence, Cypc, effects), the analysed countries presented different decoupling degrees. In UK and
China is evident the dominance of decoupling (though in different degrees) in contrast with Brazil
and to a less extent Portugal. During the absolute and relative decoupling periods (DI degree 5 and
DI degree 3, respectively), a closer look at the decomposition results for UK and China showed a
clear contribution from intensity (Cint) effect opposing both scale effects (Cpop and Cypc). This
might imply that changes of intensity effect can contribute to promote simultaneous emission
reduction and decoupling between energy- related CO2 emissions and economic growth. These
results corroborate previous studies [12], [23] results, that have emphasised the relevance of
intensity effect to curb increasing carbon emissions in productive sectors of both countries.
Meanwhile, improvements of decoupling degrees in Brazil and Portugal have implied, according to
decomposition results, a greater contribution of renewable energy sources (Cres) effect. The
relevance of the contribution of a cleaner energy mix, based on increasing contribution of RES for
emission reduction, has been previously acknowledged for both countries [15], [24]. A
complementary view of the results obtained has emphasised the possible relevance of these two
effects to successfully manage decoupling effect of the energy sector. In fact, the contribution of
one or both of these effects as driving factors for emission reduction as resulted in the only absolute
decoupling degree (DI degree 5) in China (in 1998-1999, DI=-0.40) and Brazil (in 2002-2003, DI=-
1.68) and the lowest absolute decoupling degrees in United Kingdom (in 2010-2011, DI=-5.05) and
Portugal (in 2009-2010, DI=-5.66). Furthermore, the need to conciliate renewable energy use and

efficiency improvements paths, to ensure emission reduction while promoting socio-economic
development, has been recognised by [25]. The decoupling results combined with the
decomposition analysis have provided critical insights about what effects are likely to promote
absolute decoupling and, as so, should be focused in future policy design. Additionally, it has most
importantly contributed not only to identify, but also provide a better understanding of additional
decoupling degrees, through the behaviour of its main drivers. Moreover, additional decoupling
degrees, DI degree 1 and DI degree 2, in the analysed countries, with the exception of China, have
been identified and associated with economic deceleration or recession episodes, such as 2000-2003
and 2008-2009. It is relevant to refer that this has not been captured by the traditional application of
the decoupling index and could mislead energy policy decision makers. Thus, by considering other
socioeconomic scenarios, other than economic growth, this study has contributed to promote a
better understanding of the decoupling index concept. Furthermore, it is also important to refer that
despite denoting great influence of economic context, the decomposition results also imply
emission reductions from the contribution of other effects and not exclusively from economic
recession, requiring country efforts towards emission reduction.
Hence, although countries are becoming increasingly aware of the need to promote the decoupling
in order to promote sustainability of the energy sector and prevent climate change impacts (see [3],
[26]), the development of future policies requires a combined approach of different methodologies,
such as the decoupling index and the decomposition analysis. This perspective is in keeping with
[10] that has emphasised the different but complementary role of decoupling concept and changing
growth rates. The former aims to show, through interconnection between variables, whether the link
between economic growth and environmental impact is broken, whereas the latter is useful to
“assess environmental performance” [10]. Yet, knowledge regarding determinants of emissions is
required to design policies that promote dissociation between economic growth and CO2 emissions,
as behavioural changes are required [27].
6. Conclusions
In order to assess the relationship between energy- related CO2 emissions and economic growth at a
cross-country level, this study has resorted to a twofold complementary approach, based on
decomposition and decoupling concepts. In the first stage, the Log Mean Divisia Index (LMDI)
method has been used to decompose changes in energy- related CO2 emissions, into its main driving
forces. In the later stage, the role of these drivers regarding decoupling effect has been explored.
High complementarity between decomposition and decoupling results has provided critical inputs to
which factors have the potential to promote absolute decoupling, with special emphasis on
improving energy intensity of the economy and increased use of RES. This complementarity has
also emphasised the existence of common drivers for changes in all countries. This aspect should
not be disregarded and is indicative that further attention and efforts should be developed to shift
the contribution of these drivers. Furthermore, the use of this combined approach has contributed
not only to identify, but also to provide a better understanding of additional decoupling degrees, that
could have otherwise misled energy policy decision makers. There is still a long way to go to ensure
decoupling of the energy sector. This study analysis is at an aggregate level and, therefore, merely
indicative of which areas should be focused at policy level. A more disaggregate approach is needed
to develop policy design that combines decomposition and decoupling approaches, contributing to
ensure future energy sustainability.
Acknowledgments Authors wish to acknowledge the support of ALGORITMI, a Research Centre at the University of
Minho. This work has been supported by COMPETE: POCI-01-0145-FEDER-007043 and FCT –
Fundação para a Ciência e Tecnologia within the Project Scope: UID/CEC/00319/2013. Authors are
also grateful to support from Marie Curie International Research Staff Exchange Scheme
Fellowship within the 7th
European Union Framework Programme, under the project NETEP-
European Brazilian Network on Energy Planning (PIRSES-GA-2013-612263).

References
[1] I. Ozturk, “A literature survey on energy-growth nexus,” Energy Policy, vol. 38, no. 1, pp.
340–349, 2010.
[2] I. Ozturk, A. Aslan, and H. Kalyoncu, “Energy consumption and economic growth
relationship: Evidence from panel data for low and middle income countries,” Energy Policy,
vol. 38, no. 8, pp. 4422–4428, 2010.
[3] W. Crane, F. Krausmann, N. Eisenmenger, S. Giljum, P. Hennicke, R. Kemp, P. R. Lankao,
B. S. Manalang, and S. Sewerin, D ecoupling N atural R esource U se and E nvironmental I
mpacts from E conomic G rowth. 2011.
[4] C. Hudson, M. H. Smith, M. Amelia, E. Rodrigues, C. Anna, B. Siriban, K. Urama, S. Suh,
M. Swilling, J. Salem, and K. Halada, “Decoupling 2: technologies, opportunities and policy
options,” 2014.
[5] International Energy Agency (IEA), “IEA CO2 Emissions from Fuel Combustion,
OECD/IEA, Paris, 2015.,” 2015. [Online]. Available:
http://wds.iea.org/wds/pdf/Worldco2_Documentation.pdf.
[6] W. Wang, Y. Kuang, N. Huang, and D. Zhao, “Empirical Research on Decoupling
Relationship between Energy-Related Carbon Emission and Economic Growth in
Guangdong Province Based on Extended Kaya Identity,” Sci. world J., vol. 2014, no. 1,
2014.
[7] G. E. Halkos, D. I. Stern, and N. G. Tzeremes, “Population, economic growth and regional
environmental inefficiency: evidence from U.S. states,” J. Clean. Prod., vol. 112, pp. 4288–
4295, 2015.
[8] OECD, “Indicators to measure decoupling of environmental pressure from economic
growth,” 2002.
[9] D. Diakoulaki and M. Mandaraka, “Decomposition analysis for assessing the progress in
decoupling industrial growth from CO 2 emissions in the EU manufacturing sector,” vol. 29,
pp. 636–664, 2007.
[10] H. Wang, S. Hashimoto, Q. Yue, Y. Moriguchi, and Z. Lu, “Decoupling Analysis of Four
Selected,” vol. 17, no. 4, 2013.
[11] V. Andreoni and S. Galmarini, “Decoupling economic growth from carbon dioxide
emissions : A decomposition analysis of Italian energy consumption,” EGY, vol. 44, no. 1,
pp. 682–691, 2012.
[12] Y.-J. Zhang and Y.-B. Da, “The decomposition of energy-related carbon emission and its
decoupling with economic growth in China,” Renew. Sustain. Energy Rev., vol. 41, pp.
1255–1266, 2015.
[13] Y. Yu, D. Chen, B. Zhu, and S. Hu, “Eco-efficiency trends in China, 1978-2010: Decoupling
environmental pressure from economic growth,” Ecol. Indic., vol. 24, pp. 177–184, 2013.
[14] W. Wang, R. Liu, M. Zhang, and H. Li, “Decomposing the decoupling of energy-related
CO2 emissions and economic growth in Jiangsu Province,” Energy Sustain. Dev., vol. 17,
no. 1, pp. 62–71, 2013.
[15] L. C. Freitas and S. Kaneko, “Decomposing the decoupling of CO2 emissions and economic
growth in Brazil,” Ecol. Econ., vol. 70, no. 8, pp. 1459–1469, 2011.
[16] H. Schandl, S. Hat, T. Wiedmann, A. Geschke, Y. Cai, J. West, D. Newth, T. Baynes, M.
Lenzen, and A. Owen, “Decoupling global environmental pressure and economic growth :
scenarios for energy use , materials use and carbon emissions,” J. Clean. Prod., pp. 1–12,
2015.
[17] T. O. Mahony, “Decomposition of Ireland ’ s carbon emissions from 1990 to 2010 : An
extended Kaya identity,” Energy Policy, vol. 59, pp. 573–581, 2013.
[18] C. Ma and D. I. Stern, “Biomass and China ’ s carbon emissions : A missing piece of carbon
decomposition,” vol. 36, pp. 2517–2526, 2008.
[19] X. Y. Xu and B. W. Ang, “Index decomposition analysis applied to CO 2 emission studies,”

vol. 93, pp. 313–329, 2013.
[20] B. W. Ang and F. L. Liu, “A New Energy Decomposition Method: Perfect in Decomposition
and Consistant in Aggregation,” Energy, vol. 26, pp. 537–548, 2001.
[21] K. Bithas and P. Kalimeris, “Re-estimating the decoupling effect : Is there an actual
transition towards a less energy-intensive economy ?,” Energy, vol. 51, pp. 78–84, 2013.
[22] S. T. Henriques and A. Kander, “The modest environmental relief resulting from the
transition to a service economy,” Ecol. Econ., vol. 70, no. 2, pp. 271–282, 2010.
[23] G. P. Hammond and J. B. Norman, “Decomposition analysis of energy-related carbon
emissions from UK manufacturing,” Energy, vol. 41, no. 1, pp. 220–227, 2012.
[24] A. M. Dias, A. Teixeira, F. Azevedo, L. Gonçalves, M. D. Guerra, R. R. (coordenação), S. R.
(coordenação), and A. A. (diretor), “Relatório do Estado do Ambiente 2013,” 2013.
[25] C. Yao, K. Feng, and K. Hubacek, “Ecological Informatics Driving forces of CO 2 emissions
in the G20 countries : An index decomposition analysis from 1971 to 2010,” Ecol. Inform.,
vol. 26, pp. 93–100, 2015.
[26] C. Hudson, M. H. Smith, M. Amelia, E. Rodrigues, C. Anna, B. Siriban, K. Urama, S. Suh,
M. Swilling, J. Salem, and K. Halada, “Decoupling 2- Technologies, Opportunities and
Policy Options,” 2014.
[27] M. C. Grand, “Carbon emission targets and decoupling indicators,” Ecol. Indic., vol. 67, pp.
649–656, 2016.
[28] B. . Ang, “Decomposition analysis for policymaking in energy:,” Energy Policy, vol. 32, no.
9, pp. 1131–1139, Jun. 2004.
[29] B. W. Ang, “The LMDI approach to decomposition analysis: A practical guide,” Energy
Policy, vol. 33, no. 7, pp. 867–871, 2005.